Embed Size (px)
Citation preview
Stress Testing Webinar Series: Learnings from CCAR / DFAST 2015 and Beyond April 28, 2015
Presented by Moody’s Analytics as a part of a recorded webinar
2
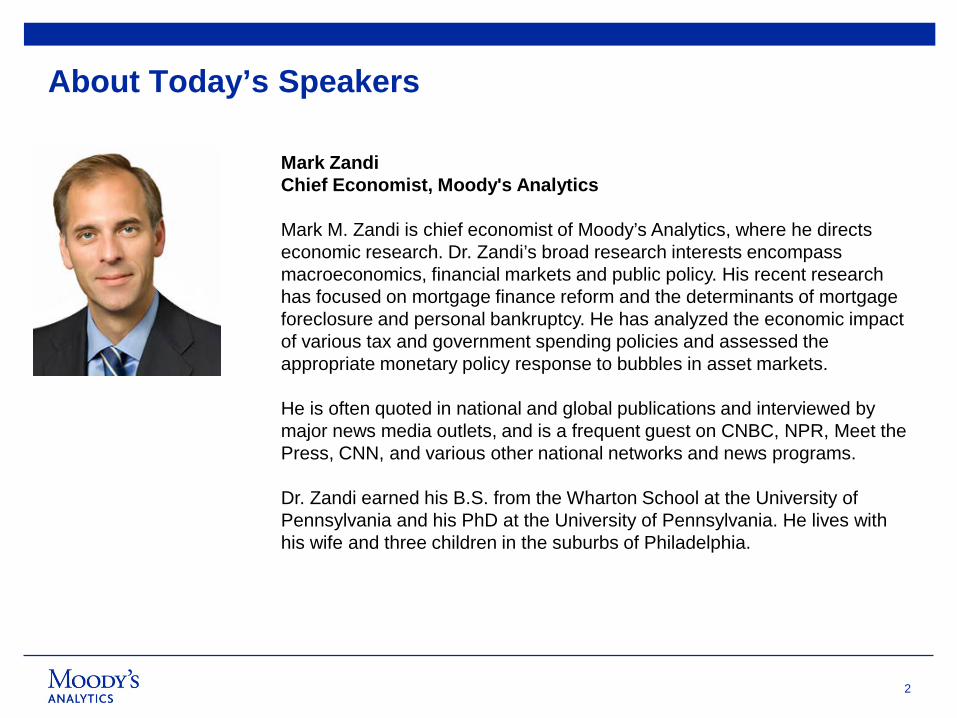
About Today’s Speakers
Mark Zandi Chief Economist, Moody's Analytics Mark M. Zandi is chief economist of Moody’s Analytics, where he directs economic research. Dr. Zandi’s broad research interests encompass macroeconomics, financial markets and public policy. His recent research has focused on mortgage finance reform and the determinants of mortgage foreclosure and personal bankruptcy. He has analyzed the economic impact of various tax and government spending policies and assessed the appropriate monetary policy response to bubbles in asset markets. He is often quoted in national and global publications and interviewed by major news media outlets, and is a frequent guest on CNBC, NPR, Meet the Press, CNN, and various other national networks and news programs. Dr. Zandi earned his B.S. from the Wharton School at the University of Pennsylvania and his PhD at the University of Pennsylvania. He lives with his wife and three children in the suburbs of Philadelphia.
3
About Today’s Speakers
Anna Krayn Director, Enterprise Risk Solutions Specialist Anna leads the team responsible for the business development of stress testing and capital planning solutions. She helps clients from a variety of financial institutions, including those in the banking, insurance, and consumer finance sectors. Prior to her current role, she was with Enterprise Risk Solutions leading engagements with financial institutions across the Americas in loss estimation and counterparty credit risk management. Anna also worked as a ratings analyst in the Financial Institutions Group of Moody’s Investors Service. Before joining Moody’s, Anna worked at the Financial Institutions Investment Banking group at Bank of America. She holds both a bachelor’s degree in Finance and International Business and a MBA from the Stern School of Business at New York University.

4
About Today’s Speakers
Sam Malone Director of Economic Research. Dr. Malone has taught and consulted at top institutions in Europe and South America, including Oxford, the University of Navarra, and the Central Banks of Venezuela and Peru. He is coauthor of the book Macrofinancial Risk Analysis, published in the Wiley Finance series with foreword by Nobel Laureate Robert Merton, as well as the author of multiple academic journal articles in economics and applied math published in outlets such as the Journal of Applied Econometrics, the International Journal of Forecasting, and the Annual Review of Financial Economics. He holds undergraduate degrees in mathematics and economics from Duke University, where studied as an A.B. Duke scholar and graduated with summa cum laude Latin honors, and MPhil and doctoral degrees in economics from the University of Oxford, where he studied as a Rhodes Scholar.
5
The Outcome: Reviewing Industry Results
Revisiting the CCAR 2015 Scenarios
Another Way to Look at Impact: Identifying and Quantifying Systemic Risk
Agenda
1
2
3
6
Revisiting the CCAR 2015 Scenarios 1
7
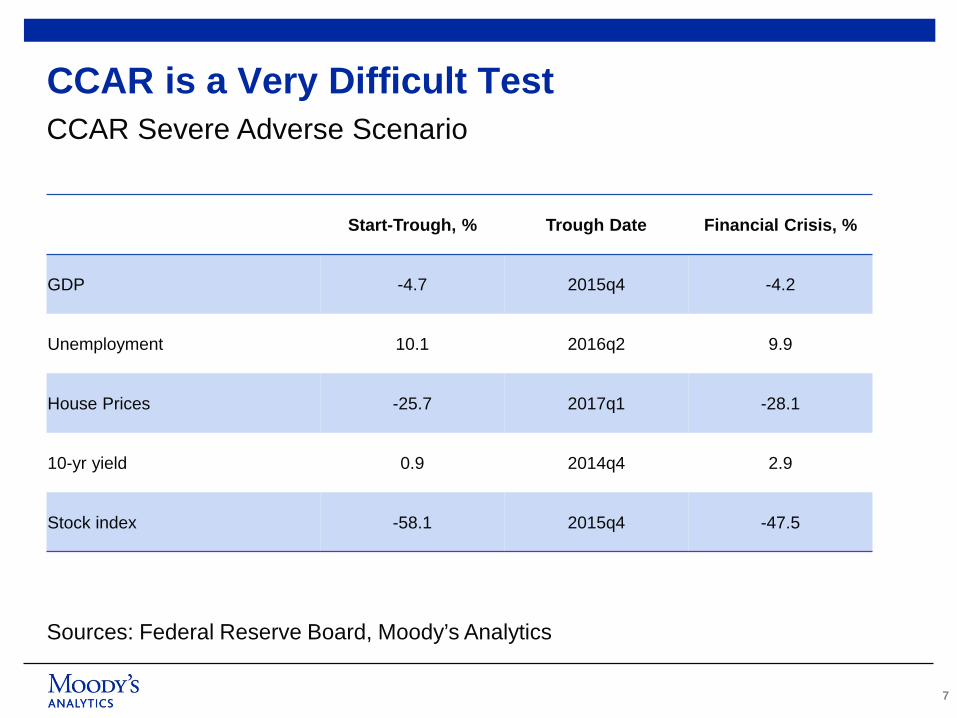
CCAR is a Very Difficult Test CCAR Severe Adverse Scenario
Sources: Federal Reserve Board, Moody’s Analytics
Start-Trough, % Trough Date Financial Crisis, %
GDP -4.7 2015q4 -4.2
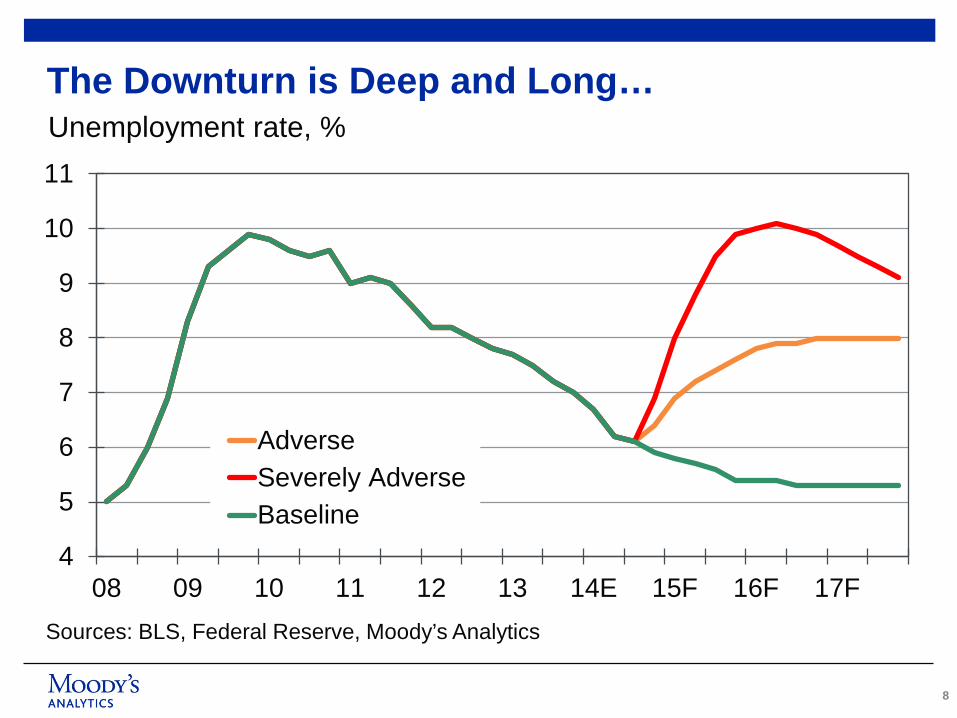
Unemployment 10.1 2016q2 9.9
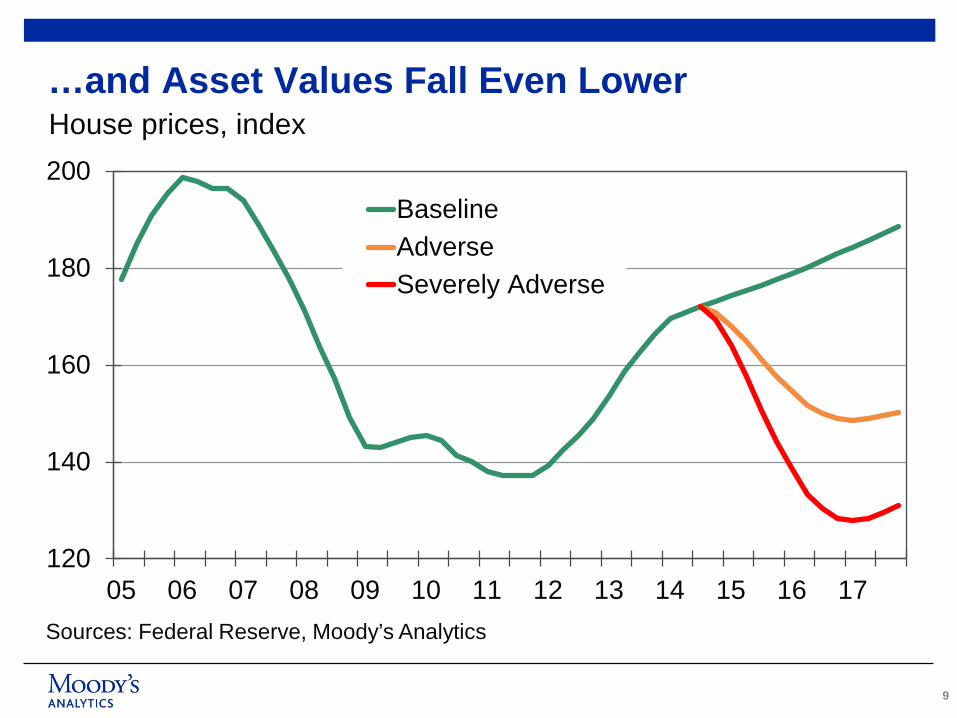
House Prices -25.7 2017q1 -28.1
10-yr yield 0.9 2014q4 2.9
Stock index -58.1 2015q4 -47.5
8
4
5
6
7
8
9
10
11
08 09 10 11 12 13 14E 15F 16F 17F
AdverseSeverely AdverseBaseline
Sources: BLS, Federal Reserve, Moody’s Analytics
Unemployment rate, % The Downturn is Deep and Long…
9
120
140
160
180
200
05 06 07 08 09 10 11 12 13 14 15 16 17
BaselineAdverseSeverely Adverse
Sources: Federal Reserve, Moody’s Analytics
House prices, index …and Asset Values Fall Even Lower
10
1
2
3
4
5
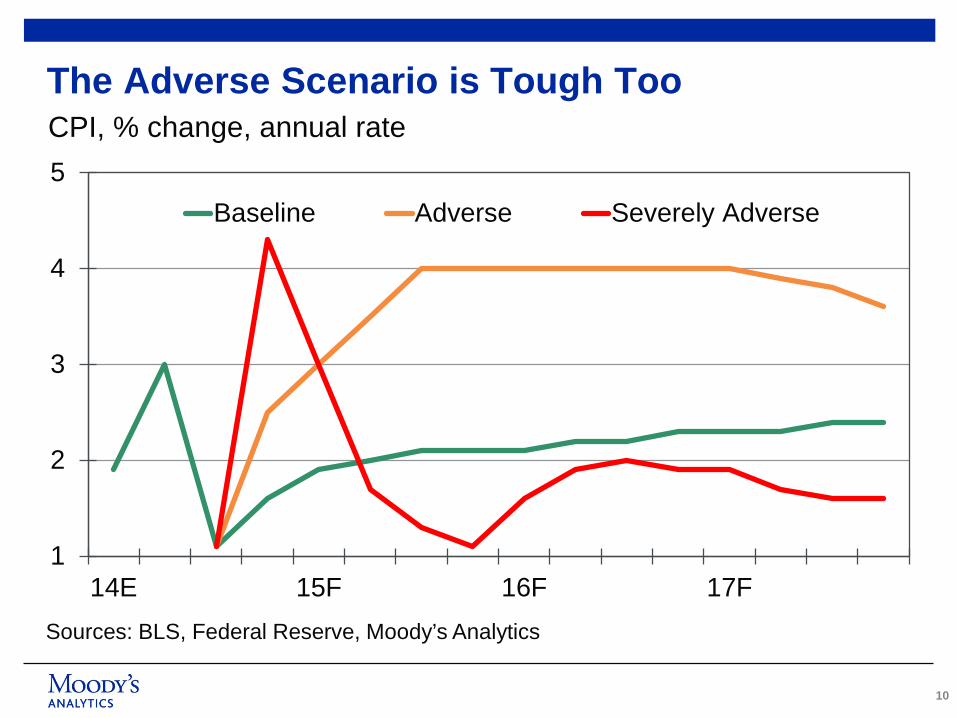
14E 15F 16F 17F
Baseline Adverse Severely Adverse
The Adverse Scenario is Tough Too
Sources: BLS, Federal Reserve, Moody’s Analytics
CPI, % change, annual rate
11
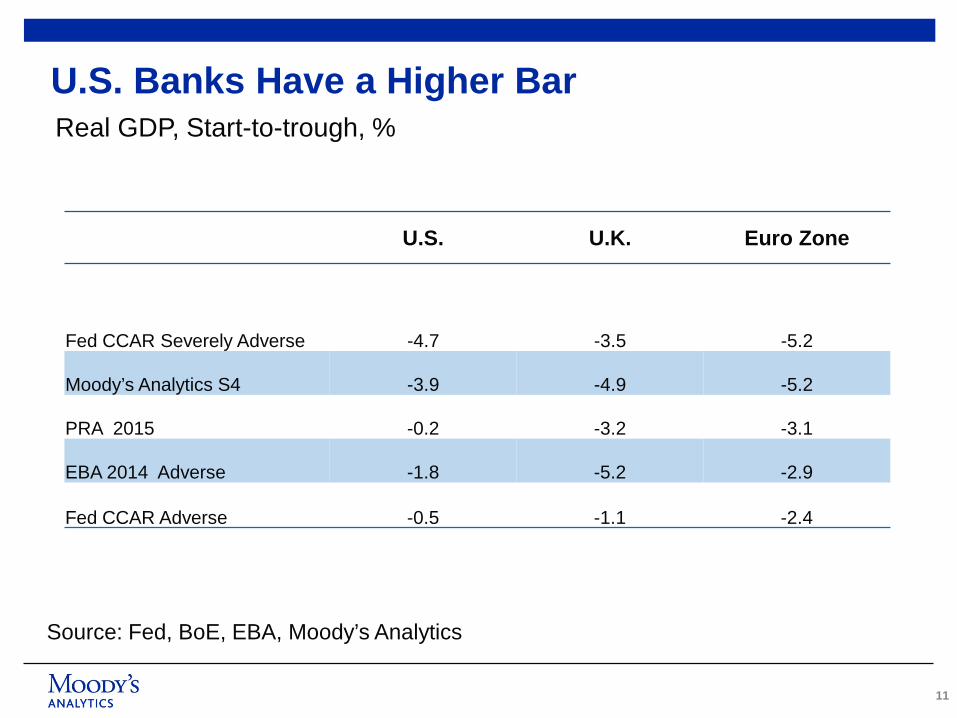
U.S. Banks Have a Higher Bar
Source: Fed, BoE, EBA, Moody’s Analytics
Real GDP, Start-to-trough, %
U.S. U.K. Euro Zone
Fed CCAR Severely Adverse -4.7 -3.5 -5.2
Moody’s Analytics S4 -3.9 -4.9 -5.2
PRA 2015 -0.2 -3.2 -3.1
EBA 2014 Adverse -1.8 -5.2 -2.9
Fed CCAR Adverse -0.5 -1.1 -2.4
12
The Outcome: Reviewing Industry Results 2
13
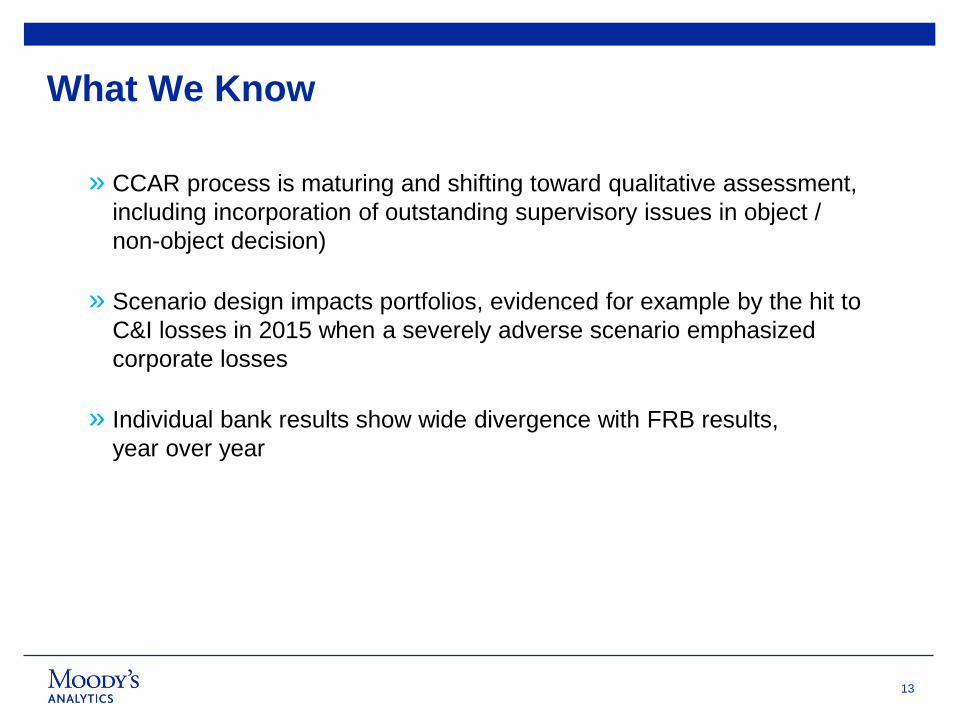
What We Know
» CCAR process is maturing and shifting toward qualitative assessment, including incorporation of outstanding supervisory issues in object / non-object decision)
» Scenario design impacts portfolios, evidenced for example by the hit to C&I losses in 2015 when a severely adverse scenario emphasized corporate losses
» Individual bank results show wide divergence with FRB results, year over year
14
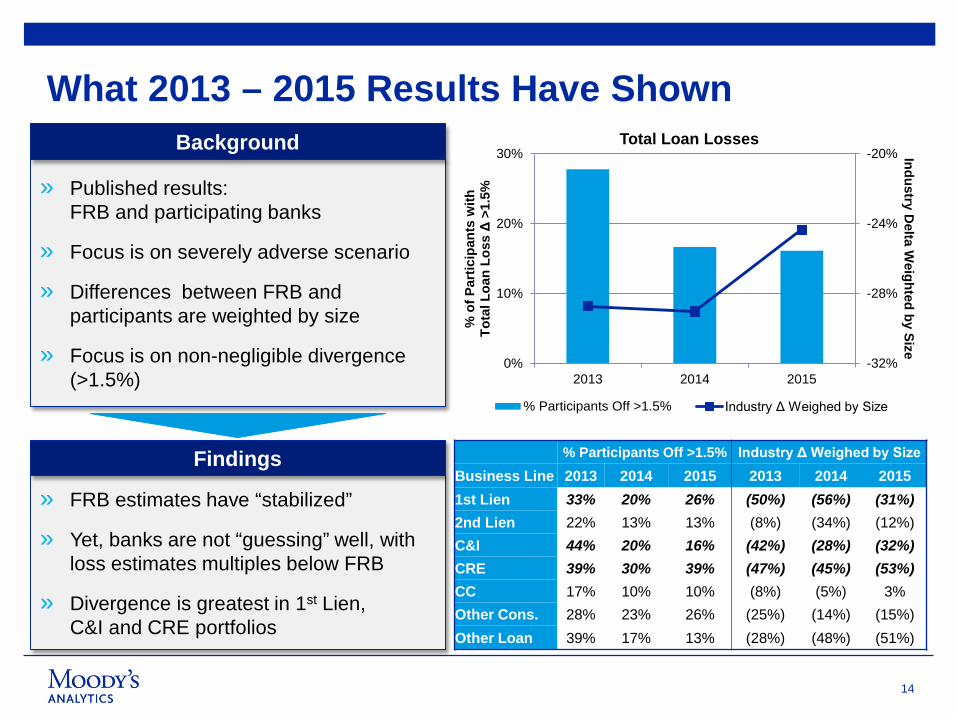
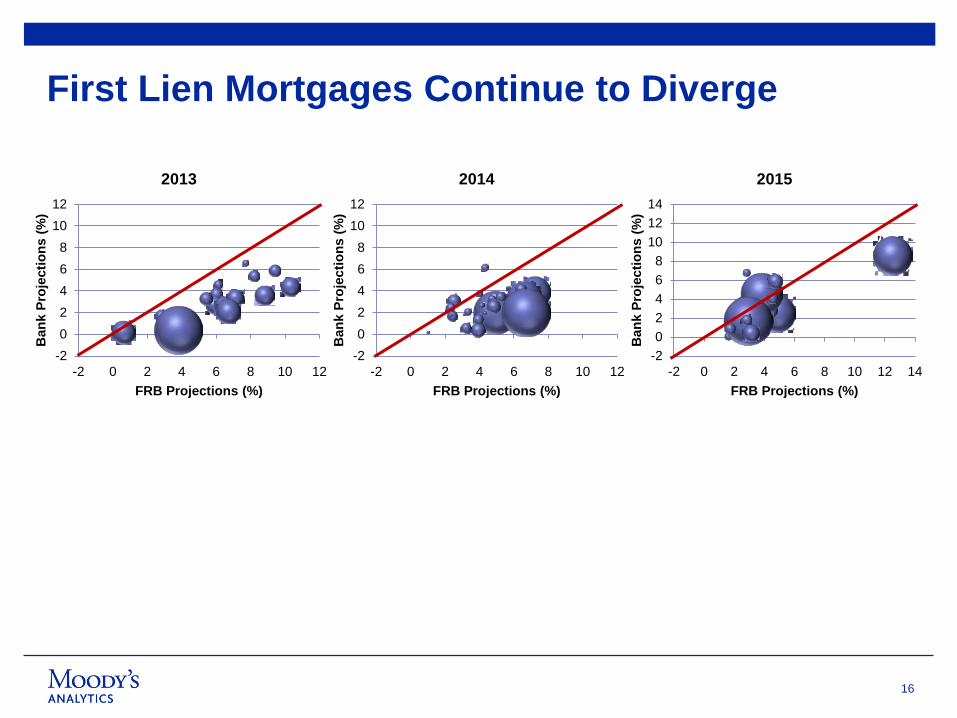
What 2013 – 2015 Results Have Shown
» Published results: FRB and participating banks
» Focus is on severely adverse scenario
» Differences between FRB and participants are weighted by size
» Focus is on non-negligible divergence (>1.5%)
» FRB estimates have “stabilized”
» Yet, banks are not “guessing” well, with loss estimates multiples below FRB
» Divergence is greatest in 1st Lien, C&I and CRE portfolios
Background
Findings
-32%
-28%
-24%
-20%
0%
10%
20%
30%
2013 2014 2015
Industry Delta W
eighted by Size
% o
f Par
ticip
ants
with
To
tal L
oan
Loss
Δ >
1.5%
% Participants Off >1.5% Industry Δ Weighed by Size
% Participants Off >1.5% Industry Δ Weighed by Size
Business Line 2013 2014 2015 2013 2014 2015
1st Lien 33% 20% 26% (50%) (56%) (31%) 2nd Lien 22% 13% 13% (8%) (34%) (12%) C&I 44% 20% 16% (42%) (28%) (32%) CRE 39% 30% 39% (47%) (45%) (53%) CC 17% 10% 10% (8%) (5%) 3% Other Cons. 28% 23% 26% (25%) (14%) (15%) Other Loan 39% 17% 13% (28%) (48%) (51%)
Total Loan Losses
15
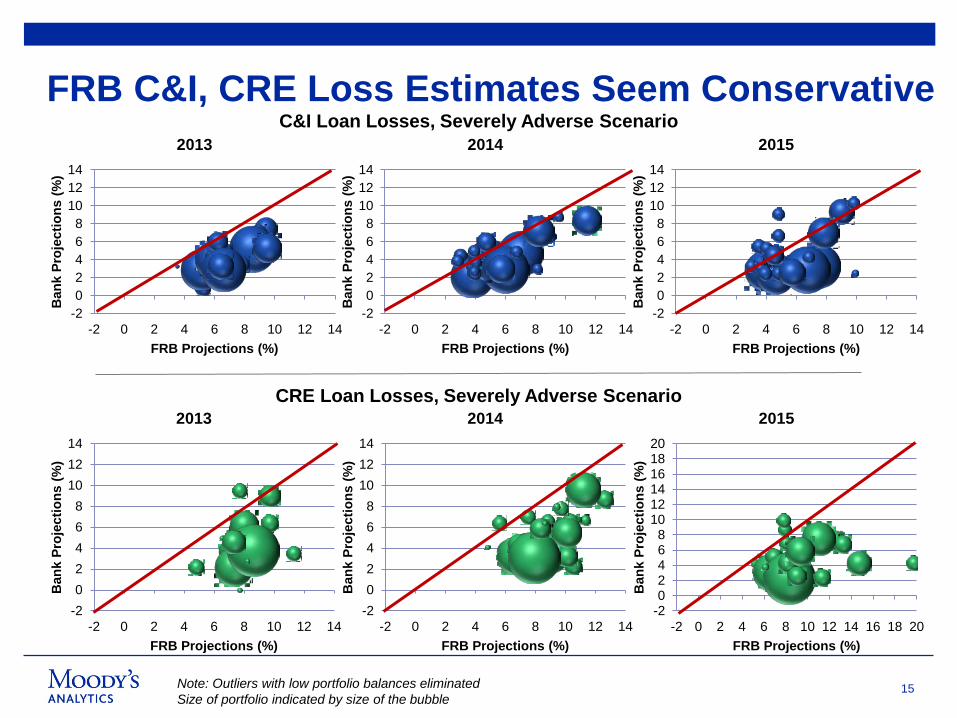
FRB C&I, CRE Loss Estimates Seem Conservative
Note: Outliers with low portfolio balances eliminated Size of portfolio indicated by size of the bubble
-202468
101214161820
-2 0 2 4 6 8 10 12 14 16 18 20B
ank
Proj
ectio
ns (%
) FRB Projections (%)
2015
-202468
101214
-2 0 2 4 6 8 10 12 14
Ban
k Pr
ojec
tions
(%)
FRB Projections (%)
2014
-202468
101214
-2 0 2 4 6 8 10 12 14
Ban
k Pr
ojec
tions
(%)
FRB Projections (%)
2013 CRE Loan Losses, Severely Adverse Scenario
-202468
101214
-2 0 2 4 6 8 10 12 14B
ank
Proj
ectio
ns (%
) FRB Projections (%)
2014
-202468
101214
-2 0 2 4 6 8 10 12 14
Ban
k Pr
ojec
tions
(%)
FRB Projections (%)
2013 C&I Loan Losses, Severely Adverse Scenario
-202468
101214
-2 0 2 4 6 8 10 12 14
Ban
k Pr
ojec
tions
(%)
FRB Projections (%)
2015
16
First Lien Mortgages Continue to Diverge
-202468
101214
-2 0 2 4 6 8 10 12 14
Ban
k Pr
ojec
tions
(%)
FRB Projections (%)
2015
-202468
1012
-2 0 2 4 6 8 10 12
Ban
k Pr
ojec
tions
(%)
FRB Projections (%)
2014
-202468
1012
-2 0 2 4 6 8 10 12
Ban
k Pr
ojec
tions
(%)
FRB Projections (%)
2013
17
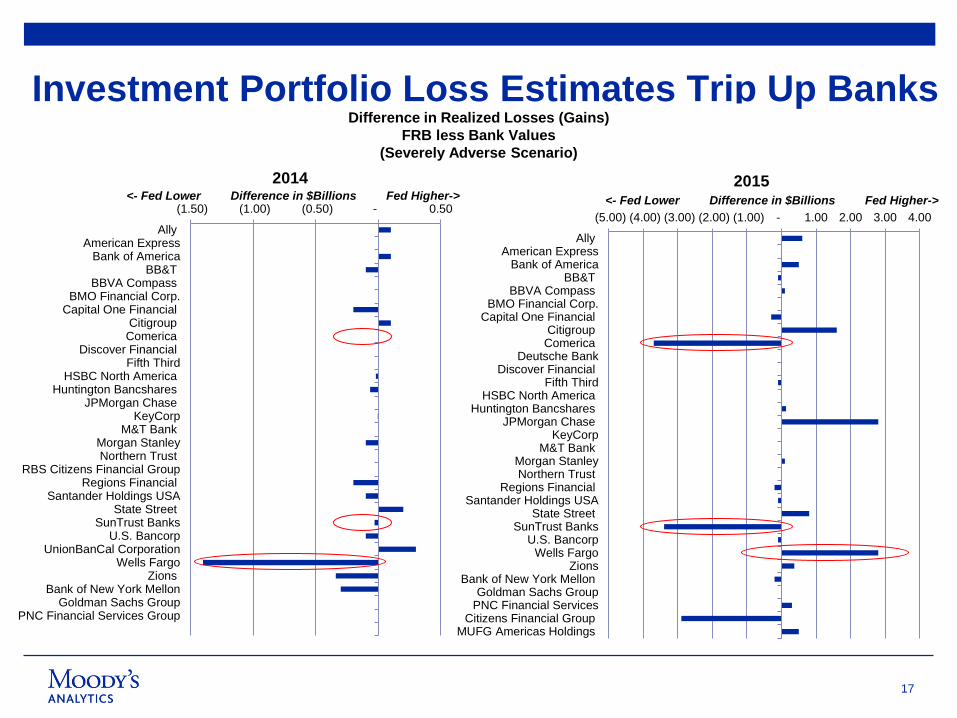
Investment Portfolio Loss Estimates Trip Up Banks Difference in Realized Losses (Gains)
FRB less Bank Values (Severely Adverse Scenario)
(5.00) (4.00) (3.00) (2.00) (1.00) - 1.00 2.00 3.00 4.00
AllyAmerican Express
Bank of AmericaBB&T
BBVA CompassBMO Financial Corp.
Capital One FinancialCitigroupComerica
Deutsche BankDiscover Financial
Fifth ThirdHSBC North America
Huntington BancsharesJPMorgan Chase
KeyCorpM&T Bank
Morgan StanleyNorthern Trust
Regions FinancialSantander Holdings USA
State StreetSunTrust Banks
U.S. BancorpWells Fargo
ZionsBank of New York Mellon
Goldman Sachs GroupPNC Financial Services
Citizens Financial GroupMUFG Americas Holdings
<- Fed Lower Difference in $Billions Fed Higher-> 2015
(1.50) (1.00) (0.50) - 0.50
AllyAmerican Express
Bank of AmericaBB&T
BBVA CompassBMO Financial Corp.
Capital One FinancialCitigroupComerica
Discover FinancialFifth Third
HSBC North AmericaHuntington Bancshares
JPMorgan ChaseKeyCorp
M&T BankMorgan StanleyNorthern Trust
RBS Citizens Financial GroupRegions Financial
Santander Holdings USAState Street
SunTrust BanksU.S. Bancorp
UnionBanCal CorporationWells Fargo
ZionsBank of New York Mellon
Goldman Sachs GroupPNC Financial Services Group
<- Fed Lower Difference in $Billions Fed Higher-> 2014
18
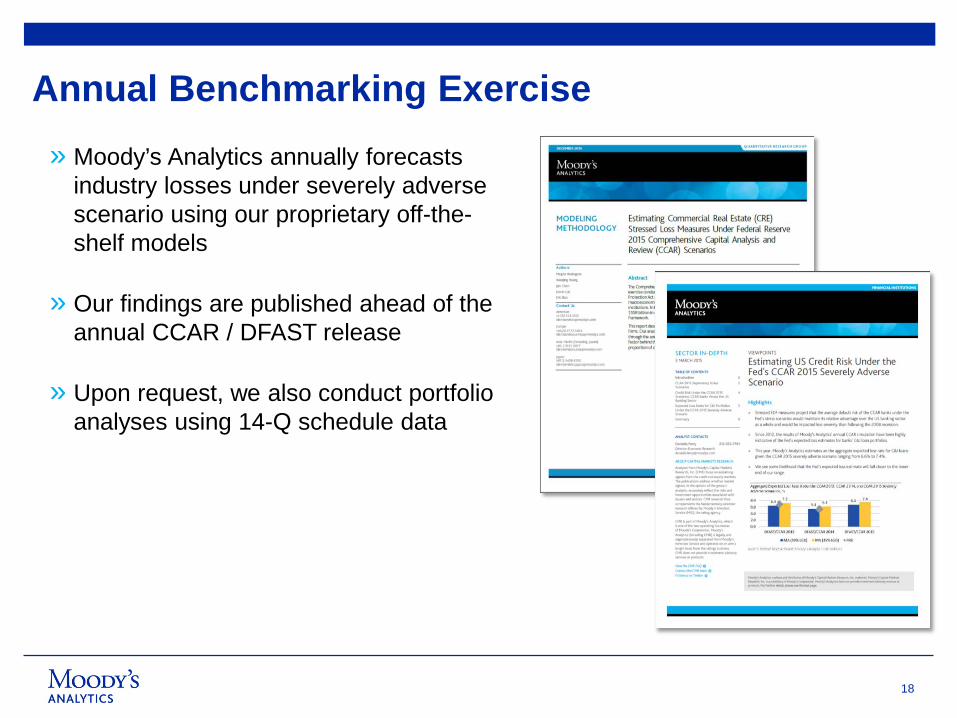
Annual Benchmarking Exercise » Moody’s Analytics annually forecasts
industry losses under severely adverse scenario using our proprietary off-the-shelf models
» Our findings are published ahead of the annual CCAR / DFAST release
» Upon request, we also conduct portfolio analyses using 14-Q schedule data
19
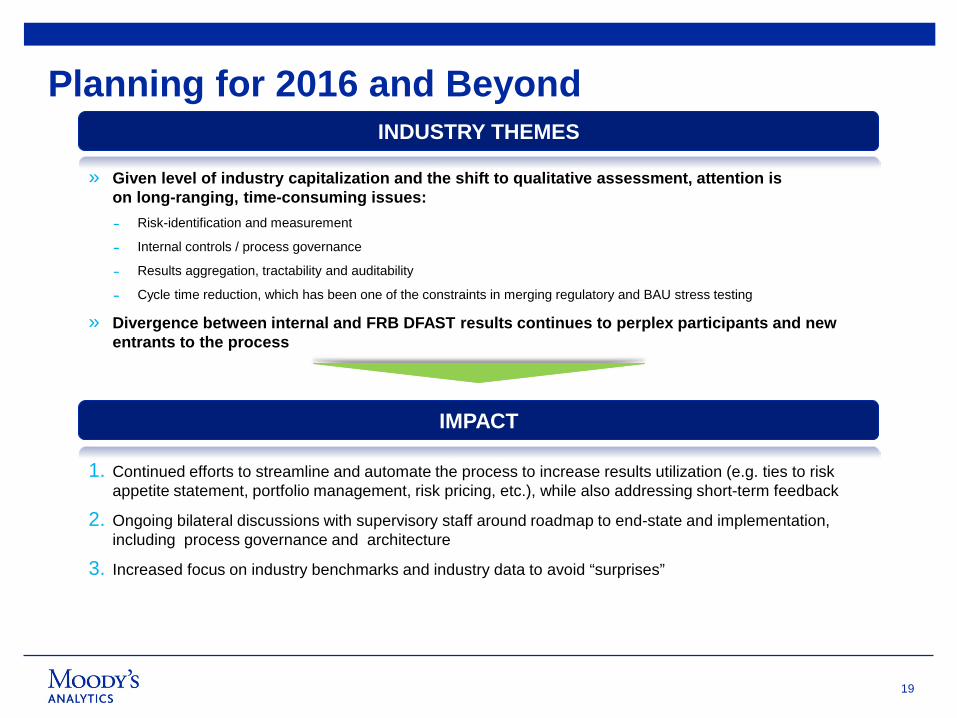
» Given level of industry capitalization and the shift to qualitative assessment, attention is on long-ranging, time-consuming issues: ˗ Risk-identification and measurement
˗ Internal controls / process governance
˗ Results aggregation, tractability and auditability
˗ Cycle time reduction, which has been one of the constraints in merging regulatory and BAU stress testing
» Divergence between internal and FRB DFAST results continues to perplex participants and new entrants to the process
INDUSTRY THEMES
IMPACT
1. Continued efforts to streamline and automate the process to increase results utilization (e.g. ties to risk appetite statement, portfolio management, risk pricing, etc.), while also addressing short-term feedback
2. Ongoing bilateral discussions with supervisory staff around roadmap to end-state and implementation, including process governance and architecture
3. Increased focus on industry benchmarks and industry data to avoid “surprises”
Planning for 2016 and Beyond
20
Another Way to Look at Impact: Identifying and Quantifying Systemic Risk 3
21
Why measure systemic risk? » Systemic risk is the potential for a shock, endogenous or exogenous to the financial
system, to cause broad-based financial system failure while inflicting collateral damage on other economic sectors.
» CCAR talks the talk on systemic risk but doesn’t walk the walk.
» Banks are considered in isolation from each other.
» Our tools measure systemic risk but are actionable by individual banks.
» Example: Goldman or AIG’s specific contributions to systemic risk.
» Natural extension of credit/counterparty risk tools.
» Methodology already approved by OFR, IMF, academic literature. The Fed has already urged SIFIs in writing to develop quantitative systemic risk tools.
» Network tools are built upon Moody’s CreditEdge database.
» CreditEdge offers an industry-leading implementation of structural credit risk models that allows banks to measure the probability of default for publicly traded companies around the world.
22
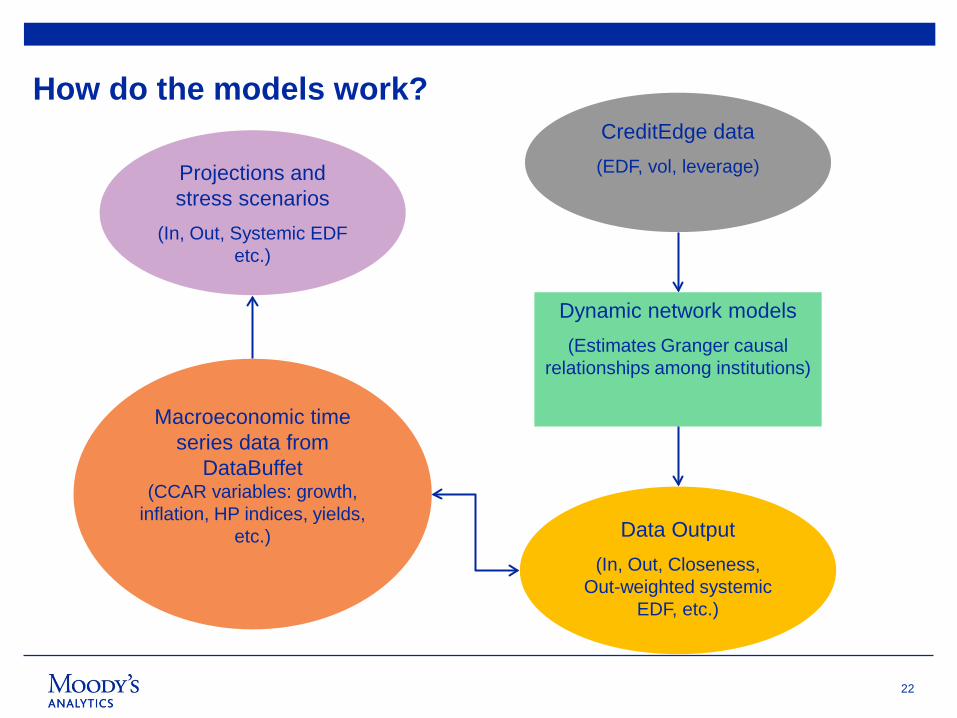
How do the models work? CreditEdge data (EDF, vol, leverage)
Dynamic network models (Estimates Granger causal
relationships among institutions)
Data Output (In, Out, Closeness,
Out-weighted systemic EDF, etc.)
Macroeconomic time series data from
DataBuffet (CCAR variables: growth,
inflation, HP indices, yields, etc.)
Projections and stress scenarios
(In, Out, Systemic EDF etc.)
23
» Examples of networks by geography: – United States
– Global MegaBanks
– ASEAN-5
– Australia
» Outputs: – Weighted average EDF, leverage, and volatility measures over time
– Degree of Granger causality over time
– Network diagrams representing snapshots in time
– Many bank-specific systemic risk measures and rankings, including Out, In, Out.plus, In.plus, Closeness, and others, by bank and over time
Systemic Risk Monitor: A Network Approach
24
0
2
4
6
8
10
12
14
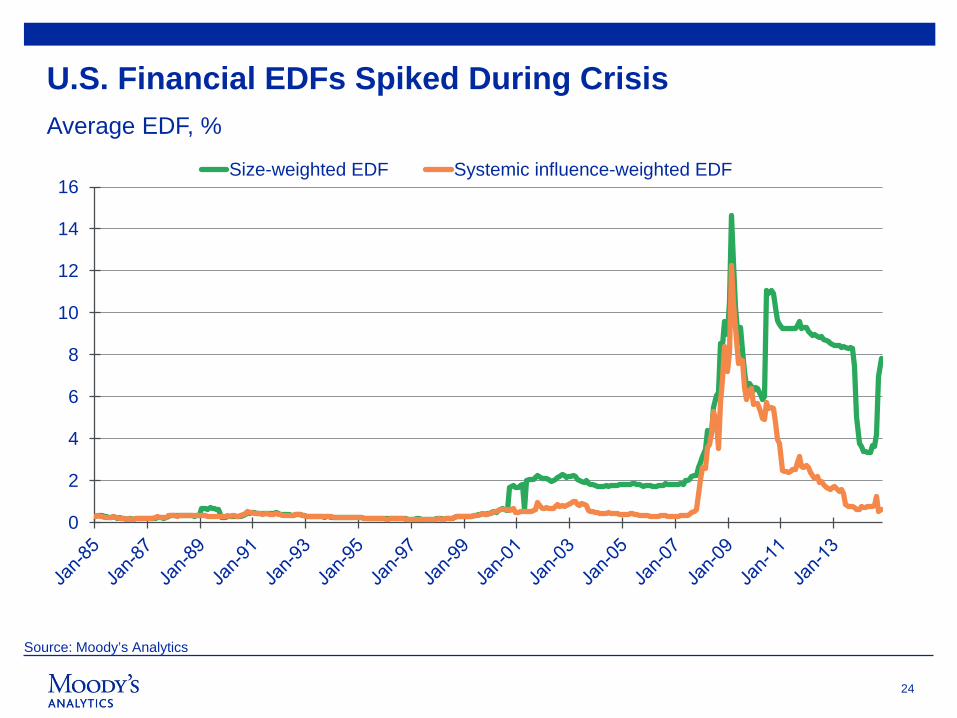
16Size-weighted EDF Systemic influence-weighted EDF
U.S. Financial EDFs Spiked During Crisis Average EDF, %
Source: Moody’s Analytics
25
0.0
0.1
0.2
0.3
0.4
0.5
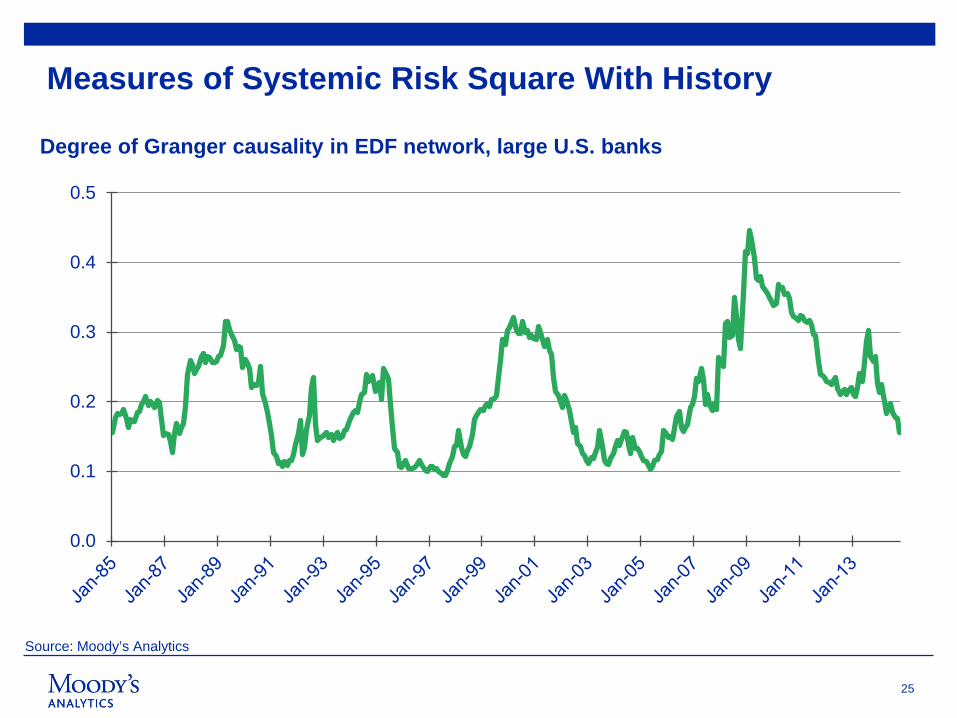
Measures of Systemic Risk Square With History
Degree of Granger causality in EDF network, large U.S. banks
Source: Moody’s Analytics
26
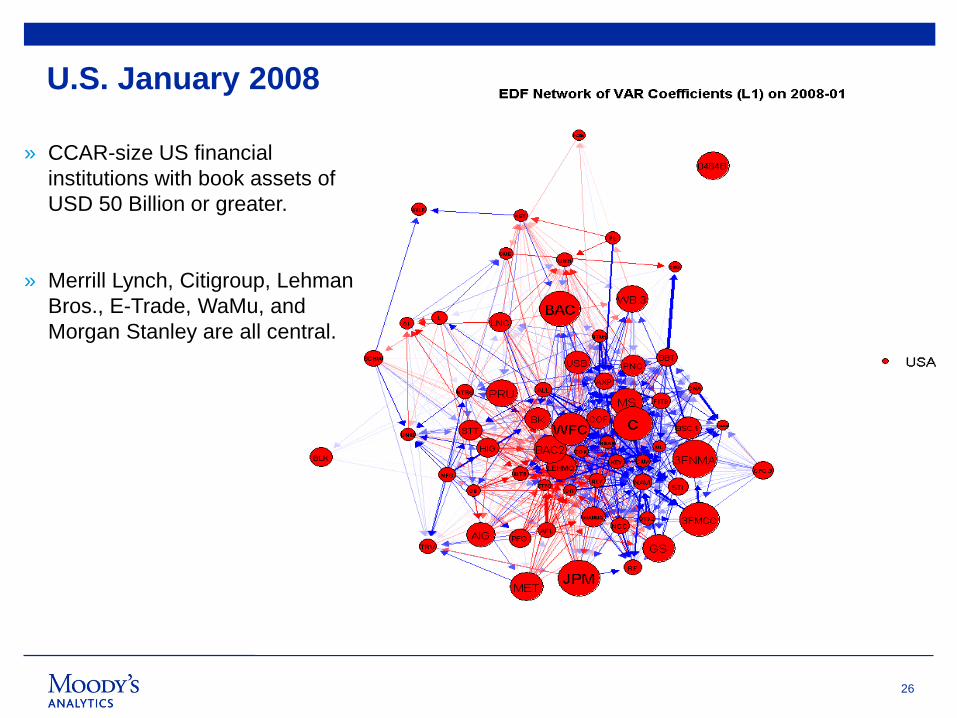
» CCAR-size US financial institutions with book assets of USD 50 Billion or greater.
» Merrill Lynch, Citigroup, Lehman Bros., E-Trade, WaMu, and Morgan Stanley are all central.
U.S. January 2008
27
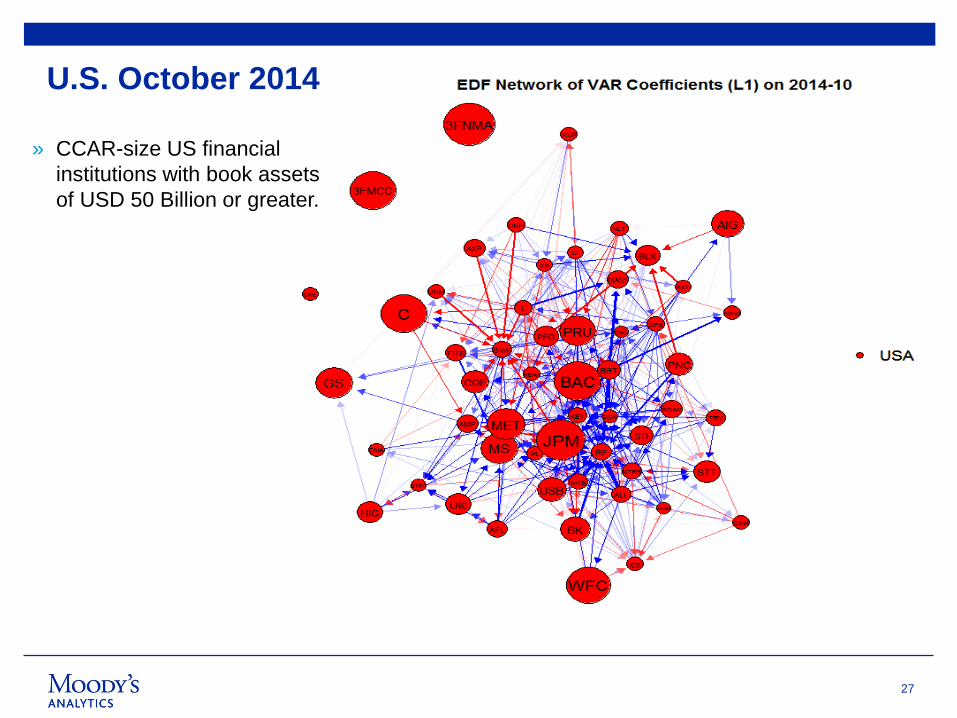
» CCAR-size US financial institutions with book assets of USD 50 Billion or greater.
U.S. October 2014
28
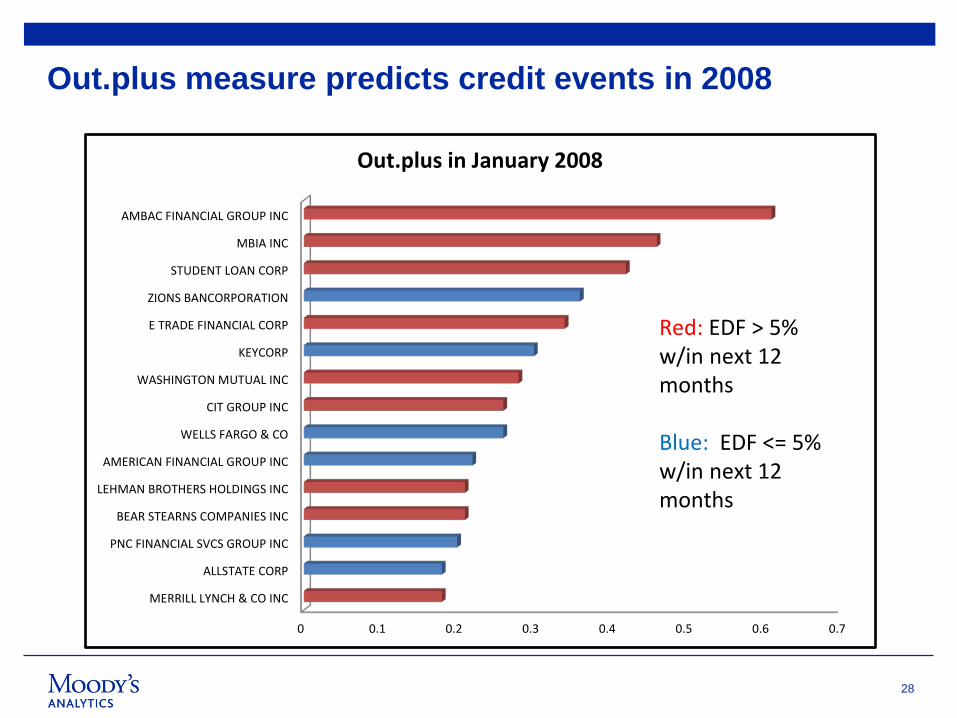
Out.plus measure predicts credit events in 2008
0 0.1 0.2 0.3 0.4 0.5 0.6 0.7
MERRILL LYNCH & CO INC
ALLSTATE CORP
PNC FINANCIAL SVCS GROUP INC
BEAR STEARNS COMPANIES INC
LEHMAN BROTHERS HOLDINGS INC
AMERICAN FINANCIAL GROUP INC
WELLS FARGO & CO
CIT GROUP INC
WASHINGTON MUTUAL INC
KEYCORP
E TRADE FINANCIAL CORP
ZIONS BANCORPORATION
STUDENT LOAN CORP
MBIA INC
AMBAC FINANCIAL GROUP INC
Out.plus in January 2008
Red: EDF > 5% w/in next 12 months Blue: EDF <= 5% w/in next 12 months
29
Additional Information
Moody’s Analytics Risk Practitioner Conference
October 26-28, 2015
Scottsdale, Arizona
moodysanalytics.com/rpc2015
31
32
@MoodysAnalytics Stay current with the latest risk management and assessment news, insights, events, and more. @dismalscientist View global economic data, analysis and commentary by Mark Zandi and the Moody's Analytics’ economics team. @CSIGlobalEd Read the latest financial services education information @MA_CapitalMkts Keep up to date on credit and equity market signals reflecting investment risk and opportunities for issuers and sectors.
7 World Trade Center 250 Greenwich Street New York, NY 10007 (212) 553-1653 121 North Walnut Street Suite 500 West Chester PA 19380 (610) 235-5299 405 Howard Street Suite 300 San Francisco, CA 94105 (415) 874-6000
www.moodysanalytics.com
Moody's Analytics Follow our company page to view risk management content, such as white papers, articles, webinars, and other insightful content and news. The Economic Outlook This group features insightful discussions and knowledge sharing among business, economics, and policy professionals regarding the economic outlook. Risk Practitioner Community This group brings together risk management practitioners from around the world to discuss best practices, share ideas and insights, and gain networking opportunities.
33
© 2015 Moody’s Corporation, Moody’s Investors Service, Inc., Moody’s Analytics, Inc. and/or their licensors and affiliates (collectively, “MOODY’S”). All rights reserved.
CREDIT RATINGS ISSUED BY MOODY'S INVESTORS SERVICE, INC. (“MIS”) AND ITS AFFILIATES ARE MOODY’S CURRENT OPINIONS OF THE RELATIVE FUTURE CREDIT RISK OF ENTITIES, CREDIT COMMITMENTS, OR DEBT OR DEBT-LIKE SECURITIES, AND CREDIT RATINGS AND RESEARCH PUBLICATIONS PUBLISHED BY MOODY’S (“MOODY’S PUBLICATIONS”) MAY INCLUDE MOODY’S CURRENT OPINIONS OF THE RELATIVE FUTURE CREDIT RISK OF ENTITIES, CREDIT COMMITMENTS, OR DEBT OR DEBT-LIKE SECURITIES. MOODY’S DEFINES CREDIT RISK AS THE RISK THAT AN ENTITY MAY NOT MEET ITS CONTRACTUAL, FINANCIAL OBLIGATIONS AS THEY COME DUE AND ANY ESTIMATED FINANCIAL LOSS IN THE EVENT OF DEFAULT. CREDIT RATINGS DO NOT ADDRESS ANY OTHER RISK, INCLUDING BUT NOT LIMITED TO: LIQUIDITY RISK, MARKET VALUE RISK, OR PRICE VOLATILITY. CREDIT RATINGS AND MOODY’S OPINIONS INCLUDED IN MOODY’S PUBLICATIONS ARE NOT STATEMENTS OF CURRENT OR HISTORICAL FACT. MOODY’S PUBLICATIONS MAY ALSO INCLUDE QUANTITATIVE MODEL-BASED ESTIMATES OF CREDIT RISK AND RELATED OPINIONS OR COMMENTARY PUBLISHED BY MOODY’S ANALYTICS, INC. CREDIT RATINGS AND MOODY’S PUBLICATIONS DO NOT CONSTITUTE OR PROVIDE INVESTMENT OR FINANCIAL ADVICE, AND CREDIT RATINGS AND MOODY’S PUBLICATIONS ARE NOT AND DO NOT PROVIDE RECOMMENDATIONS TO PURCHASE, SELL, OR HOLD PARTICULAR SECURITIES. NEITHER CREDIT RATINGS NOR MOODY’S PUBLICATIONS COMMENT ON THE SUITABILITY OF AN INVESTMENT FOR ANY PARTICULAR INVESTOR. MOODY’S ISSUES ITS CREDIT RATINGS AND PUBLISHES MOODY’S PUBLICATIONS WITH THE EXPECTATION AND UNDERSTANDING THAT EACH INVESTOR WILL, WITH DUE CARE, MAKE ITS OWN STUDY AND EVALUATION OF EACH SECURITY THAT IS UNDER CONSIDERATION FOR PURCHASE, HOLDING, OR SALE.
MOODY’S CREDIT RATINGS AND MOODY’S PUBLICATIONS ARE NOT INTENDED FOR USE BY RETAIL INVESTORS AND IT WOULD BE RECKLESS FOR RETAIL INVESTORS TO CONSIDER MOODY’S CREDIT RATINGS OR MOODY’S PUBLICATIONS IN MAKING ANY INVESTMENT DECISION. IF IN DOUBT YOU SHOULD CONTACT YOUR FINANCIAL OR OTHER PROFESSIONAL ADVISER.
ALL INFORMATION CONTAINED HEREIN IS PROTECTED BY LAW, INCLUDING BUT NOT LIMITED TO, COPYRIGHT LAW, AND NONE OF SUCH INFORMATION MAY BE COPIED OR OTHERWISE REPRODUCED, REPACKAGED, FURTHER TRANSMITTED, TRANSFERRED, DISSEMINATED, REDISTRIBUTED OR RESOLD, OR STORED FOR SUBSEQUENT USE FOR ANY SUCH PURPOSE, IN WHOLE OR IN PART, IN ANY FORM OR MANNER OR BY ANY MEANS WHATSOEVER, BY ANY PERSON WITHOUT MOODY’S PRIOR WRITTEN CONSENT.
All information contained herein is obtained by MOODY’S from sources believed by it to be accurate and reliable. Because of the possibility of human or mechanical error as well as other factors, however, all information contained herein is provided “AS IS” without warranty of any kind. MOODY'S adopts all necessary measures so that the information it uses in assigning a credit rating is of sufficient quality and from sources MOODY'S considers to be reliable including, when appropriate, independent third-party sources. However, MOODY’S is not an auditor and cannot in every instance independently verify or validate information received in the rating process or in preparing the Moody’s Publications.
To the extent permitted by law, MOODY’S and its directors, officers, employees, agents, representatives, licensors and suppliers disclaim liability to any person or entity for any indirect, special, consequential, or incidental losses or damages whatsoever arising from or in connection with the information contained herein or the use of or inability to use any such information, even if MOODY’S or any of its directors, officers, employees, agents, representatives, licensors or suppliers is advised in advance of the possibility of such losses or damages, including but not limited to: (a) any loss of present or prospective profits or (b) any loss or damage arising where the relevant financial instrument is not the subject of a particular credit rating assigned by MOODY’S.
To the extent permitted by law, MOODY’S and its directors, officers, employees, agents, representatives, licensors and suppliers disclaim liability for any direct or compensatory losses or damages caused to any person or entity, including but not limited to by any negligence (but excluding fraud, willful misconduct or any other type of liability that, for the avoidance of doubt, by law cannot be excluded) on the part of, or any contingency within or beyond the control of, MOODY’S or any of its directors, officers, employees, agents, representatives, licensors or suppliers, arising from or in connection with the information contained herein or the use of or inability to use any such information.
NO WARRANTY, EXPRESS OR IMPLIED, AS TO THE ACCURACY, TIMELINESS, COMPLETENESS, MERCHANTABILITY OR FITNESS FOR ANY PARTICULAR PURPOSE OF ANY SUCH RATING OR OTHER OPINION OR INFORMATION IS GIVEN OR MADE BY MOODY’S IN ANY FORM OR MANNER WHATSOEVER.
MIS, a wholly-owned credit rating agency subsidiary of Moody’s Corporation (“MCO”), hereby discloses that most issuers of debt securities (including corporate and municipal bonds, debentures, notes and commercial paper) and preferred stock rated by MIS have, prior to assignment of any rating, agreed to pay to MIS for appraisal and rating services rendered by it fees ranging from $1,500 to approximately $2,500,000. MCO and MIS also maintain policies and procedures to address the independence of MIS’s ratings and rating processes. Information regarding certain affiliations that may exist between directors of MCO and rated entities, and between entities who hold ratings from MIS and have also publicly reported to the SEC an ownership interest in MCO of more than 5%, is posted annually at www.moodys.com under the heading “Shareholder Relations — Corporate Governance — Director and Shareholder Affiliation Policy.”
For Australia only: Any publication into Australia of this document is pursuant to the Australian Financial Services License of MOODY’S affiliate, Moody’s Investors Service Pty Limited ABN 61 003 399 657AFSL 336969 and/or Moody’s Analytics Australia Pty Ltd ABN 94 105 136 972 AFSL 383569 (as applicable). This document is intended to be provided only to “wholesale clients” within the meaning of section 761G of the Corporations Act 2001. By continuing to access this document from within Australia, you represent to MOODY’S that you are, or are accessing the document as a representative of, a “wholesale client” and that neither you nor the entity you represent will directly or indirectly disseminate this document or its contents to “retail clients” within the meaning of section 761G of the Corporations Act 2001. MOODY’S credit rating is an opinion as to the creditworthiness of a debt obligation of the issuer, not on the equity securities of the issuer or any form of security that is available to retail clients. It would be dangerous for “retail clients” to make any investment decision based on MOODY’S credit rating. If in doubt you should contact your financial or other professional adviser.