Embed Size (px)
Citation preview

2015 Industrials ConferenceAugust 13, 2015
1
Forward-Looking StatementsCertain statements made in this presentation are forward-looking statements that involve
risks and uncertainties. The words “believe,” “expect,” “project,” “will,” “should,” “could” and similar expressions are intended to identify those forward-looking statements. These forward-looking statements reflect the Company’s best judgment based on current information, and although we base these statements on circumstances that we believe to be reasonable when made, there can be no assurance that future events will not affect the accuracy of such forward-looking information. As such, the forward-looking statements are not guarantees of future performance, and actual results may vary materially from the projected results and expectations discussed in this report. Factors that might cause the Company’s actual results to differ materially from those anticipated in forward-looking statements include, but are not limited to: (1) the sensitivity of the results of our operations to prevailing steel prices and changes in the supply and cost of raw materials, including pig iron, iron ore and scrap steel; (2) availability and cost of electricity and natural gas which could negatively affect our cost of steel production or could result in a delay or cancellation of existing or future drilling within our natural gas working interest drilling programs; (3) critical equipment failures and business interruptions; (4) market demand for steel products, which, in the case of many of our products, is driven by the level of nonresidential construction activity in the U.S.; (5) competitive pressure on sales and pricing, including pressure from imports and substitute materials; (6) impairment in the recorded value of inventory, equity investments, fixed assets, goodwill or other long-lived assets; (7) uncertainties surrounding the global economy, including the severe economic downturn in construction markets and excess world capacity for steel production; (8) fluctuations in currency conversion rates; (9) U.S. and foreign trade policy affecting steel imports or exports; (10) significant changes in laws or government regulations affecting environmental compliance, including legislation and regulations that result in greater regulation of greenhouse gas emissions that could increase our energy costs and our capital expenditures and operating costs or cause one or more of our permits to be revoked or make it more difficult to obtain permit modifications; (11) the cyclical nature of the steel industry; (12) capital investments and their impact on our performance; and (13) our safety performance.2
Nucor’s Focus: PROFITABLE GROWTH
NUCOR’S POSITION OF STRENGTH
NUCOR’S STRATEGY
NUCOR’S STRATEGIC EXECUTION
3

NUCOR’S POSITION OF STRENGTH
4
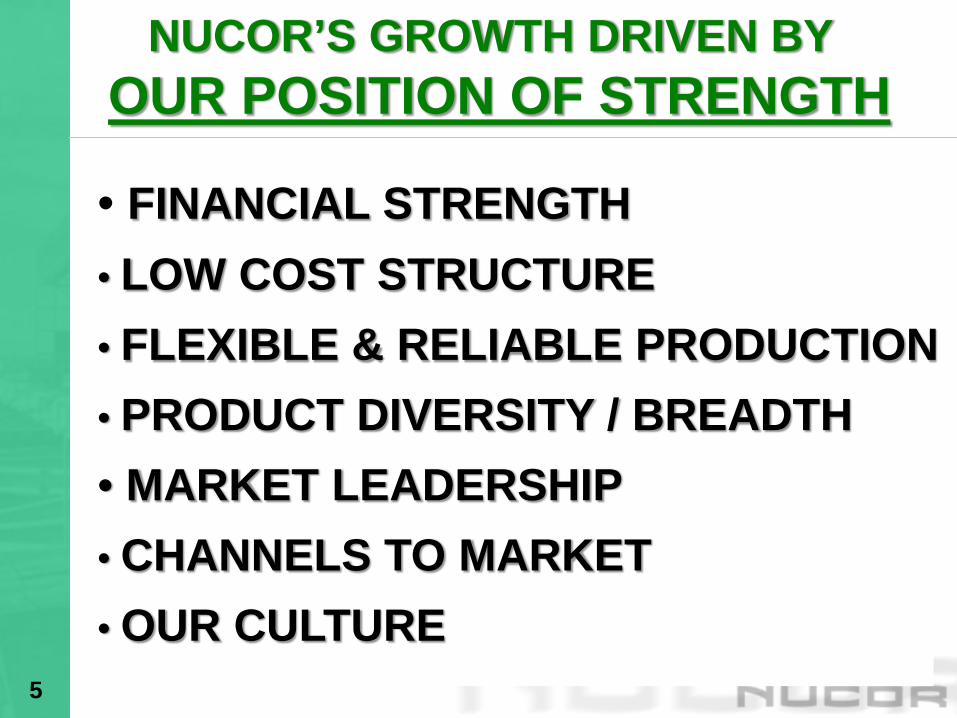
NUCOR’S GROWTH DRIVEN BYOUR POSITION OF STRENGTH
• FINANCIAL STRENGTH • LOW COST STRUCTURE• FLEXIBLE & RELIABLE PRODUCTION • PRODUCT DIVERSITY / BREADTH • MARKET LEADERSHIP• CHANNELS TO MARKET • OUR CULTURE
5

Strong cash flow generation through the cycle
Investment grade credit rating
Conservative Financial Practices
No Material Legacy Liabilities
FINANCIAL STRENGTH
6
$0
$600
$1,200
$1,800
$2,400
2000 2001 2002 2003 2004 2005 2006 2007 2008 2009 2010 2011 2012 2013 2014 1STHALF2015
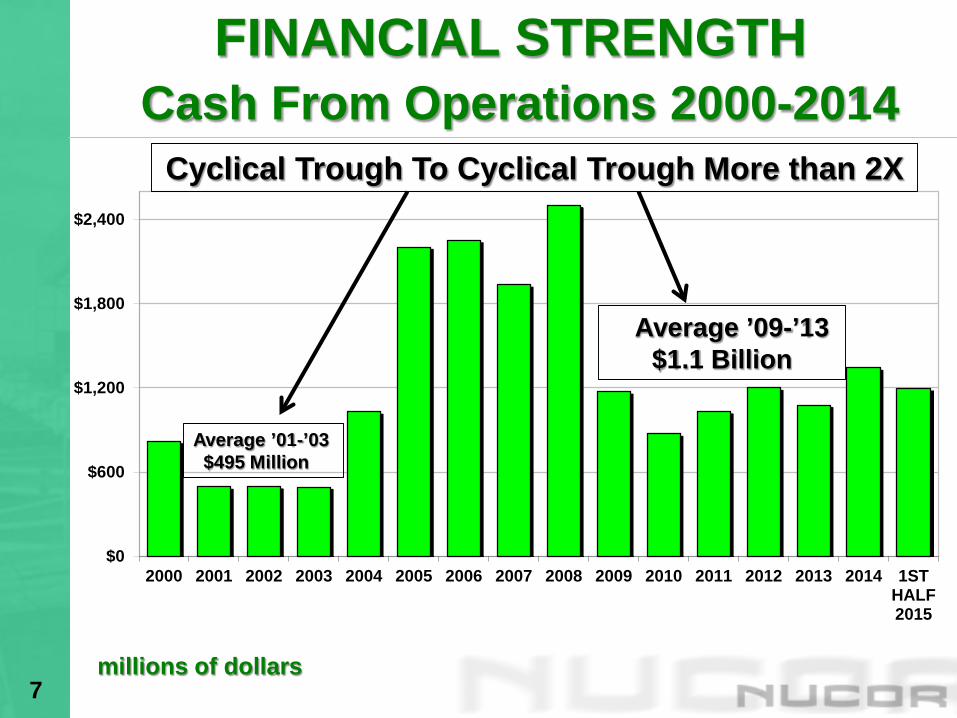
FINANCIAL STRENGTHCash From Operations 2000-2014
Cyclical Trough To Cyclical Trough More than 2X
millions of dollars
Average ’01-’03 $495 Million
Average ’09-’13$1.1 Billion
7
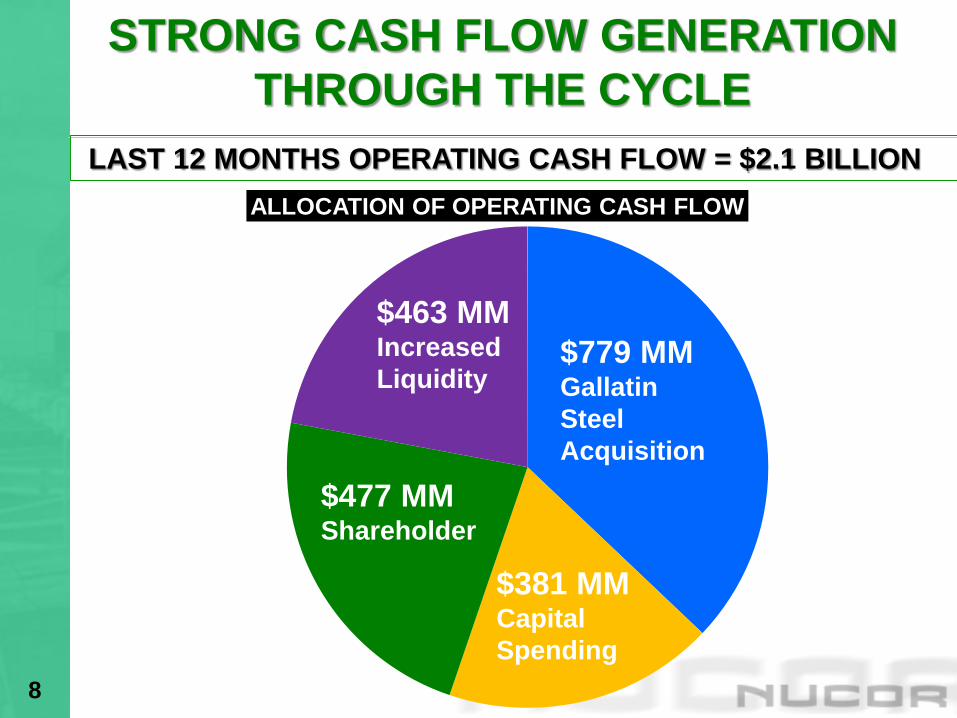
ALLOCATION OF OPERATING CASH FLOW
$779 MM Gallatin Steel Acquisition
$477 MMShareholder
$381 MM Capital Spending
STRONG CASH FLOW GENERATION THROUGH THE CYCLE
LAST 12 MONTHS OPERATING CASH FLOW = $2.1 BILLION
$463 MMIncreased Liquidity
8
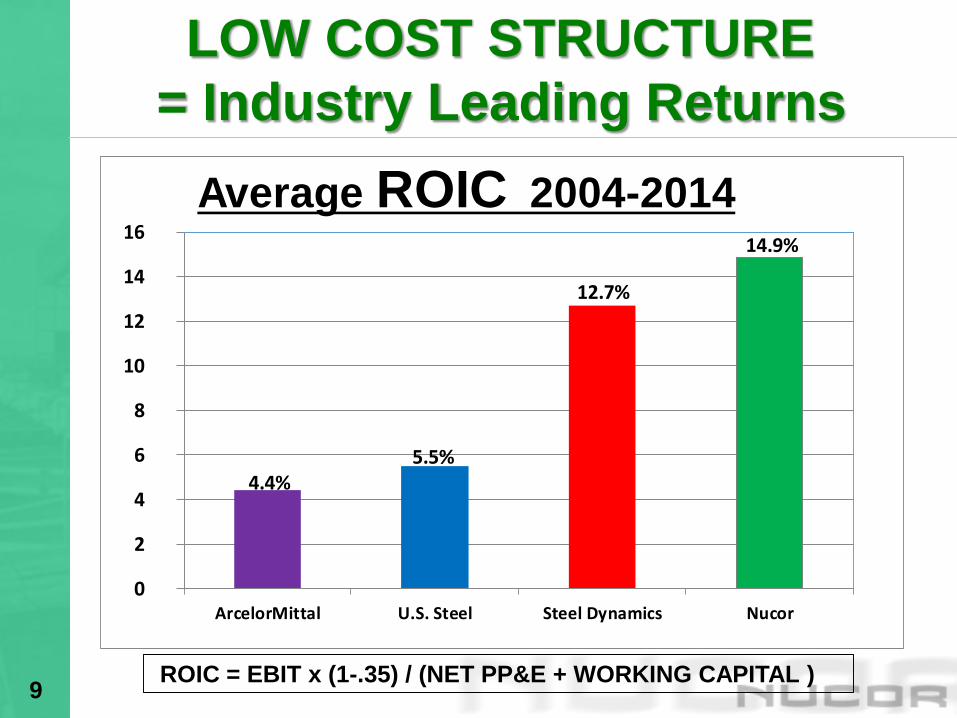
LOW COST STRUCTURE = Industry Leading Returns
4.4%5.5%
12.7%
14.9%
0
2
4
6
8
10
12
14
16
ArcelorMittal U.S. Steel Steel Dynamics Nucor
Average ROIC 2004-2014
ROIC = EBIT x (1-.35) / (NET PP&E + WORKING CAPITAL )9
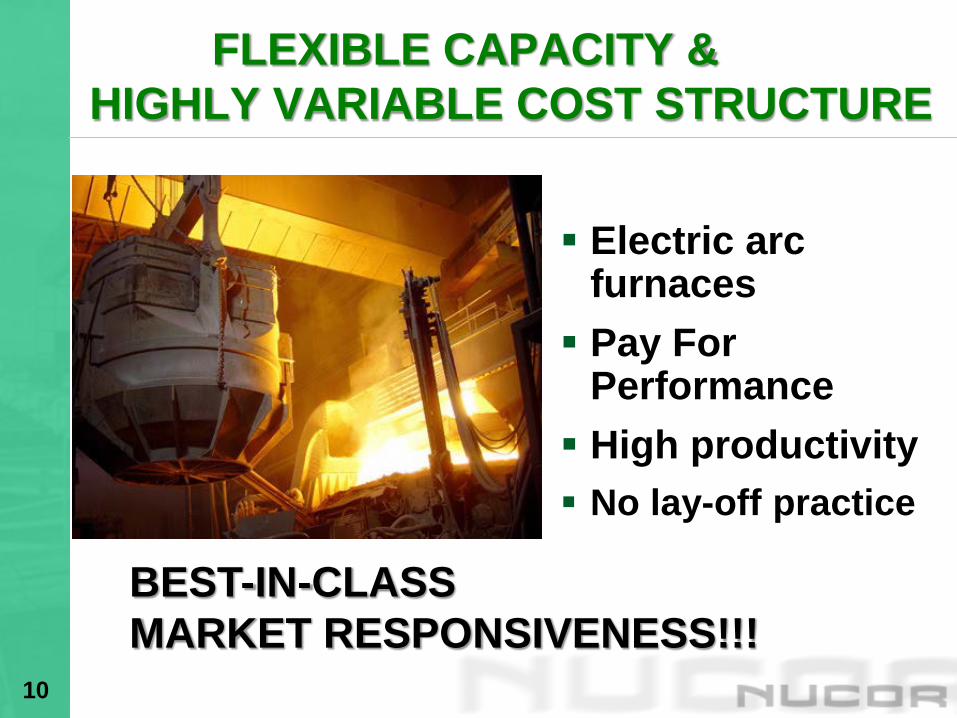
FLEXIBLE CAPACITY & HIGHLY VARIABLE COST STRUCTURE
Electric arc furnaces Pay For
Performance High productivity No lay-off practice
BEST-IN-CLASS MARKET RESPONSIVENESS!!!
10

2014 Sales TonsSheet - 32%
Bars - 22%
Structural - 10%
Plate - 10%
Products - 11%
Scrap - 15%
DIVERSIFIED PRODUCT MIXNORTH AMERICA’S MOST DIVERSIFIED STEEL PRODUCER
11
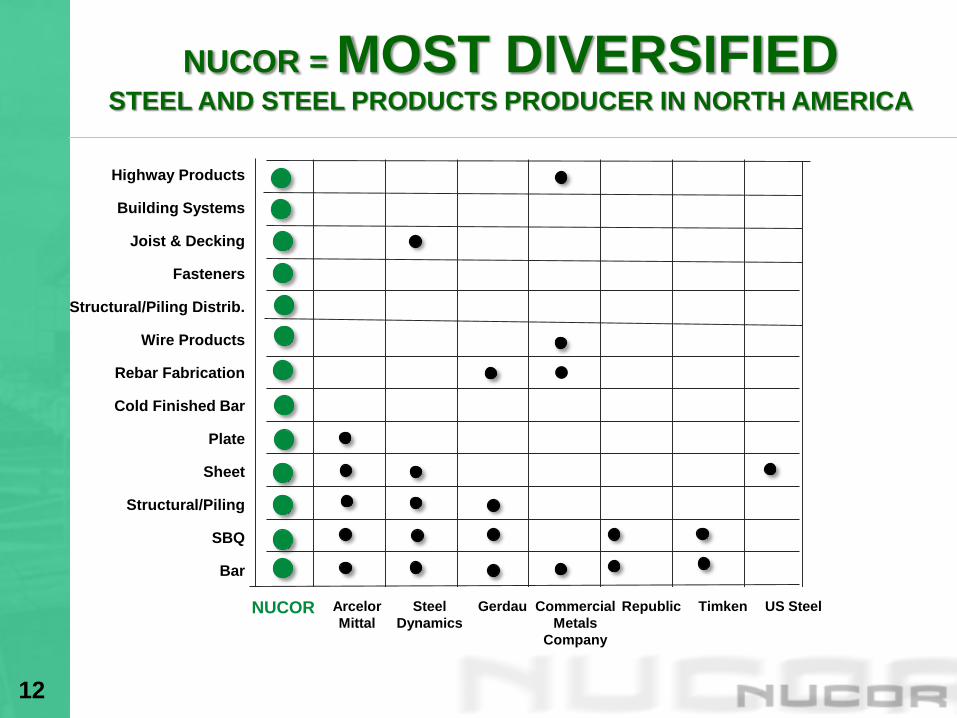
NUCOR = MOST DIVERSIFIEDSTEEL AND STEEL PRODUCTS PRODUCER IN NORTH AMERICA
Highway Products
Building Systems
Joist & Decking
Fasteners
Structural/Piling Distrib.
Wire Products
Rebar Fabrication
Cold Finished Bar
Plate
Sheet
Structural/Piling
SBQ
Bar
NUCOR Arcelor Mittal
SteelDynamics
Gerdau Commercial Metals
Company
Republic Timken US Steel
12

MARKET LEADERSHIP BY SIZE IN NORTH AMERICA
Structural SteelBar SteelRebar SteelHot Rolled Sheet SteelCold Finished Bar SteelSteel JoistSteel DeckRebar Fabrication, Distribution, & PlacementSteel Piling Distribution Metal Buildings
Sheet Steel (hot + cold + galvanized)
Plate Steel
#1North AmericanMarket Leader
#2North American Market Leader
#3North American Market Leader
13

CHANNELS TO MARKET
11%
16%
0
2
4
6
8
10
12
14
16
18
20
2008 2014
% Steel Mill Shipments To Internal Customers
14
NUCOR’S PEOPLE –OUR BIGGEST COMPETITIVE ADVANTAGE
15
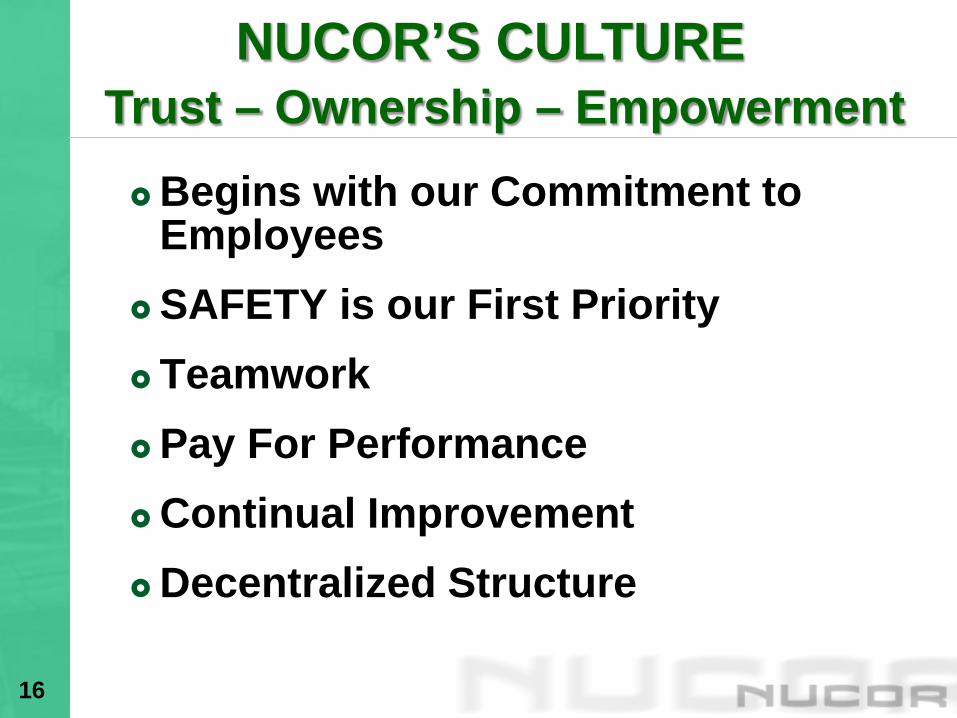
Begins with our Commitment to Employees
SAFETY is our First PriorityTeamworkPay For PerformanceContinual ImprovementDecentralized Structure
NUCOR’S CULTURETrust – Ownership – Empowerment
16
NUCOR’S STRATEGY FORLONG-TERM PROFITABLE GROWTH
17

NUCOR’S GROWTH STRATEGY
Optimize Existing
Operations
Raw Materials Strategy
Greenfield Growth
(Technology & Market niches)
International Growth via
Joint Ventures
Strategic Acquisitions
NUCOR’S FIVE
PRONGED GROWTH
STRATEGY
18
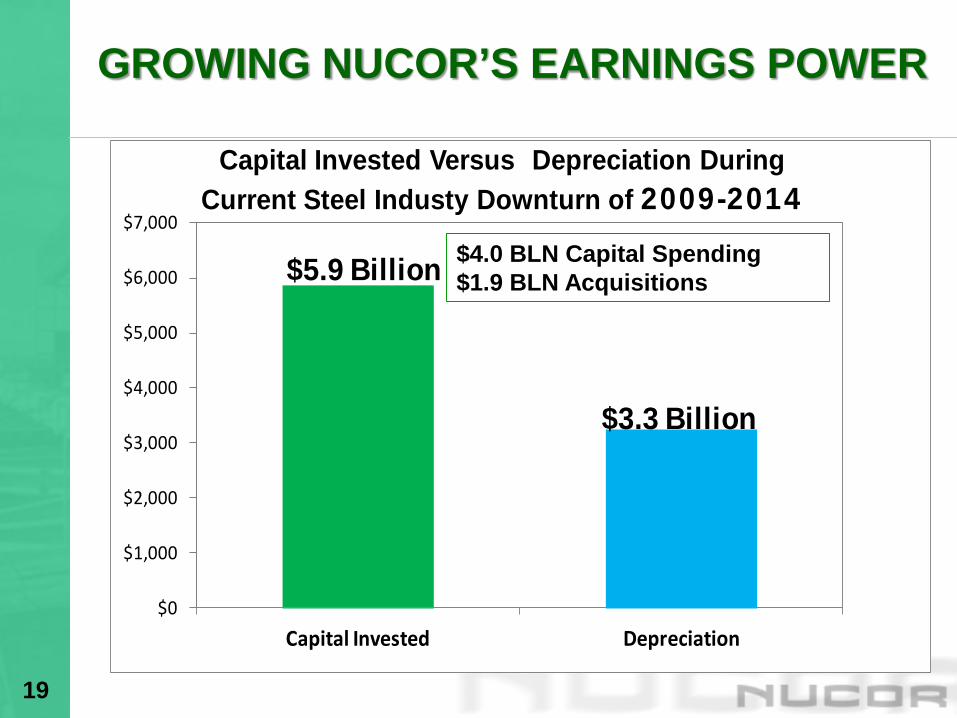
GROWING NUCOR’S EARNINGS POWER
$5.9 Billion
$3.3 Billion
$0
$1,000
$2,000
$3,000
$4,000
$5,000
$6,000
$7,000
Capital Invested Depreciation
Capital Invested Versus Depreciation During Current Steel Industy Downturn of 2009-2014
$4.0 BLN Capital Spending$1.9 BLN Acquisitions
19
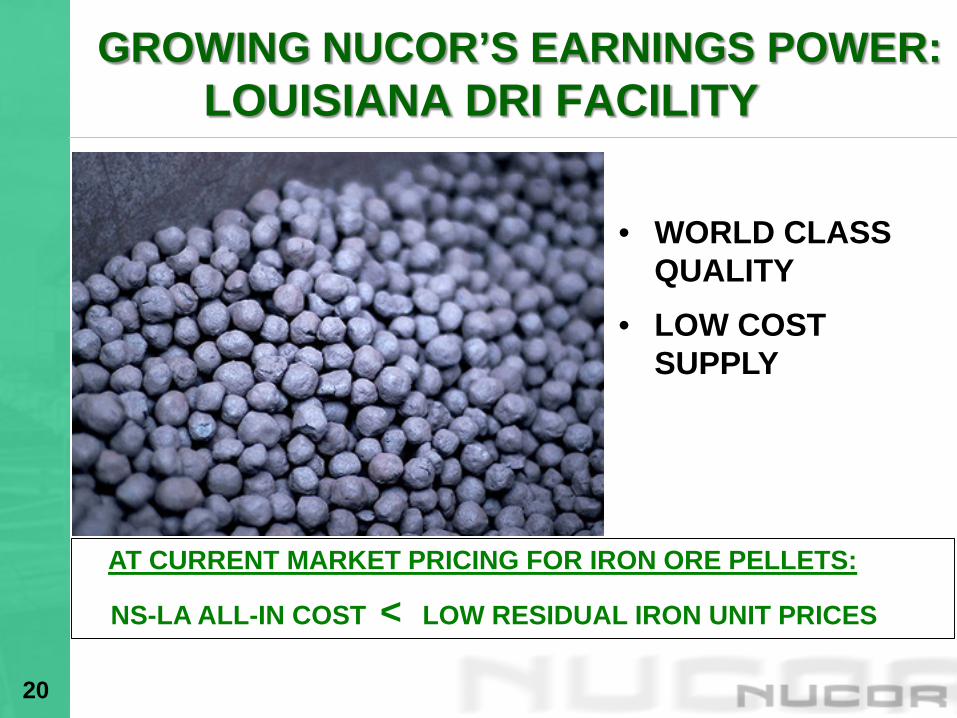
GROWING NUCOR’S EARNINGS POWER:LOUISIANA DRI FACILITY
AT CURRENT MARKET PRICING FOR IRON ORE PELLETS:
NS-LA ALL-IN COST < LOW RESIDUAL IRON UNIT PRICES
• WORLD CLASS QUALITY
• LOW COST SUPPLY
20

GROWING NUCOR’S EARNINGS POWER:HEAT TREAT & NORMALIZED PLATE
CONTINUES TO RUN AT FULL CAPACITY(245,000 TONS/YEAR CAPACITY)
21
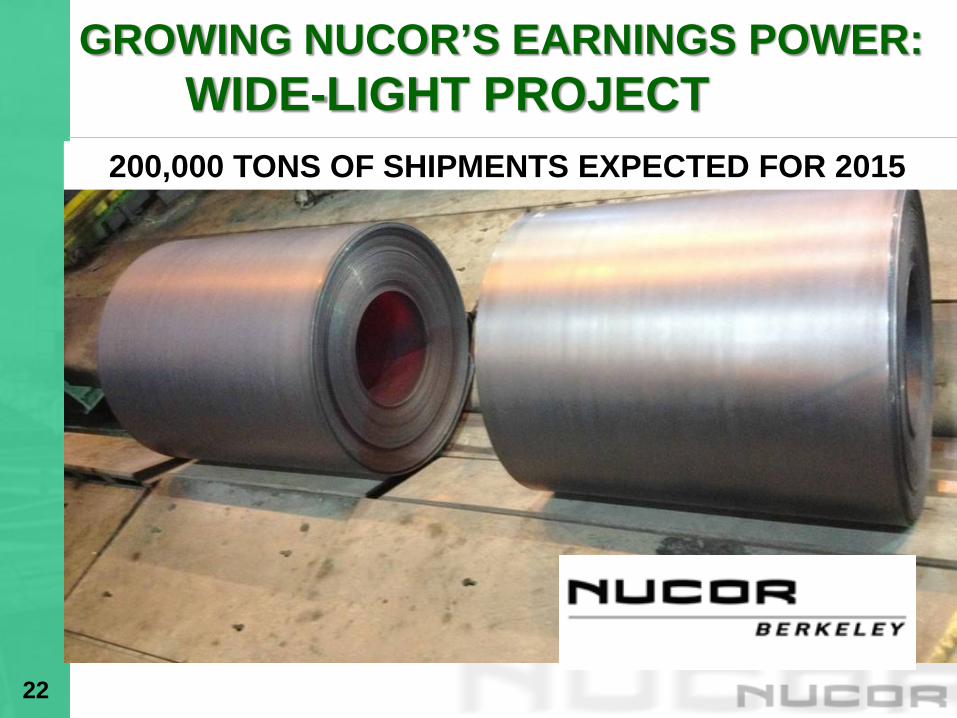
GROWING NUCOR’S EARNINGS POWER:WIDE-LIGHT PROJECT
200,000 TONS OF SHIPMENTS EXPECTED FOR 2015
22
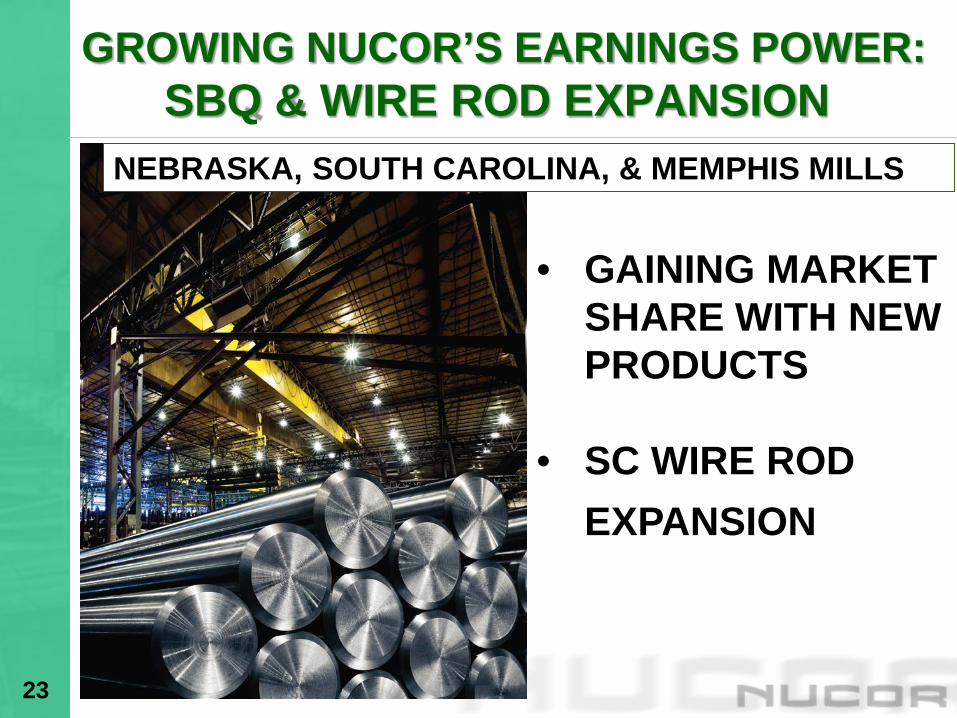
GROWING NUCOR’S EARNINGS POWER:SBQ & WIRE ROD EXPANSION
• GAINING MARKET SHARE WITH NEW PRODUCTS
• SC WIRE ROD EXPANSION
NEBRASKA, SOUTH CAROLINA, & MEMPHIS MILLS
23
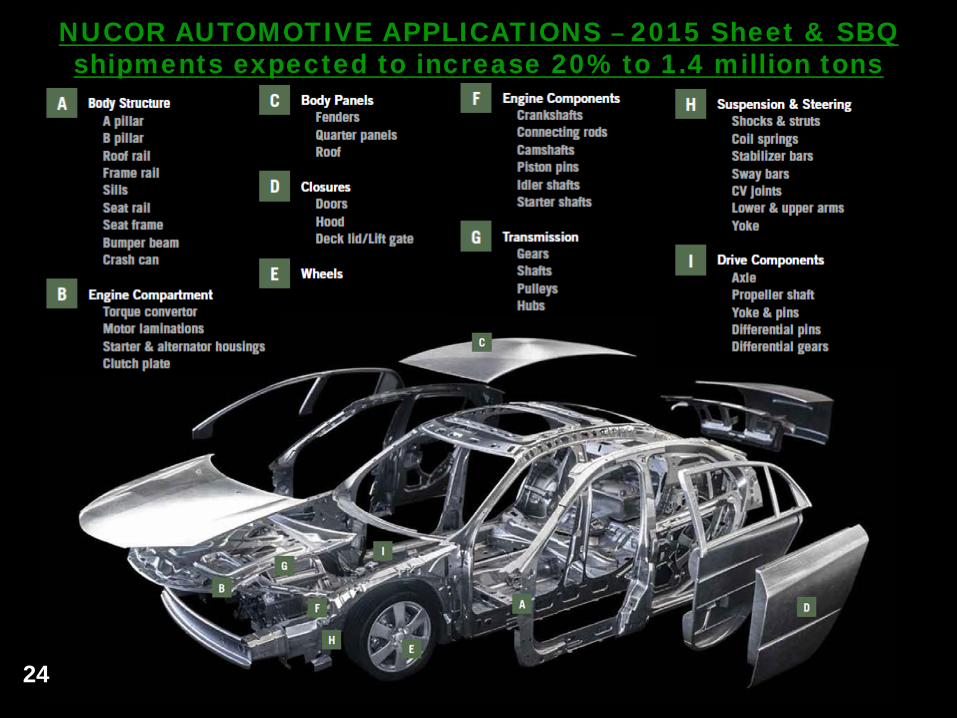
NUCOR AUTOMOTIVE APPLICATIONS – 2015 Sheet & SBQ shipments expected to increase 20% to 1.4 million tons
24

GROWING NUCOR’S EARNINGS POWER:SHEET PILING PRODUCT EXPANSION
100,000 TONS ANNUAL VOLUME TARGET
25

Enhances market leadership in hot band products
Broadens footprint in the strategically important Midwest market
Complement to Nucor’s Raw Materials / DRI Strategy
Strong cultural compatibility
GROWING NUCOR’S EARNINGS POWER:Gallatin Steel Acquisition
26

NUCOR’S STRATEGIC EXECUTION
27

NUCOR’S BALANCED APPROACH TO CAPITAL ALLOCATION
$15.5 Billion
$12.5 Billion
$6.7 Billion
$0
$2,000
$4,000
$6,000
$8,000
$10,000
$12,000
$14,000
$16,000
$18,000
Cash Generated By Operations Capital Invested Capital Returned
Cash From Operations, Capital Invested, & Capital Returned2005-2014 TEN YEAR HISTORY
28

-$300
$200
$700
$1,200
$1,700
$2,200
2000 2001 2002 2003 2004 2005 2006 2007 2008 2009 2010 2011 2012 2013 2014
BUILDING EARNINGS POWER FOR THE NEXT CYCLICAL PEAK & BEYOND (Millions of dollars)
2008 RECORD EPS$5.98
29
We make America stronger.
30