Embed Size (px)
Citation preview

Delta: Setting a New Standard
Baird’s Industrial ConferencePaul Jacobson, EVP & CFONovember 9, 2015

2
Statements in this presentation that are not historical facts, including statements regarding our estimates, expectations, beliefs, intentions, projections or strategies for the future, may be "forward-looking statements" as defined in the Private Securities Litigation Reform Act of 1995. All forward-looking statements involve a number of risks and uncertainties that could cause actual results to differ materially from the estimates, expectations, beliefs, intentions, projections and strategies reflected in or suggested by the forward-looking statements. These risks and uncertainties include, but are not limited to, the cost of aircraft fuel; the availability of aircraft fuel; the impact of rebalancing our hedge portfolio, recording mark-to-market adjustments or posting collateral in connection with our fuel hedge contracts; the possible effects of accidents involving our aircraft; the restrictions that financial covenants in our financing agreements will have on our financial and business operations; labor issues; interruptions or disruptions in service at one of our hub or gateway airports; disruptions or security breaches of our information technology infrastructure; our dependence on technology in our operations; the effects of weather, natural disasters and seasonality on our business; the effects of an extended disruption in services provided by third party regional carriers; failure or inability of insurance to cover a significant liability at Monroe’s Trainer refinery; the impact of environmental regulation on the Trainer refinery, including costs related to renewable fuel standard regulations; our ability to retain management and key employees; competitive conditions in the airline industry; the effects of extensive government regulation on our business; the sensitivity of the airline industry to prolonged periods of stagnant or weak economic conditions; the effects of terrorist attacks or geopolitical conflict; and the effects of the rapidspread of contagious illnesses. Additional information concerning risks and uncertainties that could cause differences between actual results and forward-looking statements is contained in our Securities and Exchange Commission filings, including our Annual Report on Form 10-K for the fiscal year ended Dec. 31, 2014. Caution should be taken not to place undue reliance on our forward-looking statements, which represent our views only as of Nov. 9, 2015, and which we have no current intention to update.
In this presentation, we will discuss certain non-GAAP financial measures. You can find the reconciliations of those measures to comparable GAAP measures on our website at delta.com.
Safe Harbor

Delta: Evolution Over The Past Decade
Consolidation
High Quality Product
Sustainable Earnings & Cash Flow
• Investments in network, products, and services in addition to highly motivated employees drive Delta’s industry leading operational reliability, customer satisfaction and 15% domestic unit revenue premium
• Leveraging network scale to produce better revenue efficiency• Revenues have increased ~20% on 20% fewer departures, 5% fewer seats,
and 12% fewer aircraft since the merger
• Managing to a 20%+ annual ROIC target as capacity growth is driven by seat-density and upgauging vs. incremental aircraft purchases
• ROIC has improved by 25 points since merger
• Through consolidation, innovation, and capital discipline, Delta is uniquely positioned among high performing S&P industrial companies
3
Capital Efficiency
• Top-line growth, non-fuel cost productivity, and lower interest expense producing margin and earnings expansion
• $4-5B annual free cash flow driving progress towards investment grade balance sheet and increasing cash returns to shareholders
Delta’s ROIC, Free Cash Flow, and EPS growth are in the top 10% of S&P Industrials

4
Across The Board Improvement In The Business
• Delta continues to deliver industry leading operational reliability and customer satisfaction• LTM 3Q15 pretax margin expanded 320bps year over year and 800bps excluding hedges• Lowered adjusted net debt by more than $5 billion, while returning nearly $4 billion to
shareholders since 2012
Adjusted for special items
Pretax Income Operating Cash Flow ROIC
$4.1B
$5.4B
LTM 3Q14 LTM 3Q15
+34%
19.3%
26.3%
LTM 3Q14 LTM 3Q15
+700bps
$5.5B
$7.5B
LTM 3Q14 LTM 3Q15
+36%

5
Managing Capacity To Best Economic Opportunities
• Leveraging network opportunities in certain markets while maintaining system capacity discipline to improve unit revenues and margins
• Combination of domestic growth and the international reductions will result in flat system capacity for 4Q
– Conservative growth profile demonstrates Delta’s commitment to getting RASM on a positive trajectory
• Domestic demand is solid and growth takes advantage of previous investments in NY, LAX, and SEA – where we now offer a superior network, product and service– Initiatives are enhancing profitability and returns and
have allowed Delta to increase its domestic RASM premium to the industry
• Biggest opportunity for RASM improvement is in international network
– International capacity down 4.5% for 4Q– Reducing in challenging regions (Japan, Brazil, Russia),
with strategic growth in key markets (China, Mexico).– Ongoing focus on leveraging international partnerships
with AF/KLM, Virgin Atlantic, Aeromexico, GOL, and China Eastern
Capacity Levels – 4Q 2015 vs. 2014
YTD RASM vs. Industry
3.0%
-0.5% -1.0%
-11.0%
Domestic Latin Atlantic Pacific System
flat
114.0%
98.0% 101.0% 99.0%107.0%
Domestic Latin Atlantic Pacific System

6
Fuel Tailwind Accelerates In Second Half 2015
• Delta’s 2H15 all-in price per gallon will be ~35% lower than 1H15 and will be better than the industry average
• At current market prices, fuel declines will provide a net $2 billion benefit for Delta in 2015, with further $2 billion benefit in 2016– $1 move in crude impacts expense by $100
million annually– Roughly two-thirds of fuel savings are flowing
through to the bottom-line
• Delta’s fuel price in 2H is expected to be better than industry average
• Refinery provides a unique opportunity for Delta to benefit from lower domestic crude prices
– The refinery is expected to produce a ~$30 million dollar profit in 4Q, which will result in a ~$320 million full year contribution
Note: Delta fuel prices include taxes and transportation costs, and the impact of hedges and the refinery
$2.93
1Q15 2Q15 3Q15 4Q15E
Delta Jet Fuel Prices
$1.75-$1.80$1.80
$2.40
YoY: -3% -18% -38% -30-35%

Efficient Capacity Growth
• Drive capacity growth through better utilization of assets, producing more seat departures and higher capacity on a smaller fleet
• Focus capacity growth on large markets in conjunction with Delta partners
Revenue Premium
• Investments in network, product, and service and operations producing sustainable revenue gains
• Next phase of revenue initiatives focus on better customer segmentation and improved offerings for high-value customers
• Large ancillary opportunity diversifies revenue stream and is accretive to margins
Cost Productivity
• Maximizing the benefits of scale throughout the network to improve cost efficiency
• Focus on bringing fuel benefit to the bottom line
• Leveraging supply chain, technology and maintenance expertise to improve productivity
Capacity growth, a sustainable revenue premium and cost productivity combine to generate long-term revenue growth, margin expansion and greater cash generation
Continuing To Drive Margin Expansion
7

Investments in network, product, service, and operations have already produced solid, sustainable revenue gains with more room for growth
Network
Product
Service
• Optimizing capacity to leverage hub strengths and serve high revenue markets efficiently
• Refleeting and product investments increase the range and quality of products for domestic and international customers
• Operational reliability shows customers that we value their time
$28.5B$31.8B
$40B+
2005 2010 2015E
Total Revenue
40+%
Giving Customers What They Value Drives Revenue Growth
8
*2005 revenue adjusted to include Northwest Airlines
*

Solid pipeline of initiatives is the foundation that will allow Delta to absorb future cost increases
4.6%
2.4%
0.2% ~flat
<2.0%
2012 2013 2014 2015E LT Goal
Non-Fuel Unit Cost Growth
Ajusted for special items
Solid financial plan in place to deliver second consecutive year of sub-2% unit cost growth
• Delta’s compounded annual non-fuel cost growth since the merger has been below 2%
• Additional focus on keeping fixed cost base low– Roughly 55% of all-in unit costs are variable
• Benefits from upgauging, maintenance savings and productivity initiatives continue cost momentum
– Upgauging: Improved operating leverage to be achieved as modifications continue and increase the gauge on roughly 260 aircraft
– Refleeting: Retirement of older aircraft drives almost $200 million of maintenance savings in 2015
– Maintenance: Ongoing utilization of part-out materials
– Supply Chain: Leveraging scale to improve contract terms
– Technology: Improves front-line productivity and delivers an improved customer experience
Productivity Initiatives Driving Continued Cost Momentum
9

Reinvest In The Business
• ~50% of operating cash flow to be reinvested in the business
• Plan to invest $2.5 - $3 billion annually into fleet, products, facilities and technology
• Allows for replacement of 20% of Delta’s mainline fleet over next 3 years
Strengthen The Balance Sheet
• More than $10 billion in debt reduction since 2009
• Approaching $4 billion long-term adjusted net debt target
• Committed to ~$1 billion per year in pension funding
• Progress toward investment grade metrics evident in four S&P upgrades and three Moody’s upgrades since May 2013
• Current S&P and Fitch rating one notch away from investment grade
Return Cash To Shareholders
• Announced new $5 billion repurchase authorization through 2017
• Delta has now returned nearly $4 billion since 2012
• Will return at least 50% of free cash flow to shareholders until debt target is reached
Balanced approach to capital deployment has driven significant value for shareholders
Balanced Capital Deployment Drives Long-Term Value
10Expect to produce over $20 billion in operating cash flow from 2015-2017

Strong Cash Generation Funds Investment in The Future, Reductions in Leverage, and Capital Returns to Owners
• Strong operating cash flow, combined with disciplined capital spending, produces sustainable free cash flow of $4-5 billion annually
Note: Includes pre-merger NWA; Adjusted for special items 11
$2.6$3.8 $4.1
$4.8$4.1
$2.9$1.8 $1.3 $1.2 $0.9
$2.1 $2.6
$1.2 $1.3 $1.3$2.0
$2.9$2.1
$3.6
($2.0)
$0.0
$2.0
$4.0
$6.0
$8.0Capital Spending and Operating Cash Flow ($B)
CapEx Operating Cash Flow
$8.9 $10.7 $11.6$15.6
$18.6$22.0 $23.8
$26.5
$12.4 $11.2 $13.2$17.0 $17.0 $15.0 $12.9 $11.7 $9.4 $7.3 $6.8
Adjusted Net Debt ($B)

Increasing Shareholder Returns While Strengthening The Balance Sheet• Strong cash generation funds significant increase in shareholder returns, while also allowing for continued debt reduction
De-Risking the Balance Sheet Driving the Business for Cash Flow
• Target is to achieve and maintain $4 billion of adjusted net debt by 2017
• $4 billion optimal long-term debt level results in investment grade credit metrics, a manageable WACC, and lowers financial risk for the business
• Interest expense at $4 billion adjusted net debt will be $200 million annually – a reduction of $1.1 billion vs. 2009
• Plan to return at least 50% of free cash flow to shareholders through 2017
• Delta has demonstrated a willingness to accelerate buybacks with excess free cash flow
• Planned 2015 returns of $2.5B to shareholders are equal to ~7% of current market cap
Total Shareholder Returns(Dividends & Buybacks)Adjusted Net Debt
12
$17.0B
$9.4B $7.3B
$4B
2009 2013 2014 LT Target
$352M
$1,351M
$2,500M
2013 2014 2015E

Delta’s Stock Has Outperformed the Industrial Peers…
• Delta’s strong financial performance and balanced capital deployment strategy has driven share price appreciation well in excess of the peer group over the last several years
Stock Price Performance 2013 - Current
13Note: High quality industrial transports are companies with similar index characteristics to Delta – part of S&P 500 and Dow Transportation Index (CHRW, CSX, EXPD, FDX, KSU, NSC, R, UNP, UPS)
0%
50%
100%
150%
200%
250%
300%
350%
1Q13 2Q13 3Q13 4Q13 1Q14 2Q14 3Q14 4Q14 1Q15 2Q15 3Q15
Delta 327%
Airlines (XAL) 109%
High Quality Ind. Transports 34%
S&P 500 47%

• Plan targets compare favorably with other industrials and should help drive better valuations
…But Valuation Remains at a Significant Discount
15%+
10.3%8.1%
Delta High Qual.Ind.
Transports
S&PIndustrials
EPS Growth
$4-5B
$1.2B $1.6B
Delta High Qual.Ind.
Transports
S&PIndustrials
Free Cash Flow
Note: High quality industrial transports are companies with similar index characteristics to Delta – part of S&P 500 and Dow Transportation Index (CHRW, CSX, EXPD, FDX, KSU, NSC, R, UNP, UPS); For both peer groups, ROIC is the LTM 3Q15 average, shareholder returns are for FY14, and free cash flow and EPS growth are the 2014-16E (cons.) average. Data source is FactSet; Delta ROIC & P/E reflect benefit of NOLs; P/E and P/FCF as of 11/4/15; Adjusted for Special Items
8.2
22.1
17.5
Delta High Qual.Ind.
Transports
S&PIndustrials
14
Forward Price to Free Cash Flow
1.1% 1.6% 1.7%
6.4%3.1% 3.1%
Delta High Qual. Ind.Transports
S&PIndustrials
Repo Yield Dividend Yield
Shareholder Returns7.5%
4.7% 4.8%
9.5
15.3 16.3
Delta High Qual. Ind.
Transports
S&PIndustrials
Forward Price to Earnings
20-25%
22.3%
19.9%
Delta High Qual.Ind.
Transports
S&PIndustrials
ROIC


Non-GAAP Reconciliations
16

Non-GAAP Reconciliations
17
Non-GAAP Financial MeasuresDelta sometimes uses information ("non-GAAP financial measures") that is derived from the Consolidated Financial Statements, but that is not presented in accordance with accounting principles generally accepted in the U.S. (“GAAP”). Under the U.S. Securities and Exchange Commission rules, non-GAAP financial measures may be considered in addition to results prepared in accordance with GAAP, but should not be considered a substitute for or superior to GAAP results. The tables below show reconciliations of non-GAAP financial measures used in this release to the most directly comparable GAAP financial measures.
Forward Look ing Projections. Delta is unable to reconcile certain forward-looking projections to GAAP as the nature or amount of special items cannot be estimated at this time.

Non-GAAP Reconciliations
18
Total Operating Revenue, Combined
Return on Invested Capital
Delta Northwest CombinedPeriod FromJanuary 1 to
Year Ended October 29, Year Ended(in billions) December 31, 2008 2008 December 31, 2008Total operating revenue $ 22.7 $ 11.6 34.3$
Year EndedDecember 31, 2014
Total operating revenue $ 40.4
Change ~20%
Delta presents total operating revenue, combined as if the company's merger with Northwest Airlines had occurred at the beginning of the period presented because management believes this metric is helpful to investors to evaluate the company's combined operating revenue and provide a more meaningful comparison to our post-merger results.
Full Year(in billions, except % of return) 2009 2014 2015Adjusted book value of equity 12.9$ 17.8$ 17.6$ Average adjusted net debt 16.8 8.7 7.1 Average invested capital 29.7$ 26.5$ 24.7$ Adjusted total operating income 0.5$ 5.1$ 6.5$ Return on invested capital 1.5% 19.3% 26.3%
Last Twelve Months Ended September 30,
Delta presents return on invested capital as management believes this metric is helpful to investors in assessing the company’s ability to generate returns using its invested capital and as a measure against the industry. Return on invested capital is adjusted total operating income divided by average invested capital.

Non-GAAP Reconciliations
19
Pre-Tax Income and Pre-Tax Margin, Adjusted for Special Items
Fuel Hedges. Delta adjusts for settled fuel hedges to determine what pre-tax margin would be at market fuel prices. We believe adjusting pre-tax margin for fuel hedges allows investors to better understand and analyze the company's core operational performance, at market fuel prices, in the periods shown.
Refinery Sales. Delta's refinery segment provides jet fuel to the airline segment from its own production and from jet fuel obtained through agreements with third parties. Activities of the refinery segment are primarily for the benefit of the airline. However, from time to time, the refinery sells fuel by-products to third parties. These sales are recorded gross within other revenue and other operating expense. We believe adjusting pre-tax margin for refinery sales allows investors to better understand and analyze the impact of fuel cost on our results in the periods shown.
Delta adjusts for the following items to determine pre-tax income and pre-tax margin, adjusted, for the reasons described below:
Mark-to-market ("MTM") adjustments and settlements. MTM adjustments are defined as fair value changes recorded in periods other than the settlement period. Such fair value changes are not necessarily indicative of the actual settlement value of the underlying hedge in the contract settlement period. Settlements represent cash received or paid on hedge contracts settling during the period. These items adjust fuel expense to show the economic impact of hedging, including cash received or paid on hedge contracts during the period. Adjusting for these items allows investors to better understand and analyze the company's core operational performance in the periods shown.
Restructuring and other. Because of the variability in restructuring and other, the adjustment for this item is helpful to investors to analyze the company’s recurring core performance in the periods shown.
Loss on extinguishment of debt. Because of the variability in loss on extinguishment of debt, the adjustment for this item is helpful to investors to analyze the company’s recurring core financial performance in the periods shown.
Virgin Atlantic MTM adjustments. We record our proportionate share of earnings from our equity investment in Virgin Atlantic in other expense. We adjust for Virgin Atlantic's MTM adjustments to allow investors to better understand and analyze the company’s financial performance in the periods shown.
(in millions) 2014 2015Pre-tax income $ 2,687 $ 4,484 Adjusted for:
MTM adjustments and settlements 288 756 Restructuring and other 809 102 Loss on extinguishment of debt 263 5 Virgin Atlantic MTM adjustments 15 88
Pre-tax income, adjusted 4,062$ 5,435$
2014 2015Pre-tax margin 6.8% 11.0%Adjusted for:
MTM adjustments and settlements 0.7% 1.9%Restructuring and other 2.0% 0.2%Refinery sales - 0.1%Loss on extinguishment of debt 0.7% -Virgin Atlantic MTM adjustments - 0.2%
Pre-tax margin, adjusted 10.2% 13.4%Fuel hedges (0.7)% 4.1%Pre-tax margin, adjusted for fuel hedges 9.5% 17.5%
Last Twelve Months Ended September 30,
Last Twelve Months Ended September 30,

Non-GAAP Reconciliations
20
Adjusted Net Debt
(in billions)Debt and capital lease obligations 17.2$ 15.3$ 13.8$ 12.7$ 11.3$ 9.8$ Plus: unamortized discount, net from purchase accounting and fresh start reporting 1.1 0.6 0.6 0.5 0.4 0.1 Adjusted debt and capital lease obligations 18.3$ 15.9$ 14.4$ 13.2$ 11.7$ 9.9$ Plus: 7x last twelve months' aircraft rent 3.4 2.7 2.1 1.9 1.5 1.6 Adjusted total debt 21.7 18.6 16.5 15.1 13.2 11.5 Less: cash, cash equivalents and short-term investments (4.7) (3.6) (3.6) (3.4) (3.8) (3.3) Less: hedge margin receivable - - - - - (0.9) Adjusted net debt 17.0$ 15.0$ 12.9$ 11.7$ 9.4$ 7.3$
(in billions)Debt and capital lease obligations 8.8$ Plus: 7x last twelve months' aircraft rent 1.8 Adjusted total debt 10.6 Less: cash, cash equivalents and short-term investments (3.8) Less: hedge margin receivable (0.4) Adjusted net debt 6.4$
September 30, 2015
Delta uses adjusted total debt, including aircraft rent, in addition to long-term adjusted debt and capital leases, to present estimated financial obligations. Delta reduces adjusted debt by cash, cash equivalents and short-term investments, and hedge margin receivable, resulting in adjusted net debt, to present the amount of assets needed to satisfy the debt. Management believes this metric is helpful to investors in assessing the company’s overall debt profile. Management has reduced adjusted debt by the amount of hedge margin receivable, which reflects cash posted to counterparties, as we believe this removes the impact of current market volatility on our unsettled hedges and is a better representation of the continued progress we have made on our debt initiatives.
December 31, 2013 December 31, 2014December 31, 2009 December 31, 2012December 31, 2011December 31, 2010

Non-GAAP Reconciliations
21
Operating Cash Flow, Adjusted
Year Ended Year Ended Year Ended Year Ended(in billions) December 31, 2008 December 31, 2012 December 31, 2013 December 31, 2014Net cash provided by operating activities (GAAP) (1.7)$ 2.5$ 4.5$ 4.9$ Adjustments:
Hedge margin - - - 0.9SkyMiles used pursuant to advance purchase under AMEX agreement - 0.3 0.3 - Northwest operating cash flow 0.2 - - -
Operating cash flow, adjusted (1.5)$ 2.8$ 4.8$ 5.8$
(in billions) 2014 2015Net cash provided by operating activities (GAAP) 5.5$ 7.0$ Adjustments:
Hedge deferrals - 0.1 Hedge margin - 0.4 Reimbursements related to build-to-suit leased facilities (0.1) - SkyMiles used pursuant to advance purchase under AMEX agreement 0.1 -
Operating cash flow, adjusted 5.5$ 7.5$
Delta presents adjusted operating cash flow because management believes adjusting for these amounts provides a more meaningful financial measure for investors. Adjustments include:
Last Twelve Months Ended September 30,
Hedge margin. Delta adjusts for hedge margin as we believe this adjustment removes the impact of current market volatility on our unsettled hedges and allows investors to better understand and analyze the company's core operational performance in the periods shown.
Northwest operating cash flow. Included the Northwest Airlines operating cash flow as if the company’s merger with Northwest Airlines had occurred at the beginning of the period presented because management believes this metric is helpful to investors to evaluate the company’s combined operating cash flows and provide a more meaningful comparison to our post-merger amounts.
Reimbursements related to build-to-suit facilities and other. Management believes investors should be informed that these reimbursements for build-to-suit leased facilities effectively reduce net cash provided by operating activities and related capital expenditures.
Hedge deferrals. During the March 2015 quarter, we effectively deferred settlement of a portion of our hedge portfolio until 2016 by entering into fuel derivative transactions that, excluding market movements from the date of the transactions, would provide approximately $150 million in cash receipts during the September 2015 quarter and $150 million in cash receipts for the December 2015 quarter. Additionally, these transactions will require approximately $300 million in cash payments in 2016 (excluding market movements from the date of the transactions). By effectively deferring settlement of a portion of the original derivative transactions, the restructured hedge portfolio provides additional time for the fuel market to stabilize while adding some hedge protection in 2016. Operating cash flow is adjusted to include these deferral transactions in order to allow investors to better understand the net impact of hedging activities in the period shown.
Non-GAAP Reconciliations
22
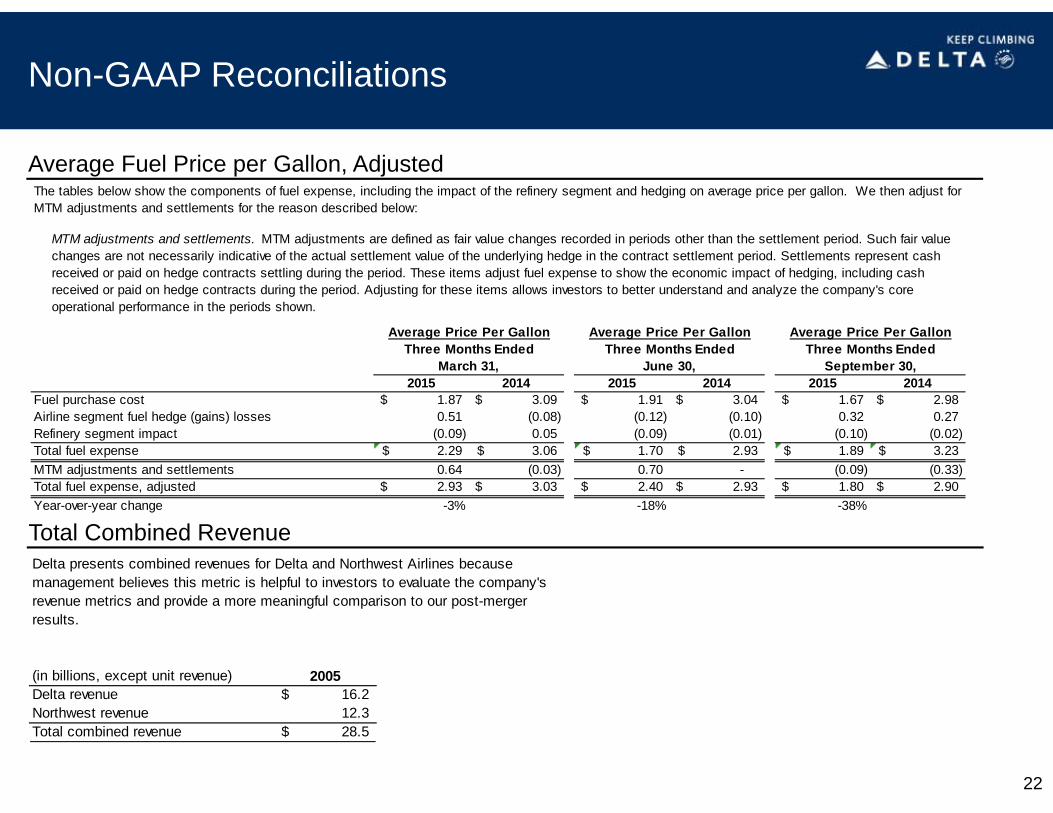
Average Fuel Price per Gallon, Adjusted
Total Combined Revenue
2015 2014 2015 2014 2015 2014Fuel purchase cost 1.87$ 3.09$ 1.91$ 3.04$ 1.67$ 2.98$ Airline segment fuel hedge (gains) losses 0.51 (0.08) (0.12) (0.10) 0.32 0.27 Refinery segment impact (0.09) 0.05 (0.09) (0.01) (0.10) (0.02) Total fuel expense 2.29$ 3.06$ 1.70$ 2.93$ 1.89$ 3.23$ MTM adjustments and settlements 0.64 (0.03) 0.70 - (0.09) (0.33) Total fuel expense, adjusted 2.93$ 3.03$ 2.40$ 2.93$ 1.80$ 2.90$ Year-over-year change -3% -18% -38%
Average Price Per GallonThree Months Ended
September 30,
The tables below show the components of fuel expense, including the impact of the refinery segment and hedging on average price per gallon. We then adjust for MTM adjustments and settlements for the reason described below:
MTM adjustments and settlements. MTM adjustments are defined as fair value changes recorded in periods other than the settlement period. Such fair value changes are not necessarily indicative of the actual settlement value of the underlying hedge in the contract settlement period. Settlements represent cash received or paid on hedge contracts settling during the period. These items adjust fuel expense to show the economic impact of hedging, including cash received or paid on hedge contracts during the period. Adjusting for these items allows investors to better understand and analyze the company's core operational performance in the periods shown.
Three Months EndedMarch 31,
Average Price Per GallonThree Months Ended
June 30,
Average Price Per Gallon
(in billions, except unit revenue) 2005Delta revenue 16.2$ Northwest revenue 12.3 Total combined revenue 28.5$
Delta presents combined revenues for Delta and Northwest Airlines because management believes this metric is helpful to investors to evaluate the company's revenue metrics and provide a more meaningful comparison to our post-merger results.

Non-GAAP Reconciliations
23
Non-Fuel Unit Cost or Cost per Available Seat Mile (“CASM-Ex”)
Capital Expenditures, Net
Year Ended Year Ended Year Ended Year EndedDecember 31, 2011 December 31, 2012 December 31, 2013 December 31, 2014
CASM (cents) 14.12 14.97 14.77 15.92 Adjusted for:
Aircraft fuel and related taxes (5.01) (5.31) (4.92) (5.64) (0.11) (0.16) (0.22) (0.45) (0.10) (0.20) (0.17) (0.30) (0.37) (0.38) (0.32) (0.37)
CASM-Ex 8.53 8.92 9.14 9.16 Year-over-year change 4.6% 2.4% 0.2%
CombinedLast Twelve Months Ended Year Ended
September 30, 2015 December 31, 2008CASM (cents) 14.43 19.40 Adjusted for:
Aircraft fuel and related taxes (4.20) (5.56) (0.56) - (0.04) -
- (0.59) - (4.79)
(0.50) (0.48) CASM-Ex 9.13 7.98 Compound Annual Growth Rate 1.9%
We adjust CASM for the following items to determine CASM-Ex for the reasons described below:
Profit sharingRestructuring and other Other expenses
Aircraft fuel and related taxes. The volatility in fuel prices impacts the comparability of year-over-year non-fuel financial performance. The adjustment for aircraft fuel and related taxes (including our regional carriers) allows investors to better understand and analyze our non-fuel costs and our year-over-year financial performance.
Profit sharing. We adjust for profit sharing because this adjustment allows investors to better understand and analyze our recurring cost performance and provides a more meaningful comparison of our core operating costs to the airline industry.
Restructuring and other. Because of the variability in restructuring and other, the adjustment for this item is helpful to investors to analyze the company’s recurring core operational performance in the periods shown.Other expenses. Other expenses include aircraft maintenance and staffing services we provide to third parties, our vacation wholesale operations, and refinery cost of sales to third parties. Because these businesses are not related to the generation of a seat mile, we adjust for the costs related to these sales to provide a more meaningful comparison of the costs of our airline operations to the rest of the airline industry.
Restructuring and merger-related items and Impairment of goodwill and other assets. The adjustment for restructuring and merger-related items and impairment of goodwill and other assets allows investors to more directly compare the company's recurring core cost performance since the merger of Delta and Northwest.
Profit sharingRestructuring and otherRestructuring and merger-related itemsImpairment of goodwill and other assetsOther expenses
Year Ended Year Ended Year Ended(in billions) December 31, 2008 December 31, 2013 December 31, 2014Property and equipment additions 1.5$ 2.6$ 2.2$ Reimbursements related to build-to-suit leased facilities and other - - (0.1) Investment in Virgin Atlantic - 0.3 - Northwest capital expenditures 1.1 - - Total combined capital expenditures, net 2.6$ 2.9$ 2.1$
Delta presents net capital expenditures because management believes adjusting for these amounts provides a more meaningful financial measure for investors. This metric is adjusted for reimbursements related to build-to-suit leased facilities and other because management believes investors should be informed that these reimbursements for build-to-suit leased facilities effectively reduce net cash provided by operating activities and related capital expenditures. Delta also presents combined capital expenditures, net as if the company's merger with Northwest Airlines had occurred at the beginning of the period presented because management believes this metric is helpful to investors to evaluate the company's combined investing activities and provide a more meaningful comparison to our post-merger results.