Embed Size (px)
Citation preview
D.A. Davidson Diversified Industrials &
Services ConferenceSeptember 23, 2021
1
David J. WilsonPresident and Chief Executive Officer
Gregory P. RustowiczVice President – Finance & Chief Financial Officer
2
Safe Harbor Statement
These slides, and the accompanying oral discussion (together, this “presentation”), contain “forward-looking statements” within the meaning of the Private Securities Litigation Reform Act of 1995. Such statements include, but are not limited to, statements concerning: future sales, earnings and plans; the success of the integration of Dorner Mfg. Corp. (“Dorner”) into Columbus McKinnon Corporation (the “Company”, “Columbus McKinnon”, “CMCO” or “our”) to achieve cost and revenue synergies and the amount of such synergies and integration costs; the ability of the Company to achieve market success and earnings per share accretion expectations; the ability of the Company to achieve its Blueprint for Growth 2.0 strategy, involve known and unknown risks, and are based upon current information and expectations. Actual results may differ materially from those anticipated if the information on which those estimates were based ultimately proves to be incorrect or as a result of certain risks and uncertainties that could cause our actual results to differ materially from the results expressed or implied by such statements, including the integration of Dorner into the Company to achieve cost and revenue synergies, the ability of the Company and Dorner to achieve revenue expectations, global economic and business conditions including the impact of COVID-19, conditions affecting the industries served by us and our subsidiaries, conditions affecting our customers and suppliers, competitor responses to our products and services, the overall market acceptance of such products and services, facility consolidations and other restructurings, the ability to expand into new markets and geographic regions, foreign currency fluctuations, the integration of acquisitions, including the acquisition of Dorner, and other factors disclosed in our periodic reports filed with the Securities and Exchange Commission. Consequently, such forward-looking statements should be regarded as our current plans, estimates and beliefs. Except as required by applicable law, we do not undertake and specifically decline any obligation to publicly release the results of any revisions to these forward-looking statements that may be made to reflect any future events or circumstances after the date of such statements or to reflect the occurrence of anticipated or unanticipated events.
Non-GAAP Financial MeasuresThis presentation will discuss some non-GAAP (“adjusted”) financial measures which we believe are useful in evaluating our performance. You should not consider the presentation of this additional information in isolation or as a substitute for results compared in accordance with GAAP. The non-GAAP (“adjusted”) measures are noted and reconciliations of comparable GAAP with non-GAAP measures can be found in tables included in the Supplemental Information portion of this presentation.
3
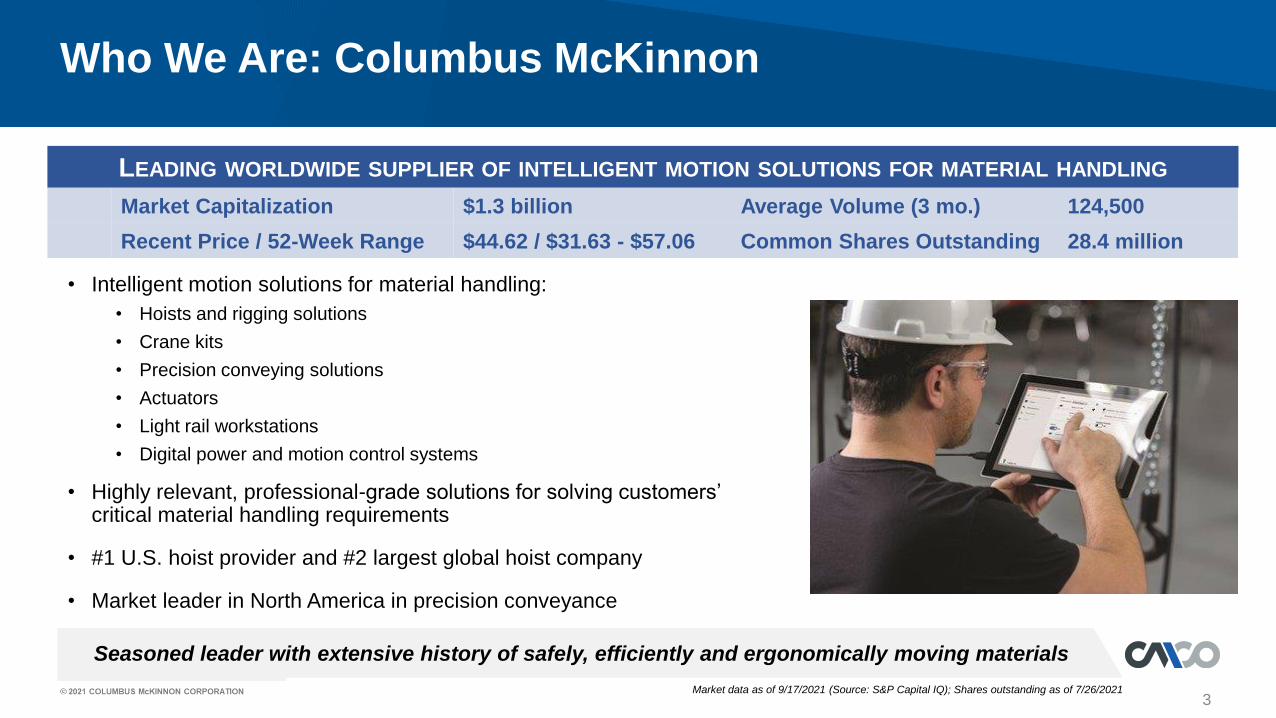
Seasoned leader with extensive history of safely, efficiently and ergonomically moving materials
Who We Are: Columbus McKinnon
• Intelligent motion solutions for material handling:
• Hoists and rigging solutions
• Crane kits
• Precision conveying solutions
• Actuators
• Light rail workstations
• Digital power and motion control systems
• Highly relevant, professional-grade solutions for solving customers’ critical material handling requirements
• #1 U.S. hoist provider and #2 largest global hoist company
• Market leader in North America in precision conveyance
LEADING WORLDWIDE SUPPLIER OF INTELLIGENT MOTION SOLUTIONS FOR MATERIAL HANDLING
Market Capitalization $1.3 billion Average Volume (3 mo.) 124,500
Recent Price / 52-Week Range $44.62 / $31.63 - $57.06 Common Shares Outstanding 28.4 million
Market data as of 9/17/2021 (Source: S&P Capital IQ); Shares outstanding as of 7/26/2021
4
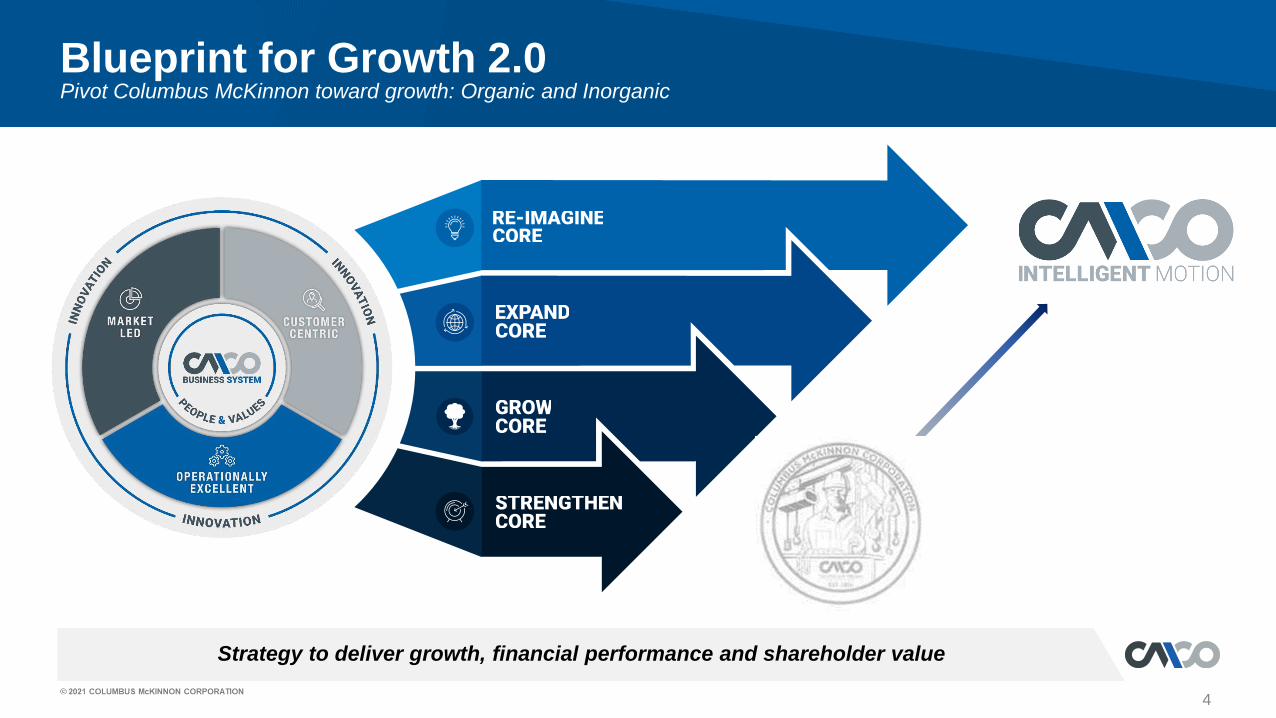
Strategy to deliver growth, financial performance and shareholder value
Blueprint for Growth 2.0Pivot Columbus McKinnon toward growth: Organic and Inorganic
5
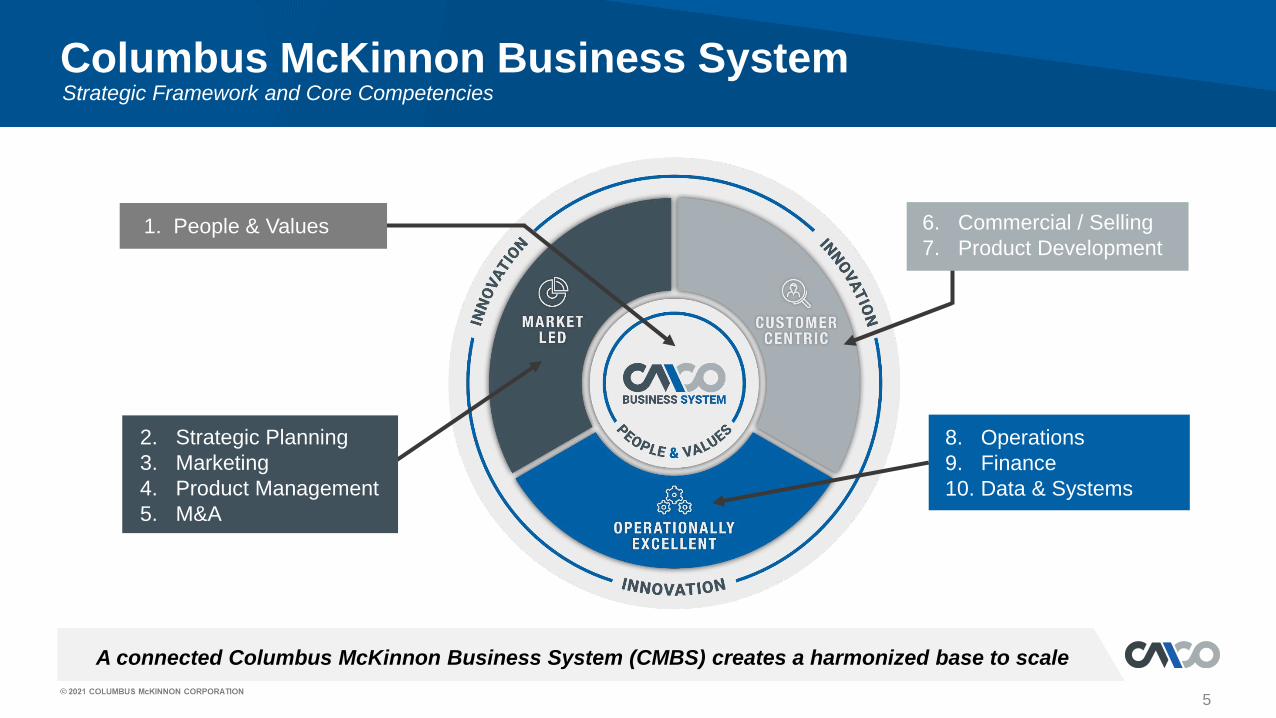
A connected Columbus McKinnon Business System (CMBS) creates a harmonized base to scale
Columbus McKinnon Business System
8. Operations
9. Finance
10. Data & Systems
6. Commercial / Selling
7. Product Development1. People & Values
2. Strategic Planning
3. Marketing
4. Product Management
5. M&A
Strategic Framework and Core Competencies
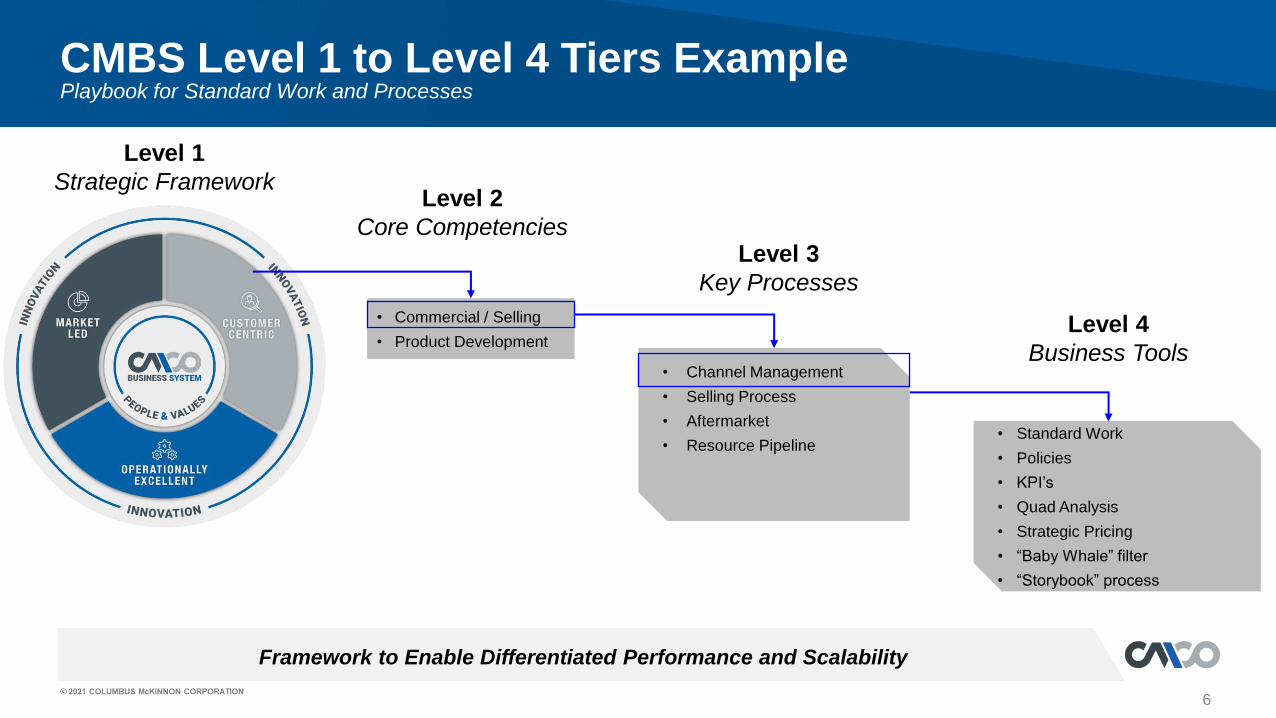
Framework to Enable Differentiated Performance and Scalability
CMBS Level 1 to Level 4 Tiers ExamplePlaybook for Standard Work and Processes
6
• Channel Management
• Selling Process
• Aftermarket
• Resource Pipeline• Standard Work
• Policies
• KPI’s
• Quad Analysis
• Strategic Pricing
• “Baby Whale” filter
• “Storybook” process
Level 1
Strategic FrameworkLevel 2
Core CompetenciesLevel 3
Key Processes
Level 4
Business Tools
• Commercial / Selling
• Product Development
7
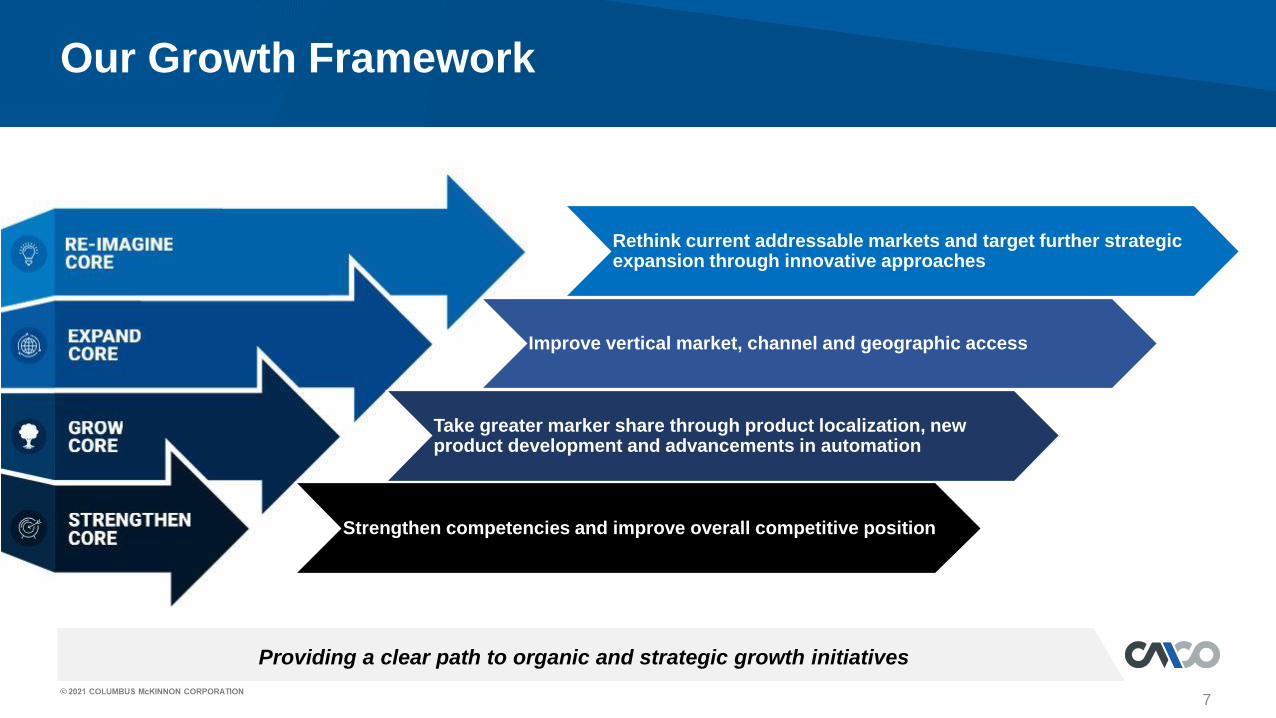
Our Growth Framework
Providing a clear path to organic and strategic growth initiatives
Rethink current addressable markets and target further strategic expansion through innovative approaches
Improve vertical market, channel and geographic access
Take greater marker share through product localization, new product development and advancements in automation
Strengthen competencies and improve overall competitive position
8
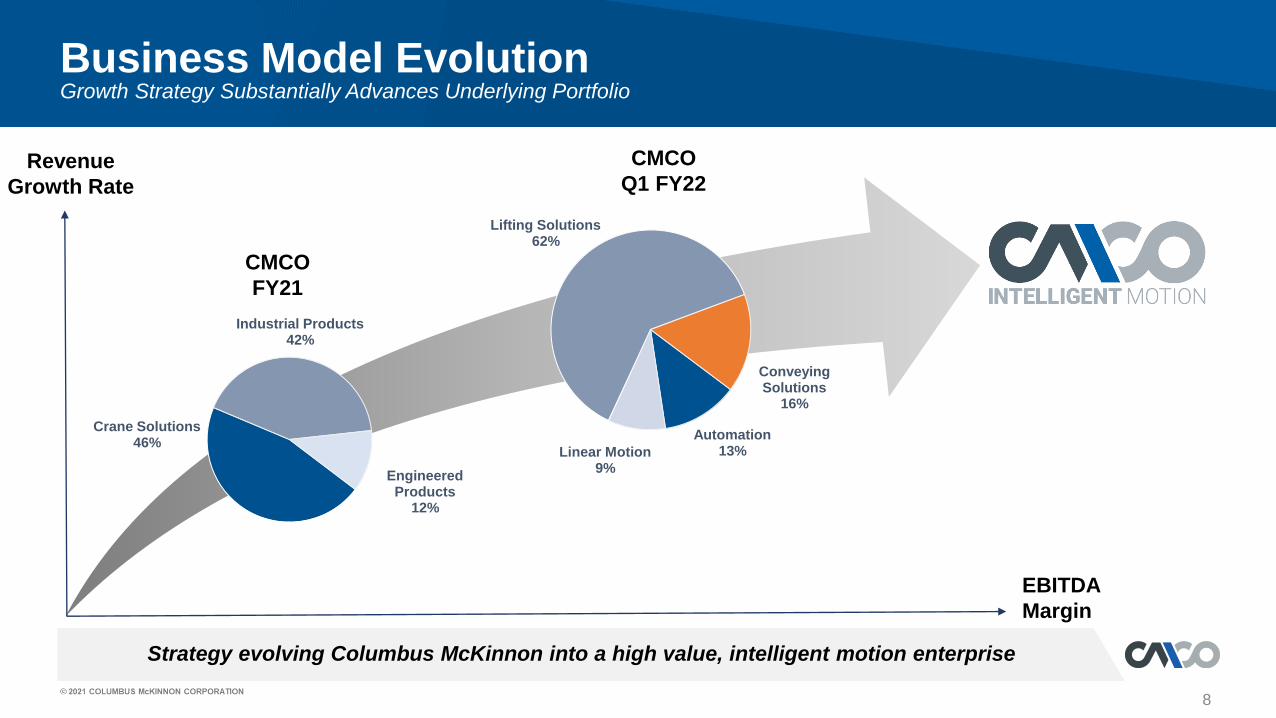
Strategy evolving Columbus McKinnon into a high value, intelligent motion enterprise
Business Model EvolutionGrowth Strategy Substantially Advances Underlying Portfolio
Revenue
Growth Rate
EBITDA
Margin
CMCO
FY21
CMCO
Q1 FY22
Crane Solutions46%
Industrial Products42%
Engineered Products
12%
Automation13%Linear Motion
9%
Lifting Solutions62%
ConveyingSolutions
16%
9
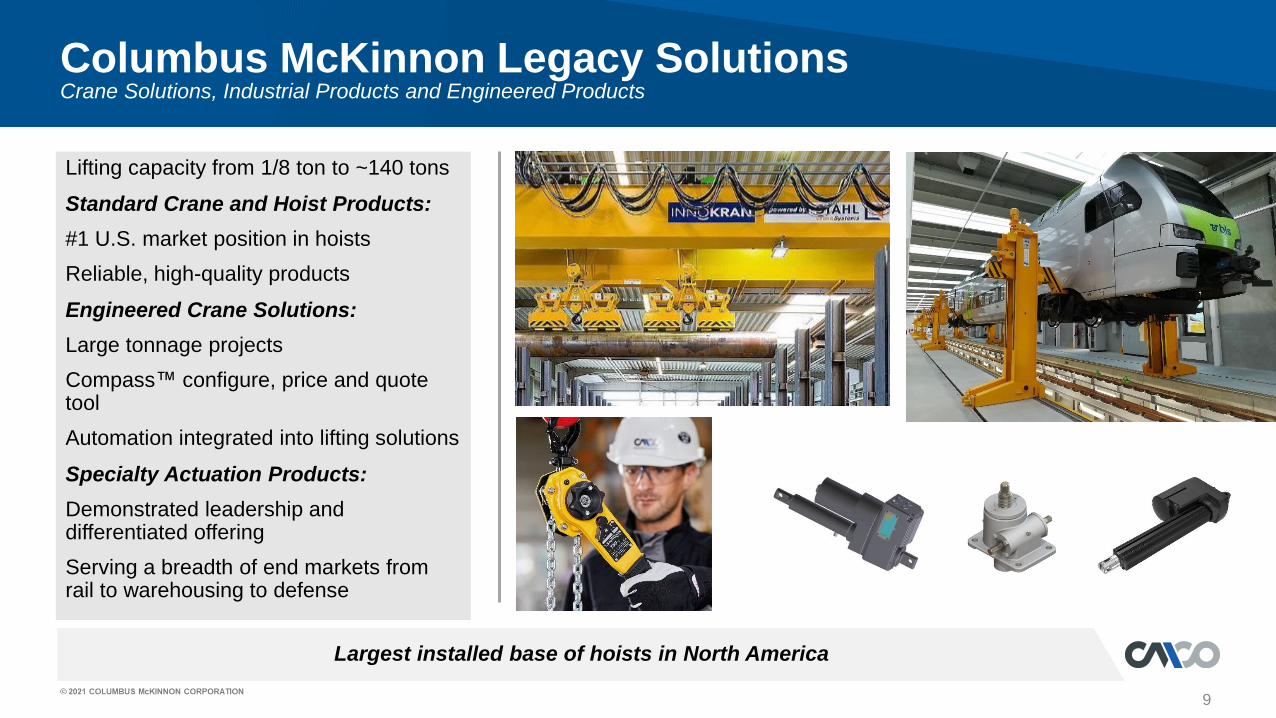
Largest installed base of hoists in North America
Columbus McKinnon Legacy SolutionsCrane Solutions, Industrial Products and Engineered Products
Lifting capacity from 1/8 ton to ~140 tons
Standard Crane and Hoist Products:
#1 U.S. market position in hoists
Reliable, high-quality products
Engineered Crane Solutions:
Large tonnage projects
Compass™ configure, price and quote tool
Automation integrated into lifting solutions
Specialty Actuation Products:
Demonstrated leadership and differentiated offering
Serving a breadth of end markets from rail to warehousing to defense
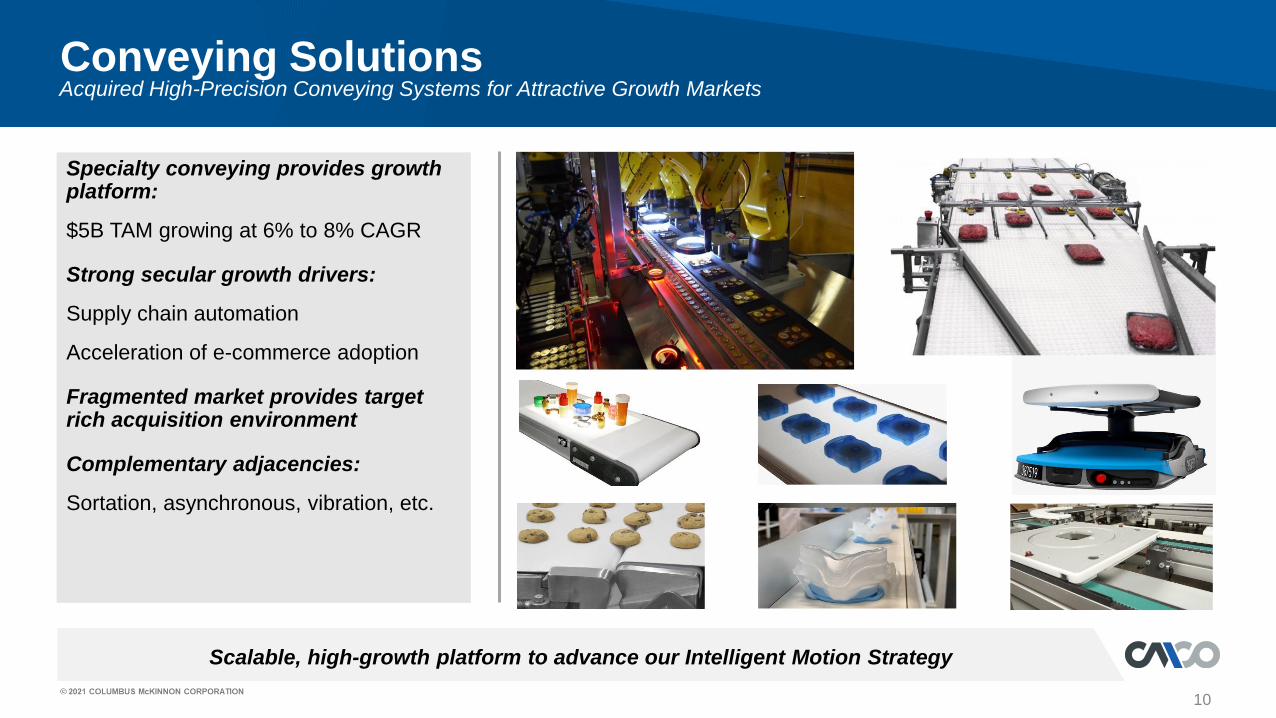
Conveying SolutionsAcquired High-Precision Conveying Systems for Attractive Growth Markets
Scalable, high-growth platform to advance our Intelligent Motion Strategy
10
Specialty conveying provides growth platform:
$5B TAM growing at 6% to 8% CAGR
Strong secular growth drivers:
Supply chain automation
Acceleration of e-commerce adoption
Fragmented market provides target rich acquisition environment
Complementary adjacencies:
Sortation, asynchronous, vibration, etc.
70
114
FY16* FY21
11
Leading high-precision conveyor automation platform for growth
Conveying Solutions Provide Higher Growth and Stronger MarginsDorner acquired on April 7, 2021
Additional platform of precision
conveying solutions to drive greater
scale
Provides higher margin profile
$5 million of annualized cost
synergies expected over two years
• Supply chain and material sourcing
• Operations
• Other cost savings opportunities including
professional services and back-office
efficiencies
Flexible Chain Low Profile
SanitaryLarge Scale
Product & Customer ExamplesDORNER
REVENUE ($M)
DORNER
ADJ. EBITDA ($M)
15
31
FY16* FY21
*FY16 information is for Dorner prior to being acquired and reflects fiscal year ended September 30, 2016. FY21 is for period ended March 31, 2021.
See Supplemental Slides for definition of Adjusted EBITDA and reconciliation from GAAP and other disclaimers regarding non-GAAP information.
New product development
Replacement cycleHigh-growth end
marketsPlatform for further
M&AGrowing installed
base
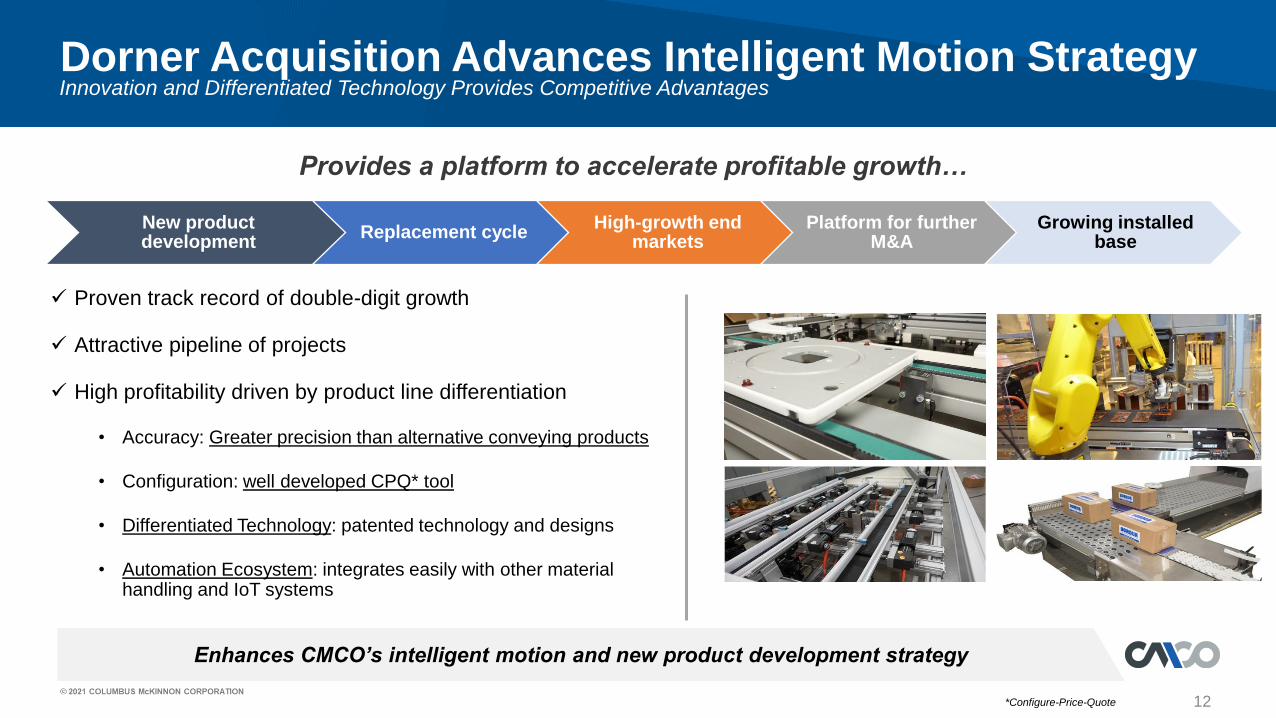
Dorner Acquisition Advances Intelligent Motion StrategyInnovation and Differentiated Technology Provides Competitive Advantages
Enhances CMCO’s intelligent motion and new product development strategy
Provides a platform to accelerate profitable growth…
✓ Proven track record of double-digit growth
✓ Attractive pipeline of projects
✓ High profitability driven by product line differentiation
• Accuracy: Greater precision than alternative conveying products
• Configuration: well developed CPQ* tool
• Differentiated Technology: patented technology and designs
• Automation Ecosystem: integrates easily with other material handling and IoT systems
12*Configure-Price-Quote
1313
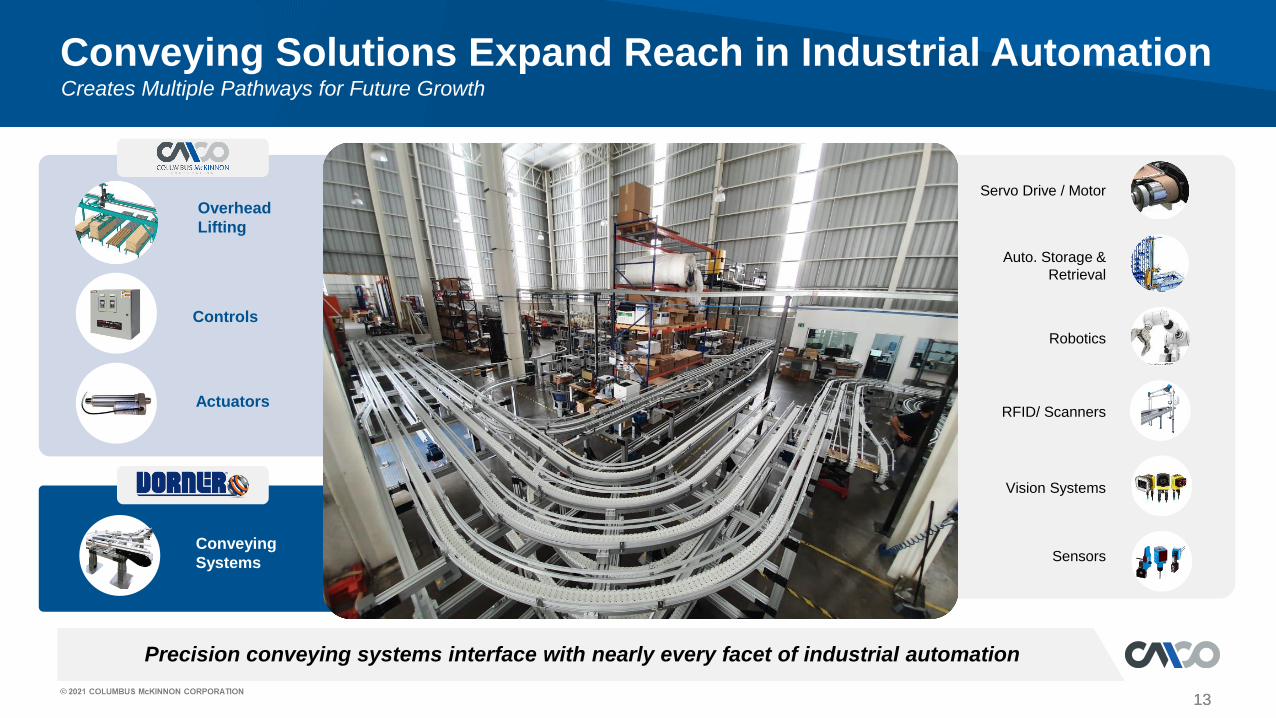
Conveying Solutions Expand Reach in Industrial Automation
Precision conveying systems interface with nearly every facet of industrial automation
Creates Multiple Pathways for Future Growth
Overhead
Lifting
Controls
Actuators
Servo Drive / Motor
Vision Systems
Sensors
Robotics
RFID/ Scanners
Auto. Storage &
Retrieval
Conveying
Systems
14
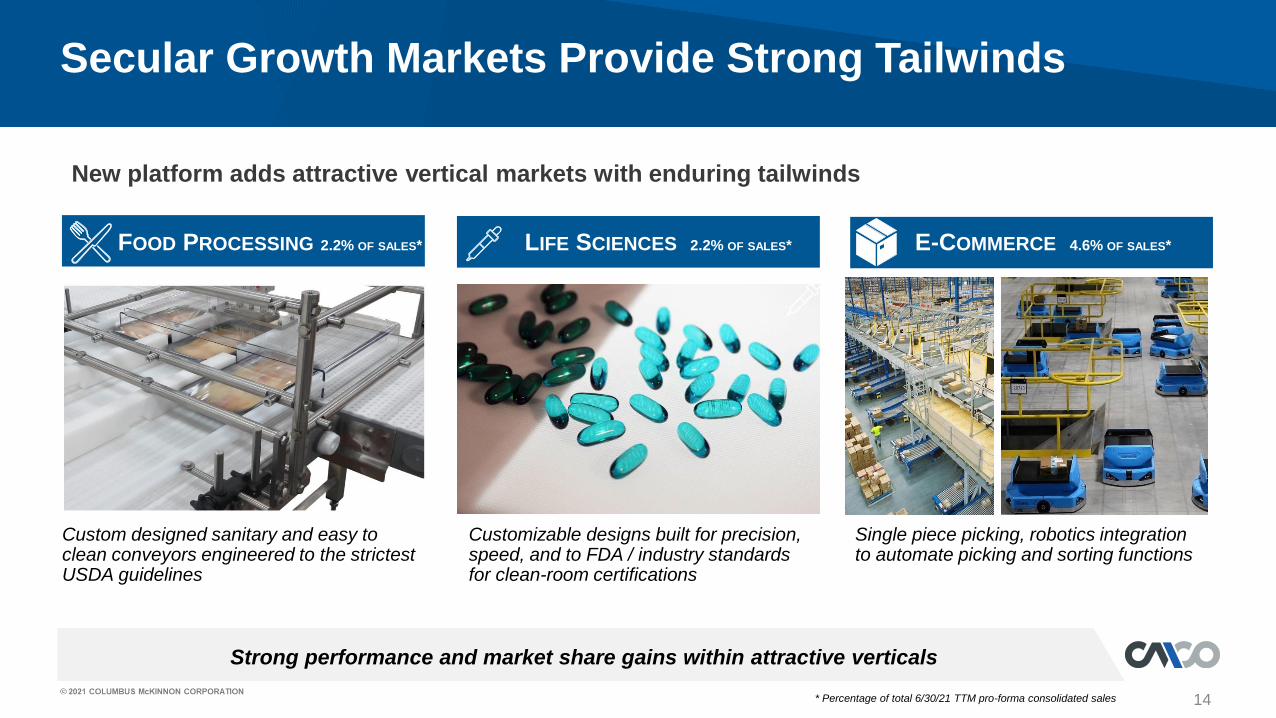
LIFE SCIENCES 2.2% OF SALES* E-COMMERCE 4.6% OF SALES*FOOD PROCESSING 2.2% OF SALES*
Secular Growth Markets Provide Strong Tailwinds
Strong performance and market share gains within attractive verticals
Single piece picking, robotics integration to automate picking and sorting functions
Custom designed sanitary and easy to clean conveyors engineered to the strictest USDA guidelines
Customizable designs built for precision, speed, and to FDA / industry standards for clean-room certifications
New platform adds attractive vertical markets with enduring tailwinds
* Percentage of total 6/30/21 TTM pro-forma consolidated sales
15
Improved customer experience, safety and productivity at the core of new product development
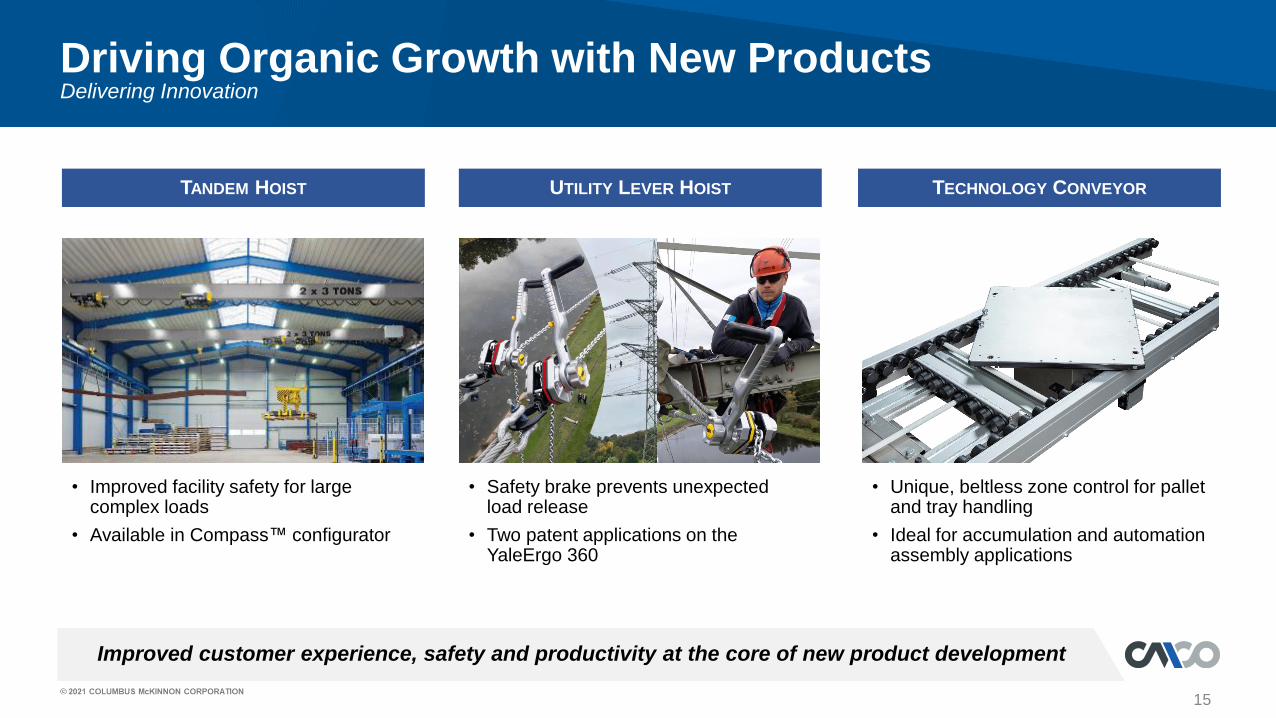
Driving Organic Growth with New ProductsDelivering Innovation
• Safety brake prevents unexpectedload release
• Two patent applications on the YaleErgo 360
• Unique, beltless zone control for pallet and tray handling
• Ideal for accumulation and automation assembly applications
• Improved facility safety for large complex loads
• Available in Compass™ configurator
TECHNOLOGY CONVEYORUTILITY LEVER HOISTTANDEM HOIST
16
Creating competitive advantages with pre-engineered automation solutions
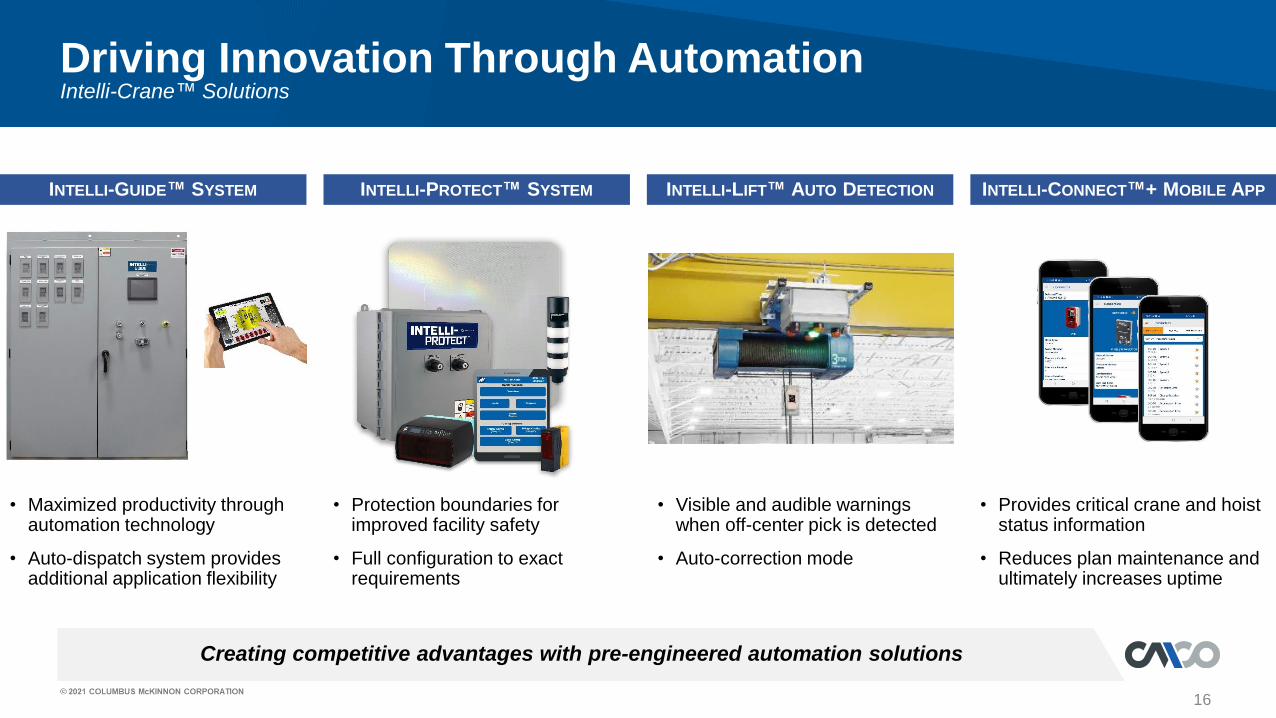
Driving Innovation Through Automation
• Visible and audible warnings when off-center pick is detected
• Auto-correction mode
• Provides critical crane and hoist status information
• Reduces plan maintenance and ultimately increases uptime
INTELLI-LIFT™ AUTO DETECTION INTELLI-CONNECT™+ MOBILE APPINTELLI-PROTECT™ SYSTEMINTELLI-GUIDE™ SYSTEM
• Protection boundaries for improved facility safety
• Full configuration to exact requirements
• Maximized productivity through automation technology
• Auto-dispatch system provides additional application flexibility
Intelli-Crane™ Solutions
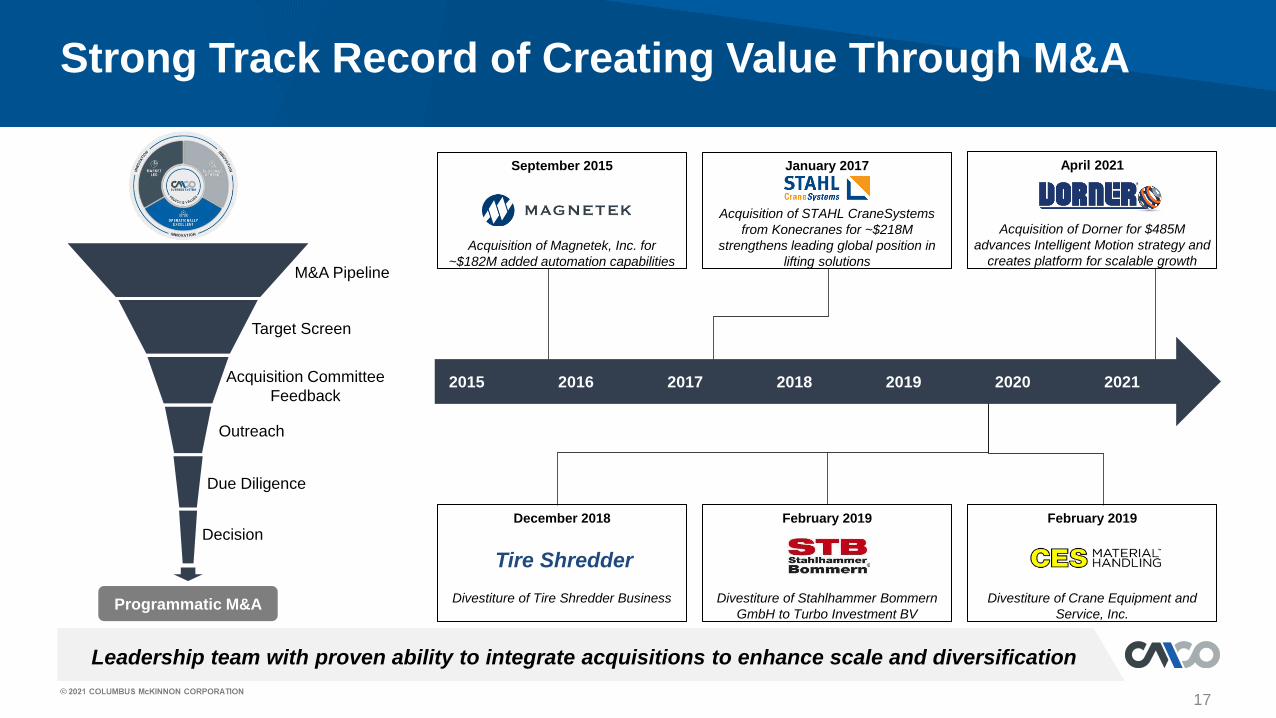
January 2017
Acquisition of STAHL CraneSystems
from Konecranes for ~$218M
strengthens leading global position in
lifting solutions
Leadership team with proven ability to integrate acquisitions to enhance scale and diversification
17
Strong Track Record of Creating Value Through M&A
Programmatic M&A
M&A Pipeline
Target Screen
Acquisition Committee
Feedback
Outreach
Due Diligence
Decision
2016 2017 2018 2019 2020 2021
September 2015
Acquisition of Magnetek, Inc. for
~$182M added automation capabilities
February 2019
Divestiture of Stahlhammer Bommern
GmbH to Turbo Investment BV
April 2021
Acquisition of Dorner for $485M
advances Intelligent Motion strategy and
creates platform for scalable growth
February 2019
Divestiture of Crane Equipment and
Service, Inc.
December 2018
Divestiture of Tire Shredder Business
Tire Shredder
2015
18
Business strategy driving margin improvement
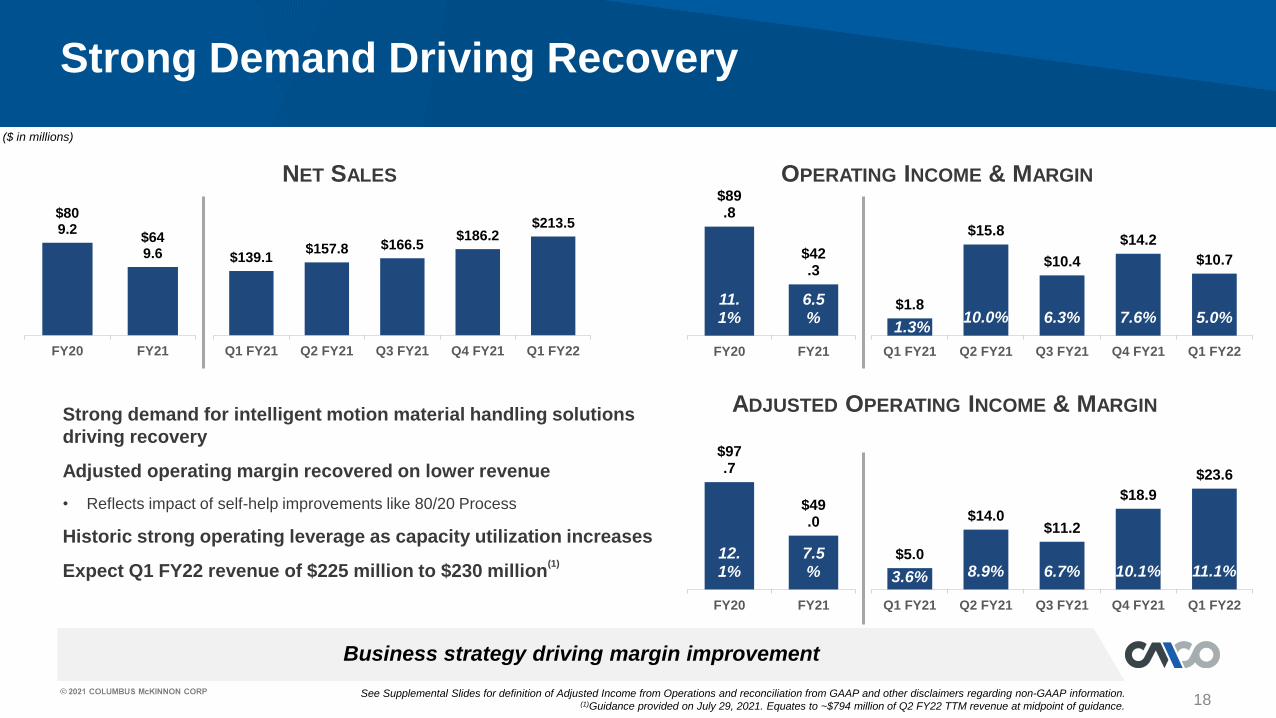
Strong Demand Driving Recovery
NET SALES
$139.1$157.8 $166.5
$186.2$213.5
Q1 FY21 Q2 FY21 Q3 FY21 Q4 FY21 Q1 FY22
OPERATING INCOME & MARGIN
9.1%9.4% 11.4% 12.1%
$1.8
$15.8
$10.4
$14.2
$10.7
1.3%10.0% 6.3% 7.6% 5.0%
Q1 FY21 Q2 FY21 Q3 FY21 Q4 FY21 Q1 FY22
ADJUSTED OPERATING INCOME & MARGIN
9.4% 11.4% 12.1% 7.5% 9.3%
Strong demand for intelligent motion material handling solutions
driving recovery
Adjusted operating margin recovered on lower revenue
• Reflects impact of self-help improvements like 80/20 Process
Historic strong operating leverage as capacity utilization increases
Expect Q1 FY22 revenue of $225 million to $230 million(1)
See Supplemental Slides for definition of Adjusted Income from Operations and reconciliation from GAAP and other disclaimers regarding non-GAAP information.(1)Guidance provided on July 29, 2021. Equates to ~$794 million of Q2 FY22 TTM revenue at midpoint of guidance.
$809.2
$649.6
FY20 FY21
$89.8
$42.3
11.1%
6.5%
FY20 FY21
$5.0
$14.0 $11.2
$18.9
$23.6
3.6% 8.9% 6.7% 10.1% 11.1%
Q1 FY21 Q2 FY21 Q3 FY21 Q4 FY21 Q1 FY22
$97.7
$49.0
12.1%
7.5%
FY20 FY21
($ in millions)
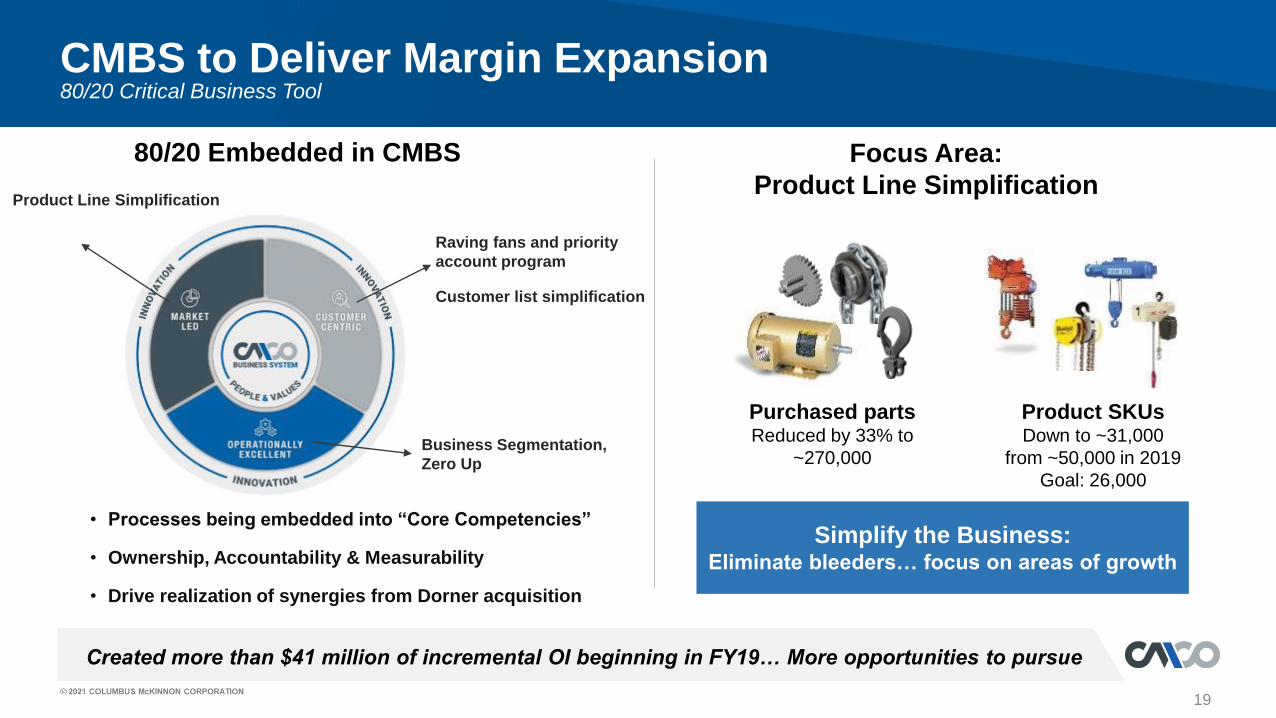
Created more than $41 million of incremental OI beginning in FY19… More opportunities to pursue
CMBS to Deliver Margin Expansion80/20 Critical Business Tool
Product SKUsDown to ~31,000
from ~50,000 in 2019
Goal: 26,000
Purchased partsReduced by 33% to
~270,000
Simplify the Business:Eliminate bleeders… focus on areas of growth
Raving fans and priority
account program
Customer list simplification
19
Product Line Simplification
Business Segmentation,
Zero Up
• Processes being embedded into “Core Competencies”
• Ownership, Accountability & Measurability
• Drive realization of synergies from Dorner acquisition
Focus Area:
Product Line Simplification
80/20 Embedded in CMBS
20
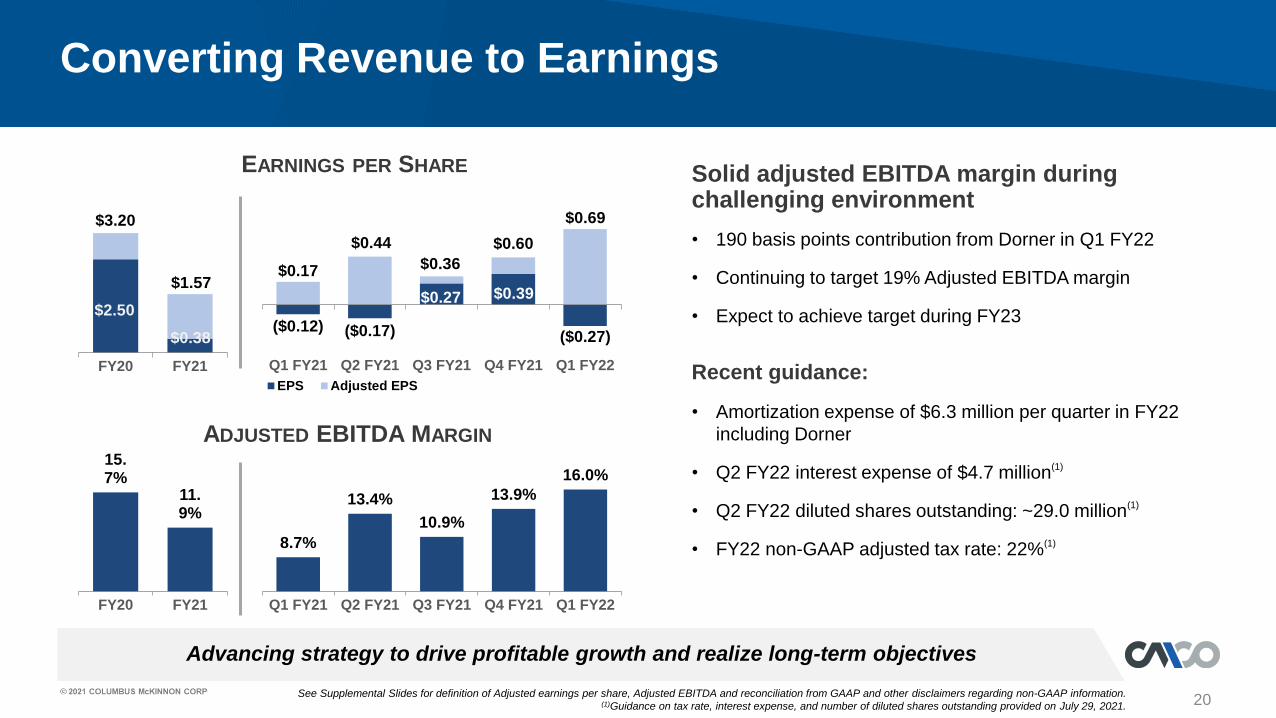
Advancing strategy to drive profitable growth and realize long-term objectives
Converting Revenue to Earnings
ADJUSTED EBITDA MARGIN
Solid adjusted EBITDA margin during challenging environment
8.7%
13.4%
10.9%
13.9%
16.0%
Q1 FY21 Q2 FY21 Q3 FY21 Q4 FY21 Q1 FY22
• 190 basis points contribution from Dorner in Q1 FY22
• Continuing to target 19% Adjusted EBITDA margin
• Expect to achieve target during FY23
Recent guidance:
• Amortization expense of $6.3 million per quarter in FY22
including Dorner
• Q2 FY22 interest expense of $4.7 million(1)
• Q2 FY22 diluted shares outstanding: ~29.0 million(1)
• FY22 non-GAAP adjusted tax rate: 22%(1)
EARNINGS PER SHARE
($0.12) ($0.17)
$0.27 $0.39
($0.27)
$0.17
$0.44
$0.36
$0.60
$0.69
Q1 FY21 Q2 FY21 Q3 FY21 Q4 FY21 Q1 FY22
EPS Adjusted EPS
See Supplemental Slides for definition of Adjusted earnings per share, Adjusted EBITDA and reconciliation from GAAP and other disclaimers regarding non-GAAP information.(1)Guidance on tax rate, interest expense, and number of diluted shares outstanding provided on July 29, 2021.
$2.50
$0.38
$3.20
$1.57
FY20 FY21
15.7%
11.9%
FY20 FY21
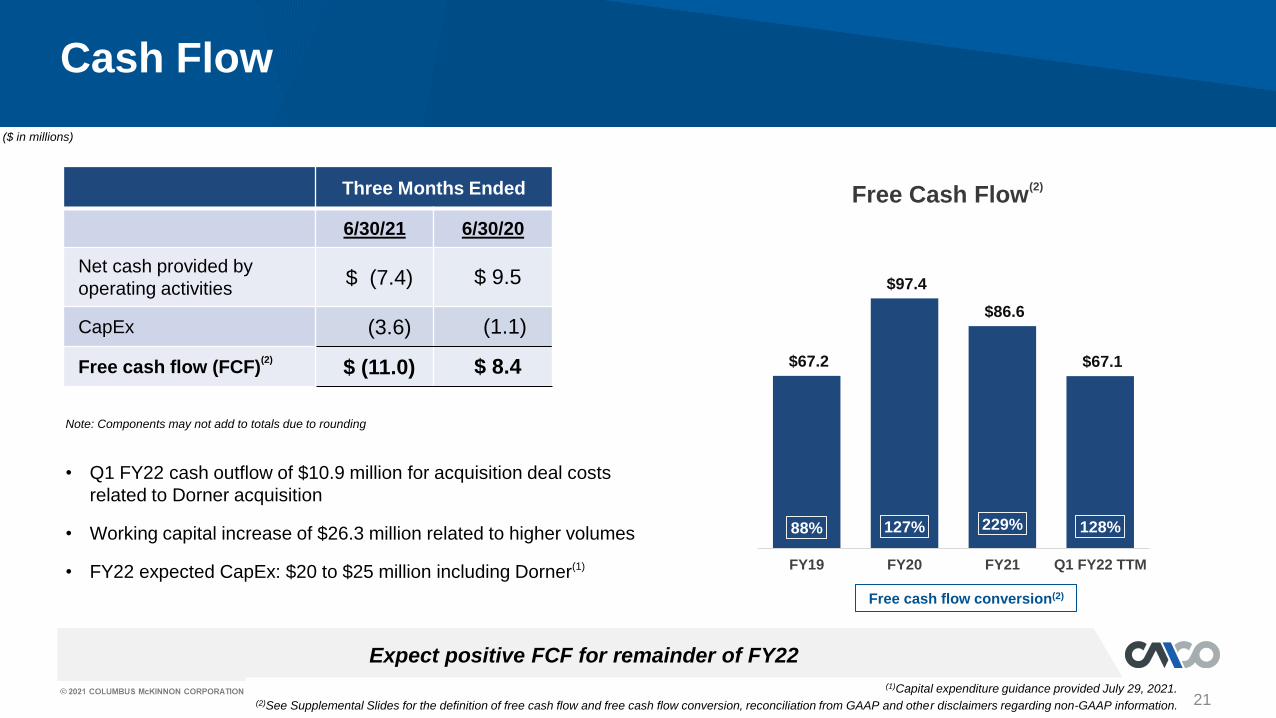
$67.2
$97.4
$86.6
$67.1
88% 127% 229% 128%
FY19 FY20 FY21 Q1 FY22 TTM
21
Free Cash Flow(2)
Cash Flow
• Q1 FY22 cash outflow of $10.9 million for acquisition deal costs
related to Dorner acquisition
• Working capital increase of $26.3 million related to higher volumes
• FY22 expected CapEx: $20 to $25 million including Dorner(1)
Three Months Ended
6/30/21 6/30/20
Net cash provided by
operating activities$ (7.4) $ 9.5
CapEx (3.6) (1.1)
Free cash flow (FCF)(2)
$ (11.0) $ 8.4
Expect positive FCF for remainder of FY22
Note: Components may not add to totals due to rounding
(1)Capital expenditure guidance provided July 29, 2021.(2)See Supplemental Slides for the definition of free cash flow and free cash flow conversion, reconciliation from GAAP and other disclaimers regarding non-GAAP information.
Free cash flow conversion(2)
($ in millions)
22
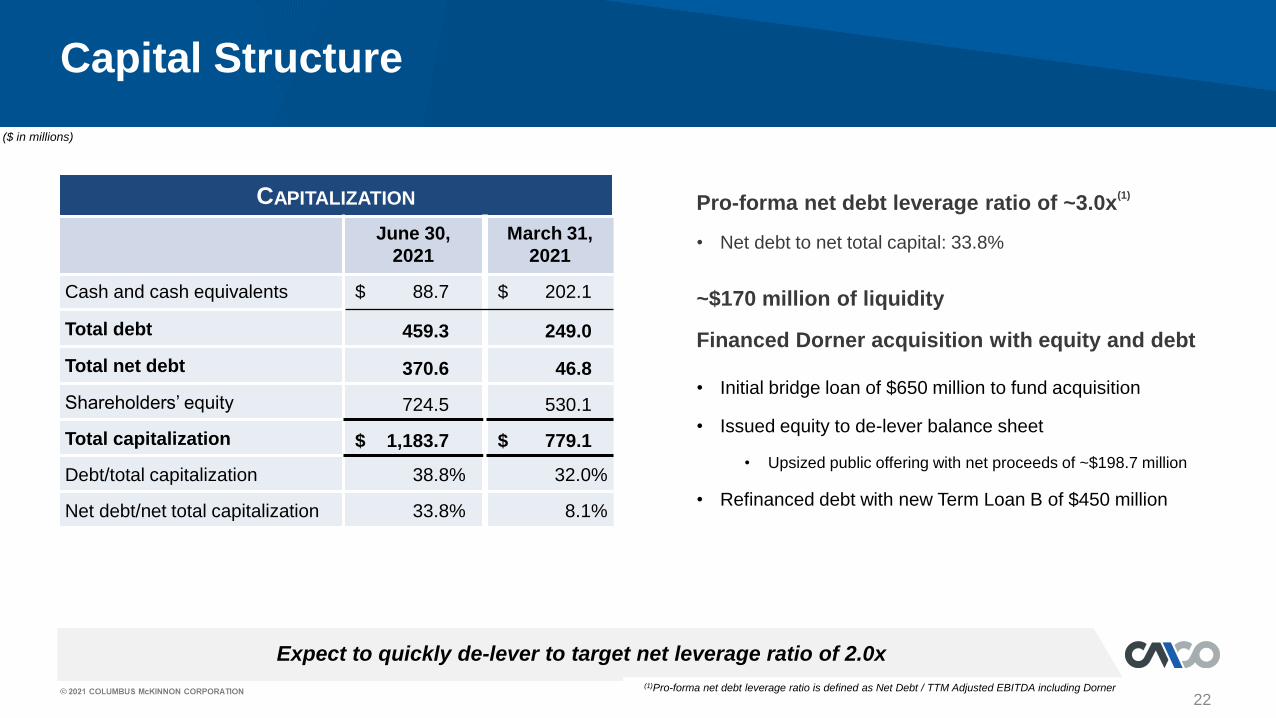
Expect to quickly de-lever to target net leverage ratio of 2.0x
Capital Structure
(1)Pro-forma net debt leverage ratio is defined as Net Debt / TTM Adjusted EBITDA including Dorner
CAPITALIZATION
June 30,
2021
March 31,
2021
Cash and cash equivalents $ 88.7 $ 202.1
Total debt 459.3 249.0
Total net debt 370.6 46.8
Shareholders’ equity 724.5 530.1
Total capitalization $ 1,183.7 $ 779.1
Debt/total capitalization 38.8% 32.0%
Net debt/net total capitalization 33.8% 8.1%
Pro-forma net debt leverage ratio of ~3.0x(1)
• Net debt to net total capital: 33.8%
~$170 million of liquidity
Financed Dorner acquisition with equity and debt
• Initial bridge loan of $650 million to fund acquisition
• Issued equity to de-lever balance sheet
• Upsized public offering with net proceeds of ~$198.7 million
• Refinanced debt with new Term Loan B of $450 million
($ in millions)
23
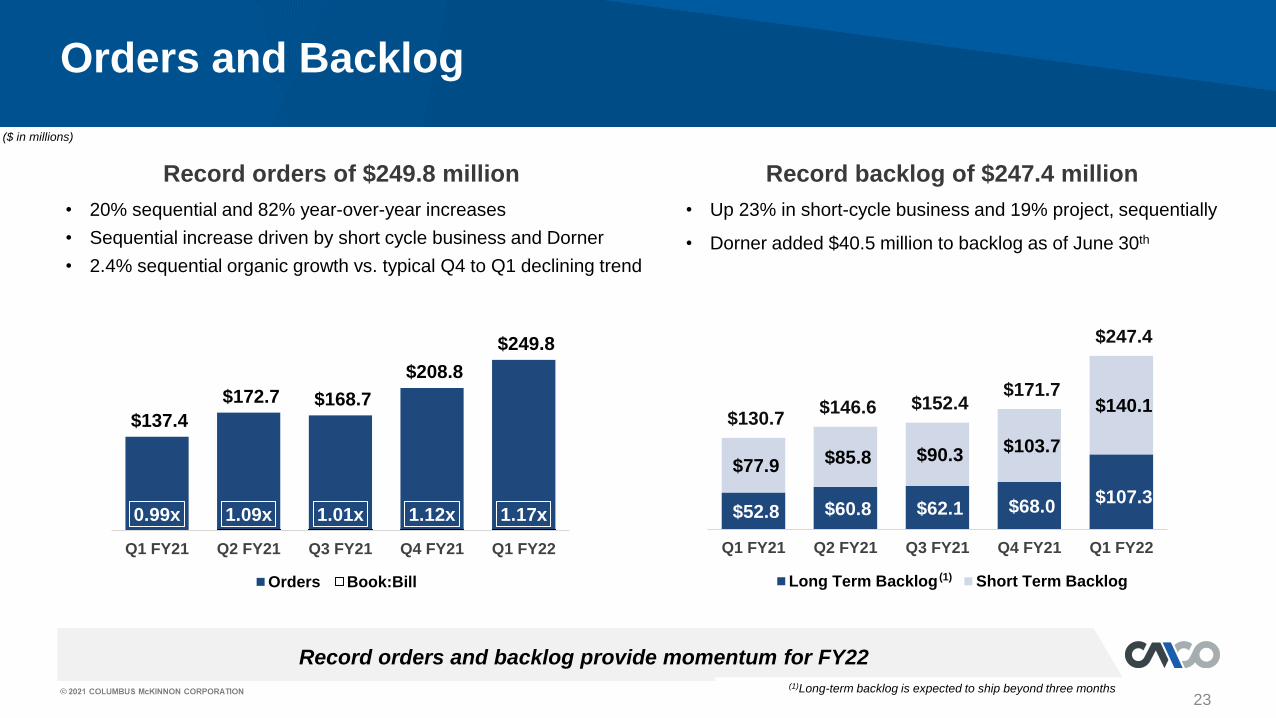
Record orders of $249.8 million Record backlog of $247.4 million
Orders and Backlog
• 20% sequential and 82% year-over-year increases
• Sequential increase driven by short cycle business and Dorner
• 2.4% sequential organic growth vs. typical Q4 to Q1 declining trend
• Up 23% in short-cycle business and 19% project, sequentially
• Dorner added $40.5 million to backlog as of June 30th
Record orders and backlog provide momentum for FY22
$137.4
$172.7 $168.7
$208.8
$249.8
0.99x 1.09x 1.01x 1.12x 1.17x
Q1 FY21 Q2 FY21 Q3 FY21 Q4 FY21 Q1 FY22
Orders Book:Bill
(1)Long-term backlog is expected to ship beyond three months
$52.8 $60.8 $62.1 $68.0 $107.3
$77.9 $85.8 $90.3 $103.7
$140.1 $130.7
$146.6 $152.4 $171.7
$247.4
Q1 FY21 Q2 FY21 Q3 FY21 Q4 FY21 Q1 FY22
Long Term Backlog Short Term Backlog(1)
($ in millions)
24
Excited about positive momentum and long-term potential for value creation
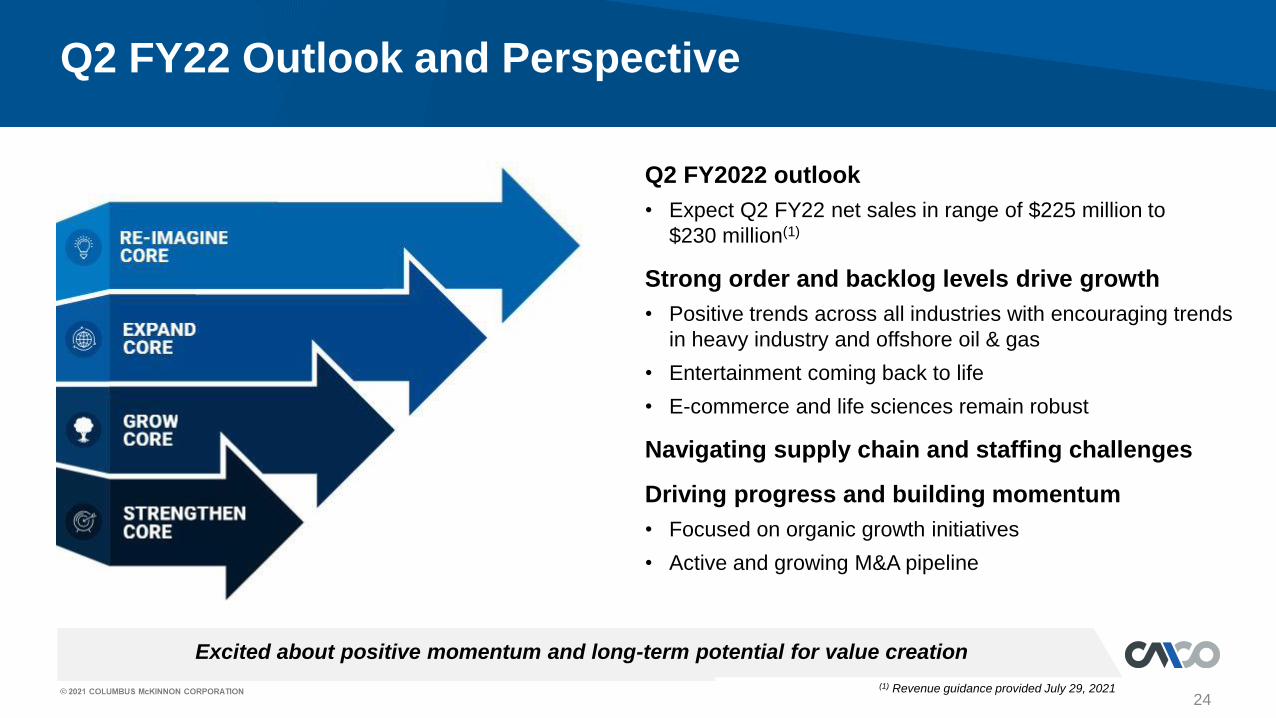
Q2 FY22 Outlook and Perspective
Q2 FY2022 outlook
• Expect Q2 FY22 net sales in range of $225 million to
$230 million(1)
Strong order and backlog levels drive growth
• Positive trends across all industries with encouraging trends
in heavy industry and offshore oil & gas
• Entertainment coming back to life
• E-commerce and life sciences remain robust
Navigating supply chain and staffing challenges
Driving progress and building momentum
• Focused on organic growth initiatives
• Active and growing M&A pipeline
(1) Revenue guidance provided July 29, 2021
25
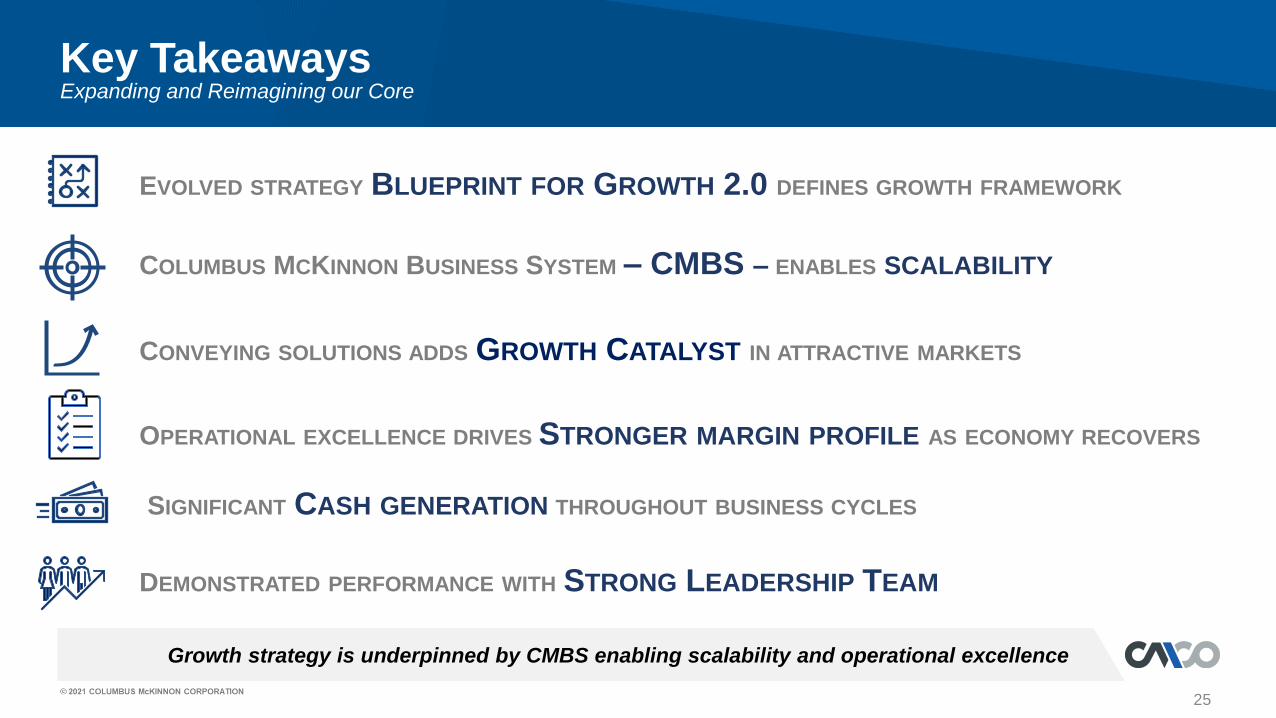
Key TakeawaysExpanding and Reimagining our Core
Growth strategy is underpinned by CMBS enabling scalability and operational excellence
EVOLVED STRATEGY BLUEPRINT FOR GROWTH 2.0 DEFINES GROWTH FRAMEWORK
COLUMBUS MCKINNON BUSINESS SYSTEM – CMBS – ENABLES SCALABILITY
CONVEYING SOLUTIONS ADDS GROWTH CATALYST IN ATTRACTIVE MARKETS
OPERATIONAL EXCELLENCE DRIVES STRONGER MARGIN PROFILE AS ECONOMY RECOVERS
DEMONSTRATED PERFORMANCE WITH STRONG LEADERSHIP TEAM
SIGNIFICANT CASH GENERATION THROUGHOUT BUSINESS CYCLES
D.A. Davidson Diversified Industrials &
Services ConferenceSeptember 23, 2021
26
Supplemental Information
27
28
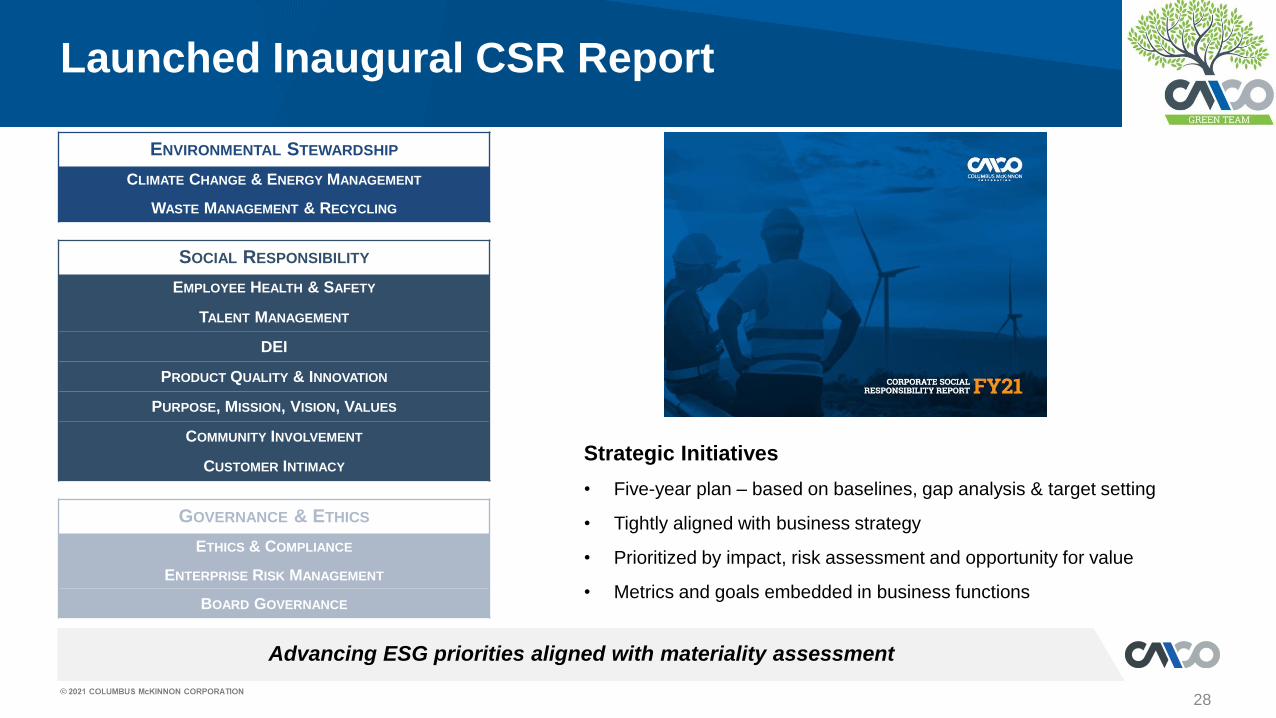
Advancing ESG priorities aligned with materiality assessment
Launched Inaugural CSR Report
Strategic Initiatives
• Five-year plan – based on baselines, gap analysis & target setting
• Tightly aligned with business strategy
• Prioritized by impact, risk assessment and opportunity for value
• Metrics and goals embedded in business functions
ENVIRONMENTAL STEWARDSHIP
CLIMATE CHANGE & ENERGY MANAGEMENT
WASTE MANAGEMENT & RECYCLING
SOCIAL RESPONSIBILITY
EMPLOYEE HEALTH & SAFETY
TALENT MANAGEMENT
DEI
PRODUCT QUALITY & INNOVATION
PURPOSE, MISSION, VISION, VALUES
COMMUNITY INVOLVEMENT
CUSTOMER INTIMACY
GOVERNANCE & ETHICS
ETHICS & COMPLIANCE
ENTERPRISE RISK MANAGEMENT
BOARD GOVERNANCE
29
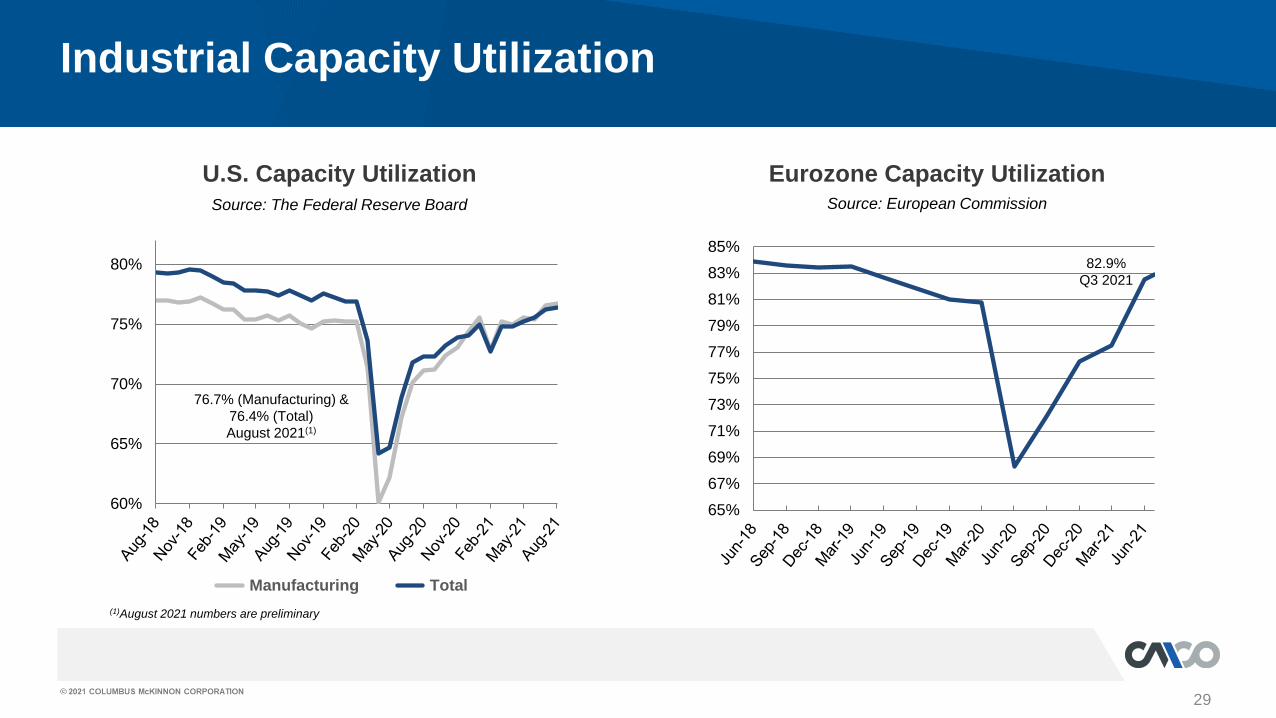
U.S. Capacity Utilization Eurozone Capacity Utilization
Industrial Capacity Utilization
Source: The Federal Reserve Board Source: European Commission
60%
65%
70%
75%
80%
Manufacturing Total
76.7% (Manufacturing) &
76.4% (Total)
August 2021(1)
65%
67%
69%
71%
73%
75%
77%
79%
81%
83%
85%82.9%
Q3 2021
(1)August 2021 numbers are preliminary
30
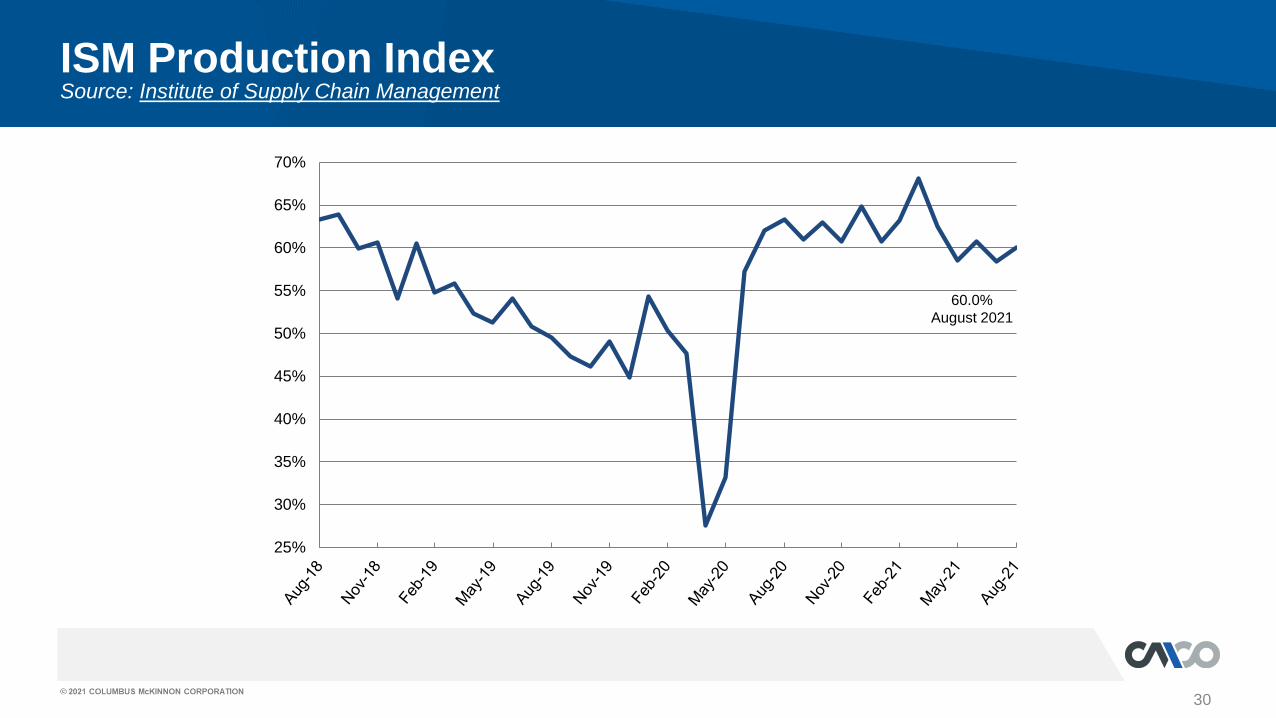
ISM Production IndexSource: Institute of Supply Chain Management
25%
30%
35%
40%
45%
50%
55%
60%
65%
70%
60.0%
August 2021
31
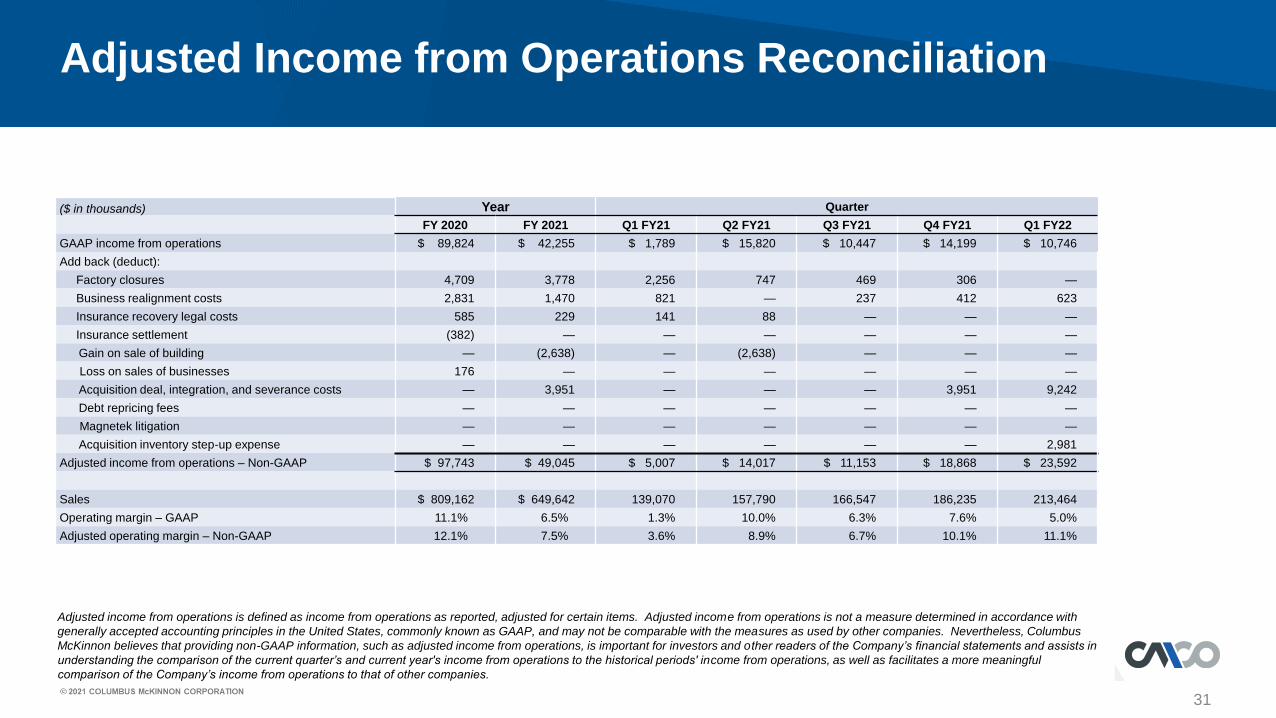
Adjusted Income from Operations Reconciliation
($ in thousands) Year Quarter
FY 2020 FY 2021 Q1 FY21 Q2 FY21 Q3 FY21 Q4 FY21 Q1 FY22
GAAP income from operations $ 89,824 $ 42,255 $ 1,789 $ 15,820 $ 10,447 $ 14,199 $ 10,746
Add back (deduct):
Factory closures 4,709 3,778 2,256 747 469 306 —
Business realignment costs 2,831 1,470 821 — 237 412 623
Insurance recovery legal costs 585 229 141 88 — — —
Insurance settlement (382) — — — — — —
Gain on sale of building — (2,638) — (2,638) — — —
Loss on sales of businesses 176 — — — — — —
Acquisition deal, integration, and severance costs — 3,951 — — — 3,951 9,242
Debt repricing fees — — — — — — —
Magnetek litigation — — — — — — —
Acquisition inventory step-up expense — — — — — — 2,981
Adjusted income from operations – Non-GAAP $ 97,743 $ 49,045 $ 5,007 $ 14,017 $ 11,153 $ 18,868 $ 23,592
Sales $ 809,162 $ 649,642 139,070 157,790 166,547 186,235 213,464
Operating margin – GAAP 11.1% 6.5% 1.3% 10.0% 6.3% 7.6% 5.0%
Adjusted operating margin – Non-GAAP 12.1% 7.5% 3.6% 8.9% 6.7% 10.1% 11.1%
Adjusted income from operations is defined as income from operations as reported, adjusted for certain items. Adjusted income from operations is not a measure determined in accordance with
generally accepted accounting principles in the United States, commonly known as GAAP, and may not be comparable with the measures as used by other companies. Nevertheless, Columbus
McKinnon believes that providing non-GAAP information, such as adjusted income from operations, is important for investors and other readers of the Company’s financial statements and assists in
understanding the comparison of the current quarter’s and current year's income from operations to the historical periods' income from operations, as well as facilitates a more meaningful
comparison of the Company’s income from operations to that of other companies.
32
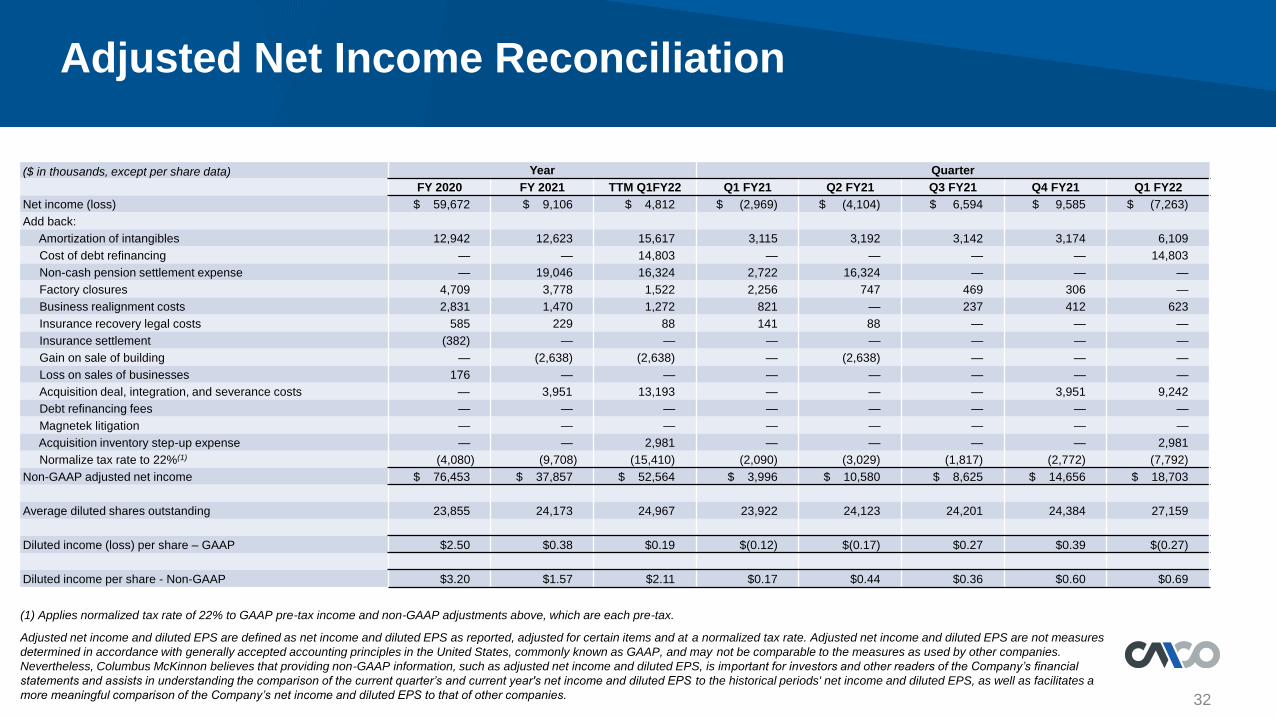
Adjusted Net Income Reconciliation
(1) Applies normalized tax rate of 22% to GAAP pre-tax income and non-GAAP adjustments above, which are each pre-tax.
Adjusted net income and diluted EPS are defined as net income and diluted EPS as reported, adjusted for certain items and at a normalized tax rate. Adjusted net income and diluted EPS are not measures
determined in accordance with generally accepted accounting principles in the United States, commonly known as GAAP, and may not be comparable to the measures as used by other companies.
Nevertheless, Columbus McKinnon believes that providing non-GAAP information, such as adjusted net income and diluted EPS, is important for investors and other readers of the Company’s financial
statements and assists in understanding the comparison of the current quarter’s and current year's net income and diluted EPS to the historical periods' net income and diluted EPS, as well as facilitates a
more meaningful comparison of the Company’s net income and diluted EPS to that of other companies.
($ in thousands, except per share data) Year Quarter
FY 2020 FY 2021 TTM Q1FY22 Q1 FY21 Q2 FY21 Q3 FY21 Q4 FY21 Q1 FY22
Net income (loss) $ 59,672 $ 9,106 $ 4,812 $ (2,969) $ (4,104) $ 6,594 $ 9,585 $ (7,263)
Add back:
Amortization of intangibles 12,942 12,623 15,617 3,115 3,192 3,142 3,174 6,109
Cost of debt refinancing — — 14,803 — — — — 14,803
Non-cash pension settlement expense — 19,046 16,324 2,722 16,324 — — —
Factory closures 4,709 3,778 1,522 2,256 747 469 306 —
Business realignment costs 2,831 1,470 1,272 821 — 237 412 623
Insurance recovery legal costs 585 229 88 141 88 — — —
Insurance settlement (382) — — — — — — —
Gain on sale of building — (2,638) (2,638) — (2,638) — — —
Loss on sales of businesses 176 — — — — — — —
Acquisition deal, integration, and severance costs — 3,951 13,193 — — — 3,951 9,242
Debt refinancing fees — — — — — — — —
Magnetek litigation — — — — — — — —
Acquisition inventory step-up expense — — 2,981 — — — — 2,981
Normalize tax rate to 22%(1) (4,080) (9,708) (15,410) (2,090) (3,029) (1,817) (2,772) (7,792)
Non-GAAP adjusted net income $ 76,453 $ 37,857 $ 52,564 $ 3,996 $ 10,580 $ 8,625 $ 14,656 $ 18,703
Average diluted shares outstanding 23,855 24,173 24,967 23,922 24,123 24,201 24,384 27,159
Diluted income (loss) per share – GAAP $2.50 $0.38 $0.19 $(0.12) $(0.17) $0.27 $0.39 $(0.27)
Diluted income per share - Non-GAAP $3.20 $1.57 $2.11 $0.17 $0.44 $0.36 $0.60 $0.69
33
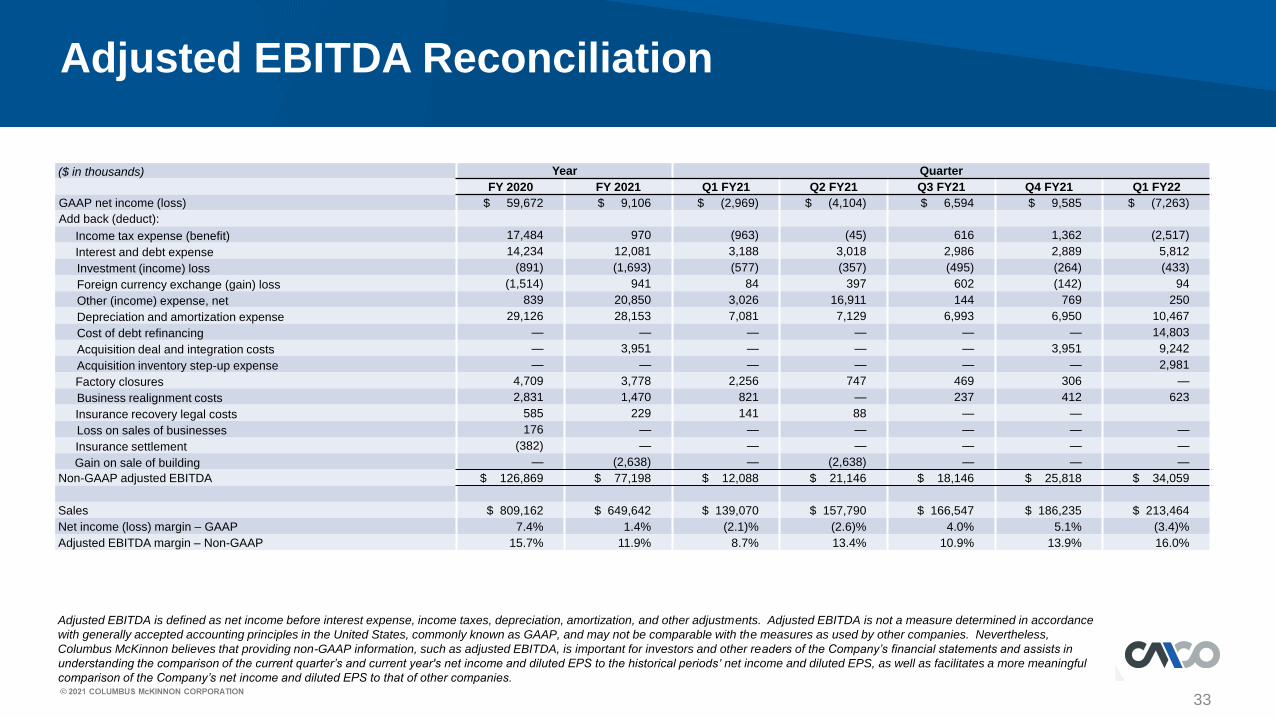
Adjusted EBITDA Reconciliation
Adjusted EBITDA is defined as net income before interest expense, income taxes, depreciation, amortization, and other adjustments. Adjusted EBITDA is not a measure determined in accordance
with generally accepted accounting principles in the United States, commonly known as GAAP, and may not be comparable with the measures as used by other companies. Nevertheless,
Columbus McKinnon believes that providing non-GAAP information, such as adjusted EBITDA, is important for investors and other readers of the Company’s financial statements and assists in
understanding the comparison of the current quarter’s and current year's net income and diluted EPS to the historical periods ' net income and diluted EPS, as well as facilitates a more meaningful
comparison of the Company’s net income and diluted EPS to that of other companies.
($ in thousands) Year Quarter
FY 2020 FY 2021 Q1 FY21 Q2 FY21 Q3 FY21 Q4 FY21 Q1 FY22
GAAP net income (loss) $ 59,672 $ 9,106 $ (2,969) $ (4,104) $ 6,594 $ 9,585 $ (7,263)
Add back (deduct):
Income tax expense (benefit) 17,484 970 (963) (45) 616 1,362 (2,517)
Interest and debt expense 14,234 12,081 3,188 3,018 2,986 2,889 5,812
Investment (income) loss (891) (1,693) (577) (357) (495) (264) (433)
Foreign currency exchange (gain) loss (1,514) 941 84 397 602 (142) 94
Other (income) expense, net 839 20,850 3,026 16,911 144 769 250
Depreciation and amortization expense 29,126 28,153 7,081 7,129 6,993 6,950 10,467
Cost of debt refinancing — — — — — — 14,803
Acquisition deal and integration costs — 3,951 — — — 3,951 9,242
Acquisition inventory step-up expense — — — — — — 2,981
Factory closures 4,709 3,778 2,256 747 469 306 —
Business realignment costs 2,831 1,470 821 — 237 412 623
Insurance recovery legal costs 585 229 141 88 — —
Loss on sales of businesses 176 — — — — — —
Insurance settlement (382) — — — — — —
Gain on sale of building — (2,638) — (2,638) — — —
Non-GAAP adjusted EBITDA $ 126,869 $ 77,198 $ 12,088 $ 21,146 $ 18,146 $ 25,818 $ 34,059
Sales $ 809,162 $ 649,642 $ 139,070 $ 157,790 $ 166,547 $ 186,235 $ 213,464
Net income (loss) margin – GAAP 7.4% 1.4% (2.1)% (2.6)% 4.0% 5.1% (3.4)%
Adjusted EBITDA margin – Non-GAAP 15.7% 11.9% 8.7% 13.4% 10.9% 13.9% 16.0%
34
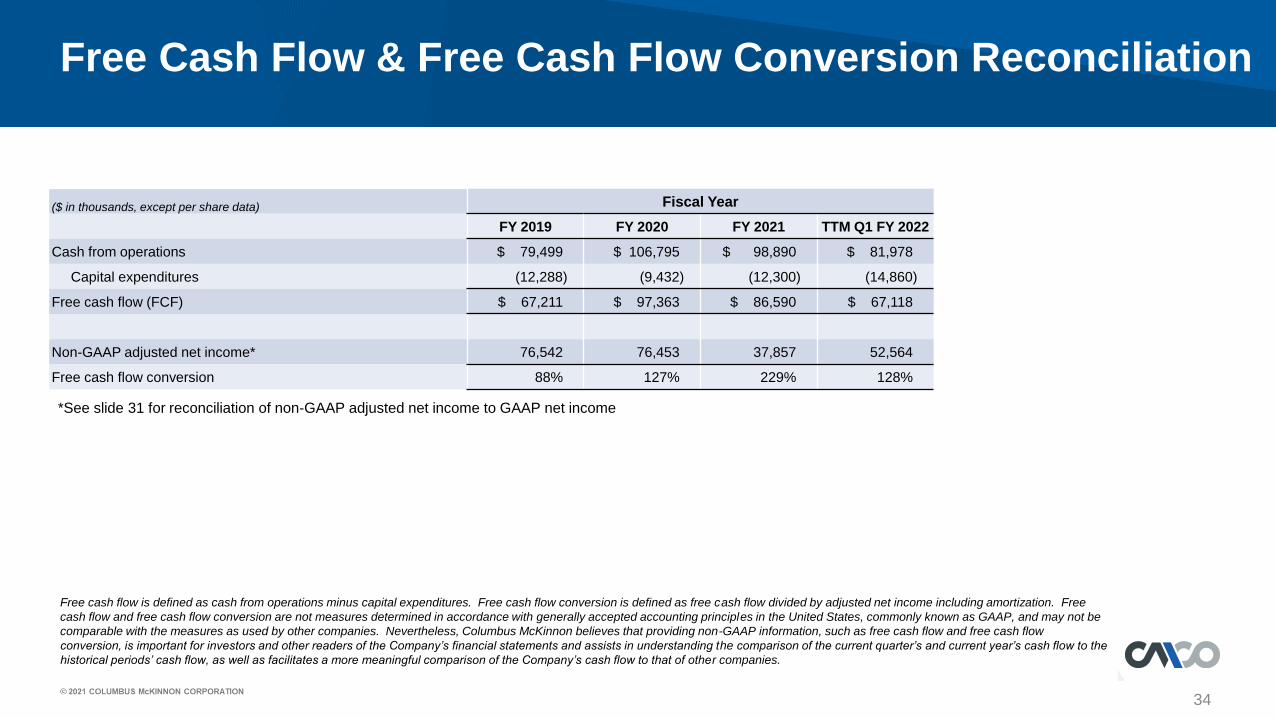
Free Cash Flow & Free Cash Flow Conversion Reconciliation
($ in thousands, except per share data) Fiscal Year
FY 2019 FY 2020 FY 2021 TTM Q1 FY 2022
Cash from operations $ 79,499 $ 106,795 $ 98,890 $ 81,978
Capital expenditures (12,288) (9,432) (12,300) (14,860)
Free cash flow (FCF) $ 67,211 $ 97,363 $ 86,590 $ 67,118
Non-GAAP adjusted net income* 76,542 76,453 37,857 52,564
Free cash flow conversion 88% 127% 229% 128%
Free cash flow is defined as cash from operations minus capital expenditures. Free cash flow conversion is defined as free cash flow divided by adjusted net income including amortization. Free
cash flow and free cash flow conversion are not measures determined in accordance with generally accepted accounting principles in the United States, commonly known as GAAP, and may not be
comparable with the measures as used by other companies. Nevertheless, Columbus McKinnon believes that providing non-GAAP information, such as free cash flow and free cash flow
conversion, is important for investors and other readers of the Company’s financial statements and assists in understanding the comparison of the current quarter’s and current year’s cash flow to the
historical periods’ cash flow, as well as facilitates a more meaningful comparison of the Company’s cash flow to that of other companies.
*See slide 31 for reconciliation of non-GAAP adjusted net income to GAAP net income
35
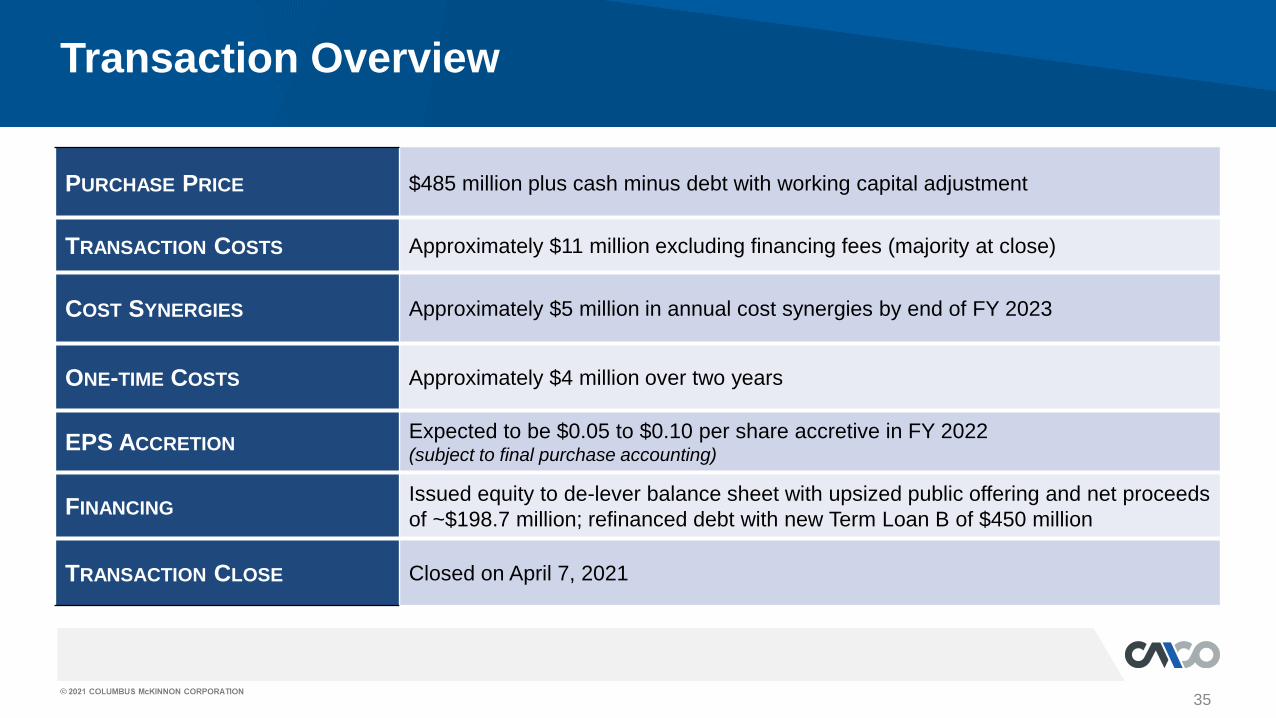
Transaction Overview
PURCHASE PRICE $485 million plus cash minus debt with working capital adjustment
TRANSACTION COSTS Approximately $11 million excluding financing fees (majority at close)
COST SYNERGIES Approximately $5 million in annual cost synergies by end of FY 2023
ONE-TIME COSTS Approximately $4 million over two years
EPS ACCRETIONExpected to be $0.05 to $0.10 per share accretive in FY 2022(subject to final purchase accounting)
FINANCINGIssued equity to de-lever balance sheet with upsized public offering and net proceeds
of ~$198.7 million; refinanced debt with new Term Loan B of $450 million
TRANSACTION CLOSE Closed on April 7, 2021
36
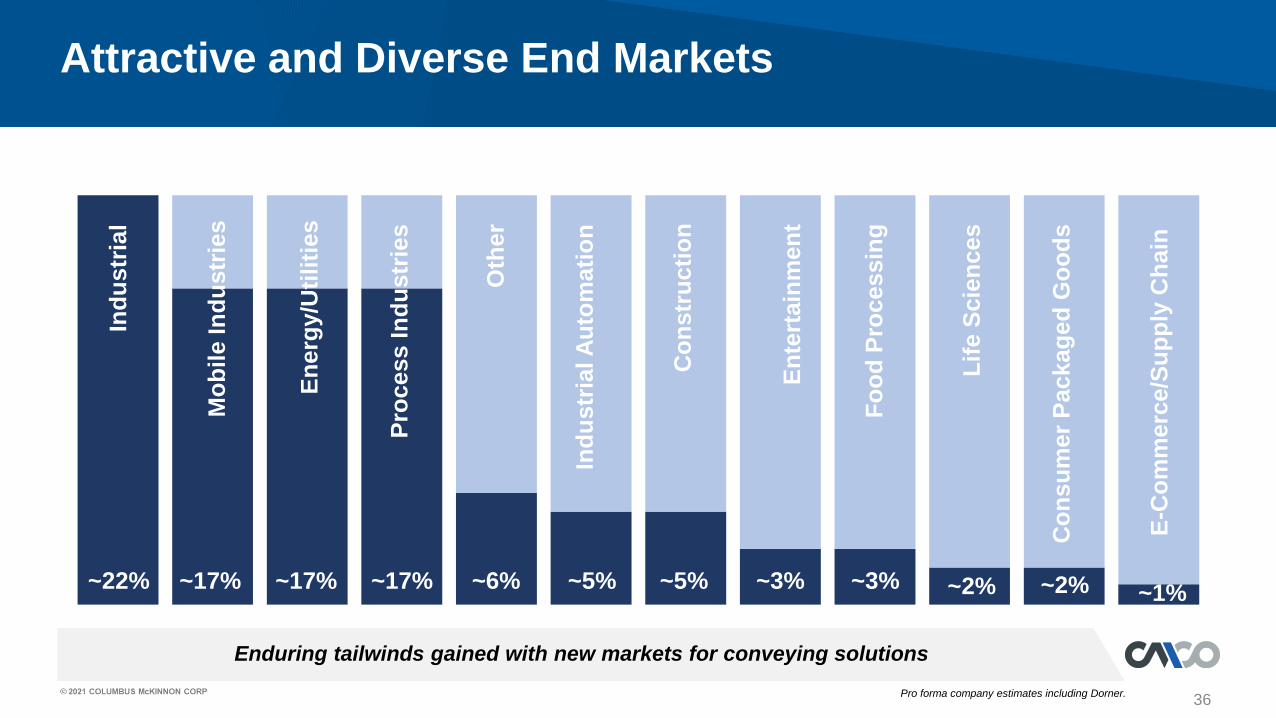
Enduring tailwinds gained with new markets for conveying solutions
Attractive and Diverse End Markets
~22% ~17% ~17% ~17% ~6% ~5% ~5% ~3% ~3% ~2% ~2%
Ind
ustr
ial
Mo
bil
e In
du
str
ies
En
erg
y/U
tili
ties
Pro
ce
ss I
nd
ustr
ies
Oth
er
Ind
ustr
ial A
uto
mati
on
Co
nstr
ucti
on
En
tert
ain
men
t
Fo
od
Pro
cessin
g
Lif
e S
cie
nces
Co
nsu
mer
Packag
ed
Go
od
s
~1%
E-C
om
merc
e/S
up
ply
Ch
ain
Pro forma company estimates including Dorner.
37
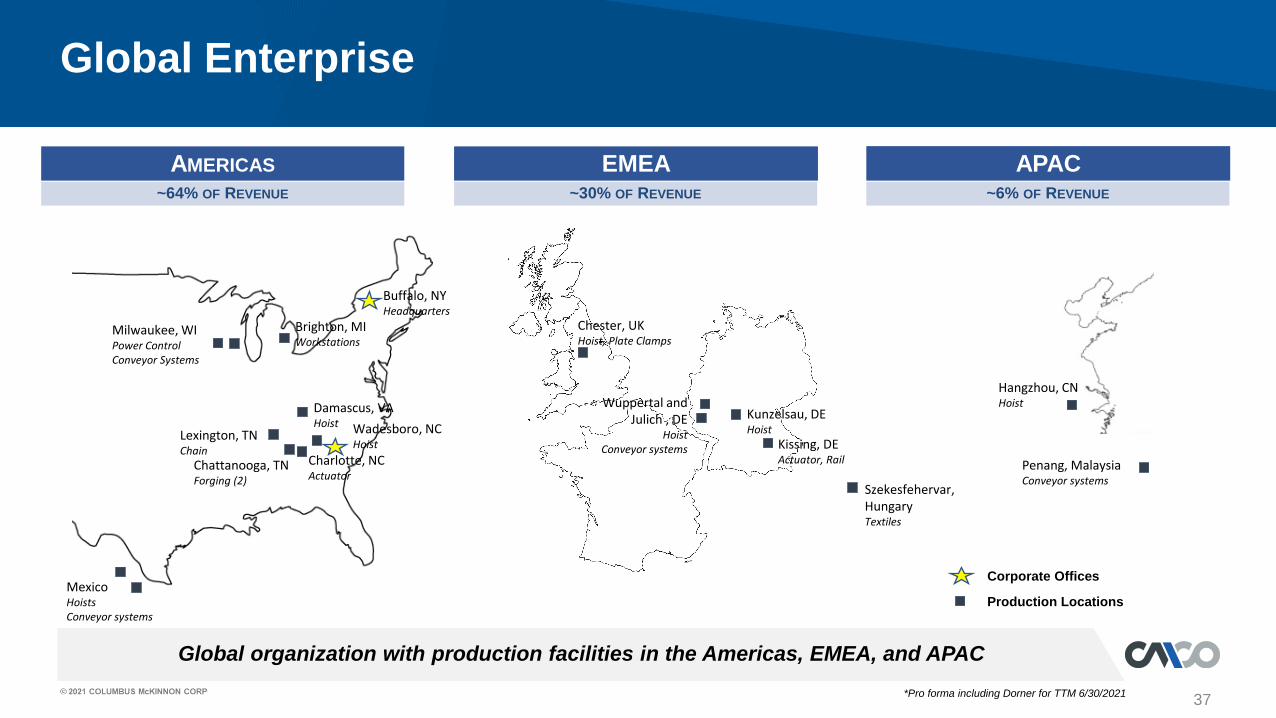
Global organization with production facilities in the Americas, EMEA, and APAC
Global Enterprise
Kunzelsau, DEHoist
Milwaukee, WIPower ControlConveyor Systems
Wadesboro, NCHoist
Damascus, VAHoist
Charlotte, NCActuator
MexicoHoistsConveyor systems
Lexington, TNChain
Chattanooga, TNForging (2)
AMERICAS EMEA
Kissing, DEActuator, Rail
Hangzhou, CNHoist
APAC
Chester, UKHoist, Plate Clamps
Szekesfehervar, HungaryTextiles
Brighton, MIWorkstations
Wuppertal and Julich , DE
HoistConveyor systems
Corporate Offices
Production Locations
Buffalo, NYHeadquarters
Penang, MalaysiaConveyor systems
~64% OF REVENUE ~6% OF REVENUE~30% OF REVENUE
*Pro forma including Dorner for TTM 6/30/2021