Embed Size (px)
Citation preview

2014 ANNUAL REPORT
BYGGMAX, 2014 ANNUAL REPORT 3BYGGMAX, 2014 ANNUAL REPORT2
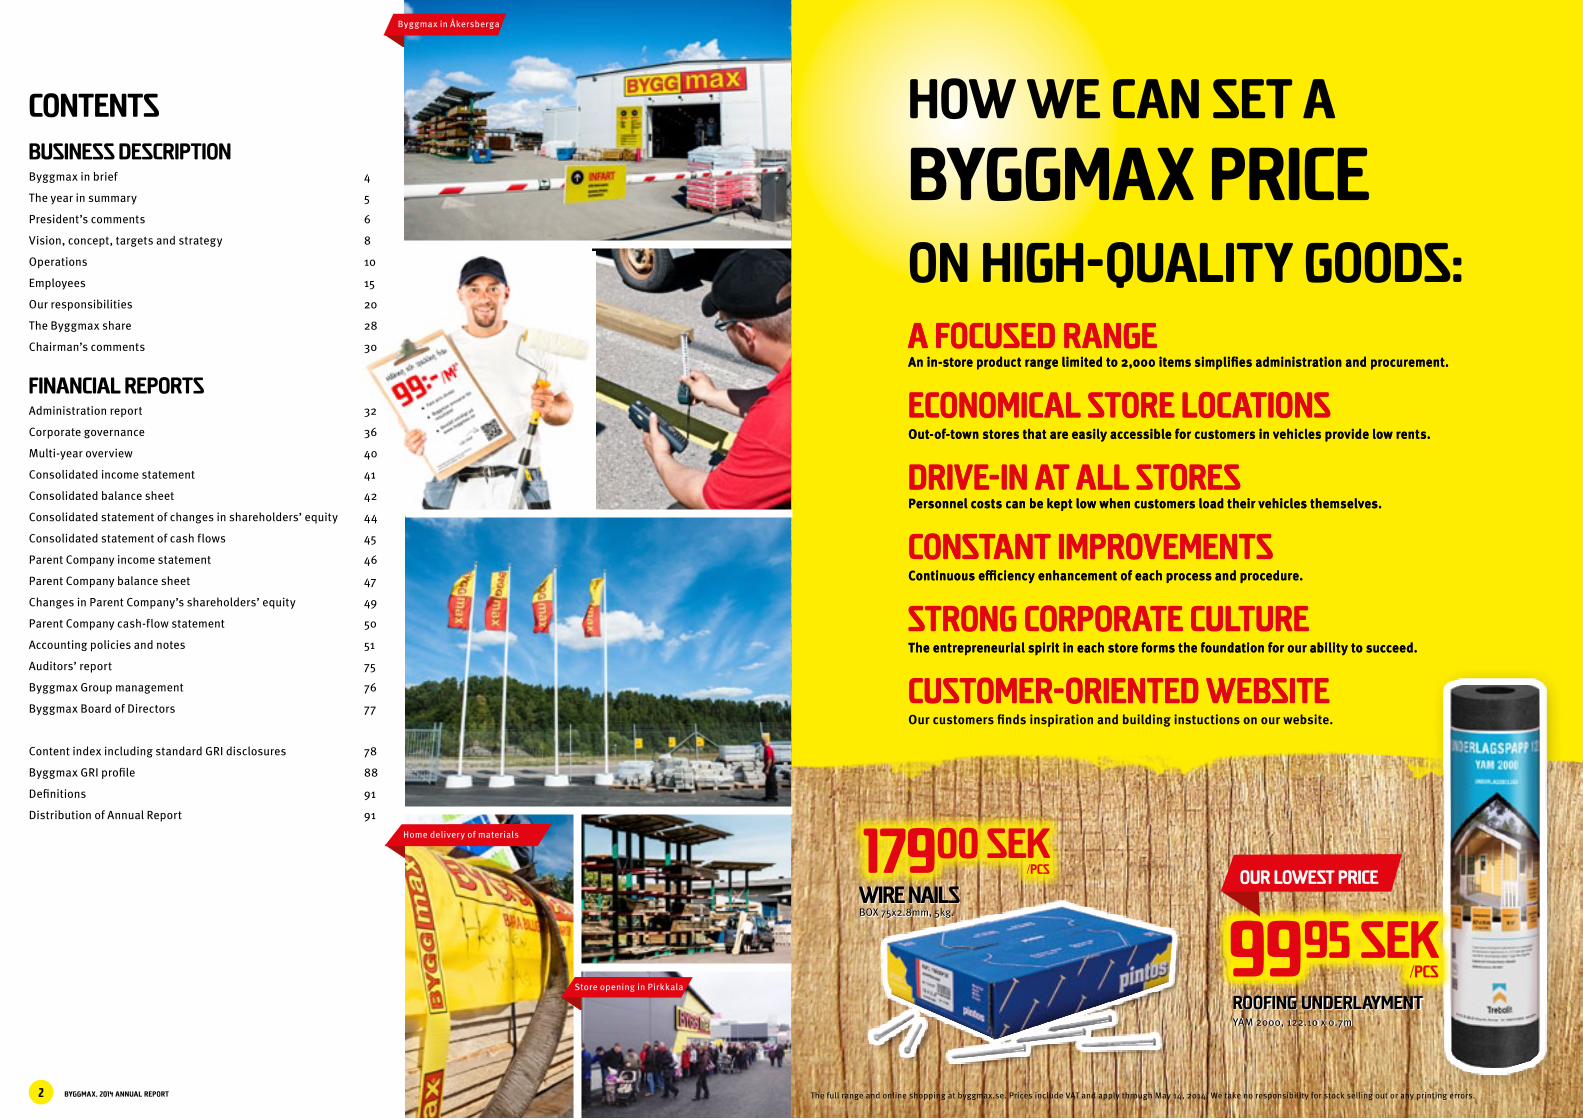
A FOCUSED RANGEAn in-store product range limited to 2,000 items simplifies administration and procurement.
ECONOMICAL STORE LOCATIONSOut-of-town stores that are easily accessible for customers in vehicles provide low rents.
DRIVE-IN AT ALL STORESPersonnel costs can be kept low when customers load their vehicles themselves.
CONSTANT IMPROVEMENTSContinuous efficiency enhancement of each process and procedure.
STRONG CORPORATE CULTUREThe entrepreneurial spirit in each store forms the foundation for our ability to succeed.
CUSTOMER-ORIENTED WEBSITE
A FOCUSED RANGEAn in-store product range limited to 2,000 items simplifies administration and procurement.
ECONOMICAL STORE LOCATIONSOut-of-town stores that are easily accessible for customers in vehicles provide low rents.
DRIVE-IN AT ALL STORESPersonnel costs can be kept low when customers load their vehicles themselves.
CONSTANT IMPROVEMENTSContinuous efficiency enhancement of each process and procedure.
STRONG CORPORATE CULTUREThe entrepreneurial spirit in each store forms the foundation for our ability to succeed.
CUSTOMER-ORIENTED WEBSITEOur customers finds inspiration and building instuctions on our website.
HOW WE CAN SET A BYGGMAX PRICE ON HIGH-QUALITY GOODS:
CONTENTSBUSINESS DESCRIPTIONByggmax in brief 4
The year in summary 5
President’s comments 6
Vision, concept, targets and strategy 8
Operations 10
Employees 15
Our responsibilities 20
The Byggmax share 28
Chairman’s comments 30
FINANCIAL REPORTSAdministration report 32
Corporate governance 36
Multi-year overview 40
Consolidated income statement 41
Consolidated balance sheet 42
Consolidated statement of changes in shareholders’ equity 44
Consolidated statement of cash flows 45
Parent Company income statement 46
Parent Company balance sheet 47
Changes in Parent Company’s shareholders’ equity 49
Parent Company cash-flow statement 50
Accounting policies and notes 51
Auditors’ report 75
Byggmax Group management 76
Byggmax Board of Directors 77
Content index including standard GRI disclosures 78
Byggmax GRI profile 88
Definitions 91
Distribution of Annual Report 91
The full range and online shopping at byggmax.se. Prices include VAT and apply through May 14, 2014. We take no responsibility for stock selling out or any printing errors.
Byggmax in Åkersberga
Home delivery of materials
17900 Sek/pcs
WIRE NAILSBOX 75x2.8mm, 5kg.
Store opening in Pirkkala9995 sek
/pcs
ROOFING UNDERLAYMENTYAM 2000, 122.10 x 0.7m
OUR LOWEST PRICE
BYGGMAX, 2014 ANNUAL REPORT4 5
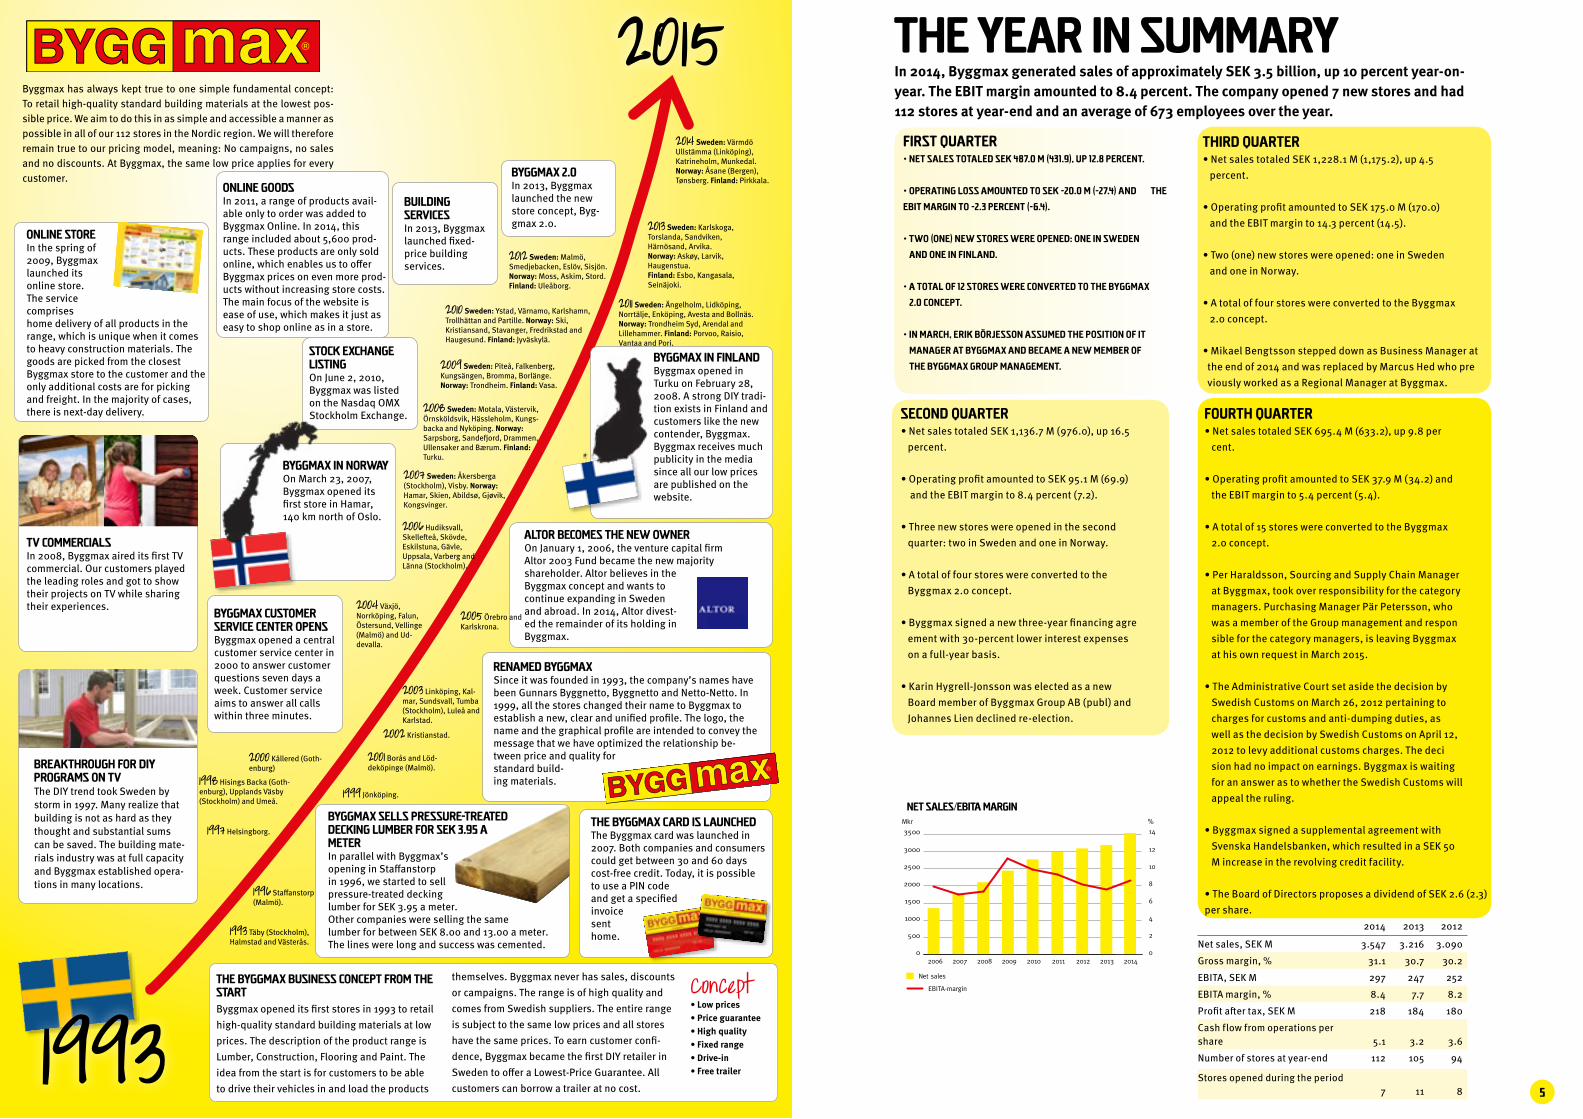
THE YEAR IN SUMMARYIn 2014, Byggmax generated sales of approximately SEK 3.5 billion, up 10 percent year-on-year. The EBIT margin amounted to 8.4 percent. The company opened 7 new stores and had 112 stores at year-end and an average of 673 employees over the year.
0
20
40
60
80
100
1993
st
ANTAL BUTIKER
1994 1995 1996 1997 1999 2000 2001 2002 2003 2004 2005 2006 2007 2008 2009 2010 201220111998
Sverige
Norge
Finland
0
500
1000
1500
2000
2500
3000
3500
0
2
4
6
8
10
12
14
Mkr %
2006
57% (56%)
5% (4%)
39% (39%)
2007 2008 2009 2011 2012 2013 20142010
482 (453)122 (115)
69 (61)
Net sales
EBITA-margin
NET SALES/EBITA MARGIN
WORKFORCE, AGE DISTRIBUTION WORKFORCE, EMPLOYEES BY COUNTRY
Sweden
Norway
Finland
< 29 years old
30-49 years old
> 50 years old
2014 2013 2012
Net sales, SEK M 3.547 3.216 3.090
Gross margin, % 31.1 30.7 30.2
EBITA, SEK M 297 247 252
EBITA margin, % 8.4 7.7 8.2
Profit after tax, SEK M 218 184 180
Cash flow from operations per share 5.1 3.2
3.6
Number of stores at year-end 112 105 94
Stores opened during the period7 11
8
FIRST QUARTER• Net sales totaled SEK 487.0 M (431.9), up 12.8 percent.
• Operating loss amounted to SEK -20.0 M (-27.4) and the
EBIT margin to -2.3 percent (-6.4).
• Two (one) new stores were opened: one in Sweden
and one in Finland.
• A total of 12 stores were converted to the Byggmax
2.0 concept.
• In March, Erik Börjesson assumed the position of IT
Manager at Byggmax and became a new member of
the Byggmax Group management.
THIRD QUARTER• Net sales totaled SEK 1,228.1 M (1,175.2), up 4.5 percent.
• Operating profit amounted to SEK 175.0 M (170.0) and the EBIT margin to 14.3 percent (14.5).
• Two (one) new stores were opened: one in Sweden and one in Norway.
• A total of four stores were converted to the Byggmax 2.0 concept.
• Mikael Bengtsson stepped down as Business Manager at the end of 2014 and was replaced by Marcus Hed who pre viously worked as a Regional Manager at Byggmax.
SECOND QUARTER• Net sales totaled SEK 1,136.7 M (976.0), up 16.5 percent.
• Operating profit amounted to SEK 95.1 M (69.9) and the EBIT margin to 8.4 percent (7.2).
• Three new stores were opened in the second quarter: two in Sweden and one in Norway. • A total of four stores were converted to the Byggmax 2.0 concept.
• Byggmax signed a new three-year financing agre ement with 30-percent lower interest expenses on a full-year basis.
• Karin Hygrell-Jonsson was elected as a new Board member of Byggmax Group AB (publ) and Johannes Lien declined re-election.
FOURTH QUARTER• Net sales totaled SEK 695.4 M (633.2), up 9.8 per cent.
• Operating profit amounted to SEK 37.9 M (34.2) and the EBIT margin to 5.4 percent (5.4).
• A total of 15 stores were converted to the Byggmax 2.0 concept.
• Per Haraldsson, Sourcing and Supply Chain Manager at Byggmax, took over responsibility for the category managers. Purchasing Manager Pär Petersson, who was a member of the Group management and respon sible for the category managers, is leaving Byggmax at his own request in March 2015.
• The Administrative Court set aside the decision by Swedish Customs on March 26, 2012 pertaining to charges for customs and anti-dumping duties, as well as the decision by Swedish Customs on April 12, 2012 to levy additional customs charges. The deci sion had no impact on earnings. Byggmax is waiting for an answer as to whether the Swedish Customs will appeal the ruling.
• Byggmax signed a supplemental agreement with Svenska Handelsbanken, which resulted in a SEK 50 M increase in the revolving credit facility.
• The Board of Directors proposes a dividend of SEK 2.6 (2.3) per share.
Byggmax has always kept true to one simple fundamental concept: To retail high-quality standard building materials at the lowest pos-sible price. We aim to do this in as simple and accessible a manner as possible in all of our 112 stores in the Nordic region. We will therefore remain true to our pricing model, meaning: No campaigns, no sales and no discounts. At Byggmax, the same low price applies for every customer.
2015
THE BYGGMAX BUSINESS CONCEPT FROM THE STARTByggmax opened its first stores in 1993 to retail high-quality standard building materials at low prices. The description of the product range is Lumber, Construction, Flooring and Paint. The idea from the start is for customers to be able to drive their vehicles in and load the products
themselves. Byggmax never has sales, discounts or campaigns. The range is of high quality and comes from Swedish suppliers. The entire range is subject to the same low prices and all stores have the same prices. To earn customer confi-dence, Byggmax became the first DIY retailer in Sweden to offer a Lowest-Price Guarantee. All customers can borrow a trailer at no cost.
Concept• Low prices• Price guarantee• High quality• Fixed range• Drive-in • Free trailer
RENAMED BYGGMAXSince it was founded in 1993, the company’s names have been Gunnars Byggnetto, Byggnetto and Netto-Netto. In 1999, all the stores changed their name to Byggmax to establish a new, clear and unified profile. The logo, the name and the graphical profile are intended to convey the message that we have optimized the relationship be-tween price and quality for standard build-ing materials.
BYGGMAX SELLS PRESSURE-TREATED DECKING LUMBER FOR SEK 3.95 A METERIn parallel with Byggmax’s opening in Staffanstorp in 1996, we started to sell pressure-treated decking lumber for SEK 3.95 a meter. Other companies were selling the same lumber for between SEK 8.00 and 13.00 a meter. The lines were long and success was cemented.
ALTOR BECOMES THE NEW OWNEROn January 1, 2006, the venture capital firm Altor 2003 Fund became the new majority shareholder. Altor believes in the Byggmax concept and wants to continue expanding in Sweden and abroad. In 2014, Altor divest-ed the remainder of its holding in Byggmax.
BREAKTHROUGH FOR DIY PROGRAMS ON TVThe DIY trend took Sweden by storm in 1997. Many realize that building is not as hard as they thought and substantial sums can be saved. The building mate-rials industry was at full capacity and Byggmax established opera-tions in many locations.
TV COMMERCIALSIn 2008, Byggmax aired its first TV commercial. Our customers played the leading roles and got to show their projects on TV while sharing their experiences.
THE BYGGMAX CARD IS LAUNCHEDThe Byggmax card was launched in 2007. Both companies and consumers could get between 30 and 60 days cost-free credit. Today, it is possible to use a PIN code and get a specified invoice sent home.
BYGGMAX CUSTOMER SERVICE CENTER OPENSByggmax opened a central customer service center in 2000 to answer customer questions seven days a week. Customer service aims to answer all calls within three minutes.
BYGGMAX IN NORWAYOn March 23, 2007, Byggmax opened its first store in Hamar, 140 km north of Oslo.
1993 Täby (Stockholm), Halmstad and Västerås.
1996 Staffanstorp (Malmö).
1997 Helsingborg.
1998 Hisings Backa (Goth-enburg), Upplands Väsby (Stockholm) and Umeå.
1999 Jönköping.
2000 Kållered (Goth-enburg)
2001 Borås and Löd-deköpinge (Malmö).
2002 Kristianstad.
2003 Linköping, Kal-mar, Sundsvall, Tumba (Stockholm), Luleå and Karlstad.
2004 Växjö, Norrköping, Falun, Östersund, Vellinge (Malmö) and Ud-devalla.
2005 Örebro and Karlskrona.
2006 Hudiksvall, Skellefteå, Skövde, Eskilstuna, Gävle, Uppsala, Varberg and Länna (Stockholm).
2007 Sweden: Åkersberga (Stockholm), Visby. Norway: Hamar, Skien, Abildsø, Gjøvik, Kongsvinger.
2008 Sweden: Motala, Västervik, Örnsköldsvik, Hässleholm, Kungs-backa and Nyköping. Norway:Sarpsborg, Sandefjord, Drammen, Ullensaker and Bærum. Finland: Turku.
2009 Sweden: Piteå, Falkenberg, Kungsängen, Bromma, Borlänge. Norway: Trondheim. Finland: Vasa.
2010 Sweden: Ystad, Värnamo, Karlshamn, Trollhättan and Partille. Norway: Ski, Kristiansand, Stavanger, Fredrikstad and Haugesund. Finland: Jyväskylä.
2011 Sweden: Ängelholm, Lidköping, Norrtälje, Enköping, Avesta and Bollnäs. Norway: Trondheim Syd, Arendal and Lillehammer. Finland: Porvoo, Raisio, Vantaa and Pori.
2012 Sweden: Malmö, Smedjebacken, Eslöv, Sisjön. Norway: Moss, Askim, Stord. Finland: Uleåborg.
2013 Sweden: Karlskoga, Torslanda, Sandviken, Härnösand, Arvika. Norway: Askøy, Larvik, Haugenstua.Finland: Esbo, Kangasala, Seinäjoki.
2014 Sweden: VärmdöUllstämma (Linköping), Katrineholm, Munkedal.Norway: Åsane (Bergen), Tønsberg. Finland: Pirkkala.
STOCK EXCHANGE LISTINGOn June 2, 2010, Byggmax was listed on the Nasdaq OMX Stockholm Exchange.
BUILDINGSERVICESIn 2013, Byggmax launched fixed-price building services.
BYGGMAX 2.0In 2013, Byggmax launched the new store concept, Byg-gmax 2.0.
ONLINE STOREIn the spring of 2009, Byggmax launched its online store. The service comprises home delivery of all products in the range, which is unique when it comes to heavy construction materials. The goods are picked from the closest Byggmax store to the customer and the only additional costs are for picking and freight. In the majority of cases, there is next-day delivery.
ONLINE GOODSIn 2011, a range of products avail-able only to order was added to Byggmax Online. In 2014, this range included about 5,600 prod-ucts. These products are only sold online, which enables us to offer Byggmax prices on even more prod-ucts without increasing store costs. The main focus of the website is ease of use, which makes it just as easy to shop online as in a store.
BYGGMAX IN FINLANDByggmax opened in Turku on February 28, 2008. A strong DIY tradi-tion exists in Finland and customers like the new contender, Byggmax. Byggmax receives much publicity in the media since all our low prices are published on the website.
1993

7BYGGMAX, 2014 ANNUAL REPORT6 Byggmax, 2014 Annual report
BYGGMAX CONTINUES TO CAPTURE MARKET SHARESIn 2014, the Norwegian and Finnish markets trended below expectations, while the market in Sweden outperformed expectations. Low-price concepts such as Byggmax are favored in tougher economic climates and we are capturing market shares in all our markets.
COMMERCIAL STRATEGY – CONTINUED EXPANSION WITH STORES, MARKETING AND RANGEOver the full year, Byggmax opened seven stores, which was in line with our target of 7-13 stores for the year. We have identified a potential to expand the existing total of 112 stores to a total of 180 stores in Sweden, Norway and Finland. The store potential by country is: Sweden 95, Norway 60 and Finland 25.
During the year, Byggmax has expanded building services to additional geographies in Sweden. Customers can buy a wide range of services (floo-ring, painting, bathroom renovation, window and door replacement, roofing, etc.) at fixed prices per square meter on the Byggmax website. The idea is to continue expanding the test geographically and the range of building services offered. The concept has significant potential as these building servi-ces attract an entirely new target group, people who want to renovate but who are either unable to or unwilling to do it themselves.
BYGGMAX 2.0 – ROLL-OUT OF THE UPGRADED STORE CONCEPT WITH A WIDER RANGEByggmax 2.0 is an updated store concept, with more articles and clearer communication, utilizing the same sales area as before and with substan-tially improved sales control. Byggmax 2.0 stores have delivered promising sales increases follo-wing conversion.
35 stores were converted during the year and, at the end of the year, a total of 61 stores (54 percent) were aligned with the concept. Our aim is to convert an additional 20-30 stores ahead of the peak season in 2015, in other words, by the end of April.
Byggmax has a number of investment areas: expan-sion in Finland, the online store and building servi-ces. In 2014, after depreciation and amortization, these areas resulted in a total charge of 2.1% on the EBIT margin. In other words, if these investments are disregarded, the EBIT margin would be 2.1% higher. We will continue to invest to grow and capture market shares in 2015. The aim is for the effect on the EBIT margin in 2015 to be less than three percentage points.
In conclusion, I would like to thank all of our employ-ees, who were involved in helping us achieve our strong performance, and all of our customers who show their confidence in us every day.
“Byggmax should be the natural choice for everyone wanting to renovate. We will be the world’s best DIY retailer!”
PRESIDENT’S COMMENTS
SUSTAINABILITY AT BYGGMAXSince 2009, an annual environmental report has been produced on Byggmax’s environmental impact. This year’s report shows a reduction in carbon emissions per ton of materials sold and the single most im-portant explanation for this is that we have increased the proportion of goods procured locally and redu-ced the percentage sourced from Asia. Since 2009, carbon emissions per ton transported have declined 14 percent and declined 8 percent in 2014. This means we are well on the way to reaching our goal of a 25-percent reduction by 2020.
As of 2011, Byggmax reports its sustainability initiati-ves in line with the Global Reporting Initiative’s (GRI) framework for sustainability reporting. We report in line with the A+ level, which is the highest level under the GRI.
OUTLOOK - GROWTH CONTINUES WITH NEW INVESTMENTSIt is gratifying to have continued our growth and maintained healthy profitability. It shows the strength inherent in the concept and the increasing consumer trend towards choosing the low-price alter-native when purchasing building supplies - irrespec-tive of the economic situation. Many people dream of renovating their home themselves. We make it quick, simple and inexpensive to carry out large or small-scale construction projects. Naturally, we continue to see great potential in growing in the three countries where we currently have operations, and in the long term to also start looking further afield. We aim to establish a store network of 180 stores in our existing markets.
When we look ahead towards 2015, we foresee a num-ber of areas with positive development potential. This includes opening new stores, an updated product range in Byggmax 2.0, building services, Finland and the online store. Byggmax is on a solid footing, which enables us to invest in several initiatives in parallel.
Byggmax is investing in online shopping, which is growing vigorously. Our aim is to significantly in-crease the range and presence online in 2015.
BYGGMAX, 2014 ANNUAL REPORT 9BYGGMAX, 2014 ANNUAL REPORT8
VISION, CONCEPT, TARGETS AND STRATEGY
BUSINESS CONCEPT AND THE BYGGMAX CON-CEPTThe business concept is to retail high-quality building materials at the lowest possible price.
A description of the Byggmax concept follows:
• Low prices and a focused range: Byggmax retails high-quality building supplies at the lowest possible price. We have no sales, discounts, campaigns or seconds quality items. All custo-mers receive the same low price. A limited range of 2,000 products simplifies administration and procurement.
• Drive-in and inexpensive store locations: In our drive-in facilities, customers pack their goods di-rectly into their vehicles thus lowering our costs. The stores are located in suburbs, in locations with easy access for customers with vehicles.
• Constant improvement:We challenge every process to enhance efficiency and to improve operating profits in all our areas of operation.
• Strong corporate culture and cost focus: The foundation of Byggmax’s corporate culture is a genuine entrepreneurial spirit. The store mana-gers and all employees feel pride in their own areas of responsibility. This means staying on top of costs and maintaining a focus on key ratios to perform well. All head office personnel work at least once per year out in the stores to maintain their links to store operations.
The Byggmax vision is to be the world’s best DIY retailer. Read more about how we in-tend to achieve it.
STRATEGIES FOR REACHING THE GOALS Byggmax has defined the following strategies for achieving its financial goals: to expand the store network, improve its operations and develop the business.
Store network expansionOver time, Byggmax will increase its presence in Sweden to about 95 stores, in Norway to about 60 stores and in Finland to about 25 stores in economi-cally attractive locations. Byggmax performs ongoing analyses of opportunities for establishment in new markets but as yet no decision has been made.
Operational excellenceByggmax will improve operations by further expan-ding its use of economies of scale at its purchasing function by handling larger product volumes and through procurement from low-cost countries. The organization will enhance its resource-efficiency by implementing continuous business process impro-vements and reducing costs. Furthermore, Byggmax will capitalize on newly opened stores becoming more profitable once they reach maturity and on increasing sales in already well-established stores.
Business developmentByggmax works continuously with business deve-lopment. IT support and, in particular, the website are developed every year in a number of customer-focused projects. Purchasing, sales procedures and marketing undergo ongoing development in respect of private customers and professional tradesmen. The online store was launched in late 2008, delive-ring from the store to the customer and substantial focus has been placed on developing this service. In 2011, the online store was expanded with the addition of online goods with direct delivery to the customers from the suppliers. Byggmax has launched an offering of building services which is undergoing ongoing development. Byggmax is in the process of implementing the updated Byggmax 2.0 store con-cept. The concept entails enhanced store layout and a new interior design concept that allows a larger range and clearer communication. In addition, Byggmax is adjusting the range to seasonal variations to boost sales in the first and fourth quarters.
VisionThe Byggmax vision is to be the world’s best DIY retailer.
GOALSByggmax’s goals are:• to achieve organic growth in excess of 15 percent
of net sales per year by expanding the store net-work and increasing sales in comparable stores, and
• to maintain an EBIT margin in relation to net sales of more than 11 percent.
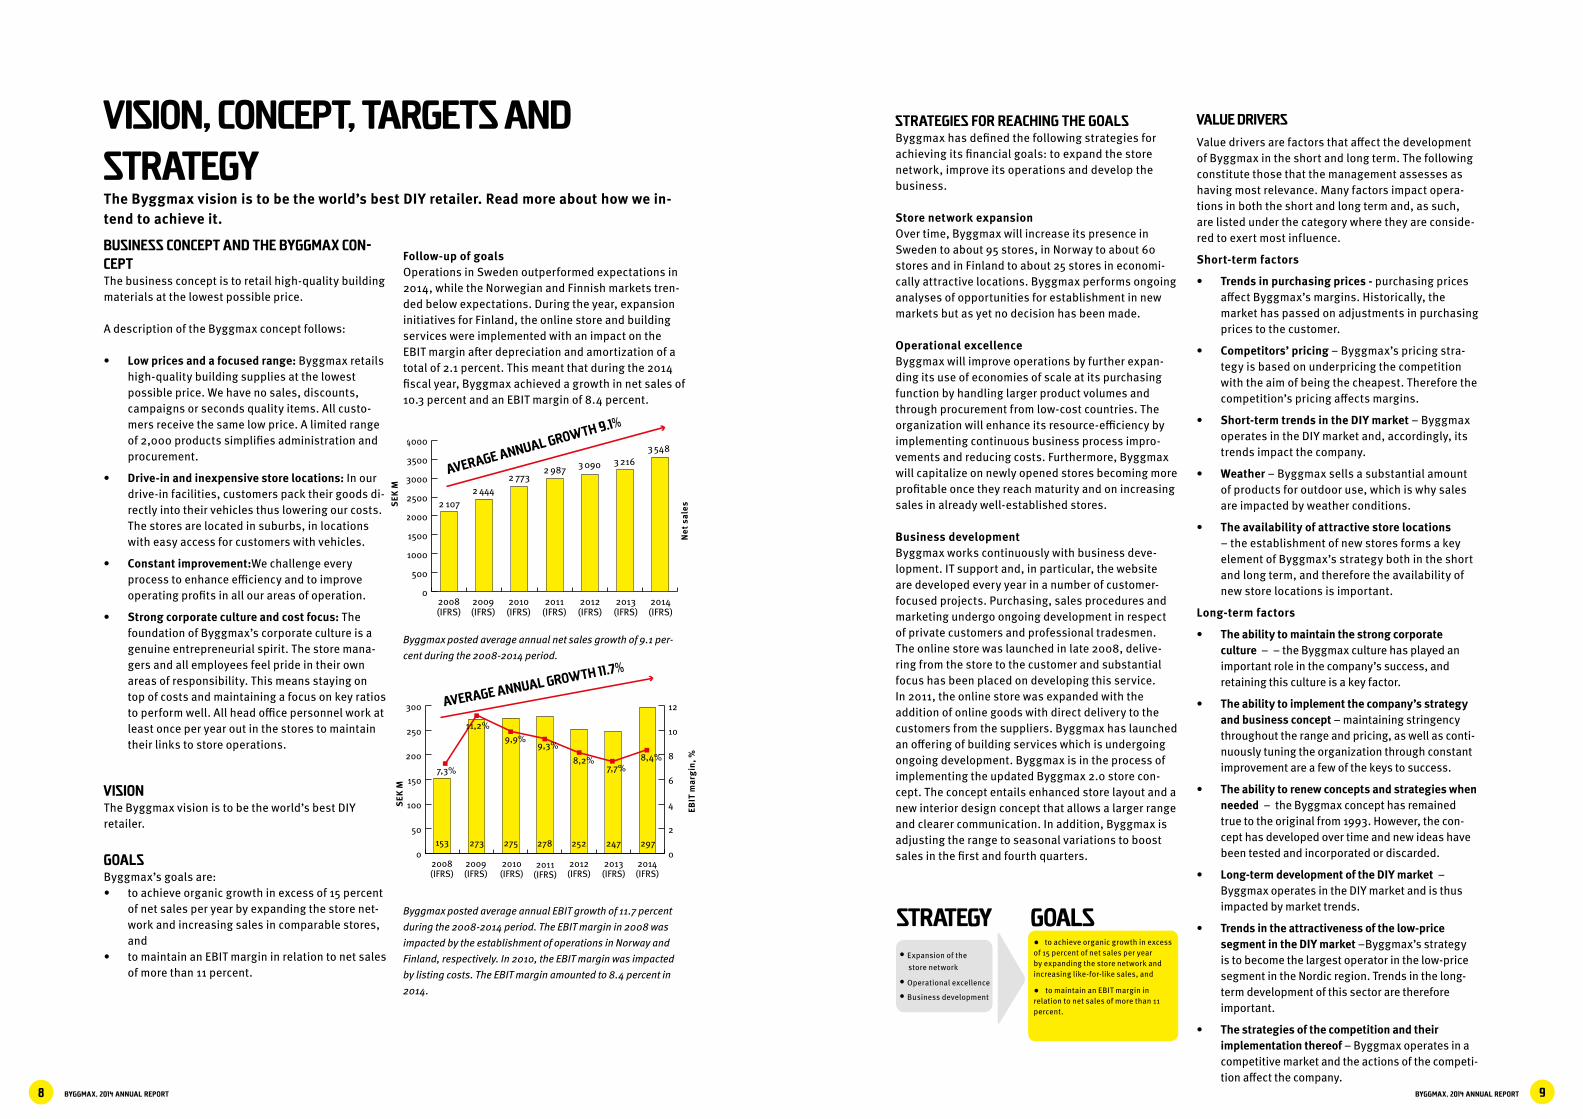
Follow-up of goalsOperations in Sweden outperformed expectations in 2014, while the Norwegian and Finnish markets tren-ded below expectations. During the year, expansion initiatives for Finland, the online store and building services were implemented with an impact on the EBIT margin after depreciation and amortization of a total of 2.1 percent. This meant that during the 2014 fiscal year, Byggmax achieved a growth in net sales of 10.3 percent and an EBIT margin of 8.4 percent.
Byggmax posted average annual net sales growth of 9.1 per-cent during the 2008-2014 period.
Byggmax posted average annual EBIT growth of 11.7 percent during the 2008-2014 period. The EBIT margin in 2008 was impacted by the establishment of operations in Norway and Finland, respectively. In 2010, the EBIT margin was impacted by listing costs. The EBIT margin amounted to 8.4 percent in 2014.
VALUE DRIVERS
Value drivers are factors that affect the development of Byggmax in the short and long term. The following constitute those that the management assesses as having most relevance. Many factors impact opera-tions in both the short and long term and, as such, are listed under the category where they are conside-red to exert most influence.
Short-term factors
• Trends in purchasing prices - purchasing prices affect Byggmax’s margins. Historically, the market has passed on adjustments in purchasing prices to the customer.
• Competitors’ pricing – Byggmax’s pricing stra-tegy is based on underpricing the competition with the aim of being the cheapest. Therefore the competition’s pricing affects margins.
• Short-term trends in the DIY market – Byggmax operates in the DIY market and, accordingly, its trends impact the company.
• Weather – Byggmax sells a substantial amount of products for outdoor use, which is why sales are impacted by weather conditions.
• The availability of attractive store locations – the establishment of new stores forms a key element of Byggmax’s strategy both in the short and long term, and therefore the availability of new store locations is important.
Long-term factors
• The ability to maintain the strong corporate culture – – the Byggmax culture has played an important role in the company’s success, and retaining this culture is a key factor.
• The ability to implement the company’s strategy and business concept – maintaining stringency throughout the range and pricing, as well as conti-nuously tuning the organization through constant improvement are a few of the keys to success.
• The ability to renew concepts and strategies when needed – the Byggmax concept has remained true to the original from 1993. However, the con-cept has developed over time and new ideas have been tested and incorporated or discarded.
• Long-term development of the DIY market – Byggmax operates in the DIY market and is thus impacted by market trends.
• Trends in the attractiveness of the low-price segment in the DIY market –Byggmax’s strategy is to become the largest operator in the low-price segment in the Nordic region. Trends in the long-term development of this sector are therefore important.
• The strategies of the competition and their implementation thereof – Byggmax operates in a competitive market and the actions of the competi-tion affect the company.
GOALS• to achieve organic growth in excess of 15 percent of net sales per year by expanding the store network and increasing like-for-like sales, and
• to maintain an EBIT margin in relation to net sales of more than 11 percent.
STRATEGY• Expansion of the store network
• Operational excellence
• Business development
2 1072 444
2 7732 987 3 090 3 216
3 548
2008(IFRS)
2009(IFRS)
2010(IFRS)
2011(IFRS)
2012(IFRS)
2013(IFRS)
2014(IFRS)
0
50
100
150
200
250
300
0
2
4
6
8
10
12
153 273 275 278 252 297247
7,3%
11,2%9,9%
9,3%
8,2% 8,4%7,7%
2008(IFRS)
2009(IFRS)
2010(IFRS)
2011(IFRS)
2012(IFRS)
2013(IFRS)
2014(IFRS)
0
500
1000
1500
2000
2500
3000
3500
4000
AVERAGE ANNUAL GROWTH 11.7%
EBIT
mar
gin,
%
SEK
M
2 1072 444
2 7732 987 3 090 3 216
3 548
2008(IFRS)
2009(IFRS)
2010(IFRS)
2011(IFRS)
2012(IFRS)
2013(IFRS)
2014(IFRS)
0
50
100
150
200
250
300
0
2
4
6
8
10
12
153 273 275 278 252 297247
7,3%
11,2%9,9%
9,3%
8,2% 8,4%7,7%
2008(IFRS)
2009(IFRS)
2010(IFRS)
2011(IFRS)
2012(IFRS)
2013(IFRS)
2014(IFRS)
0
500
1000
1500
2000
2500
3000
3500
4000
AVERAGE ANNUAL GROWTH 9.1%
Net
sal
esSEK
M

BYGGMAX, 2014 ANNUAL REPORT 11BYGGMAX, 2014 ANNUAL REPORT10
OPERATIONS
BUSINESS MODEL – POSSIBLY THE SIMPLEST IN THE WORLDByggmax offers affordable high-quality products for the most common maintenance and DIY projects. The primary target group is consumers and the range of products encompasses standard building materials, such as lumber, insulation, sheets and boards as well as paint – at the same low price regardless of whether the customer is a tradesman or a consumer. With its focused range, Byggmax handles large volumes and can obtain economies of scale in purchasing and logistics.
Since the company was founded in 1993, its opera-tions have been conducted in accordance with the Byggmax concept, which has been essential to the company’s development. The concept is based on a focused product range, a resource-efficient organiza-tion, a strong corporate culture and effective pricing strategy, as well as the characteristic design of the stores. Today, Byggmax has a strong market position, an extensive store network and a recognized brand.
Since the company was founded in 1993, the Byggmax concept has been essential to the development of operations. The concept is based on a focused product range, a resource-efficient organization, a strong corporate culture and consistent pricing strategy.
competitionByggmax’s competitors are other retail chains, online stores and purchasing organizations, independent stores and wholesalers. The Swedish market has been dominated by Beijer and local DIY retailers, but the international chains and, above all, Byggmax are the companies growing rapidly. Many international chains are expending, for example Bauhaus and K-rauta.The Norwegian market is dominated by a few strong chains with Byggmakker as the market leader. These chains sell to private consumers and professionals and other competitors include Maxbo, Coop Bygg, Optimera, Bygger’n, XL Bygg and Neumann Bygg.The market in Finland has been dominated by Rauta-kesko with its two concepts K-rauta and Rautia. In recent years, the only international chain to establish operations in Finland has been Bauhaus. Other com-petitors in Finland include Starkki, and sGruppen.
OFFERING – SIMPLICITY AND LOW PRICESThe typical Byggmax customer is aged between 25 and 60 and the owner of a detached house, who wants to repaint the house, build a terrace or put up a fence. Most customers are consumers, although about a fifth comprises professional tradesmen. Byggmax’s offering includes the materials needed for building a house and carrying out the most common repairs, maintenance or DIY projects.
Byggmax’s offering is based on simplicity and low prices – customers should focus less on their purcha-ses and more on their DIY projects. Prices and stock availability are available from the website and stores have drive-in facilities, where customers do more themselves and the stores require fewer employ-ees. By having a focused product range, Byggmax can maintain high volumes of sales for most of its offering. In addition, the range primarily contains products that require a lower level of assistance and technical support, for example, sawn lumber, insula-
Byggmax does not own its own factories and ins-tead purchases goods from independent suppliers, primarily in the Nordic region, but also from other European countries and Asia. Byggmax does not own its own stores either; it leases store premises from international and local landlords.
All of the operations are managed from the head office in Solna, Sweden. The company’s business model serves as a platform to generate continued or-ganic growth through both the expansion of the store network and increased like-for-like sales.
MARKET – POTENTIAL FOR CONTINUED ORGA-NIC GROWTHByggmax conducts business activities in the Swe-dish, Norwegian and Finnish DIY markets. The Euro-pean DIY market generates sales totaling approxima-tely EUR 112.8 billion (estimated DIY market size in 2013) according to Mintel1 and is expected to grow by about 2 percent annually over the next five years compared with average annual growth between 2009 and 2013 of 2.2 percent. Corresponding figures for the same period for Sweden, Norway and Finland show average annual growth that has outperformed many other European markets since 2009, with Sweden at the top with 7.6 percent. Sweden, Norway and Finland jointly represent almost 5 percent of the European market, with Norway accounting for the highest DIY sales per capita in Europe. Given Byggmax’s average annual growth rate of 9.1 percent between 2008 and 2014, the growth potential in Sweden, Norway and Finland is assessed as remaining high. The building supplies market is fragmented and the housing mar-ket has a high turnoverrate. It is relatively expensive to use professional tradesmen and there is a long tradition of doing the work oneself. Interest in home renovation and interior design has grown markedly in the Nordic region since the mid-1990s, which can be seen in the large number of DIY/ home decorating television programs and the range of interior-design publications.
1 Mintel International Group – provider of market knowledge and analysis within the DIY sector – retail.
””For many years, Øyvind has dreamed of the seas, and now it’s time to make that dream a reality. Together with his neighbor and good friend, he has started building to the sound of lots of laughter and good stories.Øyvind: We are in Sveio, which is located twenty kilometers north of Haugesund, the center of the world, of course. This is where I am building a paradise, a deck and a pool with views of the sea. It’s an old childhood dream that is being fulfilled. Gunnar, who moved here a while back, is helping me with the work. We have become good friends and “leisurely working colleagues”.
Gunnar: I moved here from Sweden because of the fantastic scenery. It really is incredible. It’s fantastic.
Øyvind: The foundation here is an old stone-strewn slope, so building a terrace of concrete was never on the cards. Therefore, it will be pressure-treated lumber and the plan is to leave the wood like it is today. It will not be protected in any way, shape or form.
Øyvind: Everything comes from Byggmax, right down to the last nail. I really like the simplicity of just driving into the yard and loading everything onto the trailer. You do everything in one go and
then drive home. And the total on the bill is always OK.
“THE TOTAL ON THE BILL IS ALWAYS OK.”
Byg
gmax
adv
erti
sing
cir
cula
r in
Nor
way
, Jun
e 20
14
OPERATIONS, CONTINUEDFOR SEVERAL YEARS, BYGGMAX HAS BEEN NAMED THE WINNER IN PRICE SURVEYS OF DIY RETAILERS IN SWEDEN
BYGGMAX, 2014 ANNUAL REPORT 13BYGGMAX, 2014 ANNUAL REPORT12
tion, doors and windows.Practically all Byggmax stores have an identical
range of products, which assists customers in their purchase planning. The range consists of the most in-demand building supplies and includes about 2,000 products, which is far fewer than the industry norm where large retailers may have up to 100,000 products. The roll-out of the upgraded store concept Byggmax 2.0 has meant a slight increase in the range to cover a larger proportion of customers’ needs for building material. The range in the stores normally only changes marginally from year to year since demand for products for repairs, maintenance and DIY projects is relatively stable. Demand and customer requests for specific new products are followed up by store personnel and the purchasing department based on close and regular contact. Byggmax also of-fers a range of online goods that, essentially, are sent directly from the supplier to the customer. The range of products available to order is supplemented on an ongoing basis with new items.
PricingByggmax’s pricing strategy is primarily built on offering competitive prices relative to the competi-tion rather than making specific mark-ups on its own purchases. In addition, Byggmax continuously ana-lyzes pricing and takes measures to secure compe-titiveness as well as profitability. The company also has a “lowest price guarantee,” which means that a customer who finds an item at a lower price from a competitor will receive the lower price plus a discount on the difference. Another element of Byggmax’s pricing strategy is to always offer low pricing instead of applying seasonal sales or campaign discounts.
Prices are set centrally, which enables rapid reac-tion to changes in market conditions.
For several consecutive years, Byggmax has been named the winner in price comparisons of various players in the building sector. According to the publi-cation Vi-i-Villa’s “villa panel”, Byggmax continues to have a strong position among Sweden’s house owners. Some 36 percent of house owners plan to shop at Byggmax according to the 2014 report, which was the highest figure for any DIY store included in the survey.
PURCHASING, DISTRIBUTION AND LOGISTICS – EFFICIENCY AT EVERY STAGEByggmax purchases its products from approximately 250 carefully selected suppliers, of which three-quarters are located in the Nordic countries. To an increasing extent, Byggmax sources products locally, for example, more than 80 percent of lumber, which
is Byggmax’s largest product group, is procured lo-cally. Byggmax defines locally as within one country, except for Sweden, which due to its size is divided into two parts; North and South. A delivery is deemed local if it originates in the same country or part of a country as its destination. Byggmax avoids being dependent on a single supplier by having at least two suppliers per product category.
With its product strategy, Byggmax is one of the largest purchasers in its geographic market and can negotiate attractive contractual terms and discounts. The majority of products are delivered by the supplier directly to the stores, in full truckloads. Byggmax has two distribution centers that handle one fourth of all deliveries, which gives us increased efficiency through consolidation effects with deliveries and has given us the right conditions to maintain lower inven-tory levels. The proportion delivered via the distribu-tion centers has increased in recent years. Byggmax imposes strict requirements on its suppliers in such areas as delivery conditions, product quality, price, order confirmation and invoicing procedures, which are monitored using the company’s integrated IT sys-tem (ERP – Enterprise Resource Planning system).
The high inventory turnover places major demands on efficient distribution and logistics. Currently, two-thirds of the orders from suppliers are handled automatically in the ERP system and Byggmax is striving to further automate its supply chain. Using the system, the purchasing department can identify inventory shortages in all of the stores at any one time and place an order. Furthermore, the purchasing department communicates closely and regularly with store personnel to pinpoint sales trends and activities not identified by the ERP system.
It can often be difficult as a retailer to get the opportunity to participate in and influence the life cycle of a product. As regards Byggmax’s major product group, lumber, this is the product group
where the company is sometimes able to collaborate with suppliers and influence the development of the product concept, its manufacture and production, marketing, distribution and use as well as scrapping and recycling.
In regard to the evaluation of health and safety is-sues over a product life cycle, for the lumber catego-ry, Byggmax has evaluated all stages in the product life cycle with the exception of research and deve-lopment as well as license application and approval, since the company in its capacity as retailer has no di-rect opportunity to evaluate and influence. Byggmax chooses not to reveal the mark-ups utilized for the major product and service categories for reasons of business confidentiality.
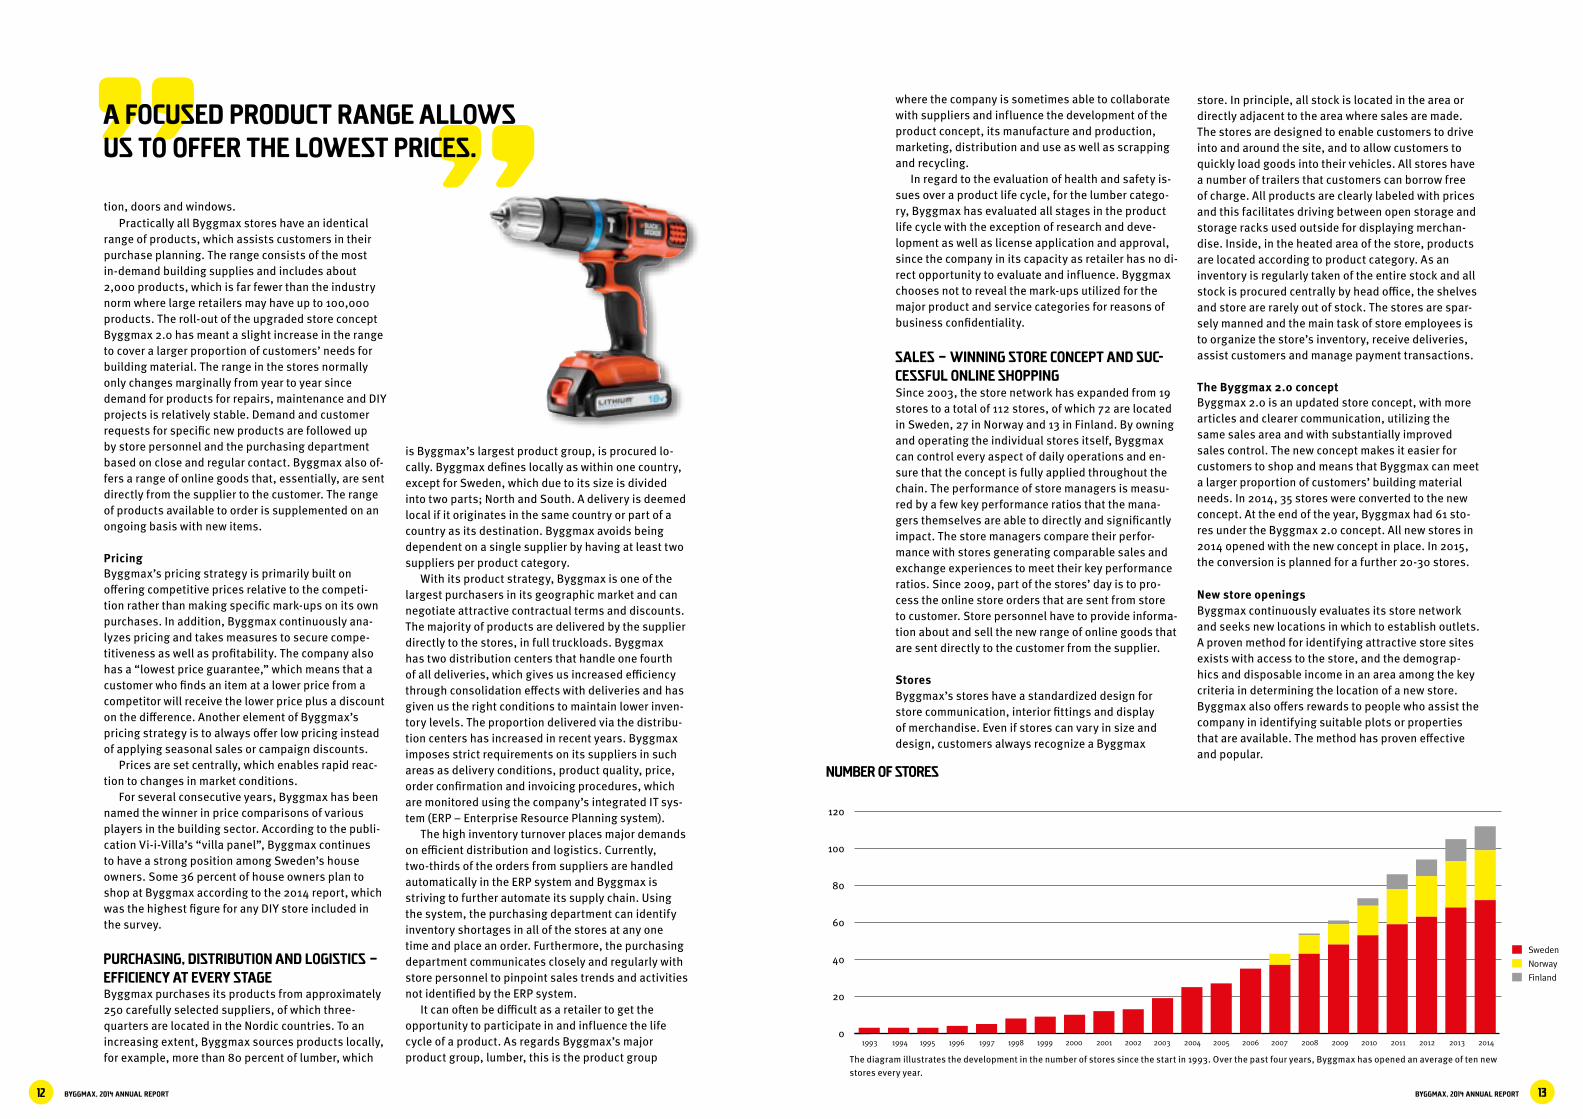
SALES – WINNING STORE CONCEPT AND SUC-CESSFUL ONLINE SHOPPINGSince 2003, the store network has expanded from 19 stores to a total of 112 stores, of which 72 are located in Sweden, 27 in Norway and 13 in Finland. By owning and operating the individual stores itself, Byggmax can control every aspect of daily operations and en-sure that the concept is fully applied throughout the chain. The performance of store managers is measu-red by a few key performance ratios that the mana-gers themselves are able to directly and significantly impact. The store managers compare their perfor-mance with stores generating comparable sales and exchange experiences to meet their key performance ratios. Since 2009, part of the stores’ day is to pro-cess the online store orders that are sent from store to customer. Store personnel have to provide informa-tion about and sell the new range of online goods that are sent directly to the customer from the supplier.
StoresByggmax’s stores have a standardized design for store communication, interior fittings and display of merchandise. Even if stores can vary in size and design, customers always recognize a Byggmax
store. In principle, all stock is located in the area or directly adjacent to the area where sales are made. The stores are designed to enable customers to drive into and around the site, and to allow customers to quickly load goods into their vehicles. All stores have a number of trailers that customers can borrow free of charge. All products are clearly labeled with prices and this facilitates driving between open storage and storage racks used outside for displaying merchan-dise. Inside, in the heated area of the store, products are located according to product category. As an inventory is regularly taken of the entire stock and all stock is procured centrally by head office, the shelves and store are rarely out of stock. The stores are spar-sely manned and the main task of store employees is to organize the store’s inventory, receive deliveries, assist customers and manage payment transactions.
The Byggmax 2.0 conceptByggmax 2.0 is an updated store concept, with more articles and clearer communication, utilizing the same sales area and with substantially improved sales control. The new concept makes it easier for customers to shop and means that Byggmax can meet a larger proportion of customers’ building material needs. In 2014, 35 stores were converted to the new concept. At the end of the year, Byggmax had 61 sto-res under the Byggmax 2.0 concept. All new stores in 2014 opened with the new concept in place. In 2015, the conversion is planned for a further 20-30 stores.
New store openingsByggmax continuously evaluates its store network and seeks new locations in which to establish outlets. A proven method for identifying attractive store sites exists with access to the store, and the demograp-hics and disposable income in an area among the key criteria in determining the location of a new store. Byggmax also offers rewards to people who assist the company in identifying suitable plots or properties that are available. The method has proven effective and popular.
” ”
The diagram illustrates the development in the number of stores since the start in 1993. Over the past four years, Byggmax has opened an average of ten new stores every year.
0
20
40
60
80
100
120
1993 1994 1995 1996 1997 1999 2000 2001 2002 2003 2004 2005 2006 2007 2008 2009 2010 2012 2013 201420111998
Sweden
Norway
Finland
NUMBER OF STORES
A FOCUSED PRODUCT RANGE ALLOWS US TO OFFER THE LOWEST PRICES.
BYGGMAX, 2014 ANNUAL REPORT 15BYGGMAX, 2014 ANNUAL REPORT14
MARKETING – CONSISTENT BRAND STRATEGY-The brand has been steadily strengthened as a result of Byggmax consistently applying its concept and continuously expanding the store network. Byggmax has now managed to achieve nationwide brand recognition in Sweden and high brand recognition in Norway and Finland, where the chain was launched in 2007 and 2008 respectively. The brand is strengthe-ned by the company’s distinct business concept and the characteristic and effective store design.
Byggmax has invested substantial time and effort in developing its brand and attaining econo-mies of scale in its marketing concept. Advertising uses a consistent form of expression, with realistic situations and real customer projects, which adds a documentary feeling to activities, all in line with the strategy of making things easy for DIY enthusiasts. The same concept, with local adjustments, is used in Sweden and Norway, while Finland applies its own concept, but with the same values and feelings.
Byggmax has utilized the concepts “Sweden is building” and “Norway is building” in these countries in the period from 2010 to 2014. Byggmax’s custo-mers are the main characters in television commerci-als, advertisements, direct mail and on the website. Customers are interviewed while carrying out their building project over a summer and comment, without being directed, on Byggmax and its products. The concept demonstrates the geographical spread of Byggmax by using customers from all over Sweden. In particular, according to independent trade publi-cations and surveys, it has strengthened Byggmax’s price profile and brand. Byggmax does not use any advertising agencies. TV commercials are produced with the assistance of production companies and all Byggmax advertising is produced in-house.
EMPLOYEES
STRONG CORPORATE CULTURE - BYGGMAX’S VALUESByggmax’s solid corporate culture – Byggmax’s values – is a prerequisite for the successful applica-tion and development of the company’s business model. The corporate culture highlights freedom of action and clearly defined areas of responsibility for employees, in addition to a flat and communicative organization, cost awareness, continuously improved business processes and efficiency in daily operations.
Consultants are seldom used, and regional ma-nagers are normally recruited internally – primarily through the promotion of store managers. As a result, the organization is characterized by efficient decisi-on-making processes and a distinct entrepreneurial spirit.
The corporate culture is maintained by means of robust and integrated business methods, continuous internal communication and through the presence of corporate culture bearers with extensive experience in various areas of operations. All head office person-nel work at least once per year out in the stores to maintain their links to store operations.
Byggmax applies a lean approach at both the head office and in the stores. Application of a lean ap-proach means working with resource efficiency and minimizing waste.
ORGANIZATION – FUNCTION-CONTROLLED MANAGEMENTByggmax has a resource-efficient organization with the majority of business activities centrally mana-ged. Aside from the sales force, which is based in Byggmax stores, most business processes are mana-ged function-wide across all stores by the head office in Solna, near Stockholm. Thus, there are no local of-fices – a feature that contributes to the efficiency and economies of scale that characterize the Byggmax concept.
Store operations are organized around two main areas of responsibility, namely, regional and store management. Regional managers are responsible for the management, operation and financial performan-ce of a number of stores in a specific region and for identifying appropriate new locations for additional outlets. Currently, there are eight regional managers in Sweden, Norway and Finland. The regional mana-gers are responsible for a number of store managers in their respective region, who in turn manage the day-to-day operations.
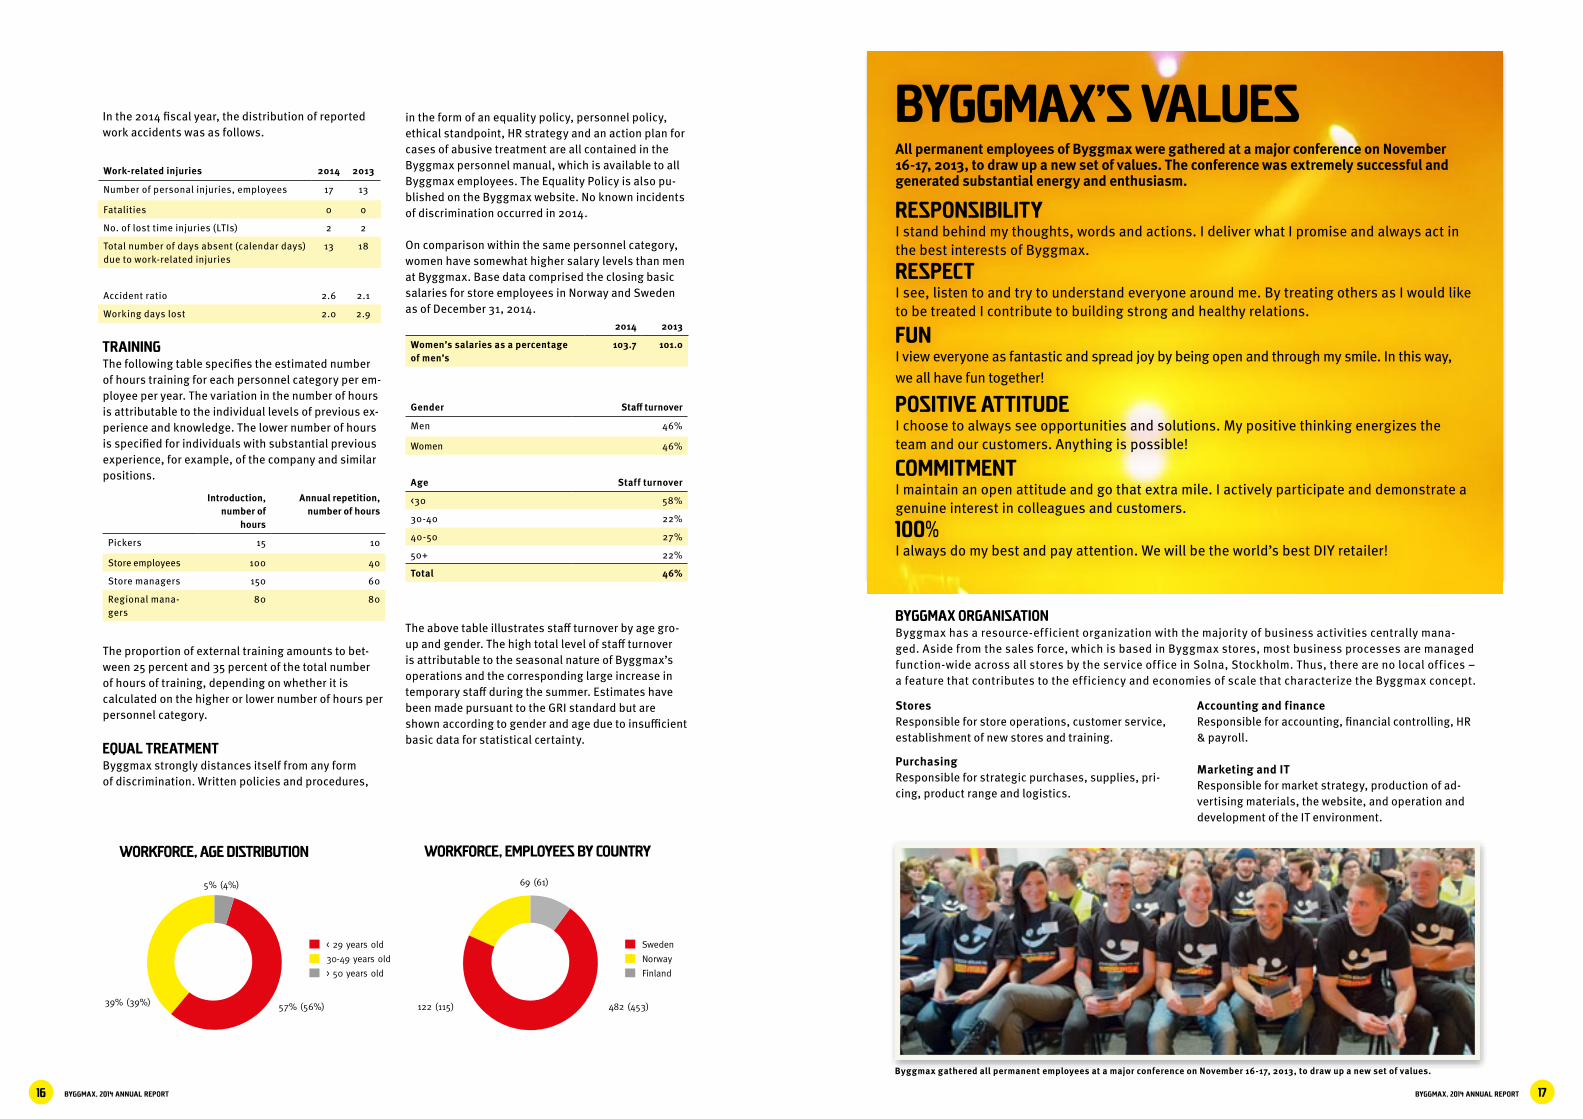
WORKFORCE – 673 “BYGGMAXERS”During 2014, Byggmax had an average of 673 full-
time employees (629), with store personnel accoun-ting for the majority of the workforce. Due to signi-ficant seasonal variations, the operations require flexible store manning, which is achieved by having a substantial proportion of part-time employees. The relatively high degree of personal freedom of action for employees in combination with clearly defined areas of responsibility has created a highly motivated organization. Work attendance in relation to normal working hours was 96 (97) percent during the year.
Investments in store personnel are made on an ongoing basis through regular internal training cour-ses in product knowledge, sales and customer ser-vice. In addition, the company uses mystery shoppers each month to evaluate stores in terms of customer service, appearance, work environment and safety.
No written rules are in place as regards employing locally. However, established practice and the nature of business activities with operations in many smal-ler communities means the store staff, including the manager, are recruited locally.
Of the Group management, 100 percent (six of six) reside in Sweden. Of other individuals in senior positions in the remainder of the organization (regio-nal managers), eight of eight (100 percent) are local employees. At the next management level down, 100 percent of store managers in Sweden and Finland are locally employed and the corresponding figure for Norway is 68 percent.
Byggmax receives subsidies for the employment of certain members of staff who are participating in various state-funded employment measures to promote employment. The total amount received in such subsidies totaled SEK 6.1 M in 2014 and SEK 5.9 M in 2013.
SYSTEMATIC WORK ENVIRONMENT PROGRAMSince 2008, Byggmax has had an extensive systema-tic work environment program, in which all accidents and incidents are reported pursuant to a unified standard and followed up.
Byggmax’s business model is based on a solid corporate culture, with the focus on free-dom of action and clearly defined areas of responsibility for employees.
The costs of opening a new store are limited and a new outlet is expected to contribute to profitability af-ter one year, and reach full sales maturity within two to three years. After a new rental lease is signed and the property made ready for occupancy, it normally takes Byggmax four to six weeks to open a store. The aim is to open new stores immediately before or in conjunction with the hectic summer season. During the past four years, Byggmax has opened an average of ten new stores every year. To date, Byggmax has not closed any of its stores, indicating that both the underlying analysis and expansion model works well. If Byggmax identifies a more attractive store loca-tion in an existing area, the store is relocated. This is one way of developing operations. In 2014, Byggmax relocated stores in Jönköping and Hudiksvall to new premises in the existing areas.
Online storeDuring 2009, Byggmax Online was launched to broa-den the company’s sales channels and capitalize on in-ternet diversity. The online store includes an interacti-ve catalog with descriptions and images of Byggmax’s complete product range. The website consistently updates prices and inventory levels for each Byggmax store. This enables customers to check from the comfort of their home if the product they are seeking is available ahead of any visit to a store. Via Byggmax’s online store, customers can also opt to order the full range of Byggmax’s products for delivery direct to their home. At the end of April 2011, Byggmax launched online goods, which means more products are avai-lable via the online store than are available from the physical stores. Byggmax launched a new platform in 2013, which has a significantly enhanced performance to the previous platform, allows an expanded range on the website and simplifies navigation. The website also contains a library with instruction films that demon-strate building processes in a pedagogic manner.
Retailing building servicesByggmax has expanded the test launch of building services both geographically as well as in terms of the range of building services offered in 2014. Byggmax customers can buy flooring and pain-ting services at fixed prices per square meter on the Byggmax website. The concept has significant potential among customers who want to renovate but who are either unable to or unwilling to do it themsel-ves. In 2015, a general launch of building services is planned for the Swedish market. Thereafter, Byggmax plans test launches in the Norwegian and Finnish markets.
BYGGMAX, 2014 ANNUAL REPORT 17BYGGMAX, 2014 ANNUAL REPORT16
Work-related injuries 2014 2013
Number of personal injuries, employees 17 13
Fatalities 0 0
No. of lost time injuries (LTIs) 2 2
Total number of days absent (calendar days) due to work-related injuries
13 18
Accident ratio 2.6 2.1
Working days lost 2.0 2.9
Introduction, number of
hours
Annual repetition, number of hours
Pickers 15 10
Store employees 100 40
Store managers 150 60
Regional mana-gers
80 80
2014 2013
Women’s salaries as a percentage of men’s
103.7 101.0
Gender Staff turnover
Men 46%
Women 46%
Age Staff turnover
<30 58%
30-40 22%
40-50 27%
50+ 22%
Total 46%
Byggmax ORGANISATION Byggmax has a resource-efficient organization with the majority of business activities centrally mana-ged. Aside from the sales force, which is based in Byggmax stores, most business processes are managed function-wide across all stores by the service office in Solna, Stockholm. Thus, there are no local offices – a feature that contributes to the efficiency and economies of scale that characterize the Byggmax concept.
In the 2014 fiscal year, the distribution of reported work accidents was as follows.
TRAININGThe following table specifies the estimated number of hours training for each personnel category per em-ployee per year. The variation in the number of hours is attributable to the individual levels of previous ex-perience and knowledge. The lower number of hours is specified for individuals with substantial previous experience, for example, of the company and similar positions.
The proportion of external training amounts to bet-ween 25 percent and 35 percent of the total number of hours of training, depending on whether it is calculated on the higher or lower number of hours per personnel category.
EQUAL TREATMENTByggmax strongly distances itself from any form of discrimination. Written policies and procedures,
in the form of an equality policy, personnel policy, ethical standpoint, HR strategy and an action plan for cases of abusive treatment are all contained in the Byggmax personnel manual, which is available to all Byggmax employees. The Equality Policy is also pu-blished on the Byggmax website. No known incidents of discrimination occurred in 2014.
On comparison within the same personnel category, women have somewhat higher salary levels than men at Byggmax. Base data comprised the closing basic salaries for store employees in Norway and Sweden as of December 31, 2014.
The above table illustrates staff turnover by age gro-up and gender. The high total level of staff turnover is attributable to the seasonal nature of Byggmax’s operations and the corresponding large increase in temporary staff during the summer. Estimates have been made pursuant to the GRI standard but are shown according to gender and age due to insufficient basic data for statistical certainty.
0
20
40
60
80
100
1993
st
ANTAL BUTIKER
1994 1995 1996 1997 1999 2000 2001 2002 2003 2004 2005 2006 2007 2008 2009 2010 201220111998
Sverige
Norge
Finland
0
500
1000
1500
2000
2500
3000
3500
0
2
4
6
8
10
12
14
Mkr %
2006
57% (56%)
5% (4%)
39% (39%)
2007 2008 2009 2011 2012 2013 20142010
482 (453)122 (115)
69 (61)
Net sales
EBITA-margin
NET SALES/EBITA MARGIN
WORKFORCE, AGE DISTRIBUTION WORKFORCE, EMPLOYEES BY COUNTRY
Sweden
Norway
Finland
< 29 years old
30-49 years old
> 50 years old
BYGGMAX’S VALUESAll permanent employees of Byggmax were gathered at a major conference on November 16-17, 2013, to draw up a new set of values. The conference was extremely successful and generated substantial energy and enthusiasm.
RESPONSIBILITYI stand behind my thoughts, words and actions. I deliver what I promise and always act in the best interests of Byggmax.
RESPECTI see, listen to and try to understand everyone around me. By treating others as I would like to be treated I contribute to building strong and healthy relations.
FUNI view everyone as fantastic and spread joy by being open and through my smile. In this way, we all have fun together!
POSITIVE ATTITUDEI choose to always see opportunities and solutions. My positive thinking energizes the team and our customers. Anything is possible!
COMMITMENTI maintain an open attitude and go that extra mile. I actively participate and demonstrate a genuine interest in colleagues and customers.
100%I always do my best and pay attention. We will be the world’s best DIY retailer!
StoresResponsible for store operations, customer service, establishment of new stores and training.
PurchasingResponsible for strategic purchases, supplies, pri-cing, product range and logistics.
Accounting and financeResponsible for accounting, financial controlling, HR & payroll.
Marketing and ITResponsible for market strategy, production of ad-vertising materials, the website, and operation and development of the IT environment.
Byggmax gathered all permanent employees at a major conference on November 16-17, 2013, to draw up a new set of values.

BYGGMAX, 2014 ANNUAL REPORT 19BYGGMAX, 2014 ANNUAL REPORT18
” ”WE ALSO STARTED PRESEN-TING OUR BEST-SELLING PRO-DUCTS MORE CLEARLY, WHICH LED TO BETTER SALES.
Mia Kamlén has succeeded with an impressive achie-vement. In just two years, she has transformed the Byggmax website from a modest entry in the digital arena to a prizewinning e-commerce site. But despite all the successes, this enthusiast is finding it difficult to be satisfied. She now aims to start a digital revolu-tion in the building materials industry.
Mia joined Byggmax in 2012, and is now responsible for the company’s fastest growing department with six full-time employees in website development and digital communication.
- When I started, there was no digital capacity what-soever. So the first measures were to organize the work of putting products and prices on the website. We could then work in a more structured manner with search engine optimization (SEO), search engine marketing (SEM) and digital communication. The next step was to make the website compatible with mobile devices.
It didn’t take long for Mia’s action plan to bear fruit. Under her leadership, Byggmax was first in Sweden with responsive e-commerce. Furthermore, in 2013, the company won Internet World’s prize for Best E-commerce Website. However, as the product range grew so did the challenges.
- The system needed modernization to manage the growing product range. Therefore, we developed a new e-commerce platform and, in parallel, increased relevance for visitors through an enhanced search function with product suggestions. We also started presenting our best-selling products more clearly, which led to better sales.
The positive trend continued throughout the remain-der of 2013. The social media presence was increased and a newsletter initiative with inspiration and simple DIY projects was launched. The result was a notable 25% increase in web sales in 2014.
But the greatest challenge is still waiting for Mia and the website team. Facing 2015, the team’s ambition level is in a class of its own.
- We want to revolutionize the way customers buy building material. At the moment, we are in full swing with developing a new service we call Design and Estimate. First out, as part of this initiative, will be Room Renovation – a tool that will make it easier than ever to renovate.
Customers draw the room to be renovated in an interactive environment and can then apply design choices, such as wallpaper, flooring, doors, windows, etc., thus creating a clear image of the end result.
When customers are satisfied with their choices, a personal shopping list is generated with all the items necessary to complete the project. Customers can then print out the list, have all the material sent to their home or order a tradesman to come and do the entire job for the customer at a fixed price. In this way, we can package building projects to make them more accessible than ever – like Lego in a construction kit.
Mia’s commitment is unmistakable when she descri-bes the advantages of Design and Estimate. Before she rushes back to her computer, her motivation bursts through one more time.
- This is about removing the single largest barrier to ideas for projects becoming a reality. Our aim is to be the world’s best, online building materials supplier and with these services mean we will have made considerable progress to that end.
THE DIGITAL REVOLUTIONARY DIALOGUE WITH BYGGMAX’S WEB MANAGER MIA KAMLÉN
Name: Mia KamlénTitle: Web ManagerAge: 37Time at Byggmax: Three yearsGoal: Become the world’s best, online building materials supplier.

BYGGMAX, 2014 ANNUAL REPORT 21BYGGMAX, 2014 ANNUAL REPORT20
OUR RESPONSIBILITY
”It is important for Byggmax to contribute to sustai-nable development in society. We started a few years ago by producing our environmental report and are continuing now with a more general report on sustai-nable development.
In the short term, it is important for us to be able to measure major parts of our impact on society, which we are doing by producing a sustainability report that follows the GRI framework for sustainabi-lity reporting. We believe that reporting pursuant to an internationally accepted framework is important to enable evaluation and comparison of various companies’ impact on society. In the mid to long term, increased efforts with development and improvement are prioritized.
Environmental impact and the greenhouse effect are issues of continued importance. Byggmax’s first report on sustainable development focused on the environment. This is also an area where Byggmax can make a direct and indirect impact.
In 2014, work continued on reducing the envi-ronmental impact, and carbon emissions per ton of goods carried declined. Waste management at stores has developed well over time and the proportion of mixed waste declined from 11 percent in 2009 to six percent in 2014, in other words, sorted and rejected waste increased from 83 percent to 87 percent in 2014.
The goal for the next few years is to continue to improve in the prioritized areas. In 2013, this applies primarily to the environmental area, where we have a measurement method that has been established over a number of years.”
Magnus Agervald, CEO
Byggmax’s guidelines for social responsibility com-prise a code of conduct for suppliers, ethical guideli-nes, environmental policy, work environment policy and equality policy. All policy documents are availa-ble in their entirety at Byggmax’s website.
Byggmax’s policy documents are based on the Global Compact and the OECD’s guidelines for multi-national companies. Below is an overview of the UN Global Compact’s ten principles in the areas of human rights, labor, the environment and anti-corruption for companies, with reference to the documents and policies where the guidelines have been incorporated into Byggmax’s operations.
HUMAN RIGHTSPrinciple 1: Businesses should support and respect the protection of internationally proclaimed human rights (Code of conduct for suppliers). Principle 2: Bu-sinesses should make sure that they are not complicit in human rights abuses (Work environment policy, Equality policy).
LABOR LEGISLATIONPrinciple 3: Businesses should uphold the freedom of association and the effective recognition of the right to collective bargaining (Code of conduct for suppli-ers).Principle 4: Businesses should uphold the elimination of all forms of forced and compulsory labor (Code of conduct for suppliers).Principle 5: Businesses should uphold the effective abolition of child labor (Code of conduct for suppli-ers).Principle 6: Businesses should uphold the elimina-tion of discrimination in respect of employment and occupation (Work environment policy, Equality policy and Code of conduct for suppliers).
ENVIRONMENT (ENVIRONMENTAL POLICY)Principle 7: Businesses should support a precautio-nary approach to environmental challenges.Principle 8: Businesses should undertake initiatives to promote greater environmental responsibility.Principle 9: Businesses should encourage the deve-lopment and diffusion of environmentally friendly technologies.
ANTI-CORRUPTIONPrinciple 10: Businesses should work against corrup-tion in all its forms, including extortion and bribery (Code of conduct for suppliers and Ethical guidelines).
Byggmax’s values serve as a supplement to the above documents. All of these documents form part of the Byggmax work environment process, which ensures that these policy documents remain relevant for the organization.
BYGGMAX IMPACTSince Byggmax performs a minor portion of its pro-curement in Asia, about 5 percent, the risks asso-ciated with such procurements are relatively limited compared with if the proportion had been higher. However, these risks are not negligible. The greatest opportunity for Byggmax to make an impact is in rela-tion to the environment, specifically, the transport of goods to stores.
Byggmax’s guidelines for social responsibility comprise a code of conduct for supp-liers, ethical guidelines, environmental policy, work environment policy and equality policy. All policy documents are available in their entirety on Byggmax’s website.
MEASURING METHODS AND REVIEWThe Annual Report contains various numerical mea-surements applicable to the company’s impact on society. The measuring methods used are primarily the aggregate of actual outcomes at stores. When it is impractical to track outcomes per store, tracking is sometimes performed on an aggregate level. In some cases, a single product category has been selected for tracking. In such instances, it is necessary for Byggmax to be a relatively large buyer to be able to influence various supplier behaviors and, conse-quently, not all product categories are relevant.
To reconcile and support the measuring methods utilized, Byggmax has examined this summary and reporting based on the guidelines for sustainability reporting G3.0, produced by the international stake-holder organization the Global Reporting Initiative (GRI). This examination was performed by Tyréns AB, an external consulting firm.
STAKEHOLDERSByggmax maintains contact with a number of stake-holder groups. These include customers, suppliers, employees, politicians, property owners, neighbors and shareholders to name but a few. The policy applied to select which stakeholders Byggmax will systematically communicate with has been to select those parties with which communication is frequent at present. A description follows of how Byggmax communicates with key stakeholders:
Customers: Through advertising, the website, customer service and employees in the store. This communication is conducted on a daily basis.
Suppliers: Through the head office via purchasing. This communication is conducted on a daily basis.
Employees: Via intranet, through the company’s management structure and through training. This communication is conducted on a daily basis. In addi-tion, an annual employee survey has been performed since 2011.
Politicians: Byggmax has relatively limited contact with political organizations and spokespersons. The company is a member of a European collaboration, EDRA, which has a number of contacts at EU level. EDRA has meetings two to four times per year at which Byggmax participates.
Owners: Byggmax submits financial reports every quarter. In addition, the company participates in Small Cap meetings arranged by shareholder clubs three to five times per year, meets investors in conjun-ction with the interim reports and invites sharehol-ders to the annual general meetings.
Core issues for Byggmax stakeholders are defined as follows:
Customers: Product quality and price.Suppliers: The stability of Byggmax as a customerEmployees: The stability and attractiveness of
Byggmax as an employer.Politicians: The stability of Byggmax as an employ-
er and the Group’s contribution to society as a whole.Owners: Future dividends from Byggmax and sus-
tainable business.Over the past few years, Byggmax has produced a
structured environmental report. This was included in the Annual Report and extracts from it have been displayed on signs in stores. A number of Byggmax’s owners who invested in conjunction with the stock ex-change listing of Byggmax in 2010 have indicated that they would like to see a complete review of the impact of Byggmax in line with the GRI framework.
CODE OF CONDUCT FOR SUPPLIERSByggmax does not conduct manufacturing operations but instead buys its products from some 250 carefully selected suppliers. The company’s purchasing strives to find products that hold high quality and which fol-low relevant standards.
The company has guidelines that cover work con-ditions and social responsibility in its own operations as well as in relationships with suppliers of products and services. The code of conduct complies with the UN’s Global Compact and the OECD’s guidelines for multinational companies. Suppliers are personally responsible for ensuring that their operations are pursued in line with the code of conduct and, when requested, must provide Byggmax with information concerning their sub-suppliers.
BYGGMAX, 2014 ANNUAL REPORT 23BYGGMAX, 2014 ANNUAL REPORT22
ETHICAL GUIDELINESByggmax’s employees must fulfill their undertakings in a manner that does not abuse the company’s confidence. This means, for example, that employees must not abuse corporate information, act in matters in which they are partial, or permit their personal undertakings to take precedence over their duty and responsibility to Byggmax.
In their capacity as employees of Byggmax, personnel must not offer, request or accept inappro-priate gifts, payments or trips for themselves or for relatives. Under no circumstances are employees at Byggmax to participate in any cartel or act in a man-ner that improperly curtails free competition.
ENVIRONMENTAL POLICYUsing active environmental programs, Byggmax promotes sustainable social development. Byggmax primarily impacts the environment through product transport, the environmentally hazardous content of packaging and products, printing and distribution of brochures, and through the energy consumption of business activities. The company takes environme-ntal considerations into account in all decisions and at all levels of operations and endeavors to comply with applicable legislation and other environmental requirements.
Environmental programs are based on a life-cycle perspective and thus take into account the environ-mental impact throughout the product’s entire value chain. The company pursues continuous dialog with suppliers and entrepreneurs and imposes relevant requirements. Byggmax also seeks to raise employee awareness of environmental issues and stimulates participation in environmental work. In addition, the share of green products will increase, supplemented by improvements in environmental information for customers. Environmental programs are based on an environmental policy with tangible objectives and measures for priority areas. The programs are asses-sed each year in an environmental report that measu-res the status and development in each area. The goal is to achieve improvement in priority areas from year to year.
WORK ENVIRONMENT POLICYThe goals of Byggmax’s systematic work environment programs are to prevent occupationally related illnes-ses and promote a good physical and psychosocial work environment. These efforts encompass the study of working conditions, risk assessment, imple-mentation of preventive measures and the monitoring
of business activities. To facilitate these programs, considerable efforts are made to ensure that all the company’s executives undergo training in work environment-related programs and fire safety.
The company endeavors to handle work environ-ment issues locally in the organization and make them a natural part of day-to-day activities. The CEO has primary responsibility for work environment pro-grams and fire safety in the organization. The regio-nal managers are responsible for ensuring that store managers in their region have undergone training and that the established procedures are complied with. All store managers are responsible for safety, fire safety and the work environment at their facilities and must ensure that all employees have received basic training in these issues, as well as access to current legislation and regulations in addition to the opportu-nity to participate in work environment programs.
EQUALITY POLICYByggmax seeks to create an environment in which women and men – both as groups and individu-als – jointly and equally create range and totality in operations. The company endeavors to create an awareness of gender and equality that permeates the entire organization and which forms a natural part of internal and external recruitment, pay setting and pay negotiations. Women and men have equal rights, obligations and opportunities within the framework of their employment at Byggmax. This applies both to the physical and psychosocial work environment.
BYGGMAX GRI PROFILEThe Byggmax GRI profile is available on page 88 with page references. Byggmax reports in line with the A+ level, which is the highest level under the GRI.
BYGGMAX 2014 ENVIRONMENTAL REPORTIntroductionDuring 2009, Byggmax initiated its environmental program through the creation of an environmental policy with environmental goals. As a consequence of this policy, an environmental report has been produced and efforts were initiated to continuously achieve improvements to reduce the organization’s negative impact on the environment.
Byggmax’s main impact on the environment is de-fined in the environmental policy as follows:• transportation of products from manufacturer to store or warehouse and from store to customer• the products’ contents of environmentally hazard ous substances and the products’ packaging• printing and distribution of brochures• energy consumption in business activities
Byggmax’s environmental policy stipulates yearly measurement of the status and trends in the afore-mentioned items, in the form of measures implement-ed and quantitative measurement where possible. The ambition is to improve every year in the areas specified above. The goal is a 25-percent reduction, per ton transported, in emissions of carbon dioxide and other greenhouse gases between 2009 and 2020.
The calculation methods utilized and the format of the report are checked by an external consultant.
TransportationIn 2014, the performance of our own distribution centers stabilized and ordering procedures were fine tuned. Warehouse facilities were unchanged during
2014 2013 2012 Trend 2013-2014
Trend 2009-2014
Transported goods [thousand tons] 565.9 521.5 484.1 9% 43%
Freight [million ton-kilometers] 343.2 319.1 347.2 8% 26%
Of which marine [million ton-kilometers] 76.5 56.2 88.9 36% 63%
Share marine 22% 18% 26% 27% 29%
Of which rail [million ton-kilometers] 0.0 0.0 0.0 0% 0%
Share rail 0.0% 0.0% 0.0% 0% 0%
Of which road [million ton-kilometers] 266.7 262.1 258.4 2% 19%
Share road 78% 82% 74% -5% -6%
Freight per ton [ton-kilometers/ton] 606 612 717 -1% -12%
CO2 emissions per ton of goods trans-ported [kg]
28.4 30.0 32.7 -6% -19%
CO2 per krona of sales [kg/SEK] 4.5 4.9 5.1 -7% -20%
Absolute carbon emissions, CO2 [ton] 16,046 15,662 15,816 2% 16%
Table 1, compilation of key freight ratios. Emissions per ton-kilometer are based on emission data from ntmcalc.se.
the year, but the loading schedule underwent a major review, which has opened up for considerably more consolidated shipments and more resource-efficient flows.
This has result-ed in transport work per ton of goods trans-ported decreasing for the third consecutive year. The quantity of CO2 per ton of trans-ported goods declined 19 percent compared with 2009. Given the improvements posted over the past few years, the target of a 25-percent reduction will be reached as early as 2016.
The proportion of marine freight in-creased slightly, which was partially attributable to excess inventory for certain product groups which are generally transport-ed over long distances by ship. As these inventories declined, more needed to be ordered for the coming year, which is also reflected in the increased number of ton-kilometers of marine freight. As a consequence of the above, the proportion of road freight declined by a corresponding amount.
OUR RESPONSIBILITY, CONTINUED

BYGGMAX, 2014 ANNUAL REPORT 25BYGGMAX, 2014 ANNUAL REPORT24
“WE FOLLOW BYGGMAX’S INSTRUC-TION VIDEOS TO THE LETTER”For Gun and Lennart the good old days are part of daily life. But when it’s time to lay roofing
felt, they’re not afraid to roll up their sleeves and surf in to www.byggmax.se. Lennart: At the moment we’re replacing our
roof. We looked at Byggmax’s instruction vid-eo about the right way to lay roofing felt and
we’ve tried to follow that to the letter. It’s important not to forget the safety harness
when I go up on the roof – otherwise Gun gets angry.
Gun: The video gives excellent step-
by-step instructions on needs to do. We normally go to Byggmax when
we have a project – the last time was when we rebuilt the kitch-
en to what it looked like back in the 1700s. I’m extremely
interested in old things, it comes from parents and ancestors having lived in this house. Lennart: I also like old things and, most of all, motor vehicles. The oldest car I have is a Model T Ford, which is almost a hundred years old. I got it because it needs a different technique for driving and is a challenge compared with modern cars. When we go out in the car we dress up as people used to when the car was new.
Gun: It’s fun to drive around in period clothing. When would I otherwise get the chance to wear my grandmother’s wedding dress from 1901?
The benefit of laying roofing felt: the view.
Byg
gmax
adv
erti
sing
cir
cula
r in
Swed
en,
Augu
st 2
014
2014 2013 2012 Trend 2013-2014 Trend 2009-2014
NOx [g/ton] 246 256 285 -4% -17%
CO [g/ton] 63.7 66.3 71.2 -4% -16%
HC [g/ton] 10.8 11.1 12.4 -3% -16%
Particles [g/ton] 6.1 6.1 7.1 -1% -14%
NOx [ton] 139.0 133.4 138.7 4% 18%
CO [ton] 36.0 34.6 34.6 4% 20%
HC [ton] 6.1 5.8 6.1 5% 20%
Particles [ton] 3.4 3.2 3.5 8% 23%
Table 2, emissions of greenhouse gases and environmentally hazardous substances per ton of goods transported and in absolute measures.
Emissions per ton-kilometer are based on emission data from ntmcalc.se.
The emissions calculations did not include online goods deliveries and home deliveries from stores. At present, such freight comprises a relatively small por-tion of the company’s total goods freight. A constant-ly increasing proportion of online goods and home deliveries also reduces the amount of freight and emissions, in part through optimizing freight to end customers, and in part through customers ordering online and not utilizing their vehicles to go shopping.
Products and packagingProducts and packaging affect the environment directly and indirectly, for example, through the raw materials they contain, the energy required in their manufacture and in use, and to the extent to which they are recycled or reused at the end of their service life.
Byggmax works actively to promote the use of wood and thus reduce the use of less environmentally friendly material including concrete, cement and hard plastic. Byggmax only retails NTR-labeled pressure-treated lumber that complies with the environmental goals set by the Swedish Wood Preserving Asso-ciation and the Nordic Wood Preservation Council. Lumber is procured from Nordic suppliers and in full loads directly from sawmills to minimize environmen-tal impact.
All parquet flooring and timber sold is labeled FSC, Forest Stewardship Council, the international envi-ronmental labeling that aims to promote sustainable forestry.
Byggmax handles goods with a low proportion of packaging. Only about 10 percent of articles sold in stores have consumer packaging, meaning packaging that is sold together with the goods and taken home by the customer. Otherwise, products have varying
types of transport packaging for protec-tion. Transport packaging is recycled in partnership with recycling centers and pallets are reused in the pallet exchange system of the major freight forward-ers and in the building pallet exchange system.
Through membership in REPA, the producer part of the Packaging and Newspaper Collection Service tasked with ensuring that packaging and newspa-pers in Sweden are collected and recycled, Byggmax shoulders its responsibility as a producer for packag-ing on all brought-in and imported goods. For goods manufactured in Sweden, it is the producer that bears the producer responsibility, meaning that Byggmax indirectly defrays the costs for handling these prod-ucts.
In Sweden, Byggmax has a broad collaboration with Ragn-Sells to ensure that as much of the stores’ waste as possible is recovered and recycled as energy or new materials. The aim is to minimize the amount of waste that goes to landfill and achieve zero mixed waste.
Mixed waste has a declining trend when viewed between 2009 and 2014, but has leveled off at about 6 percent over the last few years. Total waste volumes are increasing per store, which is attribut-able to many of the items that have been included in the range being of the type that has more transport packaging than heavy building materials.
Emissions of other greenhouse gases and environ-mentally hazardous substances, per ton transported and in absolute figures, are presented in table 2 below. This category includes nitrogen oxides (NOx), hydrocarbons (HC), carbon monoxide (CO) and small particles.
The emissions of other greenhouse gases per ton ofgoods transported is also declining over time. The fact that total emissions of greenhouse gases and en-vironmentally hazardous substances have increased since 2009 was attributable to the number of stores increasing from 61 to 112 over the corresponding pe-riod and to the stores’ geographic spread now being substantially larger than it was five years ago.
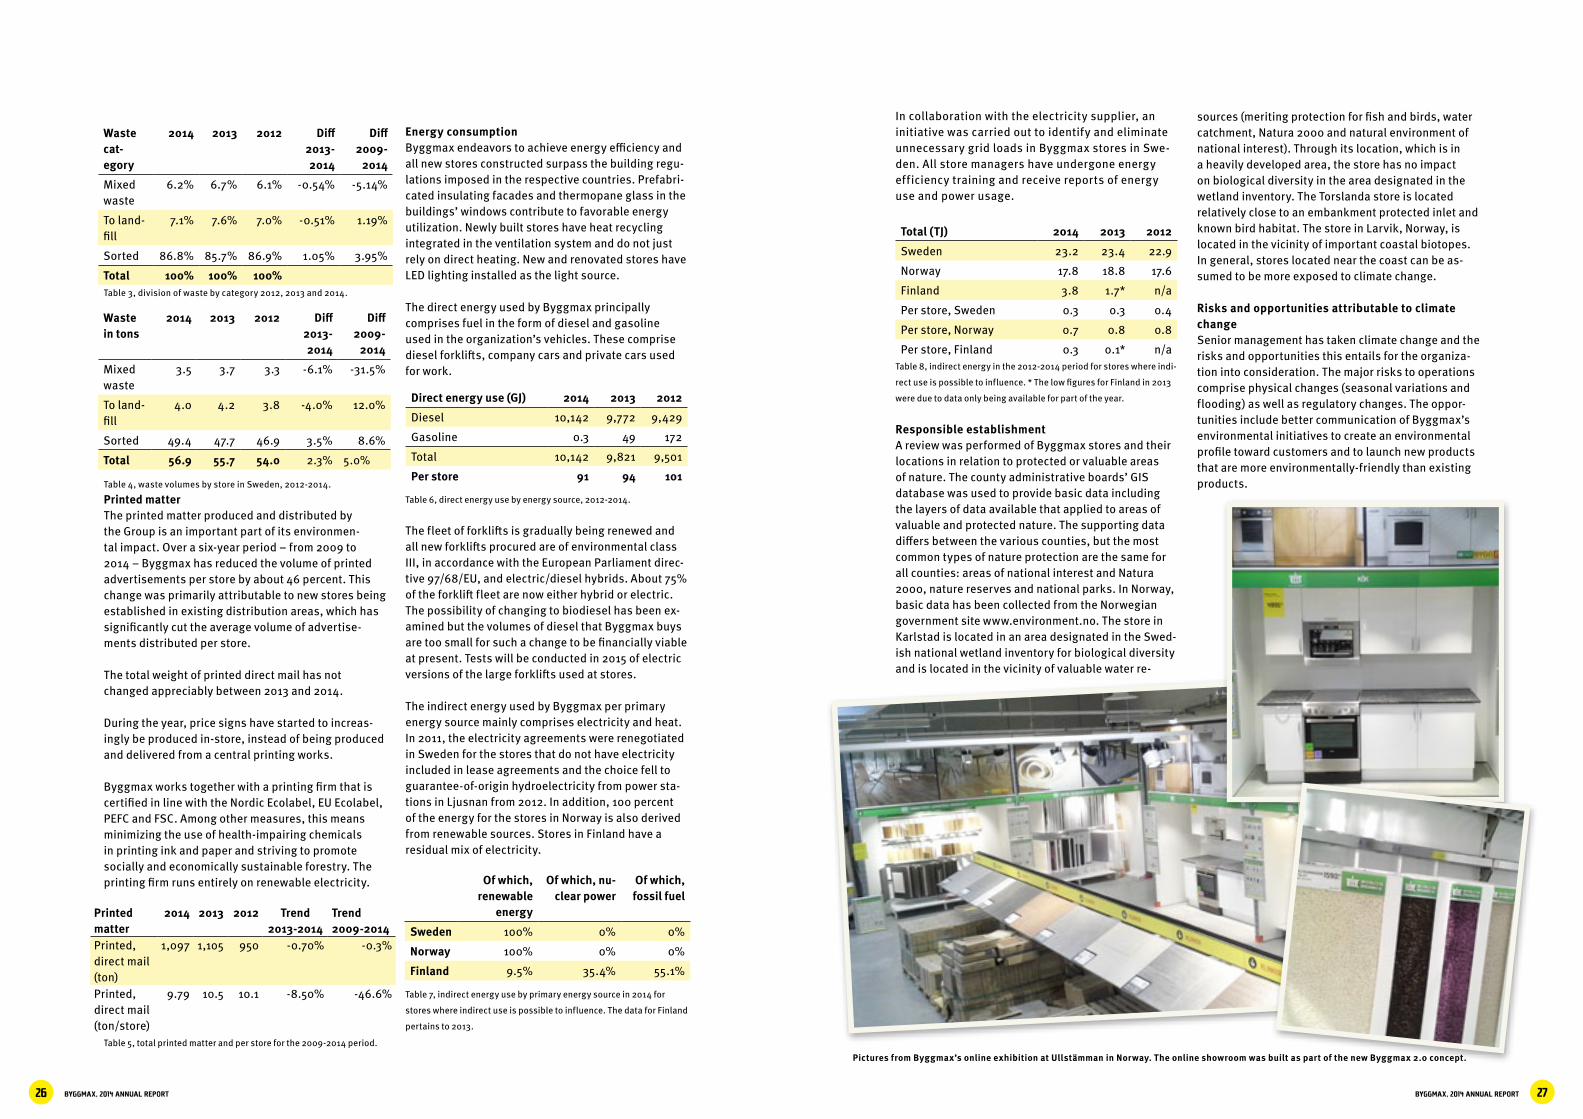
BYGGMAX, 2014 ANNUAL REPORT 27BYGGMAX, 2014 ANNUAL REPORT26
Table 3, division of waste by category 2012, 2013 and 2014.
Table 4, waste volumes by store in Sweden, 2012-2014.
Printed matterThe printed matter produced and distributed by the Group is an important part of its environmen-tal impact. Over a six-year period – from 2009 to 2014 – Byggmax has reduced the volume of printed advertisements per store by about 46 percent. This change was primarily attributable to new stores being established in existing distribution areas, which has significantly cut the average volume of advertise-ments distributed per store.
The total weight of printed direct mail has not changed appreciably between 2013 and 2014.
During the year, price signs have started to increas-ingly be produced in-store, instead of being produced and delivered from a central printing works.
Byggmax works together with a printing firm that is certified in line with the Nordic Ecolabel, EU Ecolabel, PEFC and FSC. Among other measures, this means minimizing the use of health-impairing chemicals in printing ink and paper and striving to promote socially and economically sustainable forestry. The printing firm runs entirely on renewable electricity.
Table 5, total printed matter and per store for the 2009-2014 period.
Waste cat-egory
2014 2013 2012 Diff 2013-2014
Diff 2009-
2014
Mixed waste
6.2% 6.7% 6.1% -0.54% -5.14%
To land-fill
7.1% 7.6% 7.0% -0.51% 1.19%
Sorted 86.8% 85.7% 86.9% 1.05% 3.95%
Total 100% 100% 100%
Energy consumptionByggmax endeavors to achieve energy efficiency and all new stores constructed surpass the building regu-lations imposed in the respective countries. Prefabri-cated insulating facades and thermopane glass in the buildings’ windows contribute to favorable energy utilization. Newly built stores have heat recycling integrated in the ventilation system and do not just rely on direct heating. New and renovated stores have LED lighting installed as the light source.
The direct energy used by Byggmax principally comprises fuel in the form of diesel and gasoline used in the organization’s vehicles. These comprise diesel forklifts, company cars and private cars used for work.
Table 6, direct energy use by energy source, 2012-2014.
The fleet of forklifts is gradually being renewed and all new forklifts procured are of environmental class III, in accordance with the European Parliament direc-tive 97/68/EU, and electric/diesel hybrids. About 75% of the forklift fleet are now either hybrid or electric. The possibility of changing to biodiesel has been ex-amined but the volumes of diesel that Byggmax buys are too small for such a change to be financially viable at present. Tests will be conducted in 2015 of electric versions of the large forklifts used at stores.
The indirect energy used by Byggmax per primary energy source mainly comprises electricity and heat. In 2011, the electricity agreements were renegotiated in Sweden for the stores that do not have electricity included in lease agreements and the choice fell to guarantee-of-origin hydroelectricity from power sta-tions in Ljusnan from 2012. In addition, 100 percent of the energy for the stores in Norway is also derived from renewable sources. Stores in Finland have a residual mix of electricity.
Table 7, indirect energy use by primary energy source in 2014 for
stores where indirect use is possible to influence. The data for Finland
pertains to 2013.
In collaboration with the electricity supplier, an initiative was carried out to identify and eliminate unnecessary grid loads in Byggmax stores in Swe-den. All store managers have undergone energy efficiency training and receive reports of energy use and power usage.
Total (TJ) 2014 2013 2012
Sweden 23.2 23.4 22.9
Norway 17.8 18.8 17.6
Finland 3.8 1.7* n/a
Per store, Sweden 0.3 0.3 0.4
Per store, Norway 0.7 0.8 0.8
Per store, Finland 0.3 0.1* n/aTable 8, indirect energy in the 2012-2014 period for stores where indi-
rect use is possible to influence. * The low figures for Finland in 2013
were due to data only being available for part of the year.
Responsible establishmentA review was performed of Byggmax stores and their locations in relation to protected or valuable areas of nature. The county administrative boards’ GIS database was used to provide basic data including the layers of data available that applied to areas of valuable and protected nature. The supporting data differs between the various counties, but the most common types of nature protection are the same for all counties: areas of national interest and Natura 2000, nature reserves and national parks. In Norway, basic data has been collected from the Norwegian government site www.environment.no. The store in Karlstad is located in an area designated in the Swed-ish national wetland inventory for biological diversity and is located in the vicinity of valuable water re-
Direct energy use (GJ) 2014 2013 2012
Diesel 10,142 9,772 9,429
Gasoline 0.3 49 172
Total 10,142 9,821 9,501
Per store 91 94 101
Waste in tons
2014 2013 2012 Diff 2013-2014
Diff 2009-
2014
Mixed waste
3.5 3.7 3.3 -6.1% -31.5%
To land-fill
4.0 4.2 3.8 -4.0% 12.0%
Sorted 49.4 47.7 46.9 3.5% 8.6%
Total 56.9 55.7 54.0 2.3% 5.0%
Printed matter
2014 2013 2012 Trend 2013-2014
Trend 2009-2014
Printed, direct mail (ton)
1,097 1,105 950 -0.70% -0.3%
Printed, direct mail (ton/store)
9.79 10.5 10.1 -8.50% -46.6%
Of which, renewable
energy
Of which, nu-clear power
Of which, fossil fuel
Sweden 100% 0% 0%
Norway 100% 0% 0%
Finland 9.5% 35.4% 55.1%
sources (meriting protection for fish and birds, water catchment, Natura 2000 and natural environment of national interest). Through its location, which is in a heavily developed area, the store has no impact on biological diversity in the area designated in the wetland inventory. The Torslanda store is located relatively close to an embankment protected inlet and known bird habitat. The store in Larvik, Norway, is located in the vicinity of important coastal biotopes. In general, stores located near the coast can be as-sumed to be more exposed to climate change.
Risks and opportunities attributable to climate changeSenior management has taken climate change and the risks and opportunities this entails for the organiza-tion into consideration. The major risks to operations comprise physical changes (seasonal variations and flooding) as well as regulatory changes. The oppor-tunities include better communication of Byggmax’s environmental initiatives to create an environmental profile toward customers and to launch new products that are more environmentally-friendly than existing products.
Pictures from Byggmax’s online exhibition at Ullstämman in Norway. The online showroom was built as part of the new Byggmax 2.0 concept.
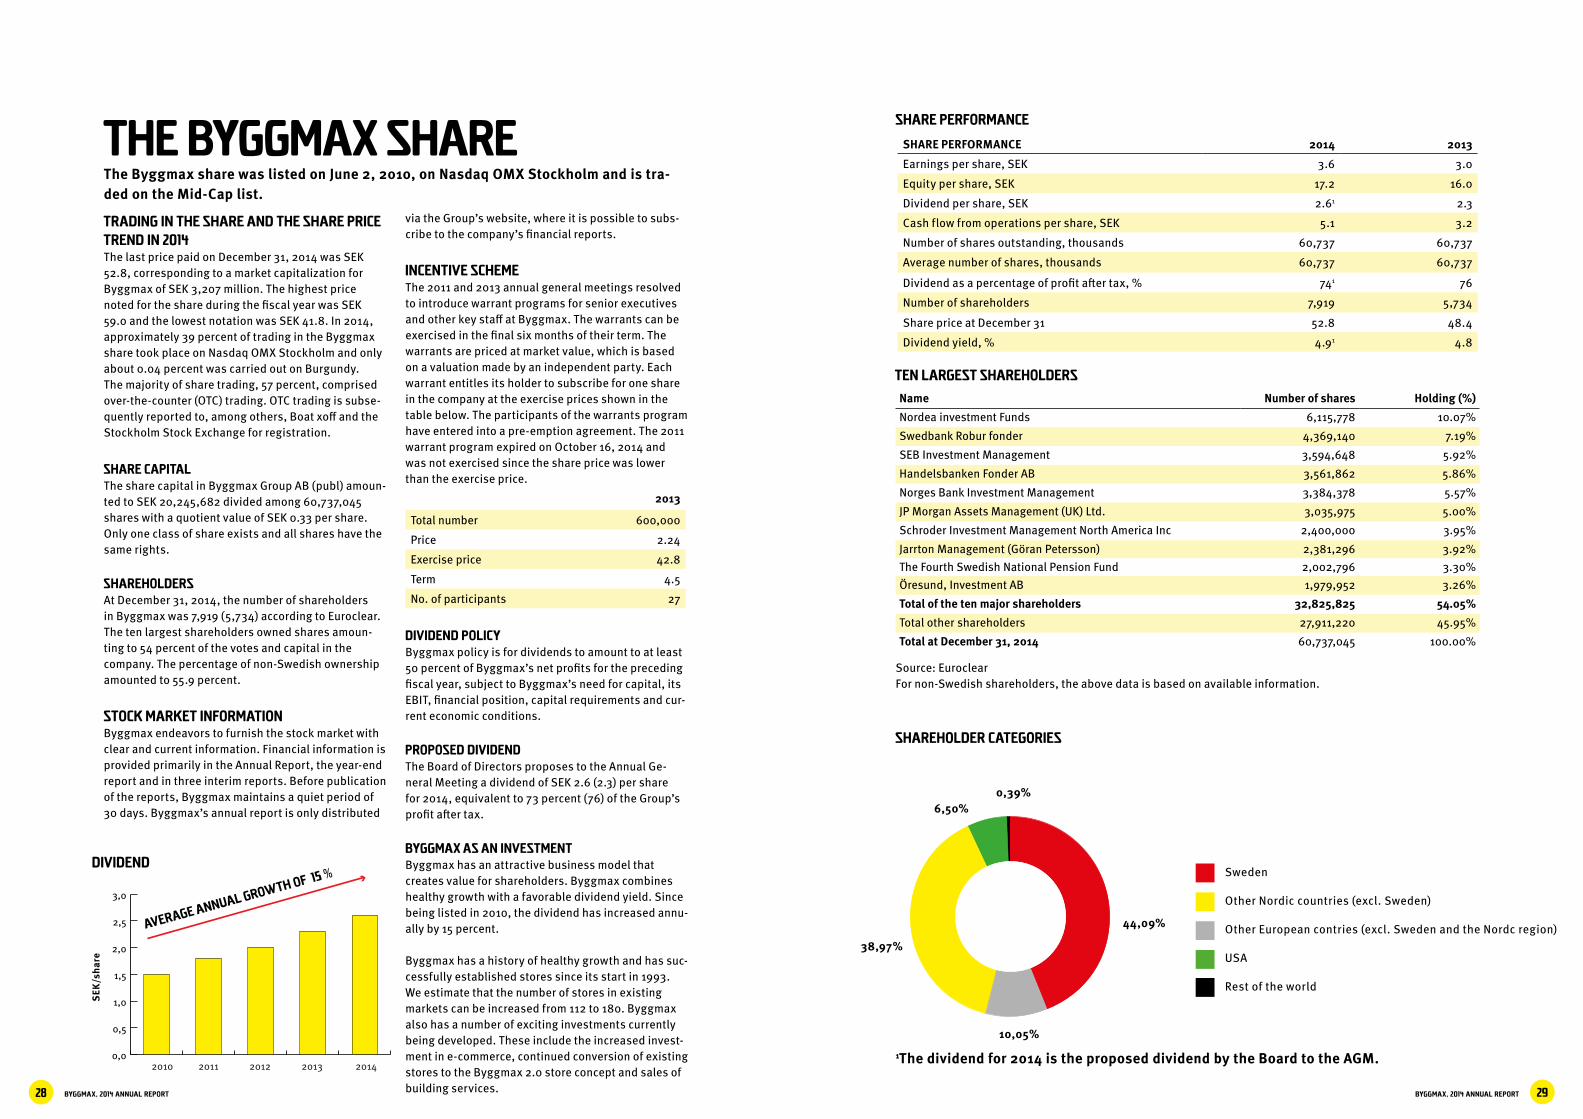
BYGGMAX, 2014 ANNUAL REPORT 29BYGGMAX, 2014 ANNUAL REPORT28
THE BYGGMAX SHARE
TRADING IN THE SHARE AND THE SHARE PRICE TREND IN 2014The last price paid on December 31, 2014 was SEK 52.8, corresponding to a market capitalization for Byggmax of SEK 3,207 million. The highest price noted for the share during the fiscal year was SEK 59.0 and the lowest notation was SEK 41.8. In 2014, approximately 39 percent of trading in the Byggmax share took place on Nasdaq OMX Stockholm and only about 0.04 percent was carried out on Burgundy. The majority of share trading, 57 percent, comprised over-the-counter (OTC) trading. OTC trading is subse-quently reported to, among others, Boat xoff and the Stockholm Stock Exchange for registration.
SHARE CAPITALThe share capital in Byggmax Group AB (publ) amoun-ted to SEK 20,245,682 divided among 60,737,045 shares with a quotient value of SEK 0.33 per share. Only one class of share exists and all shares have the same rights.
SHAREHOLDERSAt December 31, 2014, the number of shareholders in Byggmax was 7,919 (5,734) according to Euroclear. The ten largest shareholders owned shares amoun-ting to 54 percent of the votes and capital in the company. The percentage of non-Swedish ownership amounted to 55.9 percent.
STOCK MARKET INFORMATIONByggmax endeavors to furnish the stock market with clear and current information. Financial information is provided primarily in the Annual Report, the year-end report and in three interim reports. Before publication of the reports, Byggmax maintains a quiet period of 30 days. Byggmax’s annual report is only distributed
via the Group’s website, where it is possible to subs-cribe to the company’s financial reports.
INCENTIVE SCHEMEThe 2011 and 2013 annual general meetings resolved to introduce warrant programs for senior executives and other key staff at Byggmax. The warrants can be exercised in the final six months of their term. The warrants are priced at market value, which is based on a valuation made by an independent party. Each warrant entitles its holder to subscribe for one share in the company at the exercise prices shown in the table below. The participants of the warrants program have entered into a pre-emption agreement. The 2011 warrant program expired on October 16, 2014 and was not exercised since the share price was lower than the exercise price.
2013
Total number 600,000
Price 2.24
Exercise price 42.8
Term 4.5
No. of participants 27
DIVIDEND POLICYByggmax policy is for dividends to amount to at least 50 percent of Byggmax’s net profits for the preceding fiscal year, subject to Byggmax’s need for capital, its EBIT, financial position, capital requirements and cur-rent economic conditions.
PROPOSED DIVIDENDThe Board of Directors proposes to the Annual Ge-neral Meeting a dividend of SEK 2.6 (2.3) per share for 2014, equivalent to 73 percent (76) of the Group’s profit after tax.
BYGGMAX AS AN INVESTMENTByggmax has an attractive business model that creates value for shareholders. Byggmax combines healthy growth with a favorable dividend yield. Since being listed in 2010, the dividend has increased annu-ally by 15 percent.
Byggmax has a history of healthy growth and has suc-cessfully established stores since its start in 1993. We estimate that the number of stores in existing markets can be increased from 112 to 180. Byggmax also has a number of exciting investments currently being developed. These include the increased invest-ment in e-commerce, continued conversion of existing stores to the Byggmax 2.0 store concept and sales of building services.
The Byggmax share was listed on June 2, 2010, on Nasdaq OMX Stockholm and is tra-ded on the Mid-Cap list.
Name Number of shares Holding (%)Nordea investment Funds 6,115,778 10.07%
Swedbank Robur fonder 4,369,140 7.19%
SEB Investment Management 3,594,648 5.92%
Handelsbanken Fonder AB 3,561,862 5.86%
Norges Bank Investment Management 3,384,378 5.57%
JP Morgan Assets Management (UK) Ltd. 3,035,975 5.00%
Schroder Investment Management North America Inc 2,400,000 3.95%
Jarrton Management (Göran Petersson) 2,381,296 3.92%The Fourth Swedish National Pension Fund 2,002,796 3.30%Öresund, Investment AB 1,979,952 3.26%
Total of the ten major shareholders 32,825,825 54.05%Total other shareholders 27,911,220 45.95%
Total at December 31, 2014 60,737,045 100.00%
TEN LARGEST SHAREHOLDERS
SHARE PERFORMANCE
SHARE PERFORMANCE 2014 2013
Earnings per share, SEK 3.6 3.0
Equity per share, SEK 17.2 16.0
Dividend per share, SEK 2.61 2.3
Cash flow from operations per share, SEK 5.1 3.2
Number of shares outstanding, thousands 60,737 60,737
Average number of shares, thousands 60,737 60,737
Dividend as a percentage of profit after tax, % 741 76
Number of shareholders 7,919 5,734
Share price at December 31 52.8 48.4
Dividend yield, % 4.91 4.8
Source: EuroclearFor non-Swedish shareholders, the above data is based on available information.
SHAREHOLDER CATEGORIES
0,0
0,5
1,0
1,5
2,0
2,5
3,0
2010 2011 2012 2013 2014
average annual growth of 15 %Dividend
SEK
/sha
re
44,09%
10,05%
38,97%
6,50%0,39%
Sweden
Other Nordic countries (excl. Sweden)
Other European contries (excl. Sweden and the Nordc region)
USA
Rest of the world
1The dividend for 2014 is the proposed dividend by the Board to the AGM.
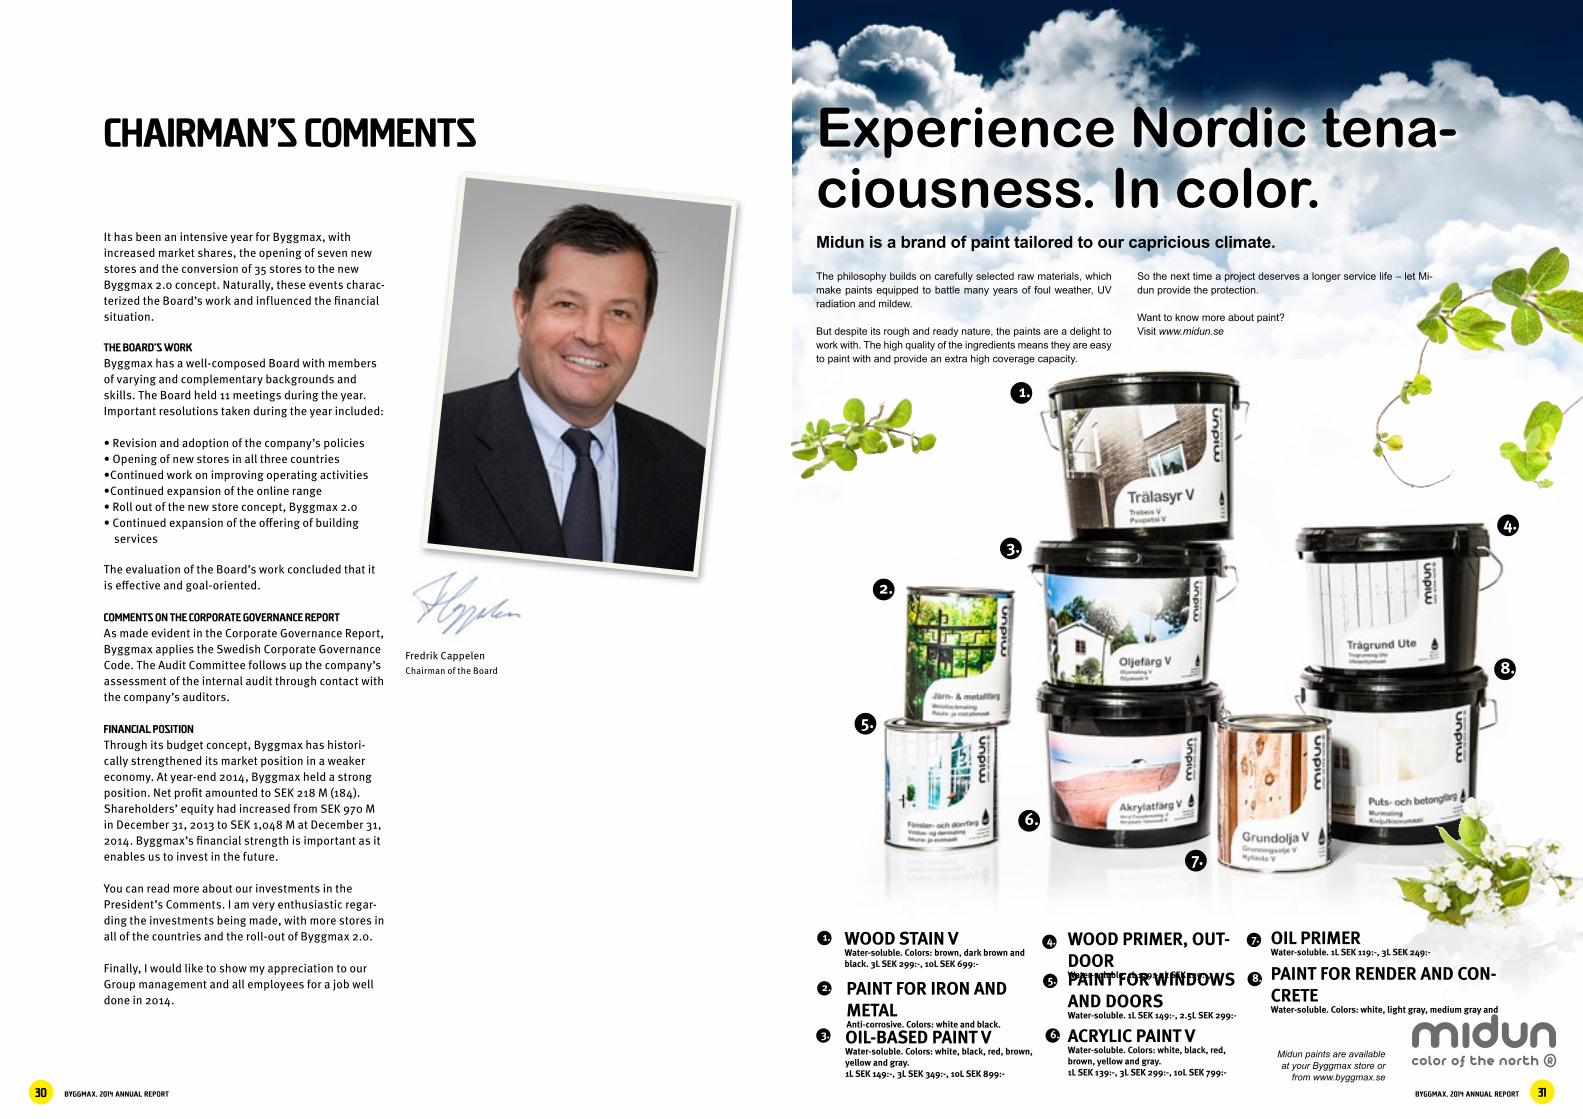
BYGGMAX, 2014 ANNUAL REPORT 31BYGGMAX, 2014 ANNUAL REPORT30
Experience Nordic tena-ciousness. In color.
WOOD STAIN VWater-soluble. Colors: brown, dark brown and black. 3L SEK 299:-, 10L SEK 699:-
WOOD PRIMER, OUT-DOORWater-soluble. 1L 129:-,1L SEK 129:-,
PAINT FOR IRON AND METALAnti-corrosive. Colors: white and black.
PAINT FOR WINDOWS AND DOORSWater-soluble. 1L SEK 149:-, 2.5L SEK 299:-
OIL-BASED PAINT VWater-soluble. Colors: white, black, red, brown, yellow and gray.1L SEK 149:-, 3L SEK 349:-, 10L SEK 899:-
ACRYLIC PAINT VWater-soluble. Colors: white, black, red, brown, yellow and gray.1L SEK 139:-, 3L SEK 299:-, 10L SEK 799:-
1. 4. 7.
2.5. 8.
3. 6.
1.
5.
4.
8.
7.
6.
2.
3.
Midun is a brand of paint tailored to our capricious climate.
The philosophy builds on carefully selected raw materials, which make paints equipped to battle many years of foul weather, UV radiation and mildew.
But despite its rough and ready nature, the paints are a delight to work with. The high quality of the ingredients means they are easy to paint with and provide an extra high coverage capacity.
So the next time a project deserves a longer service life – let Mi-dun provide the protection.
Want to know more about paint?Visit www.midun.se
OIL PRIMERWater-soluble. 1L SEK 119:-, 3L SEK 249:-
PAINT FOR RENDER AND CON-CRETEWater-soluble. Colors: white, light gray, medium gray and
color of the north RMidun paints are available at your Byggmax store or
from www.byggmax.se
CHAIRMAN’S COMMENTS
It has been an intensive year for Byggmax, with increased market shares, the opening of seven new stores and the conversion of 35 stores to the new Byggmax 2.0 concept. Naturally, these events charac-terized the Board’s work and influenced the financial situation.
THE BOARD’S WORK
Byggmax has a well-composed Board with members of varying and complementary backgrounds and skills. The Board held 11 meetings during the year. Important resolutions taken during the year included:
• Revision and adoption of the company’s policies• Opening of new stores in all three countries•Continued work on improving operating activities•Continued expansion of the online range• Roll out of the new store concept, Byggmax 2.0• Continued expansion of the offering of building services
The evaluation of the Board’s work concluded that it is effective and goal-oriented.
COMMENTS ON THE CORPORATE GOVERNANCE REPORT
As made evident in the Corporate Governance Report, Byggmax applies the Swedish Corporate Governance Code. The Audit Committee follows up the company’s assessment of the internal audit through contact with the company’s auditors.
FINANCIAL POSITION
Through its budget concept, Byggmax has histori-cally strengthened its market position in a weaker economy. At year-end 2014, Byggmax held a strong position. Net profit amounted to SEK 218 M (184). Shareholders’ equity had increased from SEK 970 M in December 31, 2013 to SEK 1,048 M at December 31, 2014. Byggmax’s financial strength is important as it enables us to invest in the future.
You can read more about our investments in the President’s Comments. I am very enthusiastic regar-ding the investments being made, with more stores in all of the countries and the roll-out of Byggmax 2.0.
Finally, I would like to show my appreciation to our Group management and all employees for a job well done in 2014.
Fredrik CappelenChairman of the Board
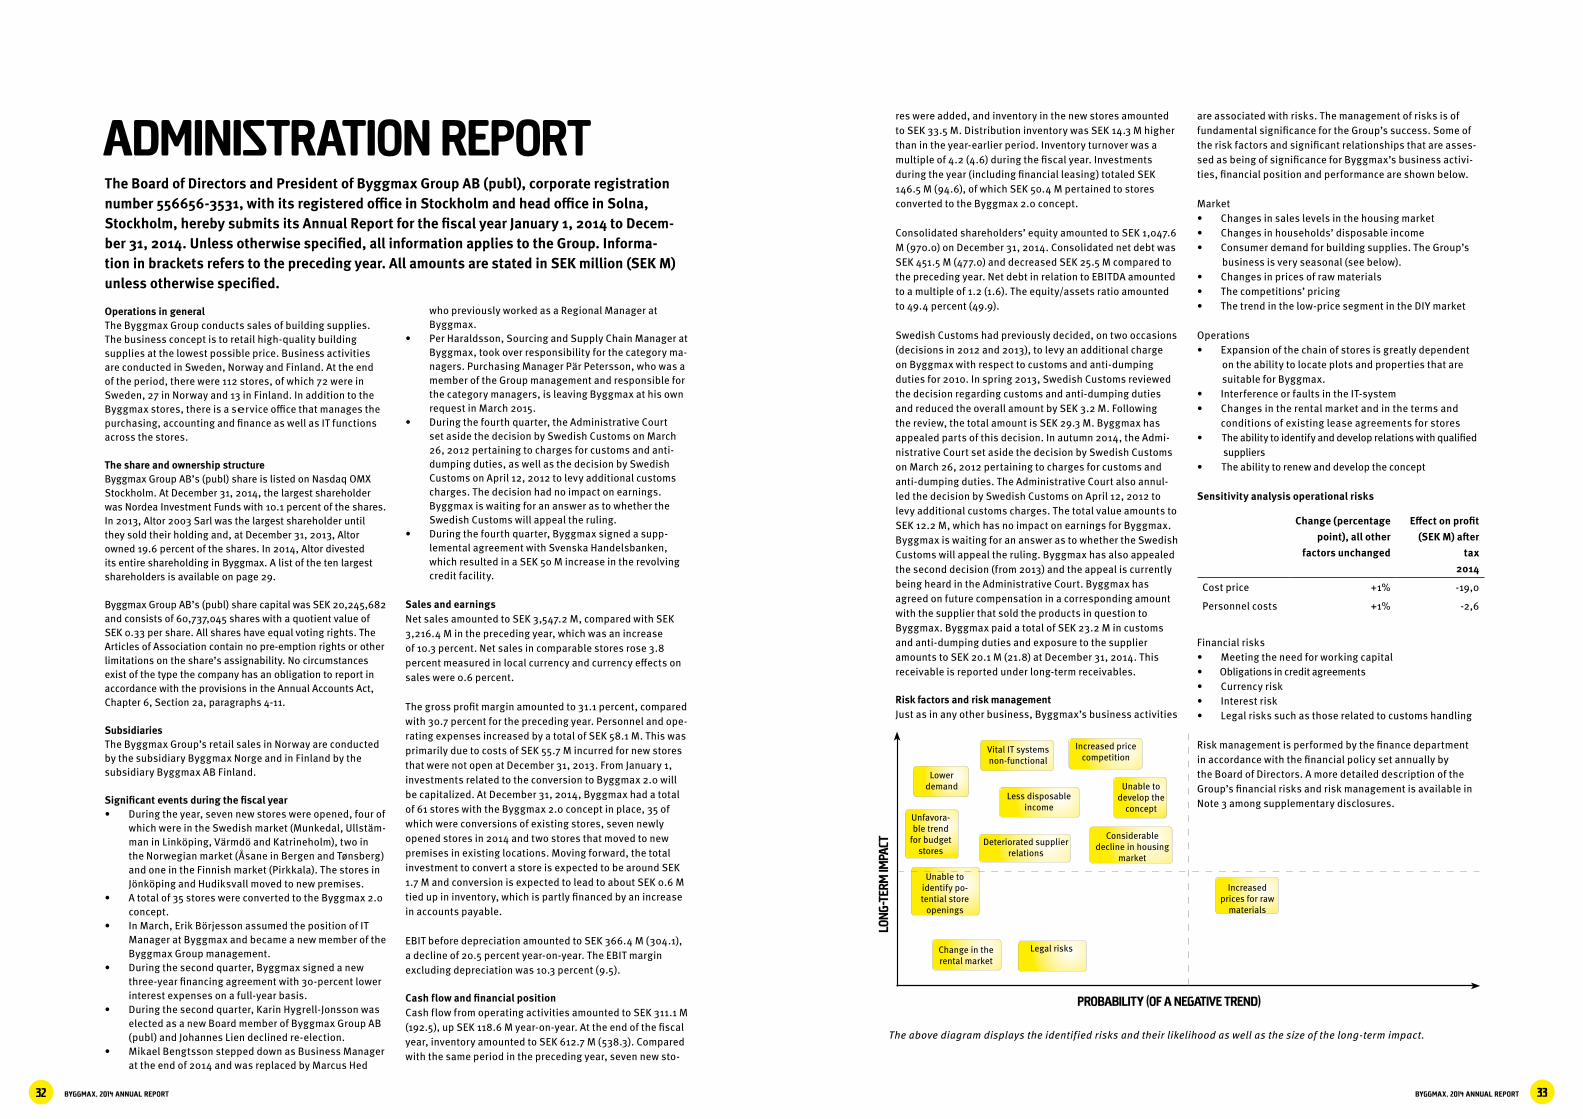
BYGGMAX, 2014 ANNUAL REPORT 33BYGGMAX, 2014 ANNUAL REPORT32
Operations in generalThe Byggmax Group conducts sales of building supplies. The business concept is to retail high-quality building supplies at the lowest possible price. Business activities are conducted in Sweden, Norway and Finland. At the end of the period, there were 112 stores, of which 72 were in Sweden, 27 in Norway and 13 in Finland. In addition to the Byggmax stores, there is a service office that manages the purchasing, accounting and finance as well as IT functions across the stores.
The share and ownership structureByggmax Group AB’s (publ) share is listed on Nasdaq OMX Stockholm. At December 31, 2014, the largest shareholder was Nordea Investment Funds with 10.1 percent of the shares. In 2013, Altor 2003 Sarl was the largest shareholder until they sold their holding and, at December 31, 2013, Altor owned 19.6 percent of the shares. In 2014, Altor divested its entire shareholding in Byggmax. A list of the ten largest shareholders is available on page 29.
Byggmax Group AB’s (publ) share capital was SEK 20,245,682 and consists of 60,737,045 shares with a quotient value of SEK 0.33 per share. All shares have equal voting rights. The Articles of Association contain no pre-emption rights or other limitations on the share’s assignability. No circumstances exist of the type the company has an obligation to report in accordance with the provisions in the Annual Accounts Act, Chapter 6, Section 2a, paragraphs 4-11.
SubsidiariesThe Byggmax Group’s retail sales in Norway are conducted by the subsidiary Byggmax Norge and in Finland by the subsidiary Byggmax AB Finland.
Significant events during the fiscal year• During the year, seven new stores were opened, four of
which were in the Swedish market (Munkedal, Ullstäm-man in Linköping, Värmdö and Katrineholm), two in the Norwegian market (Åsane in Bergen and Tønsberg) and one in the Finnish market (Pirkkala). The stores in Jönköping and Hudiksvall moved to new premises.
• A total of 35 stores were converted to the Byggmax 2.0 concept.
• In March, Erik Börjesson assumed the position of IT Manager at Byggmax and became a new member of the Byggmax Group management.
• During the second quarter, Byggmax signed a new three-year financing agreement with 30-percent lower interest expenses on a full-year basis.
• During the second quarter, Karin Hygrell-Jonsson was elected as a new Board member of Byggmax Group AB (publ) and Johannes Lien declined re-election.
• Mikael Bengtsson stepped down as Business Manager at the end of 2014 and was replaced by Marcus Hed
ADMINISTRATION REPORT
who previously worked as a Regional Manager at Byggmax.
• Per Haraldsson, Sourcing and Supply Chain Manager at Byggmax, took over responsibility for the category ma-nagers. Purchasing Manager Pär Petersson, who was a member of the Group management and responsible for the category managers, is leaving Byggmax at his own request in March 2015.
• During the fourth quarter, the Administrative Court set aside the decision by Swedish Customs on March 26, 2012 pertaining to charges for customs and anti-dumping duties, as well as the decision by Swedish Customs on April 12, 2012 to levy additional customs charges. The decision had no impact on earnings. Byggmax is waiting for an answer as to whether the Swedish Customs will appeal the ruling.
• During the fourth quarter, Byggmax signed a supp-lemental agreement with Svenska Handelsbanken, which resulted in a SEK 50 M increase in the revolving credit facility.
Sales and earningsNet sales amounted to SEK 3,547.2 M, compared with SEK 3,216.4 M in the preceding year, which was an increase of 10.3 percent. Net sales in comparable stores rose 3.8 percent measured in local currency and currency effects on sales were 0.6 percent.
The gross profit margin amounted to 31.1 percent, compared with 30.7 percent for the preceding year. Personnel and ope-rating expenses increased by a total of SEK 58.1 M. This was primarily due to costs of SEK 55.7 M incurred for new stores that were not open at December 31, 2013. From January 1, investments related to the conversion to Byggmax 2.0 will be capitalized. At December 31, 2014, Byggmax had a total of 61 stores with the Byggmax 2.0 concept in place, 35 of which were conversions of existing stores, seven newly opened stores in 2014 and two stores that moved to new premises in existing locations. Moving forward, the total investment to convert a store is expected to be around SEK 1.7 M and conversion is expected to lead to about SEK 0.6 M tied up in inventory, which is partly financed by an increase in accounts payable.
EBIT before depreciation amounted to SEK 366.4 M (304.1), a decline of 20.5 percent year-on-year. The EBIT margin excluding depreciation was 10.3 percent (9.5).
Cash flow and financial positionCash flow from operating activities amounted to SEK 311.1 M (192.5), up SEK 118.6 M year-on-year. At the end of the fiscal year, inventory amounted to SEK 612.7 M (538.3). Compared with the same period in the preceding year, seven new sto-
The Board of Directors and President of Byggmax Group AB (publ), corporate registration number 556656-3531, with its registered office in Stockholm and head office in Solna, Stockholm, hereby submits its Annual Report for the fiscal year January 1, 2014 to Decem-ber 31, 2014. Unless otherwise specified, all information applies to the Group. Informa-tion in brackets refers to the preceding year. All amounts are stated in SEK million (SEK M) unless otherwise specified.
res were added, and inventory in the new stores amounted to SEK 33.5 M. Distribution inventory was SEK 14.3 M higher than in the year-earlier period. Inventory turnover was a multiple of 4.2 (4.6) during the fiscal year. Investments during the year (including financial leasing) totaled SEK 146.5 M (94.6), of which SEK 50.4 M pertained to stores converted to the Byggmax 2.0 concept.
Consolidated shareholders’ equity amounted to SEK 1,047.6 M (970.0) on December 31, 2014. Consolidated net debt was SEK 451.5 M (477.0) and decreased SEK 25.5 M compared to the preceding year. Net debt in relation to EBITDA amounted to a multiple of 1.2 (1.6). The equity/assets ratio amounted to 49.4 percent (49.9).
Swedish Customs had previously decided, on two occasions (decisions in 2012 and 2013), to levy an additional charge on Byggmax with respect to customs and anti-dumping duties for 2010. In spring 2013, Swedish Customs reviewed the decision regarding customs and anti-dumping duties and reduced the overall amount by SEK 3.2 M. Following the review, the total amount is SEK 29.3 M. Byggmax has appealed parts of this decision. In autumn 2014, the Admi-nistrative Court set aside the decision by Swedish Customs on March 26, 2012 pertaining to charges for customs and anti-dumping duties. The Administrative Court also annul-led the decision by Swedish Customs on April 12, 2012 to levy additional customs charges. The total value amounts to SEK 12.2 M, which has no impact on earnings for Byggmax. Byggmax is waiting for an answer as to whether the Swedish Customs will appeal the ruling. Byggmax has also appealed the second decision (from 2013) and the appeal is currently being heard in the Administrative Court. Byggmax has agreed on future compensation in a corresponding amount with the supplier that sold the products in question to Byggmax. Byggmax paid a total of SEK 23.2 M in customs and anti-dumping duties and exposure to the supplier amounts to SEK 20.1 M (21.8) at December 31, 2014. This receivable is reported under long-term receivables.
Risk factors and risk managementJust as in any other business, Byggmax’s business activities
are associated with risks. The management of risks is of fundamental significance for the Group’s success. Some of the risk factors and significant relationships that are asses-sed as being of significance for Byggmax’s business activi-ties, financial position and performance are shown below.
Market• Changes in sales levels in the housing market• Changes in households’ disposable income• Consumer demand for building supplies. The Group’s business is very seasonal (see below).• Changes in prices of raw materials• The competitions’ pricing• The trend in the low-price segment in the DIY market
Operations• Expansion of the chain of stores is greatly dependent on the ability to locate plots and properties that are suitable for Byggmax.• Interference or faults in the IT-system• Changes in the rental market and in the terms and conditions of existing lease agreements for stores• The ability to identify and develop relations with qualified suppliers• The ability to renew and develop the concept
Sensitivity analysis operational risks
Change (percentage point), all other
factors unchanged
Effect on profit (SEK M) after
tax 2014
Cost price +1% -19,0
Personnel costs +1% -2,6
Financial risks• Meeting the need for working capital• Obligations in credit agreements• Currency risk• Interest risk• Legal risks such as those related to customs handling
Risk management is performed by the finance department in accordance with the financial policy set annually by the Board of Directors. A more detailed description of the Group’s financial risks and risk management is available in Note 3 among supplementary disclosures.
LON
G-TE
RM IM
PACT
PROBABILITY (OF A NEGATIVE TREND)
Increased prices for raw
materials
Deteriorated supplier relations
Unable to identify po-tential store
openings
Unable to develop the
concept
Change in the rental market
Considerable decline in housing
market
Vital IT systems non-functional
Increased price competition
Less disposable income
Lower demand
Unfavora-ble trend
for budget stores
Legal risks
The above diagram displays the identified risks and their likelihood as well as the size of the long-term impact.
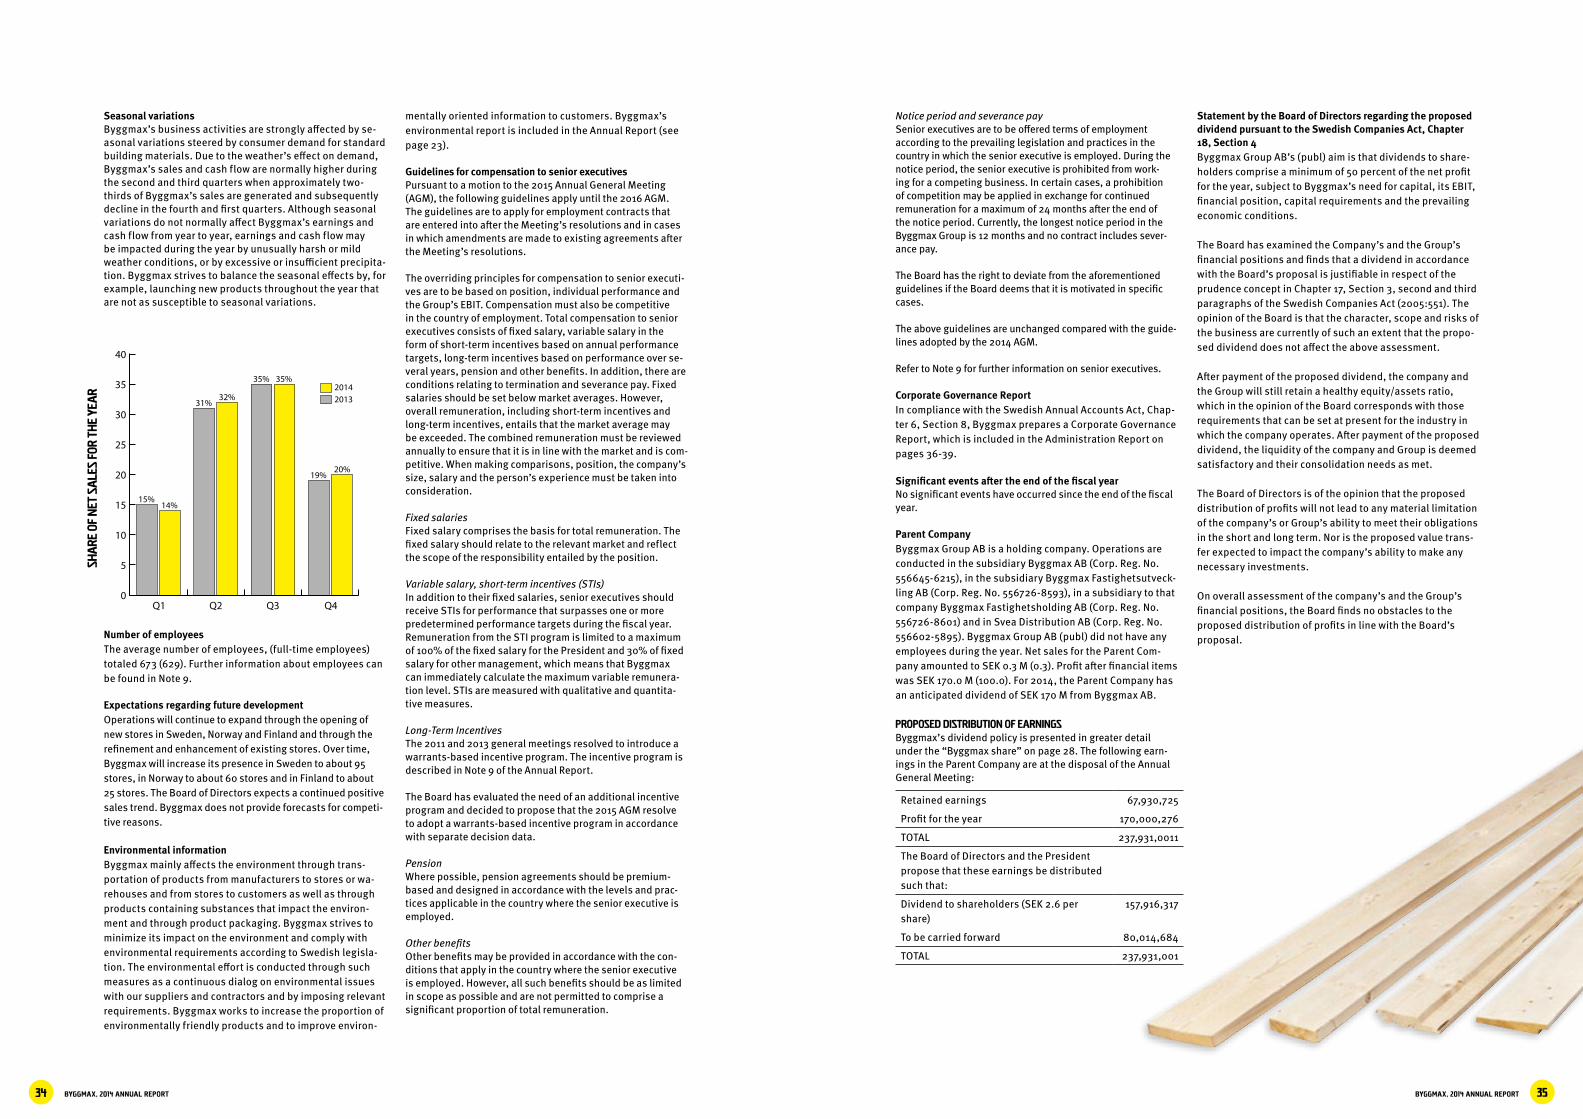
BYGGMAX, 2014 ANNUAL REPORT 35BYGGMAX, 2014 ANNUAL REPORT34
Seasonal variationsByggmax’s business activities are strongly affected by se-asonal variations steered by consumer demand for standard building materials. Due to the weather’s effect on demand, Byggmax’s sales and cash flow are normally higher during the second and third quarters when approximately two-thirds of Byggmax’s sales are generated and subsequently decline in the fourth and first quarters. Although seasonal variations do not normally affect Byggmax’s earnings and cash flow from year to year, earnings and cash flow may be impacted during the year by unusually harsh or mild weather conditions, or by excessive or insufficient precipita-tion. Byggmax strives to balance the seasonal effects by, for example, launching new products throughout the year that are not as susceptible to seasonal variations.
Number of employeesThe average number of employees, (full-time employees) totaled 673 (629). Further information about employees can be found in Note 9.
Expectations regarding future developmentOperations will continue to expand through the opening of new stores in Sweden, Norway and Finland and through the refinement and enhancement of existing stores. Over time, Byggmax will increase its presence in Sweden to about 95 stores, in Norway to about 60 stores and in Finland to about 25 stores. The Board of Directors expects a continued positive sales trend. Byggmax does not provide forecasts for competi-tive reasons.
Environmental informationByggmax mainly affects the environment through trans-portation of products from manufacturers to stores or wa-rehouses and from stores to customers as well as through products containing substances that impact the environ-ment and through product packaging. Byggmax strives to minimize its impact on the environment and comply with environmental requirements according to Swedish legisla-tion. The environmental effort is conducted through such measures as a continuous dialog on environmental issues with our suppliers and contractors and by imposing relevant requirements. Byggmax works to increase the proportion of environmentally friendly products and to improve environ-
mentally oriented information to customers. Byggmax’s environmental report is included in the Annual Report (see page 23).
Guidelines for compensation to senior executivesPursuant to a motion to the 2015 Annual General Meeting (AGM), the following guidelines apply until the 2016 AGM. The guidelines are to apply for employment contracts that are entered into after the Meeting’s resolutions and in cases in which amendments are made to existing agreements after the Meeting’s resolutions.
The overriding principles for compensation to senior executi-ves are to be based on position, individual performance and the Group’s EBIT. Compensation must also be competitive in the country of employment. Total compensation to senior executives consists of fixed salary, variable salary in the form of short-term incentives based on annual performance targets, long-term incentives based on performance over se-veral years, pension and other benefits. In addition, there are conditions relating to termination and severance pay. Fixed salaries should be set below market averages. However, overall remuneration, including short-term incentives and long-term incentives, entails that the market average may be exceeded. The combined remuneration must be reviewed annually to ensure that it is in line with the market and is com-petitive. When making comparisons, position, the company’s size, salary and the person’s experience must be taken into consideration.
Fixed salariesFixed salary comprises the basis for total remuneration. The fixed salary should relate to the relevant market and reflect the scope of the responsibility entailed by the position.
Variable salary, short-term incentives (STIs)In addition to their fixed salaries, senior executives should receive STIs for performance that surpasses one or more predetermined performance targets during the fiscal year. Remuneration from the STI program is limited to a maximum of 100% of the fixed salary for the President and 30% of fixed salary for other management, which means that Byggmax can immediately calculate the maximum variable remunera-tion level. STIs are measured with qualitative and quantita-tive measures.
Long-Term IncentivesThe 2011 and 2013 general meetings resolved to introduce a warrants-based incentive program. The incentive program is described in Note 9 of the Annual Report.
The Board has evaluated the need of an additional incentive program and decided to propose that the 2015 AGM resolve to adopt a warrants-based incentive program in accordance with separate decision data.
PensionWhere possible, pension agreements should be premium-based and designed in accordance with the levels and prac-tices applicable in the country where the senior executive is employed.
Other benefitsOther benefits may be provided in accordance with the con-ditions that apply in the country where the senior executive is employed. However, all such benefits should be as limited in scope as possible and are not permitted to comprise a significant proportion of total remuneration.
SHA
RE O
F N
ET S
ALE
S FO
R TH
E YE
AR
0Q1 Q2 Q3 Q4
5
10
15
20
25
30
15%14%
31%32%
35% 35%
19%20%
35
40
20142013
Notice period and severance paySenior executives are to be offered terms of employment according to the prevailing legislation and practices in the country in which the senior executive is employed. During the notice period, the senior executive is prohibited from work-ing for a competing business. In certain cases, a prohibition of competition may be applied in exchange for continued remuneration for a maximum of 24 months after the end of the notice period. Currently, the longest notice period in the Byggmax Group is 12 months and no contract includes sever-ance pay.
The Board has the right to deviate from the aforementioned guidelines if the Board deems that it is motivated in specific cases.
The above guidelines are unchanged compared with the guide-lines adopted by the 2014 AGM.
Refer to Note 9 for further information on senior executives.
Corporate Governance ReportIn compliance with the Swedish Annual Accounts Act, Chap-ter 6, Section 8, Byggmax prepares a Corporate Governance Report, which is included in the Administration Report on pages 36-39.
Significant events after the end of the fiscal yearNo significant events have occurred since the end of the fiscal year.
Parent CompanyByggmax Group AB is a holding company. Operations are conducted in the subsidiary Byggmax AB (Corp. Reg. No. 556645-6215), in the subsidiary Byggmax Fastighetsutveck-ling AB (Corp. Reg. No. 556726-8593), in a subsidiary to that company Byggmax Fastighetsholding AB (Corp. Reg. No. 556726-8601) and in Svea Distribution AB (Corp. Reg. No. 556602-5895). Byggmax Group AB (publ) did not have any employees during the year. Net sales for the Parent Com-pany amounted to SEK 0.3 M (0.3). Profit after financial items was SEK 170.0 M (100.0). For 2014, the Parent Company has an anticipated dividend of SEK 170 M from Byggmax AB.
PROPOSED DISTRIBUTION OF EARNINGSByggmax’s dividend policy is presented in greater detail under the “Byggmax share” on page 28. The following earn-ings in the Parent Company are at the disposal of the Annual General Meeting:
Statement by the Board of Directors regarding the proposed dividend pursuant to the Swedish Companies Act, Chapter 18, Section 4Byggmax Group AB’s (publ) aim is that dividends to share-holders comprise a minimum of 50 percent of the net profit for the year, subject to Byggmax’s need for capital, its EBIT, financial position, capital requirements and the prevailing economic conditions.
The Board has examined the Company’s and the Group’s financial positions and finds that a dividend in accordance with the Board’s proposal is justifiable in respect of the prudence concept in Chapter 17, Section 3, second and third paragraphs of the Swedish Companies Act (2005:551). The opinion of the Board is that the character, scope and risks of the business are currently of such an extent that the propo-sed dividend does not affect the above assessment.
After payment of the proposed dividend, the company and the Group will still retain a healthy equity/assets ratio, which in the opinion of the Board corresponds with those requirements that can be set at present for the industry in which the company operates. After payment of the proposed dividend, the liquidity of the company and Group is deemed satisfactory and their consolidation needs as met.
The Board of Directors is of the opinion that the proposed distribution of profits will not lead to any material limitation of the company’s or Group’s ability to meet their obligations in the short and long term. Nor is the proposed value trans-fer expected to impact the company’s ability to make any necessary investments.
On overall assessment of the company’s and the Group’s financial positions, the Board finds no obstacles to the proposed distribution of profits in line with the Board’s proposal.
Retained earnings 67,930,725
Profit for the year 170,000,276
TOTAL 237,931,0011
The Board of Directors and the President propose that these earnings be distributed such that:
Dividend to shareholders (SEK 2.6 per share)
157,916,317
To be carried forward 80,014,684
TOTAL 237,931,001

BYGGMAX, 2014 ANNUAL REPORT 37BYGGMAX, 2014 ANNUAL REPORT36
CORPORATE GOVERNANCE
Corporate governance means the rules and regulations as well as the existing structure for managing and leading business activities in a limited company with an efficient and controlled approach. Ultimately, corporate governance aims to meet shareholder requirements in respect of return and to provide all stakeholders with adequate and correct information about the company and its development.
The Byggmax Group AB (publ), hereinafter called Byggmax or the company, is listed on Nasdaq OMX Stockholm and applies the Swedish Corporate Governance Code (the Code) from the date of its listing, which was June 2, 2010. The Code builds on the principle “comply or explain,” which means that companies that apply the Code can deviate from specific rules but must explain the underlying reasons behind the deviation. Byggmax has not made any deviations from the Code in 2014.
SHAREHOLDERS
The share capital in Byggmax amounted to SEK 20,245,682 M divided among 60,737,045 shares. Only one class of shares exists and all shares have equal rights to participa-tion in the company’s assets and profits. The number of shareholders on December 31, 2014 was 7,919. At December 31, 2014, the largest shareholder was Nordea Investment Funds with 10.1 percent of the shares. Non-Swedish owners accounted for ownership of approximately 55.9 percent of the total number of shares. For further information regar-ding the share and shareholders please see pages 28-29 and the Byggmax website.
ANNUAL GENERAL MEETING
Shareholders exercise their influence over the company at the Annual General Meeting (AGM) which constitutes the company’s highest decision making body. Byggmax’s Artic-les of Association are available in their entirety at byggmax.com.
2014 Annual General MeetingThe 2014 AGM was held on May 8, 2014, at the Primus con-ference center in Stockholm. At the AGM, 100 shareholders representing 41.0 percent of the votes were present either in person or via representatives. Fredrik Cappelen was elected Chairman of the AGM.
The main resolutions passed were as follows:• Reelection of Board members Fredrik Cappelen,
Stefan Linder, Anders Moberg, Stig Notlöv and Lottie Svedenstedt. The election of Karin Hygrell-Jonsson as a new Board member
• Policies for compensation and terms of employment for the President and other senior executives
• Policies for the appointment of the Nomination Com-mittee
Proposals for the 2015 AGMThe next AGM for shareholders in Byggmax will be held on Tuesday, May 5, 2015, at the Primus conference center in Solna (Stockholm) from 10:00 a.m. to 12:00 a.m. For further information regarding the AGM, please visit the Byggmax website.
NOMINATION COMMITTEE
The AGM on May 8, 2014, resolved that a Nomination Com-mittee would be appointed for the 2015 AGM. The Chairman will convene the three largest owner-categorized sharehol-ders of the company – according to Euroclear Sweden AB as of August 31 – who will subsequently each be entitled to ap-point a member to the Nomination Committee. The composi-tion of the Nomination Committee will be published not later than six months prior to the AGM. The Nomination Commit-tee is to prepare and submit proposals to the General Mee-ting of Shareholders concerning a Chairman for the AGM, the Chairman of the Board of Directors and other members of the company’s Board. The Nomination Committee is also tasked with submitting proposals for directors’ fees that are to be allocated among the Chairman and other members, the election of (where applicable) and fees to auditors, as well as decisions on principals governing the appointment of the Nomination Committee’s members. No remuneration is payable to members of the Nomination Committee.
BOARD OF DIRECTORS
The Board’s formal work plan and written instructionsEach year, the Byggmax Board of Directors adopts a formal work plan and written instructions in respect of financial reporting and allocation of duties between the Board and the President. The formal work plan regulates the Board’s obligations, the division of work among Board members, the minimum number of Board meetings per year, notice of and documents before Board meetings and the preparation of the minutes of Board meetings.
Written instructions regulate the reporting system that exists to enable the Board to continuously assess the company’s and the Group’s financial situations and the al-location of work between the Board and the President.
Independence of the BoardThe Board’s assessment of the individual Board members relation to the company and the shareholders is defined in the table “The Board’s composition and attendance at mee-tings” (See page 38). As is made evident, Byggmax meets the Code’s requirement that the majority of the elected Board members are independent of the company and the Group management and that at least two of these are inde-pendent of the company’s major shareholders.
Byggmax Group AB (publ) is a Swedish public limited liability company listed on Nasdaq OMX Stockholm. Byggmax applies the Swedish Corporate Governance Code and hereby submits its Corporate Governance Report for the fiscal year January 1, 2014 to December 31, 2014. Byggmax has prepared the Corporate Governance Report in accordance with the Swedish Annual Accounts Act (1995:1554) and the Swedish Corporate Governance Code. The guidelines for the Swedish Corporate Governance Code are available from the website of the Swedish Corporate Governance Board (www.corporategovernance-board.se). The Corporate Governance Report is included as part of the Administration Report.
The Board’s composition and attendance at meetingsA detailed description of the Board members is availa-ble on page 77 and the Board’s composition and atten-dance at Board meetings is presented on page 38.
The Board’s work in 2014The Board held 11 meetings in 2014. Important issues addressed by the Board in 2014, in addition to the adoption of the Annual Report and interim reports, and the business plan and attendant budget, included the following:• Resolution on dividend for 2014 of SEK 2.3 per share• Revision and adoption of the company’s policies• Opening of new stores in all three countries• Continued expansion of the online range• Roll out of the new store concept, Byggmax 2.0.• Continued work on improving operating activities• Continued expansion of the offering of tradesmen
services The Group’s President, Magnus Agervald and CFO, Pernilla Walfridsson, participate at Board meetings. Other em-ployees may also participate in Board meetings to present specific issues.
Evaluation of the work of the Board of Directors in 2014The Chairman of the Board is responsible for evaluating the work of the Board including the input of the individual Board members. The evaluation focuses on the supply and demand of specific competence and ways of working. In 2013, an external company was engaged to carry out a thorough evaluation of the Board’s members and work. The evaluation of the work of the Board concluded that the work is efficient and goal oriented. The external company used also completed an evaluation of members of the Group management and the assessment was that the management functions well. In 2014, the Board carried out an internal evaluation of the Board’s work.
Board committeesThe Board currently has no separate remuneration commit-tee or audit committee. It is the Board’s belief that the tasks that would otherwise be performed by committees can be carried out more effectively by the Board in its entirety.
The Board, as a whole, prepares and addresses issues regarding remuneration and other employment terms for senior executives, and assesses the application of the guidelines adopted by the AGM for remuneration of senior executives. The audit committee is comprised by the Board in its entirety. The committee/Board meets the company’s auditors twice yearly to discuss matters including audit plans and audit reports. At meetings with the company’s auditors, the committee/Board are given the opportunity to meet with the auditor without the President being present.
PRESIDENT AND SENIOR EXECUTIVES
The President, also CEO, is tasked with managing the ongoing operation of the company in accordance with the written instructions adopted by the Board. Magnus Agervald has been the President and CEO of Byggmax since January 1, 2008. He has no shareholding or partnership in any company that the company has a significant business relationship with.
The Byggmax Group management comprises six members including the President. A description of the management is available from the Annual Report under the heading “Byggmax Group Management” (page 76).
REMUNERATION GUIDELINES
For information concerning salaries and other remuneration to the President and other senior executives see Note 9, page 60.
NOMINATION COMMITTEEAppointed by the majority
shareholders Prepares AGM resolutions in items including
appointments.
AGMThe AGM constitutes the company’s highest decision-making body. The
AGM appoints the Board of Directors and auditor.
BOARD OF DIRECTORSThe Board and its Chairman are ap-
pointed by the AGM. The Board is responsible for the
organization and management of the company’s affairs.
AUDIT COMMITTEEPrepares audit issues.
REMUNERATION COMMITTEEPrepares remuneration issues.
PRESIDENT AND SENIOR EXECUTIVESThe President and other senior executives are responsible for the Group’s ongoing
business activities.
AUDITORSThe auditor is appointed by
the AGM.

BYGGMAX, 2014 ANNUAL REPORT 39BYGGMAX, 2014 ANNUAL REPORT38
AUDITORS
The AGM appoints the company’s auditors every four years (from the 2014 AGM, on an annual basis). Öhrlings Price-waterhouseCoopers, hereinafter called PWC, was elected by the 2010 AGM for a mandate period of four years. PWC has appointed Authorized Public Accountant Anna-Carin Bjelkeby as Auditor in Charge for the audit. As Ms. Bjelkeby had held this assignment for seven years, in autumn 2013, Ann-Christine Hägglund was appointed the new Auditor in Charge for the audit. In addition to the audit assignment, Byggmax has consulted PWC on taxes and other accounting issues. PWC is obligated to test its independence prior to accepting independent advisory assignments in addition to its auditing assignments for Byggmax. Information in respect of the fees paid to the auditing company is provided in Note 8.
According to the Code, the company’s Board should ensure that the interim report in respect of the second or third quar-ter is reviewed by the auditors. Byggmax’s auditors conduc-ted a review of the company’s nine-month interim report.
INTERNAL AUDIT
The company has a simple legal and operative structure and a comprehensive management and internal control system. The Audit Committee follows up the company’s assessment of the internal audit through contact with the company’s auditors. In view of the aforementioned, the Board has opted not to have a separate internal audit. The question of whether to establish a separate internal audit function will be retested on an annual basis.
THE BOARD’S COMPOSITION AND ATTENDANCE AT MEETINGS
Name Function Elected Board attendance Directors’ fees
Independence of the company’s manage-
ment and major shareholders
Fredrik Cappelen Chairman of the Board
2006 11/11 SEK 500,000 No
Anders Moberg Board member 2006 11/11 SEK 250,000 No
Karin Hygrell-Jonsson1
Board member 2014 7/7 SEK 162,293 No
Johannes Lien2 Board member 2006 4/4 None No
Lottie Svedenstedt Board member 2010 11/11 SEK 250,000 No
Stefan Linder Board member 2006 11/11 None No
Stig Notlöv Board member 2006 9/11 SEK 250,000 No
INTERNAL CONTROL OF FINANCIAL REPORTING
The Board’s responsibility for internal control is regulated by the Swedish Companies Act and in the Swedish Corpo-rate Governance Code, which contains requirements for annual external disclosures regarding the organization of internal control for financial reporting.
The Board has overriding responsibility for internal control at Byggmax. The President has the ongoing responsibility for maintaining internal governance and controls. The ultimate aim of internal control is to ensure that Byggmax’s financial reports are prepared in accordance with the law, applicable accounting policies and other requirements that apply to listed companies, in addition to protecting Byggmax’s assets. Byggmax has elected to use COSO’s definition of internal control as the foundation for its work with internal control. According to COSO, internal control comprises five different parts; the control environment, risk assessment, control activities, information and commu-nication and follow-up. These various parts are described briefly below.1
Control environmentThe control environment forms the basis for the internal control and builds on the culture that the Board of Directors and management communicate and work by. It primarily comprises values, competence, management philosophy, organizational structure, responsibility and authorizations as well as policies and routines. A key component of the control environment is the clear definition and communica-tion of decision paths, authorizations and responsibility between differing levels in the organization and that steering documents in the form of internal policies and guidelines include all material areas and that these provide guidance to the various employees of Byggmax.
A key component of the Board’s work is the preparation and approval of a number of policies including the formal work plan for the Board of Directors, the President’s instruc-tions, financial policy, IT policy, information policy and the logbook and insider policy. The aim of these policies includes creating the foundation for sound internal control. All policies are reported annually and adopted by the Group management or Board. Byggmax’s accounting process is documented in an accounting manual.
Risk assessmentAll business activities are linked to a certain degree of risk taking. A structured risk assessment enables the identifi-cation of significant risks. Byggmax operates an ongoing process of risk analysis in which the risks of errors in the financial reporting of significant income statement and balance sheet items are analyzed. Other risks in conjun-ction with the financial reporting include the risk of fraud, loss or misappropriation of assets. The Board of Byggmax
1 COSO (Committee of Sponsoring Organizations of the Treadway Commission), which is the framework that has the widest spread and international acceptance, and which takes a particular position on the definition of sound internal control.
continuously assesses the company’s risk management. This includes assessing the preventative measures taken to reduce the company’s risks, which entails ensuring the company is appropriately insured and that the company has the requisite policies and guidelines in place.
Control activitiesThe Group’ control structure is designed to handle the risks the Board assesses as being significant for the internal control of financial reporting. In Byggmax, the control structures comprise an organization with clear roles that enables an efficient, and from an internal control perspec-tive, suitable allocation of responsibilities, and additionally of specific control activities that are aimed at identifying or safeguarding from the risks of errors in the reporting. Byggmax applies a systematic modus operandi to minimize the risk of fraud and/or theft, this includes efforts to mini-mize waste in the stores.
Information and communicationByggmax has an information policy that includes guidelines for internal and external information from the company. External information is disclosed in compliance with stock exchange and securities legislation and the Swedish Financial Supervisory Authority’s regulations. Internal dissemination of price-sensitive information occurs only after Byggmax has released the corresponding information to the stock market. Steering documentation in the form of policies, guidelines and manuals are communicated via the Group’s intranet and accounting manual.
Follow-upThe Group’s accounting functions are integrated via a joint accounting and reporting system. The Board and Group management are provided with ongoing information in respect of the Group’s financial performance, situation and development of the business. The reports also contain analytical follow-ups, trend monitoring and benchmarking between stores. The accounting function has the same procedures and requirements of documentation at every monthly accounts date. The Board continuously evaluates the information provided by the Group management. The work includes ensuring that measures are taken in respect of faults and proposed measures that may have been identi-fied in the external audit.
1 Karin Hygrell-Jonsson was elected as a new Board member at the 2014 AGM. 2Johannes Lien Lien declined re-election ahead of the 2014 AGM.
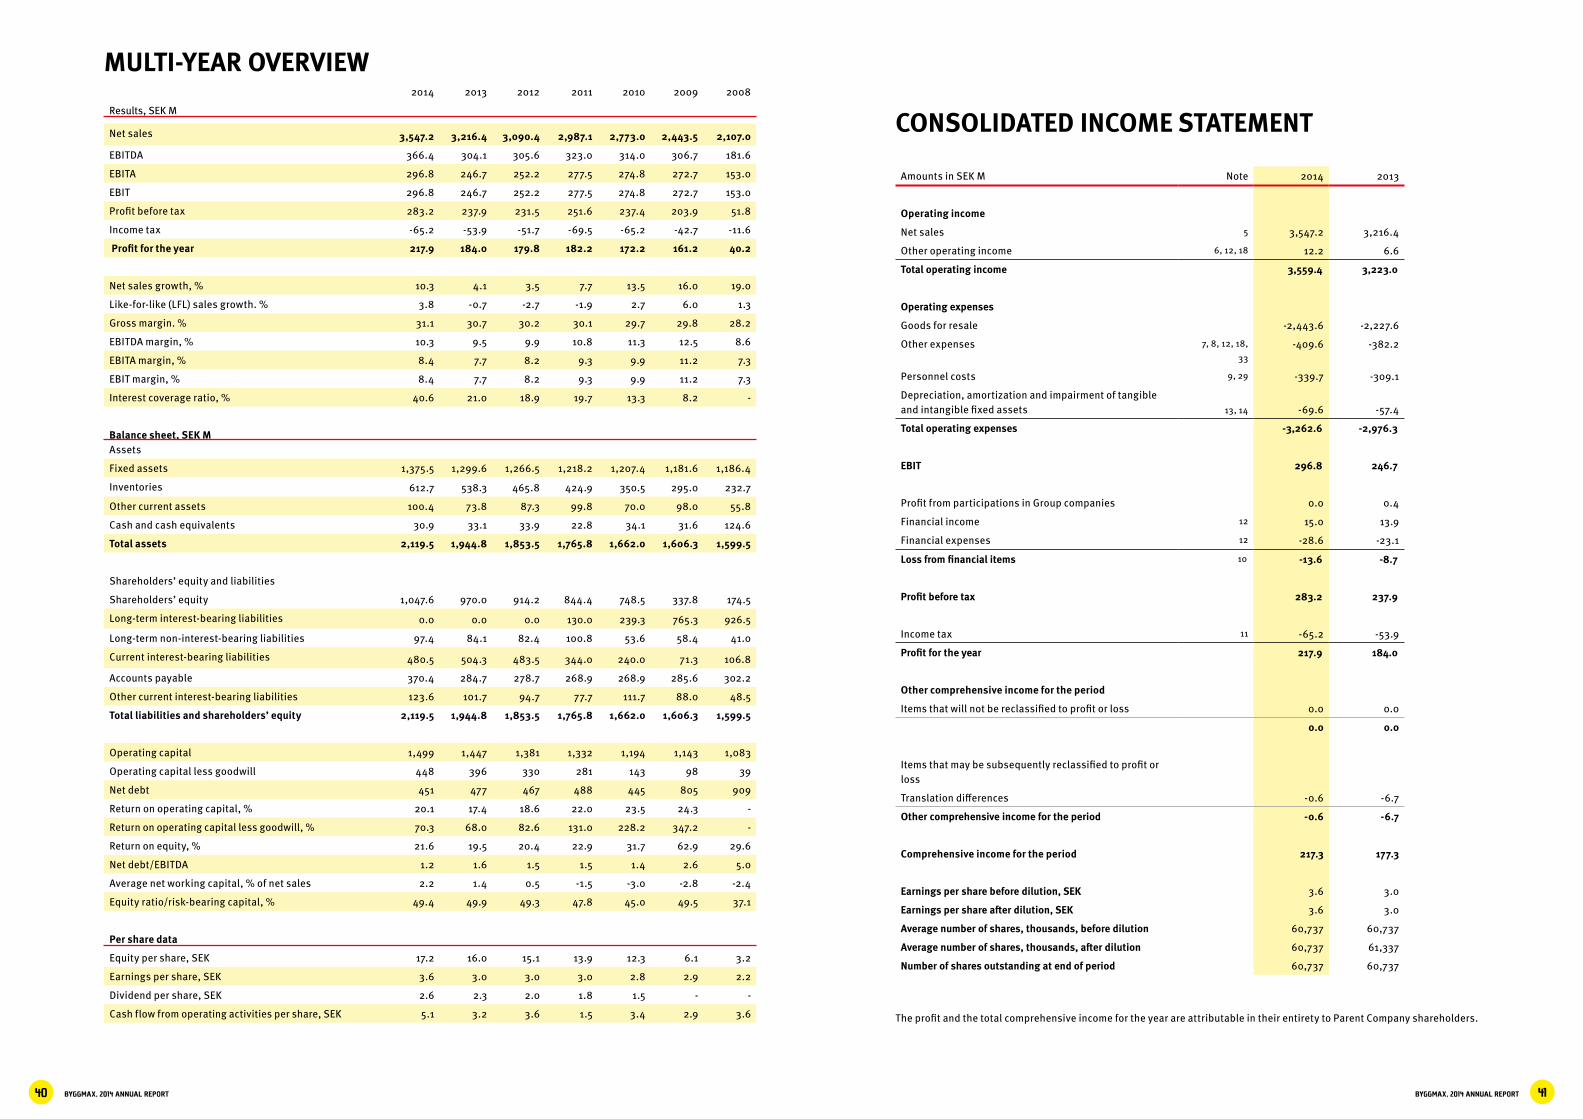
BYGGMAX, 2014 ANNUAL REPORT 41BYGGMAX, 2014 ANNUAL REPORT40
MULTI-YEAR OVERVIEW2014 2013 2012 2011 2010 2009 2008
Results, SEK M
Net sales 3,547.2 3,216.4 3,090.4 2,987.1 2,773.0 2,443.5 2,107.0
EBITDA 366.4 304.1 305.6 323.0 314.0 306.7 181.6
EBITA 296.8 246.7 252.2 277.5 274.8 272.7 153.0
EBIT 296.8 246.7 252.2 277.5 274.8 272.7 153.0
Profit before tax 283.2 237.9 231.5 251.6 237.4 203.9 51.8
Income tax -65.2 -53.9 -51.7 -69.5 -65.2 -42.7 -11.6
Profit for the year 217.9 184.0 179.8 182.2 172.2 161.2 40.2
Net sales growth, % 10.3 4.1 3.5 7.7 13.5 16.0 19.0
Like-for-like (LFL) sales growth. % 3.8 -0.7 -2.7 -1.9 2.7 6.0 1.3
Gross margin. % 31.1 30.7 30.2 30.1 29.7 29.8 28.2
EBITDA margin, % 10.3 9.5 9.9 10.8 11.3 12.5 8.6
EBITA margin, % 8.4 7.7 8.2 9.3 9.9 11.2 7.3
EBIT margin, % 8.4 7.7 8.2 9.3 9.9 11.2 7.3
Interest coverage ratio, % 40.6 21.0 18.9 19.7 13.3 8.2 -
Balance sheet, SEK MAssets
Fixed assets 1,375.5 1,299.6 1,266.5 1,218.2 1,207.4 1,181.6 1,186.4
Inventories 612.7 538.3 465.8 424.9 350.5 295.0 232.7
Other current assets 100.4 73.8 87.3 99.8 70.0 98.0 55.8
Cash and cash equivalents 30.9 33.1 33.9 22.8 34.1 31.6 124.6
Total assets 2,119.5 1,944.8 1,853.5 1,765.8 1,662.0 1,606.3 1,599.5
Shareholders’ equity and liabilities
Shareholders’ equity 1,047.6 970.0 914.2 844.4 748.5 337.8 174.5
Long-term interest-bearing liabilities 0.0 0.0 0.0 130.0 239.3 765.3 926.5
Long-term non-interest-bearing liabilities 97.4 84.1 82.4 100.8 53.6 58.4 41.0
Current interest-bearing liabilities 480.5 504.3 483.5 344.0 240.0 71.3 106.8
Accounts payable 370.4 284.7 278.7 268.9 268.9 285.6 302.2
Other current interest-bearing liabilities 123.6 101.7 94.7 77.7 111.7 88.0 48.5
Total liabilities and shareholders’ equity 2,119.5 1,944.8 1,853.5 1,765.8 1,662.0 1,606.3 1,599.5
Operating capital 1,499 1,447 1,381 1,332 1,194 1,143 1,083
Operating capital less goodwill 448 396 330 281 143 98 39
Net debt 451 477 467 488 445 805 909
Return on operating capital, % 20.1 17.4 18.6 22.0 23.5 24.3 -
Return on operating capital less goodwill, % 70.3 68.0 82.6 131.0 228.2 347.2 -
Return on equity, % 21.6 19.5 20.4 22.9 31.7 62.9 29.6
Net debt/EBITDA 1.2 1.6 1.5 1.5 1.4 2.6 5.0
Average net working capital, % of net sales 2.2 1.4 0.5 -1.5 -3.0 -2.8 -2.4
Equity ratio/risk-bearing capital, % 49.4 49.9 49.3 47.8 45.0 49.5 37.1
Per share data
Equity per share, SEK 17.2 16.0 15.1 13.9 12.3 6.1 3.2
Earnings per share, SEK 3.6 3.0 3.0 3.0 2.8 2.9 2.2
Dividend per share, SEK 2.6 2.3 2.0 1.8 1.5 - -
Cash flow from operating activities per share, SEK 5.1 3.2 3.6 1.5 3.4 2.9 3.6
CONSOLIDATED INCOME STATEMENT
Amounts in SEK M Note 2014 2013
Operating income
Net sales 5 3,547.2 3,216.4
Other operating income 6, 12, 18 12.2 6.6
Total operating income 3,559.4 3,223.0
Operating expenses
Goods for resale -2,443.6 -2,227.6
Other expenses 7, 8, 12, 18,
33-409.6 -382.2
Personnel costs 9, 29 -339.7 -309.1
Depreciation, amortization and impairment of tangible and intangible fixed assets 13, 14 -69.6 -57.4
Total operating expenses -3,262.6 -2,976.3
EBIT 296.8 246.7
Profit from participations in Group companies 0.0 0.4
Financial income 12 15.0 13.9
Financial expenses 12 -28.6 -23.1
Loss from financial items 10 -13.6 -8.7
Profit before tax 283.2 237.9
Income tax 11 -65.2 -53.9
Profit for the year 217.9 184.0
Other comprehensive income for the period
Items that will not be reclassified to profit or loss 0.0 0.0
0.0 0.0
Items that may be subsequently reclassified to profit or loss
Translation differences -0.6 -6.7
Other comprehensive income for the period -0.6 -6.7
Comprehensive income for the period 217.3 177.3
Earnings per share before dilution, SEK 3.6 3.0
Earnings per share after dilution, SEK 3.6 3.0
Average number of shares, thousands, before dilution 60,737 60,737
Average number of shares, thousands, after dilution 60,737 61,337
Number of shares outstanding at end of period 60,737 60,737
The profit and the total comprehensive income for the year are attributable in their entirety to Parent Company shareholders.
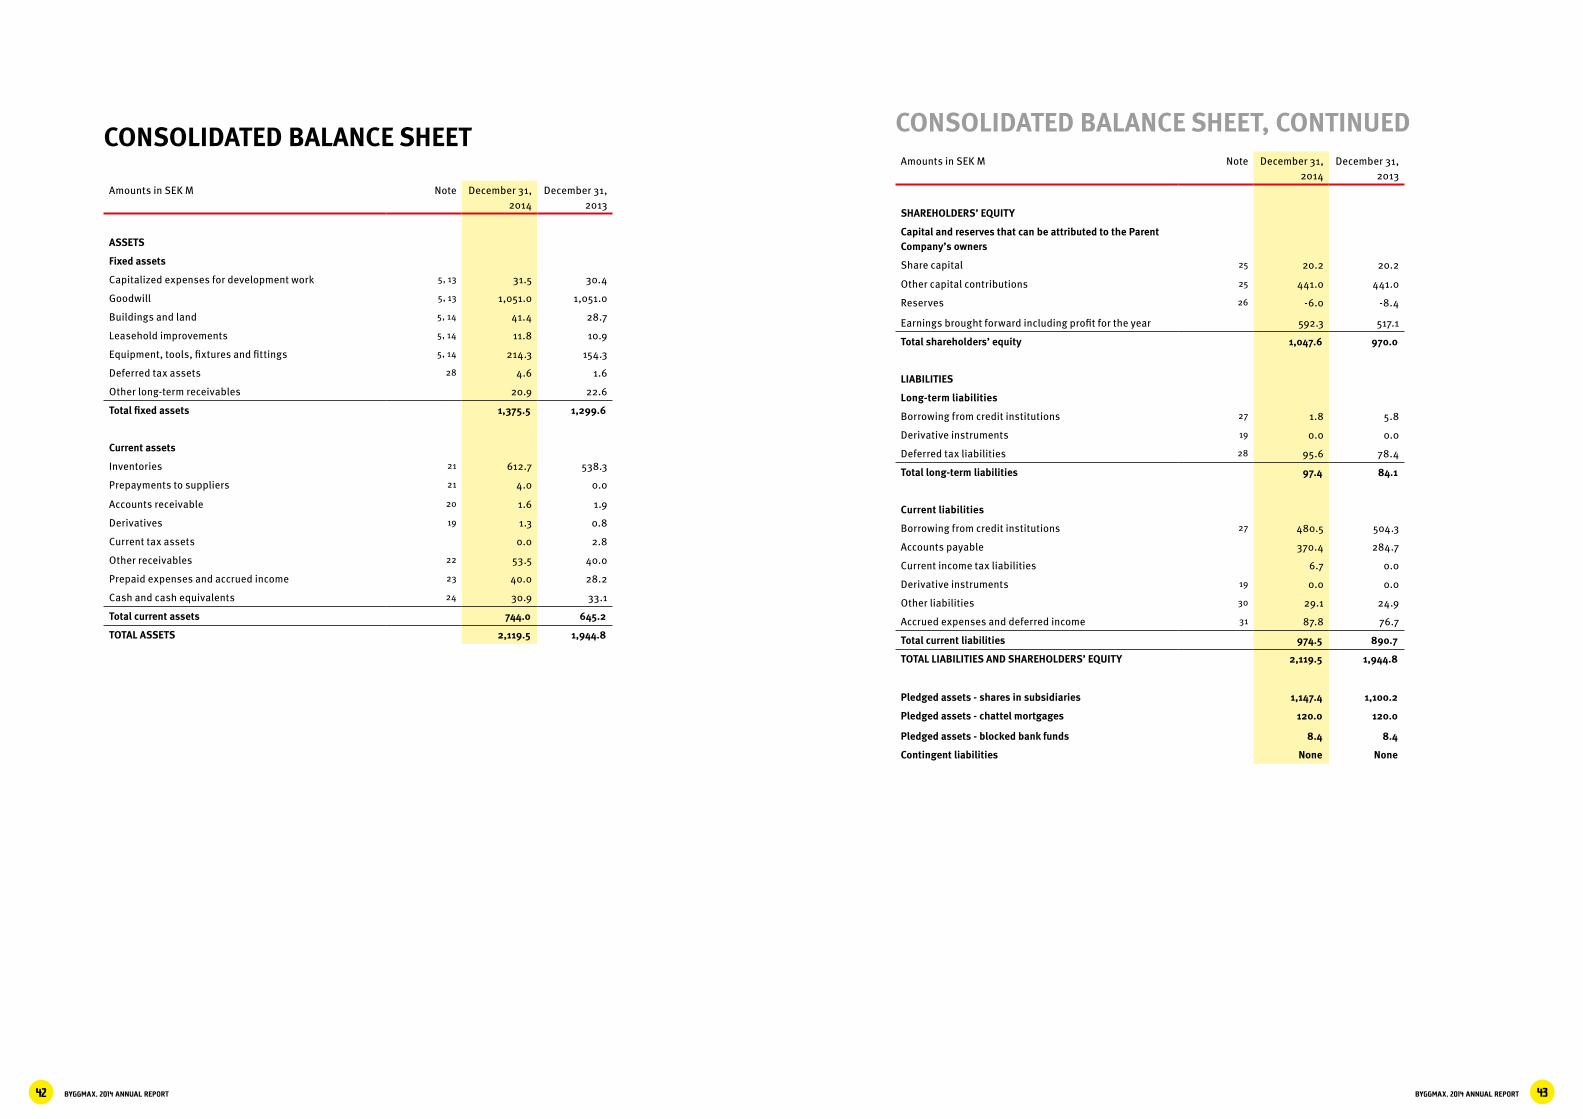
BYGGMAX, 2014 ANNUAL REPORT 43BYGGMAX, 2014 ANNUAL REPORT42
CONSOLIDATED BALANCE SHEET
Amounts in SEK M Note December 31, 2014
December 31, 2013
ASSETS
Fixed assets
Capitalized expenses for development work 5, 13 31.5 30.4
Goodwill 5, 13 1,051.0 1,051.0
Buildings and land 5, 14 41.4 28.7
Leasehold improvements 5, 14 11.8 10.9
Equipment, tools, fixtures and fittings 5, 14 214.3 154.3
Deferred tax assets 28 4.6 1.6
Other long-term receivables 20.9 22.6
Total fixed assets 1,375.5 1,299.6
Current assets
Inventories 21 612.7 538.3
Prepayments to suppliers 21 4.0 0.0
Accounts receivable 20 1.6 1.9
Derivatives 19 1.3 0.8
Current tax assets 0.0 2.8
Other receivables 22 53.5 40.0
Prepaid expenses and accrued income 23 40.0 28.2
Cash and cash equivalents 24 30.9 33.1
Total current assets 744.0 645.2
TOTAL ASSETS 2,119.5 1,944.8
CONSOLIDATED BALANCE SHEET, CONTINUEDAmounts in SEK M Note December 31,
2014December 31,
2013
SHAREHOLDERS’ EQUITY
Capital and reserves that can be attributed to the Parent Company’s owners
Share capital 25 20.2 20.2
Other capital contributions 25 441.0 441.0
Reserves 26 -6.0 -8.4
Earnings brought forward including profit for the year 592.3 517.1
Total shareholders’ equity 1,047.6 970.0
LIABILITIES
Long-term liabilities
Borrowing from credit institutions 27 1.8 5.8
Derivative instruments 19 0.0 0.0
Deferred tax liabilities 28 95.6 78.4
Total long-term liabilities 97.4 84.1
Current liabilities
Borrowing from credit institutions 27 480.5 504.3
Accounts payable 370.4 284.7
Current income tax liabilities 6.7 0.0
Derivative instruments 19 0.0 0.0
Other liabilities 30 29.1 24.9
Accrued expenses and deferred income 31 87.8 76.7
Total current liabilities 974.5 890.7
TOTAL LIABILITIES AND SHAREHOLDERS’ EQUITY 2,119.5 1,944.8
Pledged assets - shares in subsidiaries 1,147.4 1,100.2
Pledged assets - chattel mortgages 120.0 120.0
Pledged assets - blocked bank funds 8.4 8.4
Contingent liabilities None None

BYGGMAX, 2014 ANNUAL REPORT 45BYGGMAX, 2014 ANNUAL REPORT44
CONSOLIDATED STATEMENT OF CHANGES IN SHA-REHOLDERS’ EQUITY
Attributable to shareholders in Parent Company
Amounts in SEK MNotes 25, 26
Share capital
Other capital con-
tributions ReservesRetained earnings
Total sha-reholders’
equity
Opening balance at January 1, 2013 20.2 441.0 -1.7 454.6 914.2
Profit for the year 184.0 184.0
Other comprehensive income for the year
Translation differences -6.7 -6.7
Total comprehensive income -6.7 184.0 177.3
Dividend1 -121.5 -121.5
Total transactions with shareholders 0.0 0.0 0.0 -121.5 -121.5
Closing balance at December 31, 2013 20.2 441.0 -8.4 517.1 970.0
Opening balance at January 1, 2014 20.2 441.0 -8.4 517.1 970.0
Profit for the year 217.9 217.9
Other comprehensive income for the year
Translation differences -0.6 -0.6
Total comprehensive income -0.6 217.9 217.3
New issue/share premium reserve
Dividend2 -139.7 -139.7
Total transactions with shareholders 0.0 0.0 0.0 -139.7 -139.7
Closing balance at December 31, 2014 20.2 441.0 -9.0 595.3 1,047.6
1Dividend 2013, SEK 2.0 per share2Dividend 2014, SEK 2.3 per share
CONSOLIDATED STATEMENT OF CASH FLOWS
Amounts in SEK M Note 2014 2013
Cash flow from operations
EBIT 296.8 246.7
Non-cash items
–Depreciation/amortization of tangible and intangible fixed assets 69.6 57.4
–Other non-cash items1 1.4 -2.7
Interest received 6.9 10.3
Interest paid -21.0 -19.7
Tax paid -44.6 -45.1
Cash flow from operations before changes in working capital 309.0 246.9
Changes in working capital
Increase/decrease in inventories and work in progress 21 -78.3 -72.5
Increase/decrease in other current receivables 22 -20.5 1.3
Increase/decrease in other current liabilities 30 100.9 16.7
Cash flow from operations 311.1 192.5
Cash flow from investing activities
Divestment of subsidiaries 18 0.0 10.7
Investment in intangible fixed assets -12.0 -12.3
Investment in tangible fixed assets -134.5 -82.3
Divestment of tangible fixed assets -0.6 0.0
Investment in other financial fixed assets 0.0 1.9
Investment in subsidiaries 0.0 0.0
Cash flow from investing activities -147.1 -82.1
Cash flow from financing activities
Change in overdraft facility -16.7 31.4
Dividend to Parent Company’s shareholders -139.7 -121.5
Amortization of loans -9.8 -19.1
Cash flow from financing activities -166.2 -109.2
Cash flow for the period -2.2 1.1
Cash and cash equivalents at the beginning of the period 24 24.7 23.6
Cash and cash equivalents at the end of the period2 24 22.5 24.7
1 Other non-cash items pertain to translation differences
2 Note that cash and cash equivalents in the cash flow is adjusted for blocked bank funds (SEK 8.4 M in 2014 and SEK 8.4 M in 2013)
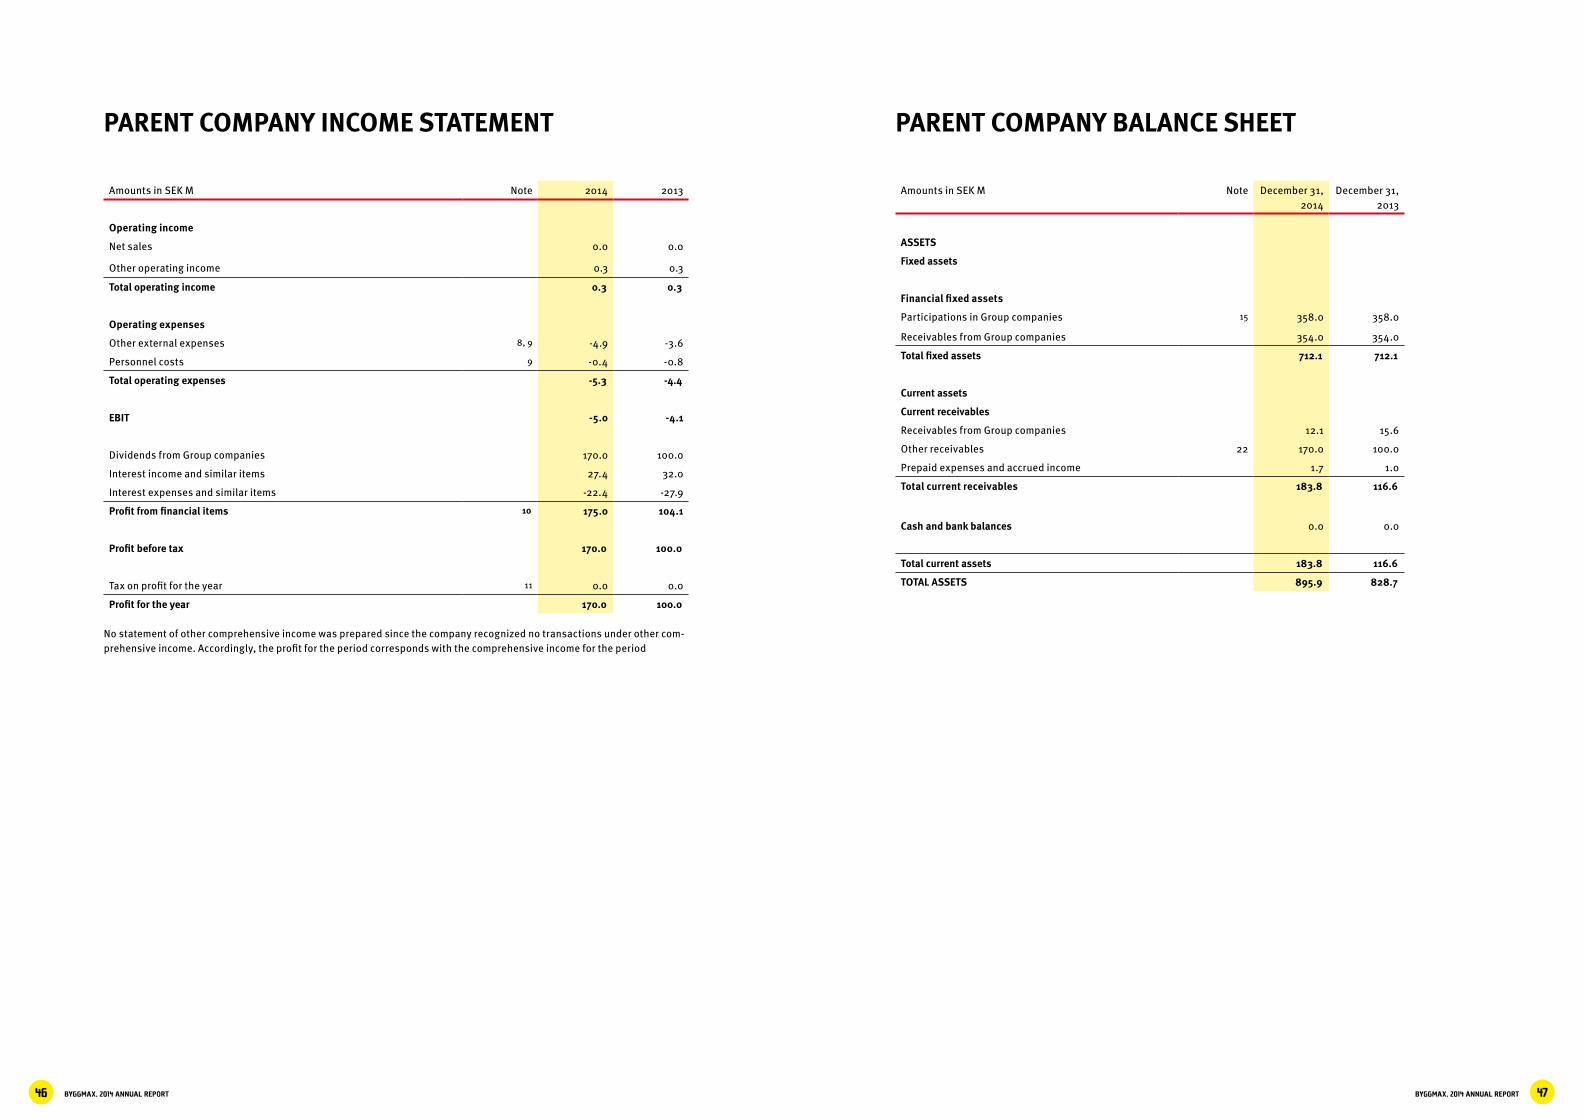
BYGGMAX, 2014 ANNUAL REPORT 47BYGGMAX, 2014 ANNUAL REPORT46
PARENT COMPANY INCOME STATEMENT
Amounts in SEK M Note 2014 2013
Operating income
Net sales 0.0 0.0
Other operating income 0.3 0.3
Total operating income 0.3 0.3
Operating expenses
Other external expenses 8, 9 -4.9 -3.6
Personnel costs 9 -0.4 -0.8
Total operating expenses -5.3 -4.4
EBIT -5.0 -4.1
Dividends from Group companies 170.0 100.0
Interest income and similar items 27.4 32.0
Interest expenses and similar items -22.4 -27.9
Profit from financial items 10 175.0 104.1
Profit before tax 170.0 100.0
Tax on profit for the year 11 0.0 0.0
Profit for the year 170.0 100.0
No statement of other comprehensive income was prepared since the company recognized no transactions under other com-prehensive income. Accordingly, the profit for the period corresponds with the comprehensive income for the period
PARENT COMPANY BALANCE SHEET
Amounts in SEK M Note December 31, 2014
December 31, 2013
ASSETS
Fixed assets
Financial fixed assets
Participations in Group companies 15 358.0 358.0
Receivables from Group companies 354.0 354.0
Total fixed assets 712.1 712.1
Current assets
Current receivables
Receivables from Group companies 12.1 15.6
Other receivables 22 170.0 100.0
Prepaid expenses and accrued income 1.7 1.0
Total current receivables 183.8 116.6
Cash and bank balances 0.0 0.0
Total current assets 183.8 116.6
TOTAL ASSETS 895.9 828.7

BYGGMAX, 2014 ANNUAL REPORT 49BYGGMAX, 2014 ANNUAL REPORT48
PARENT COMPANY BALANCE SHEET, CONTINUED
Amounts in SEK M Note December 31, 2014
December 31, 2013
SHAREHOLDERS’ EQUITY AND LIABILITIES
Shareholders’ equity
Restricted equity
Share capital 25 20.2 20.2
Total restricted equity 20.2 20.2
Unrestricted equity
Share premium reserve 418.7 418.7
Retained earnings -350.7 -311.0
Profit for the year 170.0 100.0
Total unrestricted equity 238.0 207.7
Total shareholders’ equity 258.2 227.9
Long-term liabilities
Liabilities to credit institutions 27 0.0 0.0
Total long-term liabilities 0.0 0.0
Current liabilities
Borrowing from credit institutions 27 635.7 598.4
Accounts payable 0.2 0.5
Current income tax liabilities 0.0 0.0
Other liabilities 0.2 0.0
Accrued expenses and deferred income 31 1.6 1.9
Total current liabilities 637.7 600.8
TOTAL LIABILITIES AND SHAREHOLDERS’ EQUITY 895.9 828.7
Pledged assets 32 358.0 358.0
Contingent liabilities 32 None None
CHANGES IN PARENT COMPANY’S SHAREHOLDERS’ EQUITY
Restricted equity Unrestricted equity
Amounts in SEK MNotes 25, 26
Share capital
Share premium
reserve Retained earnings
Profit/loss for
the year
Total share-
holders’ equity
Shareholders’ equity on January 1, 2013 20.2 418.7 -191.4 1.9 249.3
Carried forward 1.9 -1.9 0.0
Profit for the year 100.0 100.0
Other comprehensive income 0.0
Total comprehensive income 0.0 0.0
Dividend1 -121.5 -121.5
Total transactions with shareholders -121.5 -121.5
Shareholders’ equity on December 31, 2013 20.2 418.7 -311.0 100.0 227.9
Shareholders’ equity on January 1, 2014 20.2 418.7 -311.0 100.0 227.9
Carried forward 100.0 -100.0 0.0
Profit for the year 170.0 170.0
Other comprehensive income 0.0
Total comprehensive income 0.0 0.0
Dividend2 -139.7 -139.7
Total transactions with shareholders -139.7 -139.7
Shareholders’ equity on December 31, 2014 20.2 418.7 -350.7 170.0 258.2
1Dividend 2013, SEK 2.0 per share2Dividend 2014, SEK 2.3 per share

BYGGMAX, 2014 ANNUAL REPORT 51BYGGMAX, 2014 ANNUAL REPORT50
PARENT COMPANY CASH-FLOW STATEMENT
Amounts in SEK M Note 2014 2013
Cash flow from operations
EBIT -5.0 -4.1
Adjustment for non-cash items
–Group contributions received 12.1 15.6
–Other non-cash items 170.0 100.0
Interest received 15.3 16.4
Interest paid -21.7 -27.2
Tax paid 0.0 0.0
Cash flow from operations before changes in working capital 170.6 100.7
Changes in working capital
Operating receivables -68.1 -98.5
Operating liabilities -0.1 0.4
Cash flow from operations 102.4 2.6
Cash flow from investing activities
Investments in subsidiaries 0.0 0.0
Cash flow from investing activities 0.0 0.0
Cash flow from financing activities
Repayment of debt 0.0 0.0
Dividend -139.7 -121.5
Changes in current financial liabilities 37.3 118.8
Cash flow from financing activities -102.4 -2.6
Cash flow for the period 0.0 0.0
Cash and cash equivalents at the beginning of the period 0.0 0.0
Cash and cash equivalents at the end of the period 0.0 0,0
1 GENERAL INFORMATION
The Byggmax Group conducts sales of building supplies and is established in 72 locations in Sweden, 27 locations in Norway and 13 locations in Finland. Byggmax’s business concept is to sell high-quality building supplies at the lowest possible price.
The Parent Company is a limited-liability company registered in Sweden with its registered office in Solna, Stockholm. The address of the head office is Armégatan 40, SE-171 71 Solna, Sweden.
The Parent Company is listed on Nasdaq OMX Stockholm.
On March 6, 2015, the Board of Directors approved these consolidated financial statements for publication. The annual accounts will be presented to the Annual General Meeting on May 5, 2015.
All amounts are recognized in SEK millions (SEK M) unless otherwise specified. Amounts in brackets represent the cor-responding year-earlier period.
2 SUMMARY OF IMPORTANT ACCOUNTING POLI-CIES
The most important accounting policies applied in the pre-paration of this annual report are detailed below. The same policies are usually applied by both the Parent Company and the Group.
2.1 Basis for preparing the annual accountsThe financial statements of the Byggmax Group were prepa-red in accordance with the Annual Accounts Act and Inter-national Financial Reporting Standards (IFRS)/International Accounting Standards (IAS), as adopted by the EU, and recommendation RFR 1 Supplementary Accounting Rules for Groups issued by the Swedish Financial Reporting Board.
Recommendation RFR 2 Accounting for Legal Entities, issued by the Swedish Financial Reporting Board, and the Annual Accounts Act were applied in the preparation of the financial statements of the Parent Company.
The financial statements of the Group and the Parent Company refer to the fiscal year ended December 31, 2014. Byggmax applies the acquisition method when measur-ing assets and liabilities, with the exception of derivative instruments, which are recognized at fair value in profit or loss.
2.1.1 New and amended standards applied by the GroupThose standards applied by the Group for the first time for the fiscal year starting January 1, 2014 and that have a material impact on the consolidated financial statements are detailed below:
The implementation of IFRS 10 Consolidated Financial Sta-
tements, IFRS 11 Joint Arrangements and IFRS 12 Disclosure of Interests in Other Entities only impacted supplementary disclosures.
Other standards, amendments and interpretations that enter force for fiscal years starting January 1, 2014 have no material impact on the consolidated financial statements.
2.1.2 New standards, amendments and interpretations of existing standards that have not been applied by the Group. A number of new standards and interpretations came into effect for fiscal years beginning after January 1, 2014 and were not applied in the preparation of these financial statements. None of these are expected to materially impact the consolidated financial statements, with the exception of those outlined below:
IFRS 9 Financial Instruments addresses the classification, measurement and recognition of financial assets and liabili-ties. The complete version of IFRS 9 was issued in July 2014, and replaces the parts of IAS 39 relating to the classification and measurement of financial instruments. The standard is to be applied to fiscal years beginning on or after January 1, 2018. Early adoption is permitted. The Group has yet to evaluate the impact of implementing the standard.
IFRS 15 Revenue from Contracts with Customers governs how income recognition is performed. The principles on which IFRS 15 is based aim to provide users of financial reports with more informative, relevant disclosures about the company’s revenue. The expanded disclosure requirements mean that information about the nature, timing and uncer-tainty of revenue and cash flows arising from the company’s contracts with customers must be provided. Under IFRS 15, revenue should be recognized when customers gain control of the sold product or service and are able to use or receive benefits from the product or service. IFRS 15 replaces IAS 18 Revenues and IAS 11 Construction Contracts as well as the SICs and IFRICs relating thereto. IFRS 15 enters force on January 1, 2017. Early adoption is permitted. The Group has yet to evaluate the impacts of implementing the standard.
IFRIC 21 Levies is an interpretation of IAS 37 Provisions, Contingent Liabilities and Contingent Assets. IFRIC 21 deals with the recognition of levies i.e. different forms of charges which may be imposed on a company by a State, or corresponding agency, through legislation and/or regula-tion, which, in the Group’s case, affects the recognition of property taxes. The obligating event that gives rise to the recognition of a liability is defined as the activity that triggers the payment of the levy. The interpretation enters force for fiscal years starting after June 17, 2014 according to the EU. The interpretation will not impact the Group on a full-year basis, however, the property tax liability will be re-cognized as of January 1 and the cost expensed in a straight line over the year.
None of the other IFRS or IFRIC interpretations that have yet to come into legal effect are expected to have any material impact on the Group.
ACCOUNTING POLICIES AND NOTES
BYGGMAX, 2014 ANNUAL REPORT 53BYGGMAX, 2014 ANNUAL REPORT52
Goodwill, which is recognized separately, is tested annually to identify possible impairment needs and is recognized at cost less accumulated impairment. Impairment of goodwill is not reversed. Gains or losses from the divestment of a unit include the remaining recognized value of the goodwill attributable to the divested unit.
Goodwill is allocated to the cash-generating unit (CGU) that existed when the goodwill item arose, when assessing possible impairment needs. The distribution is based on the CGUs or groups of CGUs that are expected to benefit from the business combination that resulted in the goodwill item. The Byggmax Group distributes the original goodwill to the segments existing on the date when the original goodwill arose. Additional goodwill is distributed to the units de-emed to benefit from the business combination.
2.6 Tangible fixed assetsAll tangible fixed assets are recognized at cost reduced by depreciation. The cost includes fees that can be directly attributed to acquisition of the asset.
Additional fees are added to the asset’s carrying amount or recognized as a separate asset, depending on what is most appropriate, only if it is probable that the future economic benefits associated with the asset will accrue to the Group and the asset’s cost can be measured in a reliable manner. The carrying amount for the replaced portion is elimina-ted from the balance sheet. All other forms of repairs and maintenance are recognized as costs in profit or loss during the period in which they arise. No depreciation is applied to land. Depreciation of other assets to reduce their cost to the estimated residual value over the estimated economic life-time is applied in a straight line according to the following:
Renovations and land maintenance 20 years
Equipment, tools, fixtures and fittings 10 years
Equipment, tools, fixtures and fittings 5 years
Computers and IT-related equipment 5 yearsThe residual values of assets and their economic lifetimes are reviewed every balance-sheet date and adjusted as necessary. An asset’s carrying amount is written down im-mediately to its recoverable amount if the asset’s carrying amount is greater than its estimated recoverable amount.
Gains and losses from divestments are established by com-paring the sale proceeds with the carrying amount and are recognized under other operating income or other expenses in profit or loss. Properties that the Group owns are sold when the building is ready for use. Thus depreciation does not arise on Byggmax’s properties, which are sold directly after construction. All properties are classified as operating properties.
2.7 Borrowing costsAs of January 1, 2009, the revised standard IAS 23 Borro-wing Costs is applied, meaning that the Group as of January 1, 2009 capitalizes borrowing costs that are directly attributable to the purchase, construction or production of an asset that takes a substantial period of time to complete for its intended use or sale as part of the cost of the asset. For periods prior to January 1, 2009, the principle was to immediately expense all borrowing costs. During 2014, the
Group did not capitalize borrowing costs, since there were no assets during the period that required a substantial period of time for completion for use or for sale.
2.8 Impairment of non-financial fixed assetsAssets that have an indeterminate economic lifetime, such as goodwill, are not depreciated but instead tested annually for the need for impairment. Tangible fixed assets that are depreciated and such intangible assets that are amortized are assessed with respect to decline in value whenever events or changes in circumstances indicate that the asset’s carrying amount exceeds its recoverable amount. Impair-ment is recognized in an amount corresponding to the amount by which the asset’s carrying amount exceeds the recoverable amount. The recoverable amount is the higher of the asset’s fair value reduced by sales costs and its value in use. In assessing impairment needs, assets are grouped at the lowest level for which separate cash flows can be identified (CGUs). For tangible and intangible fixed assets that have been impaired, an assessment is made on each balance-sheet date as to whether a reversal should take place. Impairment of goodwill is not reversed.
2.9 Financial instrumentsThe Group classifies its financial assets in the following categories: financial assets and liabilities measured at fair value in profit or loss, loan receivables and accounts recei-vable, financial assets held until maturity, available-for-sale financial assets and other financial liabilities. This classifi-cation depends on the purpose for which the financial asset was acquired. Management establishes the classification of the financial assets on the first reporting date and reasses-ses this decision on every reporting date. At present, the Group has no financial assets that are classed as financial assets held until maturity or available-for-sale financial assets.
Financial assets and liabilities measured at fair value in profit or lossFinancial assets and liabilities measured at fair value in profit or loss are financial instruments held for sale. A financial asset or a financial liability is classified in this ca-tegory if it was primarily acquired to be sold within a short period. Derivatives are classified as held for sale unless they are identified as hedges. The Group holds derivative instruments in the form of currency forward contracts. The Byggmax Group does not apply hedge accounting according to IAS 39, meaning that all derivative instruments are re-cognized at fair value in profit or loss. Changes in the value of derivative instruments attributable to borrowing are recognized under financial expenses. Other changes in the value of derivative instruments are recognized as financial income or expenses.
Loan receivables, accounts receivable and other receivablesLoan receivables, accounts receivable and other receivables are financial assets which are not derivatives, which have payments that are established or can be established and which are not listed on an active market. They are included in current assets with the exception of items with maturity dates greater than 12 months from the balance-sheet date, which classifies them as fixed assets. Loan receivables,
2.1.3 Use of assessmentsThe preparation of financial statements in compliance with IFRS and generally accepted Swedish accounting principles requires assessments and assumptions to be made that affect recognized asset and liability items and income and expense items, respectively, as well as other information disclosed. The actual outcome may differ from these as-sessments. The areas that require a high degree of complex assessment, or such areas in which assumptions and estimates are of material significance to the consolidated accounts, are detailed in Note 4.
2.2 Consolidated accountsSubsidiariesSubsidiaries are all the companies in which the Group has the right to design financial and operative strategies in a manner that normally results from a shareholding exceeding 50 percent of the voting rights of the shares or participations or in which the Group through an agreement is the sole party exercising a controlling influence. Subsidiaries are included in the consolidated accounts from the date on which the controlling influence was transferred to the Group. They are eliminated from the consolidated accounts as of the date the controlling influence ceases.
The acquisition method is applied in recognizing the Group’s acquisitions of subsidiaries. The cost of an acquisi-tion corresponds to the fair value of the assets received as compensation, issued equity instruments and liabilities arising or assumed on the acquisition date. Expenses directly attributable to the acquisition should be recognized in profit or loss. Identifiable acquired assets and assumed liabilities and contingent liabilities in an acquisition of a business are initially measured at fair value on the acquisition date, regardless of any minority interest. The surplus that cor-responds to the difference between the cost and the fair value of the Group’s share of identifiable acquired assets, liabilities and contingent liabilities are recognized as goodwill. If the cost is less than the fair value of the acquired subsidiary’s assets, liabilities and contingent liabilities, the difference is recognized directly in profit or loss.
Intra-group transactions and balance-sheet items, as well as unrealized gains on transactions between Group compa-nies are eliminated. Unrealized losses are also eliminated, although losses are considered an indication that a need for impairment may exist. The accounting policies for subsidia-ries were changed as appropriate to guarantee consistent application of the Group’s policies
Asset acquisitionsIn connection with the acquisition of a company, an as-sessment is made as to whether the acquisition should be classified as a business or an asset. Byggmax defines the acquisition as a business combination in the event of the ex-istence of a business activity with employees in addition to the acquired assets and liabilities. Business combinations are recognized in accordance with IFRS 3, which entails, for example, that acquisition costs are expensed directly and that deferred tax is recognized as the difference between the acquired assets’ market value and their residual value for tax purposes. For asset acquisitions, all acquisition costs are recognized as an increase of the cost in accordan-
ce with IAS 16 and IAS 38. Byggmax determines whether the acquisition is to be classified as a business or an asset on a case-by-case basis. No acquisitions were made in 2014.
2.3 Segment reportingOperating segments are recognized in a manner that cor-responds to the internal reporting submitted to the chief operating decision maker (CODM). The CODM is the function that is responsible for the allocation of resources and as-sessment of the operating segments’ results. In the Group, this function was identified as the Board of Directors. Byggmax has only one identified operating segment, which is the Nordic segment.
2.4 Translation of foreign currencyFunctional currency and reporting currencyItems included in the financial statements of each of the Group’s entities are measured using the currency of the primary economic environment in which the entity operates (‘the functional currency’). In the consolidated accounts, Swedish kronor (SEK) is used, which is the Parent Compa-ny’s functional currency and reporting currency.
Transactions and balance-sheet itemsTransactions in foreign currency are translated to the fun-ctional currency according to the exchange rate prevailing on the transaction date. Exchange-rate gains and losses arising in payment of such transactions and in translation of monetary assets and liabilities in foreign currencies at the closing-date rate are recognized in profit or loss. Exchange-rate differences in accounts payable and accounts receiva-ble are recognized in EBIT. Other exchange-rate differences are recognized in net financial items.
Consolidation of foreign subsidiaries and branchesThe assets and liabilities of foreign subsidiaries and branches are translated at the closing-date rate, while all items in profit or loss are translated monthly at the month’s average rate and all exchange-rate differences that arise in the translation of foreign subsidiaries’ financial statements are recognized in other comprehensive income.
2.5 Intangible assetsCapitalized expenses for development work and similar itemsCapitalized expenses for development work and similar items, primarily capitalized investments in the Group’s business system and website, are recognized at cost less accumulated amortization and any impairment. Amortiza-tion is applied on a straight-line basis over the estimated economic lifetime, which is five years.
Costs for maintenance of proprietary development work are expensed as they arise. Development costs attributable to the development and testing of identifiable products and systems are recognized as an intangible fixed asset when the criteria for recognizing an intangible asset are satisfied.
GoodwillGoodwill corresponds to the amount by which the cost exceeds the fair value of the Group’s share of an acquired subsidiary’s identifiable net assets on the acquisition date. Goodwill from the acquisition of subsidiaries is recognized as an intangible asset.
BYGGMAX, 2014 ANNUAL REPORT 55BYGGMAX, 2014 ANNUAL REPORT54
2.11 Current and deferred taxThe tax cost for the year comprises current and deferred tax. Tax is recognized in profit or loss, except when tax pertains to items that are recognized in other comprehensive income or directly in shareholders’ equity. In such cases, tax is re-cognized in other comprehensive income and shareholders’ equity respectively.
The current tax cost is calculated based on the tax regu-lations on the balance-sheet date that are in effect or in practice approved in the countries in which the Parent Company’s subsidiaries are active and generate taxable income. Management actively evaluates the claims that are made in tax returns regarding situations where tax regula-tions are subject to interpretation and allocates reserves where appropriate for amounts that are likely to be paid to tax authorities.
Deferred tax is recognized in its entirety according to the balance-sheet method on all temporary differences arising between the value for tax purposes of assets and liabilities and their carrying amounts in the consolidated accounts. A deferred tax liability is not recognized, however, if it arises as a result of the initial recognition of goodwill. Neither is deferred tax recognized if it arises as a result of a transac-tion for an asset or liability being recognized for the first time that is not a business combination and which on the acquisition date does not affect recognized or taxable earnings. Deferred income tax is calculated by applying tax rates and laws that have been approved or announced on the balance-sheet date and which are expected to apply when the deferred tax assets are realized or when the defer-red tax liabilities are settled.
Deferred tax assets are recognized to the extent that it is probable that future surpluses for tax purposes will be available to offset temporary differences.
Deferred tax is calculated on the basis of temporary dif-ferences arising in participations in subsidiaries except in cases where reversal of the temporary differences can be controlled by the Group and it is probable that the tempora-ry difference will not be reversed in the foreseeable future.
When there is an intent to settle balances through net pay-ments, deferred tax assets and liabilities are offset when a legal right of offset exists for current tax assets and tax liabilities and when the deferred tax assets and liabilities can be attributed to taxes debited by one and the same tax authority and apply to the same tax subject or different tax subjects.
2.12 Employee BenefitsPension obligationsThe Group companies only have defined-contribution pen-sion plans with the exception of Alecta, which is a defined-benefit plan that for the time being can be treated as a defined-contribution plan.
For defined-contribution pension plans, Byggmax pays a fee to a publicly or privately administered pension insu-
rance plan on an obligatory, contractual or voluntary basis. The Group has no further payment obligations when the fees have been paid. The fees are recognized as personnel costs in profit or loss at the rate at which they are earned by employees performing services for the company during a period. Prepaid fees are recognized as an asset to the extent that cash payment or a reduction of future payments will accrue to the Group.
Compensation on termination of employmentCompensation on termination of employment is paid when employment is terminated by Byggmax prior to the normal pension age or when the employee accepts a voluntary termination in exchange for such compensation. The Group recognizes severance pay when the Group is demonstrably obligated either to terminate employment according to a de-tailed formal plan without any option for recall or to provide compensation in a case of termination of employment as a result of an offer made to encourage voluntary resigna-tion. Benefits that are due more than 12 months after the balance-sheet date are discounted to current value.
Bonus plansThe Group recognizes a liability and an expense for bo-nuses. The Group recognizes a provision when there is a legal obligation or an informal obligation due to previous practice.
Share-based paymentsShare-based payments within the scope of the existing op-tions program do not entail any cost under IFRS 2, since the price of the warrants corresponds to their fair value.
2.13 Income recognitionSale of goodsThe Group’s income is generated from the sale of goods that are included in the Byggmax product range. Sales are primarily to private customers, although there are some sales to companies. There is no production or development of products within the Group. Sales recognized are net of intra-Group sales.
Income includes the fair value of what has been received or will be received for goods sold in the Group’s ongoing operations. Income is recognized in net amounts with deductions for VAT, returns and discounts. The Group recog-nizes income when its amount can be measured in a reliable manner and it is probable that future economic benefits will accrue to the company. This date coincides with delivery of the goods to the customer.
Interest incomeInterest income is recognized at the rate in which it is earned.
Sale of propertiesThe Group builds properties which after completion are sold to a leasing company (see also 2.14 Leasing below with respect to Sale-and-leaseback transactions). Byggmax recognizes income from the sale of the property when risks and benefits associated with ownership are transferred to the leasing company, which normally coincides with the
accounts receivable and other receivables are recognized as accounts receivable, other receivables and other long-term receivables in the balance sheet. Cash and cash equiva-lents are also included in this category. An impairment of accounts receivable and other receivables is recognized in profit or loss under other expenses.
Other financial liabilitiesThe Group’s borrowing (which includes borrowing from credit institutions and other long-term borrowing in the balance sheet) and accounts payable are classified as other financial liabilities.
General policiesPurchases and sales of financial assets and liabilities are recognized on the transaction date, which is the date on which the Group pledged to purchase or sell the asset or liability. Financial assets and liabilities are initially recog-nized at fair value in the balance sheet. Financial assets are removed from the balance sheet when the right to receive cash flows from the instrument has expired or been trans-ferred and the Group has transferred, essentially, all risks and benefits associated with ownership rights. Financial liabilities are removed from the balance sheet when the contractual obligation has been fulfilled or in some other manner extinguished.
Financial assets and liabilities measured at fair value in profit or loss and available-for-sale financial assets are recognized after the acquisition date at fair value. Loan receivables, ac-counts receivable and other receivables and financial assets held until maturity and other financial liabilities are recognized after the acquisition date at amortized cost with application of the effective-interest method.
The fair value of currency forward contracts is established using observable data for currency forwards on the balance-sheet date. Fair value for interest swaps is calculated as the current value of estimated cash flows.
On each balance-sheet date, the Group considers whether there is objective evidence of a need for impairment for a financial asset or a group of financial assets, such as the closure of an active market or the probability that a debtor will not be able to discharge its obligations. Impairments of equity instruments, which are recognized in profit or loss, are not reversed in profit or loss. Impairment testing of accounts receivable is described below.
Accounts receivable and other receivablesAccounts receivable and other receivables are initially recognized at fair value and thereafter at amortized cost with application of the effective-interest method reduced by any provisions for decline in value. The carrying amount for accounts receivable and other receivables, after any impairments, is assumed to correspond to the fair value, since this item is short-term by nature. Provisions for a decline in value in accounts receivable are made when there is objective evidence that the Group will not be able to re-ceive all amounts due according to the original terms of the receivables. Significant financial difficulties for the debtor, probability that the debtor will be declared bankrupt or un-
dergo financial reconstruction and missing or late payments (due for more than 90 days) are considered indicators that a need for impairment of an account receivable may apply. Losses relating to accounts receivable, other receivables and recovered and previously impaired accounts receivable and other receivables are recognized under the item other expenses in profit or loss.
Cash and cash equivalentsIn the Group’s report on financial position, cash and cash equivalents correspond to cash, bank balances, other short-term investments with maturity dates within three months from the acquisition date and blocked bank balan-ces that are expected to be settled within 12 months after the balance-sheet date. The overdraft facility is recognized as borrowing among current liabilities.
Cash and cash equivalents in the cash-flow statement do not agree with the definition of cash and cash equivalents in the balance sheet. In the cash-flow statement, we have excluded blocked bank balances, since they are expected to be settled later than three months from the acquisition date.
Share capitalCommon shares are classified as shareholders’ equity. Transaction costs that can be directly attributed to new share issues are recognized in net amounts after tax in sha-reholders’ equity as a deduction from the issue proceeds. Premiums for warrants are recognized in the shareholders’ equity item retained earnings.
Accounts payableAccounts payable are initially recognized in the balance sheet at fair value and then at amortized cost with applica-tion of the effective-interest method. The carrying amount of accounts payable is assumed to correspond to their fair value, since this item is short-term by nature.
BorrowingBorrowing is recognized initially at fair value net after transaction costs. Borrowing is subsequently recognized at amortized cost, and any difference between the amount received (net after transaction costs) and the repayment amount is recognized in profit or loss distributed over the term of the loan with application of the effective-interest method. Borrowing is classified as current liabilities unless the Group has an unconditional right to defer payment of the debt for at least 12 months after the balance-sheet date.
2.10 InventoriesInventories are recognized at the lower of cost and net sales value. The cost is established using the weighted-average method. The cost of goods for resale corresponds to the purchasing cost for the goods. Borrowing costs are not included. Inventory consists of building supplies sold in Byggmax stores. The net sales value is the estimated sales price in operating activities reduced by applicable variable sales costs. Provisions required for obsolescence were made.
BYGGMAX, 2014 ANNUAL REPORT 57BYGGMAX, 2014 ANNUAL REPORT56
a) Market risk(i) Currency riskAlthough Byggmax’s consolidated accounts are stated in SEK, the Group has operations in Sweden, Norway and Finland and purchases some goods in other currencies than SEK. This means that the Group is exposed to currency risk in that unfavorable changes in exchange rates can have a negative effect on EBIT, shareholders’ equity and cash flow.
Transaction exposure in commercial flowsPayment flows in the form of accounts receivable and ac-counts payable in foreign currency result in currency expo-sure for the Group. Byggmax has currency exposure in NOK, some exposure resulting from the purchase of goods in USD and in EUR (for which there is a natural hedge in sales in EUR in the Finnish market).
Sensitivity analysis, currency risk for 2014
Change (percentage point), all other
factors unchanged
Effect on EBIT (SEK M)
2014
Effect on EBIT (SEK M) 2013
NOK +/- 10% +/- 1.3 +/- 1.2
EUR +/- 10% +/- 0.2 +/- 0.3
Exposure in another currency other than the functional cur-rency at December 31, 2014, in the transaction currency
Each quarter, Byggmax hedges currency positions greater than SEK 100 M on an annual basis by hedging 50 percent for the coming six months and 25 percent for the coming quarter, meaning that 75 percent is hedged.
Transaction exposure in consolidation of units outside SwedenThe Group’s EBIT is also affected by currency effects arising due to exchange-rate trends in the local currencies of the various foreign subsidiaries and branches against SEK. Translation effects also arise for the Group’s net assets in the consolidation of the balance sheets of foreign compa-nies and branches. This risk is not hedged
(ii) Interest riskThe Group’s interest risk arises primarily through long-term borrowing. The Group’s borrowing carries floating-rate inte-rest, thus resulting in exposure. Borrowing that is subject to floating-rate interest exposes the Group to interest risk with respect to cash flow.
To reduce the interest risk, the Group has as its policy that interest is to be fixed for 50 percent of the remaining bank loans for at least two years. If interest on the Group’s bor-rowing in SEK had been 1.0 percentage point higher/lower during 2014 with all other variables constant and considera-tion taken to interest swaps, the consolidated profit after tax for the fiscal year would have been SEK 4.2 M higher/lower, primarily as an effect of higher interest expenses for borrowing with floating-rate interest. Byggmax continuous-ly monitors the interest risk by examining the effect of loans with floating-rate interest on EBIT for the year. Under the existing financing agreement with Handelsbanken, there was no long-term borrowing at December 31, 2014 and thus no hedging of interest rates was carried out. Sensitivity analysis, interest risk for 2014
Change (percenta-ge point), all other factors unchanged
Effect on EBIT (SEK M)
2014
Effect on EBIT (SEK M)
2013
Interest Rate + 1% -4.2 -3.0
b) Credit riskByggmax has very low credit risk in relation to the Group’s customers in that the majority of sales are in cash and since the Group does not invoice external customers. Credit expo-sure primarily comprises accrued but as yet unpaid bonuses from suppliers.
c) Liquidity riskByggmax’s policy in respect of liquidity risk is to ensure the Group has sufficient cash and cash equivalents to finance operating activities. The Board of Directors manages the liquidity risk exposure through ensuring that Byggmax has sufficient credit facilities in place to satisfy the future needs of the business. The need is established through continuous follow up of forecast and actual cash flows with consideration taken to the tenors of financial assets and liabilities in the balance sheet. Byggmax’s primary credit facility is provided by Svenska Handelsbanken by way of a credit agreement. The agreement with Svenska Handelsban-ken extents until March 31, 2017.
The size of the credit facility available is reviewed regularly and is designed to cover forecast peaks in the gross debt le-vel with a healthy margin. On December 31, 2014, the Group had cash and cash equivalents totaling SEK 30.9 M (33.1) and an unutilized credit facility of SEK 99.2 M (78.8). Infor-mation regarding blocked bank funds is available in Note 24. The table below shows the non-discounted cash flows that arise from the Group’s liabilities in the form of financial instruments based on the contracted remaining periods on the balance-sheet date. Amounts in foreign currencies and amounts to be paid are based on floating-rate interest and were estimated by using the exchange and interest rates prevailing on the balance-sheet date.
DKK EUR NOK SEK USD
Accounts receivable 0.0 0.1 0.0 0.3 0.0
Accounts payable 3.7 3.5 0.4 27.7 0.3
Exposure in another currency other than the functional currency at December 31, 2013, in the transaction currency
DKK EUR NOK SEK USD
Accounts receivable 0.0 0.1 0.0 0.0 0.0
Accounts payable 4.6 2.4 0.1 13.1 0.1
transfer date.2.14 LeasingLeasing in which a significant portion of the risks and benefits of ownership are retained by the lessor is classified as operational leasing. Payments made during the leasing period are expensed in profit or loss in a straight line over the leasing period.
Leasing of fixed assets in which Byggmax, in all significant respects, has the economic risks and benefits associated with ownership is classified as financial leasing. At the begin-ning of the leasing period, financial leasing is recognized in the balance sheet at the lower of the leasing object’s fair value and the current value of the minimum leasing fees. Each leasing payment is distributed between amortization of the debt and financial expenses to achieve a fixed interest rate for the recognized liability. The corresponding payment obli-gations, after deduction of financial expenses, are included in the balance sheet under borrowing from credit institutions. The interest portion of financial expenses is recognized in profit or loss and distributed over the leasing period so that an amount is recognized in every reporting period that cor-responds to a fixed interest rate for the recognized liability during the respective period. Fixed assets held according to financial leasing contracts are amortized over the shorter of the periods for the asset’s economic lifetime and the leasing period.
Sale-and-leaseback transactionsA sale-and-leaseback transaction comprises the sale of an asset and subsequent leasing of the same asset under a leasing contract. When Byggmax builds a property, it is sold after completion to an external party, whereby the property is leased back to Byggmax for its operations. In assessing the terms of the sales transaction and the leasing contract, the Group considers if the sale price is on market terms and if the leasing fee that the Group pays is based on market levels.
All sale-and-leaseback transactions are considered to be operational leasing contracts, and the sale is considered to be based on market terms, meaning that the leasing fee was not subject to adjustments. The leasing fee is expensed in a straight line over the period of the leasing contract and in accordance with the contract.
Gains relating to sale-and-leaseback transactions are recognized in the item financial income in profit or loss and losses relating to sale-and-leaseback transactions are recognized in the item financial expenses in profit or loss.
2.15 DividendsDividends to the Parent Company’s shareholders are recog-nized as a liability in the consolidated financial statements in the period in which the dividend is approved by the Parent Company’s shareholders.
2.16 Parent Company accounting policiesThe Parent Company has prepared its Annual Report in accordance with the Swedish Annual Accounts Act and the Swedish Financial Reporting Board’s recommendation, RFR 2 Accounting for Legal Entities. This entails that in the annual report for the legal entity, the Parent Company is to apply all IFRS and interpretations approved by the EU as far as possible
within the framework of the Swedish Annual Accounts Act and take into account the connection between accounting and taxation. The recommendation specifies the exceptions and supplements that are to be applied from IFRS. The Parent Company applies different accounting policies than the Group as specified below.
Presentation form for the income statement and the balance sheetThe Parent Company applies the presentation forms spe-cified in the Swedish Annual Accounts Act, which means in part that another presentation of shareholders’ equity is applied and that provisions are recognized under a separate heading in the balance sheet.
Shares in subsidiariesShares in subsidiaries are recognized at cost after deduc-tion of any impairment. Received dividends are recognized as income, whereupon an assessment is made of any need for impairment of shares in subsidiaries. When there is an indication that shares and participations in subsidiaries have declined in value, a calculation of the recoverable amount is performed. If that value is lower than the car-rying amount, impairment is recognized. Impairments are recognized under income from participations in Group companies.
Group contributions and shareholder contributionsThe Parent Company applies RFR 2 for Group contributions. This entails that Group contributions that the Parent Com-pany receives from subsidiaries are recognized as financial income and that Group contributions that are paid from the Parent Company to subsidiaries are recognized as an in-crease in the participation in a subsidiary. The tax on Group contributions received/paid is recognized in accordance with IAS 12 in profit or loss.
3 FINANCIAL RISK MANAGEMENT
3.1 Financial risk factorsThrough its operations, the Group is exposed to various financial risks, such as market risk (including currency and interest risk), credit risk and liquidity risk.
The Group’s overriding financial policy is intended to identify and minimize the effects of financial risks. Practical risk management is handled by Byggmax’s central finance depart-ment according to the financial policy established each year by the Board of Directors. The financial hedging relations es-tablished by the Group as part of its risk management do not qualify for hedge accounting according to the rules in IAS 39.
The Board of Directors continuously receives reports in respect of cash flows, debt levels and fulfillment of the terms of financial agreements, together with comparisons with budgets and forecasts.
The Parent Company Byggmax Group AB is deemed to have limited risk exposure, meaning that the descriptions below primarily relate to the Group as a whole. The described risks can thus affect the Parent Company indirectly in that the as-set item participations in Group companies may be positively or negatively affected by how the risks described below are managed.

BYGGMAX, 2014 ANNUAL REPORT 59BYGGMAX, 2014 ANNUAL REPORT58
4 IMPORTANT ESTIMATES AND ASSESSMENTS
Important estimates and assumptions for accounting purposesThe Group makes estimates and assumptions regarding the future to be able to prepare the accounts in accordance with generally accepted accounting practices. Estimates and assumptions are evaluated regularly and are based on historical experience and other factors, including expectations regarding future events that are considered reasonable under the prevailing circumstances. The actual outcome may differ from the estimates and assumptions made. The estimates and assumptions made in the final accounts on December 31, 2014, are not considered able to significantly affect the EBIT and financial position for the coming fiscal year.
LeasingAll sale-and-leaseback transactions are considered to be operational leasing contracts, which is based on an appraisal of each leasing contract in relation to the following criteria: financial implication, leasing period and whether the contract contains an option on the property.
Testing of impairment need for goodwillThe Group determines each year if there is any need to recognize an impairment of goodwill, in accordance with the ac-counting policy described in Note 2.8. Impairment of non-financial fixed assets. The assumptions and assessments made in respect of expected cash flows and the discount rate are described in Note 13.
5 SEGMENT INFORMATION
Information by geographic area 2014 2013
Net sales Sweden 2,606.2 2,363.0
Net sales Norway 771.7 704.3
Net sales other countries 169.2 149.1
Total sales 3,547.2 3,216.4
ASSETS 2014 2013
Assets in Sweden 1,887.4 1,744.5
Assets in Norway 199.8 169.6
Assets in other countries 32.3 30.7
Total assets 2,119.5 1,994.8
Byggmax has only identified one operating segment, the Nordic segment, as described in Note 2.3. The Parent Company has no net sales.
6 OTHER OPERATING INCOME
Group 2014 2013
Exchange-rate differences 7.0 2.6
Gain from divestment of equipment 0.3 0.3
Other 4.9 3.8
Total other operating income 12.2 6.6
7 OTHER EXPENSES
Group 2014 2013
Exchange-rate differences -8.2 -7.8
Loss from divestment of equipment -0.7 -0.2
Total other operating expenses -8.9 -8.0
Group (SEK M) Less than 1 yearBetween 1
and 2 yearsBetween 2
and 5 yearsMore than 5
years
At December 31, 2014
Borrowing 476.7 1.2
Liabilities relating to financial leasing 4.7 1.8
Net regulated derivative instruments (interest swaps)
Gross regulated derivative instruments (currency forwards)
1.3
Accounts payable 370.4
Total 853.1 3.0 0.0 0.0
At December 31, 2013
Borrowing 492.4 0.9
Liabilities relating to financial leasing 13.0 5.4 0.4
Net regulated derivative instruments (interest swaps)
Gross regulated derivative instruments (currency forwards)
0.8
Accounts payable 284.8
Total 791.0 6.3 0.4 0.0
Parent Company (SEK M) Less than 1 yearBetween 1
and 2 yearsBetween 2
and 5 yearsMore than 5
years
At December 31, 2014
Borrowing 476.7 1.2
Total 476.7 1.2 0.0 0.0
At December 31, 2013
Borrowing 492.4 0.9
Total 492.4 0.9 0.0 0.0
3.2 Management of financing/capital riskThe Byggmax Group works to reduce its capital/financing risk by:•Establishing adequate credit facilities well in advance of oreseeable needs.•Monitoring due dates for the total debt in order to match amortization to anticipated cash flow.•Satisfying key ratios according to financing contracts. The key ratios are the interest-coverage ratio, debt/equity ratio and the equity ratio/risk-bearing capital.•Optimizing working capital within the Group. Working capi-tal refers to: the total of inventory, accounts receivable, re-ceivables on bonuses from suppliers, other receivables and prepaid expenses/accrued income less the total of accounts payable, tax liabilities, other current liabilities and accrued expenses/deferred income. While Byggmax has no specified goal for the equity ratio, there is a dividend target. Byggmax policy is for dividends to amount to at least 50 percent of Byggmax’s net profits for the preceding fiscal year, subject to Byggmax’s need for capital, EBIT, financial position, capi-tal requirements and current economic conditions.
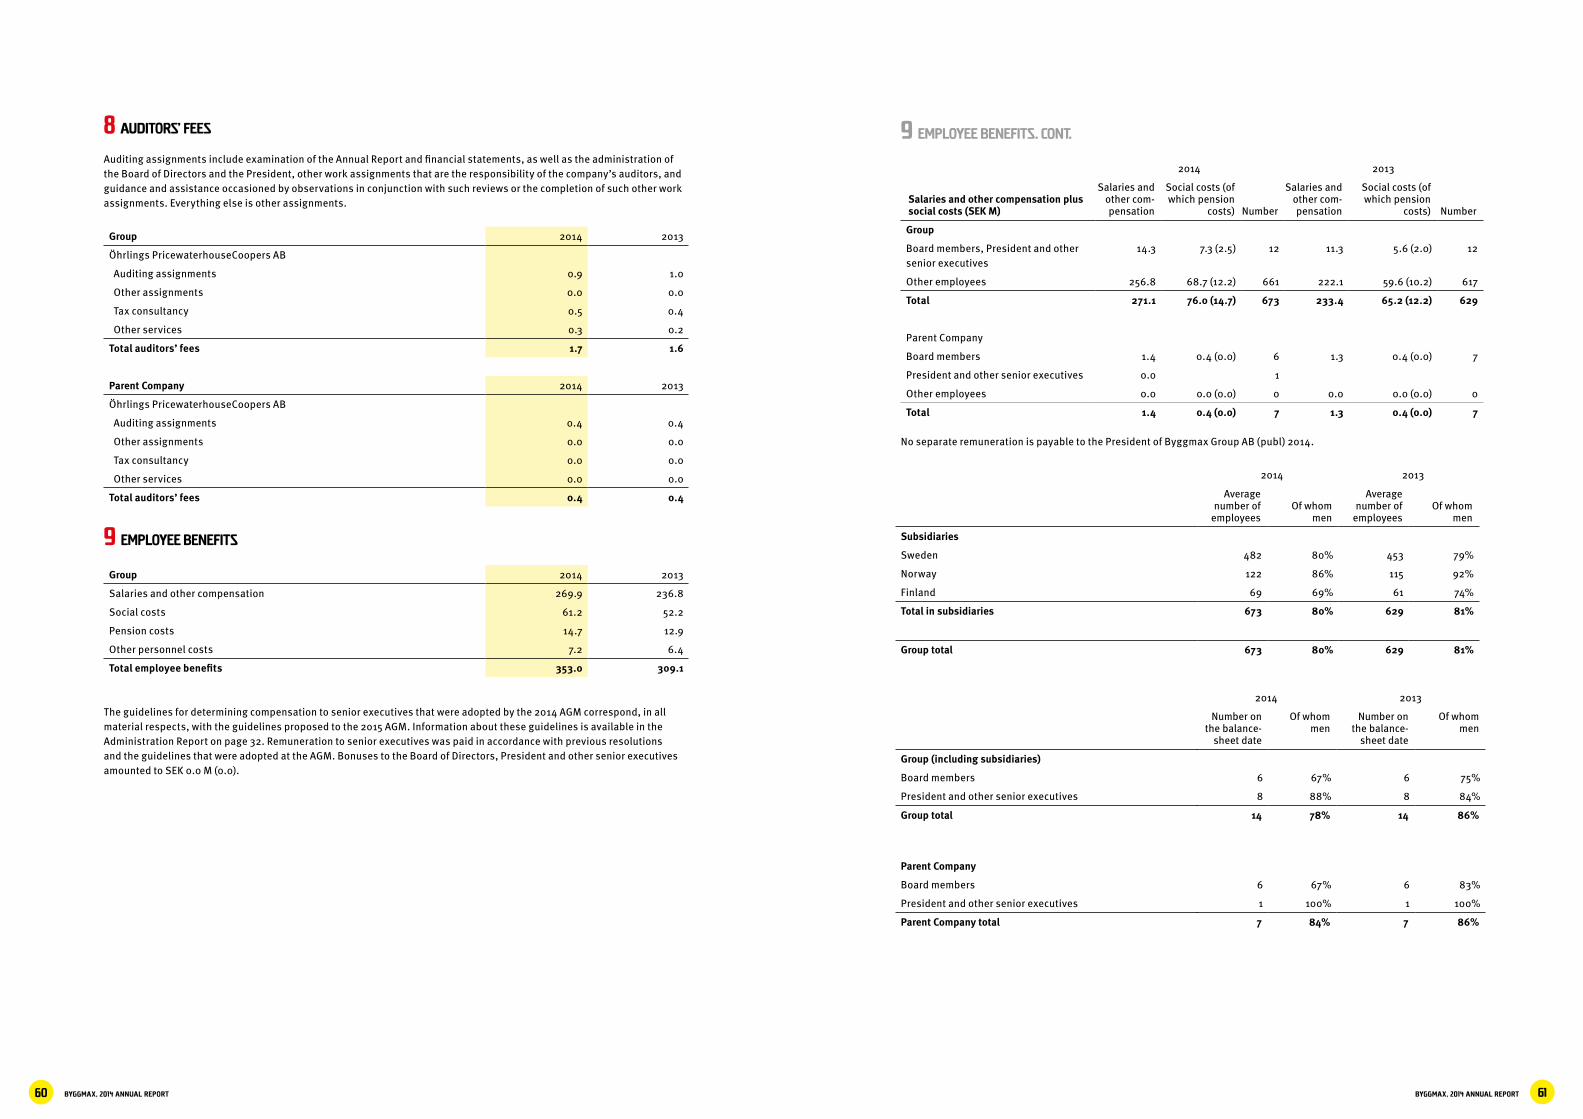
BYGGMAX, 2014 ANNUAL REPORT 61BYGGMAX, 2014 ANNUAL REPORT60
9 EMPLOYEE BENEFITS. CONT.
2014 2013
Salaries and other compensation plus social costs (SEK M)
Salaries and other com-pensation
Social costs (of which pension
costs) Number
Salaries and other com-pensation
Social costs (of which pension
costs) Number
Group
Board members, President and other senior executives
14.3 7.3 (2.5) 12 11.3 5.6 (2.0) 12
Other employees 256.8 68.7 (12.2) 661 222.1 59.6 (10.2) 617
Total 271.1 76.0 (14.7) 673 233.4 65.2 (12.2) 629
Parent Company
Board members 1.4 0.4 (0.0) 6 1.3 0.4 (0.0) 7
President and other senior executives 0.0 1
Other employees 0.0 0.0 (0.0) 0 0.0 0.0 (0.0) 0
Total 1.4 0.4 (0.0) 7 1.3 0.4 (0.0) 7
No separate remuneration is payable to the President of Byggmax Group AB (publ) 2014.
2014 2013
Average number of
employeesOf whom
men
Average number of
employeesOf whom
men
Subsidiaries
Sweden 482 80% 453 79%
Norway 122 86% 115 92%
Finland 69 69% 61 74%
Total in subsidiaries 673 80% 629 81%
Group total 673 80% 629 81%
2014 2013
Number on the balance-
sheet date
Of whom men
Number on the balance-
sheet date
Of whom men
Group (including subsidiaries)
Board members 6 67% 6 75%
President and other senior executives 8 88% 8 84%
Group total 14 78% 14 86%
Parent Company
Board members 6 67% 6 83%
President and other senior executives 1 100% 1 100%
Parent Company total 7 84% 7 86%
8 AUDITORS’ FEES
Auditing assignments include examination of the Annual Report and financial statements, as well as the administration of the Board of Directors and the President, other work assignments that are the responsibility of the company’s auditors, and guidance and assistance occasioned by observations in conjunction with such reviews or the completion of such other work assignments. Everything else is other assignments.
Group 2014 2013
Öhrlings PricewaterhouseCoopers AB
Auditing assignments 0.9 1.0
Other assignments 0.0 0.0
Tax consultancy 0.5 0.4
Other services 0.3 0.2
Total auditors’ fees 1.7 1.6
Parent Company 2014 2013
Öhrlings PricewaterhouseCoopers AB
Auditing assignments 0.4 0.4
Other assignments 0.0 0.0
Tax consultancy 0.0 0.0
Other services 0.0 0.0
Total auditors’ fees 0.4 0.4
9 EMPLOYEE BENEFITS
Group 2014 2013
Salaries and other compensation 269.9 236.8
Social costs 61.2 52.2
Pension costs 14.7 12.9
Other personnel costs 7.2 6.4
Total employee benefits 353.0 309.1
The guidelines for determining compensation to senior executives that were adopted by the 2014 AGM correspond, in all material respects, with the guidelines proposed to the 2015 AGM. Information about these guidelines is available in the Administration Report on page 32. Remuneration to senior executives was paid in accordance with previous resolutions and the guidelines that were adopted at the AGM. Bonuses to the Board of Directors, President and other senior executives amounted to SEK 0.0 M (0.0).
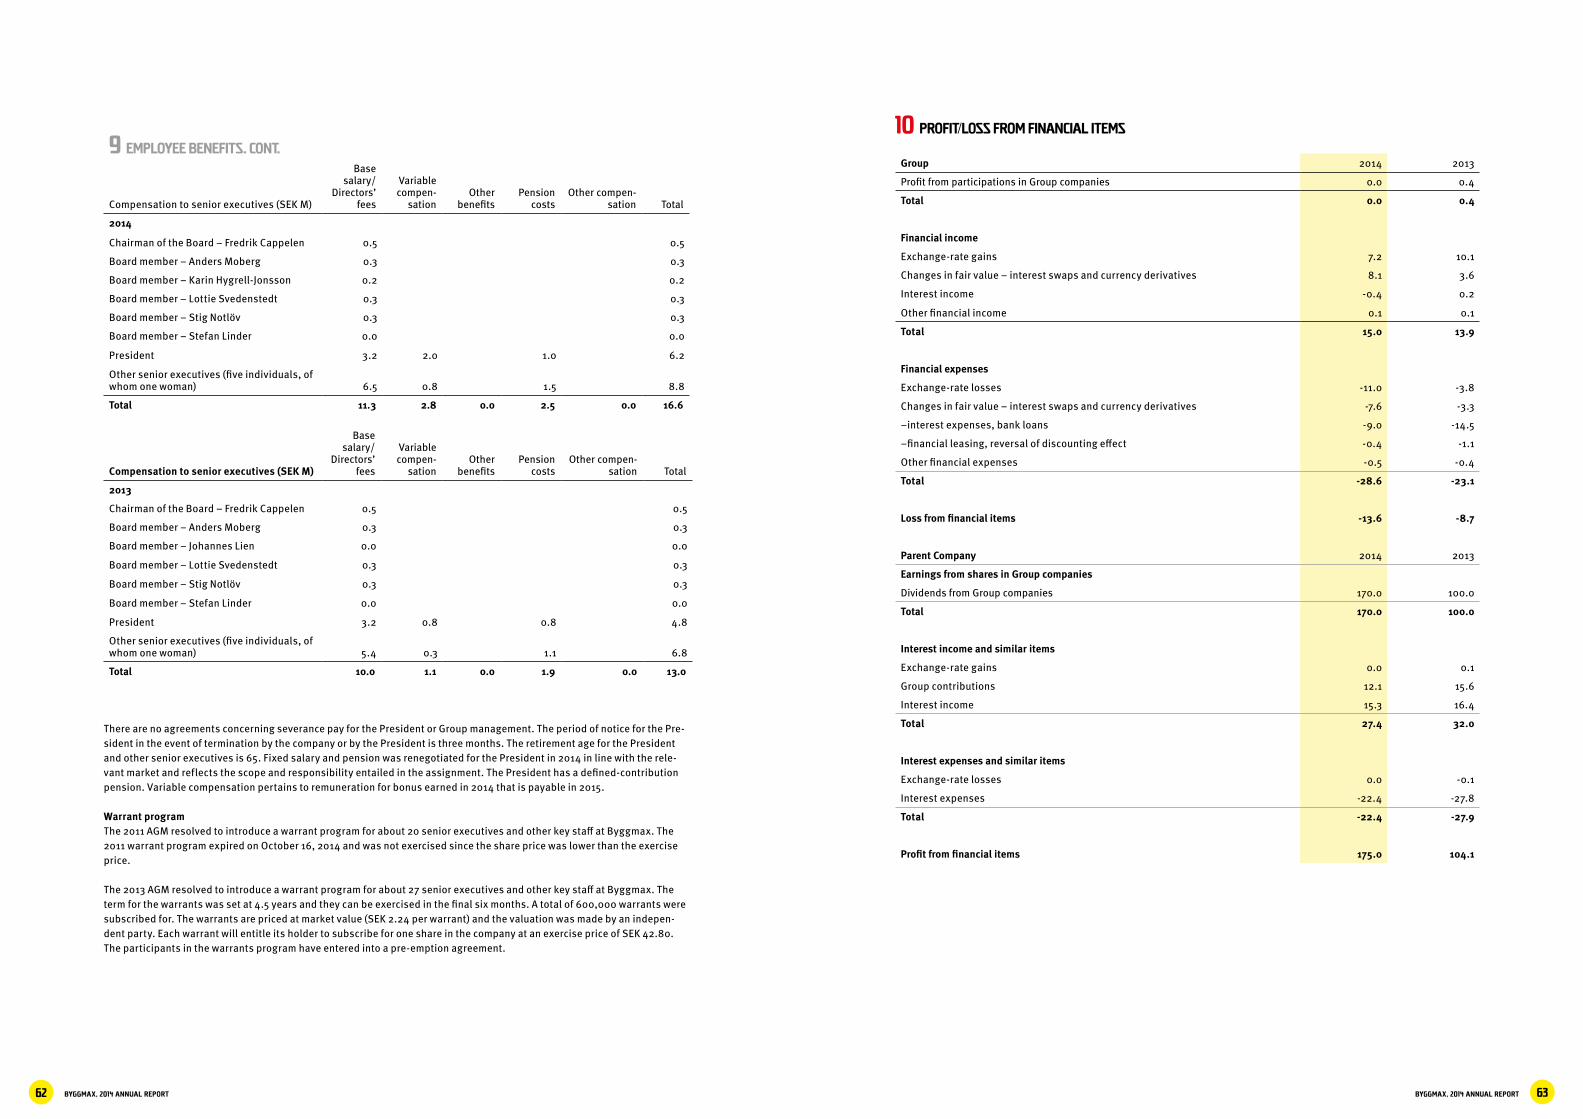
BYGGMAX, 2014 ANNUAL REPORT 63BYGGMAX, 2014 ANNUAL REPORT62
10 PROFIT/LOSS FROM FINANCIAL ITEMS
Group 2014 2013
Profit from participations in Group companies 0.0 0.4
Total 0.0 0.4
Financial income
Exchange-rate gains 7.2 10.1
Changes in fair value – interest swaps and currency derivatives 8.1 3.6
Interest income -0.4 0.2
Other financial income 0.1 0.1
Total 15.0 13.9
Financial expenses
Exchange-rate losses -11.0 -3.8
Changes in fair value – interest swaps and currency derivatives -7.6 -3.3
–interest expenses, bank loans -9.0 -14.5
–financial leasing, reversal of discounting effect -0.4 -1.1
Other financial expenses -0.5 -0.4
Total -28.6 -23.1
Loss from financial items -13.6 -8.7
Parent Company 2014 2013
Earnings from shares in Group companies
Dividends from Group companies 170.0 100.0
Total 170.0 100.0
Interest income and similar items
Exchange-rate gains 0.0 0.1
Group contributions 12.1 15.6
Interest income 15.3 16.4
Total 27.4 32.0
Interest expenses and similar items
Exchange-rate losses 0.0 -0.1
Interest expenses -22.4 -27.8
Total -22.4 -27.9
Profit from financial items 175.0 104.1
9 EMPLOYEE BENEFITS. CONT.
Compensation to senior executives (SEK M)
Base salary/
Directors’ fees
Variable compen-
sationOther
benefitsPension
costsOther compen-
sation Total
2014
Chairman of the Board – Fredrik Cappelen 0.5 0.5
Board member – Anders Moberg 0.3 0.3
Board member – Karin Hygrell-Jonsson 0.2 0.2
Board member – Lottie Svedenstedt 0.3 0.3
Board member – Stig Notlöv 0.3 0.3
Board member – Stefan Linder 0.0 0.0
President 3.2 2.0 1.0 6.2
Other senior executives (five individuals, of whom one woman) 6.5 0.8 1.5 8.8
Total 11.3 2.8 0.0 2.5 0.0 16.6
Compensation to senior executives (SEK M)
Base salary/
Directors’ fees
Variable compen-
sationOther
benefitsPension
costsOther compen-
sation Total
2013
Chairman of the Board – Fredrik Cappelen 0.5 0.5
Board member – Anders Moberg 0.3 0.3
Board member – Johannes Lien 0.0 0.0
Board member – Lottie Svedenstedt 0.3 0.3
Board member – Stig Notlöv 0.3 0.3
Board member – Stefan Linder 0.0 0.0
President 3.2 0.8 0.8 4.8
Other senior executives (five individuals, of whom one woman) 5.4 0.3 1.1 6.8
Total 10.0 1.1 0.0 1.9 0.0 13.0
There are no agreements concerning severance pay for the President or Group management. The period of notice for the Pre-sident in the event of termination by the company or by the President is three months. The retirement age for the President and other senior executives is 65. Fixed salary and pension was renegotiated for the President in 2014 in line with the rele-vant market and reflects the scope and responsibility entailed in the assignment. The President has a defined-contribution pension. Variable compensation pertains to remuneration for bonus earned in 2014 that is payable in 2015.
Warrant programThe 2011 AGM resolved to introduce a warrant program for about 20 senior executives and other key staff at Byggmax. The 2011 warrant program expired on October 16, 2014 and was not exercised since the share price was lower than the exercise price.
The 2013 AGM resolved to introduce a warrant program for about 27 senior executives and other key staff at Byggmax. The term for the warrants was set at 4.5 years and they can be exercised in the final six months. A total of 600,000 warrants were subscribed for. The warrants are priced at market value (SEK 2.24 per warrant) and the valuation was made by an indepen-dent party. Each warrant will entitle its holder to subscribe for one share in the company at an exercise price of SEK 42.80. The participants in the warrants program have entered into a pre-emption agreement.
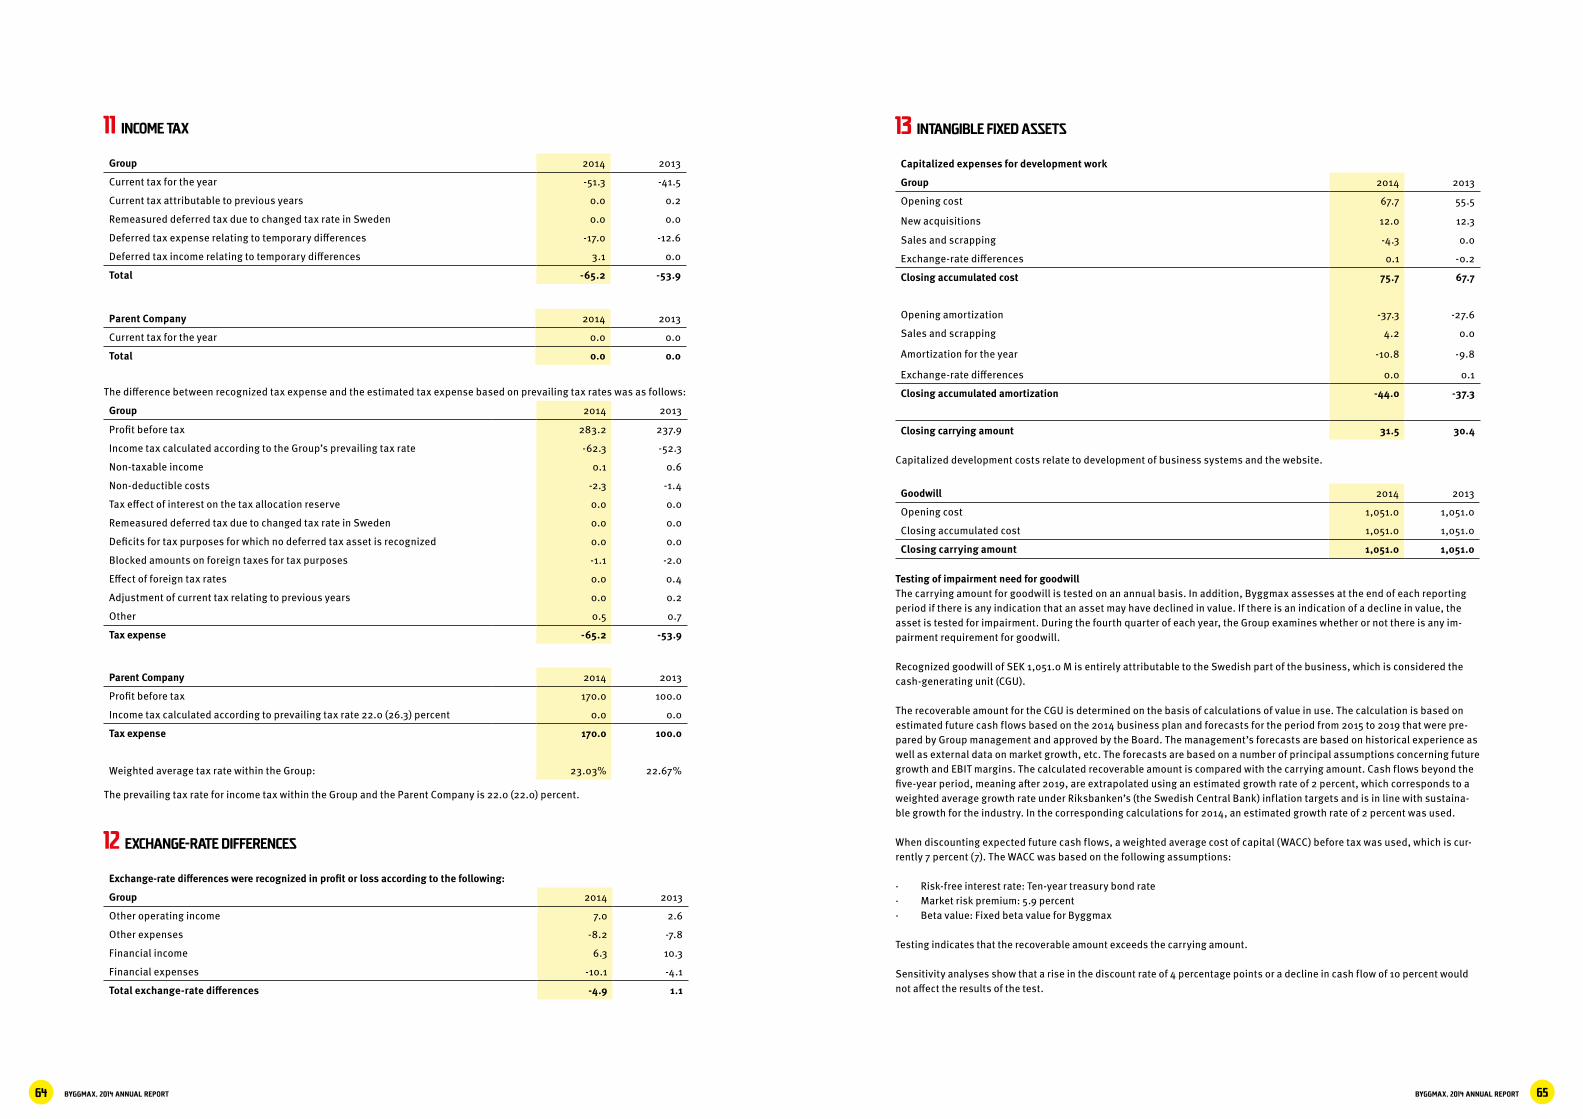
BYGGMAX, 2014 ANNUAL REPORT 65BYGGMAX, 2014 ANNUAL REPORT64
13 INTANGIBLE FIXED ASSETS
Capitalized expenses for development work
Group 2014 2013
Opening cost 67.7 55.5
New acquisitions 12.0 12.3
Sales and scrapping -4.3 0.0
Exchange-rate differences 0.1 -0.2
Closing accumulated cost 75.7 67.7
Opening amortization -37.3 -27.6
Sales and scrapping 4.2 0.0
Amortization for the year -10.8 -9.8
Exchange-rate differences 0.0 0.1
Closing accumulated amortization -44.0 -37.3
Closing carrying amount 31.5 30.4
Capitalized development costs relate to development of business systems and the website.
Goodwill 2014 2013
Opening cost 1,051.0 1,051.0
Closing accumulated cost 1,051.0 1,051.0
Closing carrying amount 1,051.0 1,051.0
Testing of impairment need for goodwillThe carrying amount for goodwill is tested on an annual basis. In addition, Byggmax assesses at the end of each reporting period if there is any indication that an asset may have declined in value. If there is an indication of a decline in value, the asset is tested for impairment. During the fourth quarter of each year, the Group examines whether or not there is any im-pairment requirement for goodwill.
Recognized goodwill of SEK 1,051.0 M is entirely attributable to the Swedish part of the business, which is considered the cash-generating unit (CGU).
The recoverable amount for the CGU is determined on the basis of calculations of value in use. The calculation is based on estimated future cash flows based on the 2014 business plan and forecasts for the period from 2015 to 2019 that were pre-pared by Group management and approved by the Board. The management’s forecasts are based on historical experience as well as external data on market growth, etc. The forecasts are based on a number of principal assumptions concerning future growth and EBIT margins. The calculated recoverable amount is compared with the carrying amount. Cash flows beyond the five-year period, meaning after 2019, are extrapolated using an estimated growth rate of 2 percent, which corresponds to a weighted average growth rate under Riksbanken’s (the Swedish Central Bank) inflation targets and is in line with sustaina-ble growth for the industry. In the corresponding calculations for 2014, an estimated growth rate of 2 percent was used.
When discounting expected future cash flows, a weighted average cost of capital (WACC) before tax was used, which is cur-rently 7 percent (7). The WACC was based on the following assumptions: · Risk-free interest rate: Ten-year treasury bond rate· Market risk premium: 5.9 percent· Beta value: Fixed beta value for Byggmax
Testing indicates that the recoverable amount exceeds the carrying amount.
Sensitivity analyses show that a rise in the discount rate of 4 percentage points or a decline in cash flow of 10 percent would not affect the results of the test.
11 INCOME TAX
Group 2014 2013
Current tax for the year -51.3 -41.5
Current tax attributable to previous years 0.0 0.2
Remeasured deferred tax due to changed tax rate in Sweden 0.0 0.0
Deferred tax expense relating to temporary differences -17.0 -12.6
Deferred tax income relating to temporary differences 3.1 0.0
Total -65.2 -53.9
Parent Company 2014 2013
Current tax for the year 0.0 0.0
Total 0.0 0.0
The difference between recognized tax expense and the estimated tax expense based on prevailing tax rates was as follows:
Group 2014 2013
Profit before tax 283.2 237.9
Income tax calculated according to the Group’s prevailing tax rate -62.3 -52.3
Non-taxable income 0.1 0.6
Non-deductible costs -2.3 -1.4
Tax effect of interest on the tax allocation reserve 0.0 0.0
Remeasured deferred tax due to changed tax rate in Sweden 0.0 0.0
Deficits for tax purposes for which no deferred tax asset is recognized 0.0 0.0
Blocked amounts on foreign taxes for tax purposes -1.1 -2.0
Effect of foreign tax rates 0.0 0.4
Adjustment of current tax relating to previous years 0.0 0.2
Other 0.5 0.7
Tax expense -65.2 -53.9
Parent Company 2014 2013
Profit before tax 170.0 100.0
Income tax calculated according to prevailing tax rate 22.0 (26.3) percent 0.0 0.0
Tax expense 170.0 100.0
Weighted average tax rate within the Group: 23.03% 22.67%
The prevailing tax rate for income tax within the Group and the Parent Company is 22.0 (22.0) percent.
12 EXCHANGE-RATE DIFFERENCES
Exchange-rate differences were recognized in profit or loss according to the following:
Group 2014 2013
Other operating income 7.0 2.6
Other expenses -8.2 -7.8
Financial income 6.3 10.3
Financial expenses -10.1 -4.1
Total exchange-rate differences -4.9 1.1
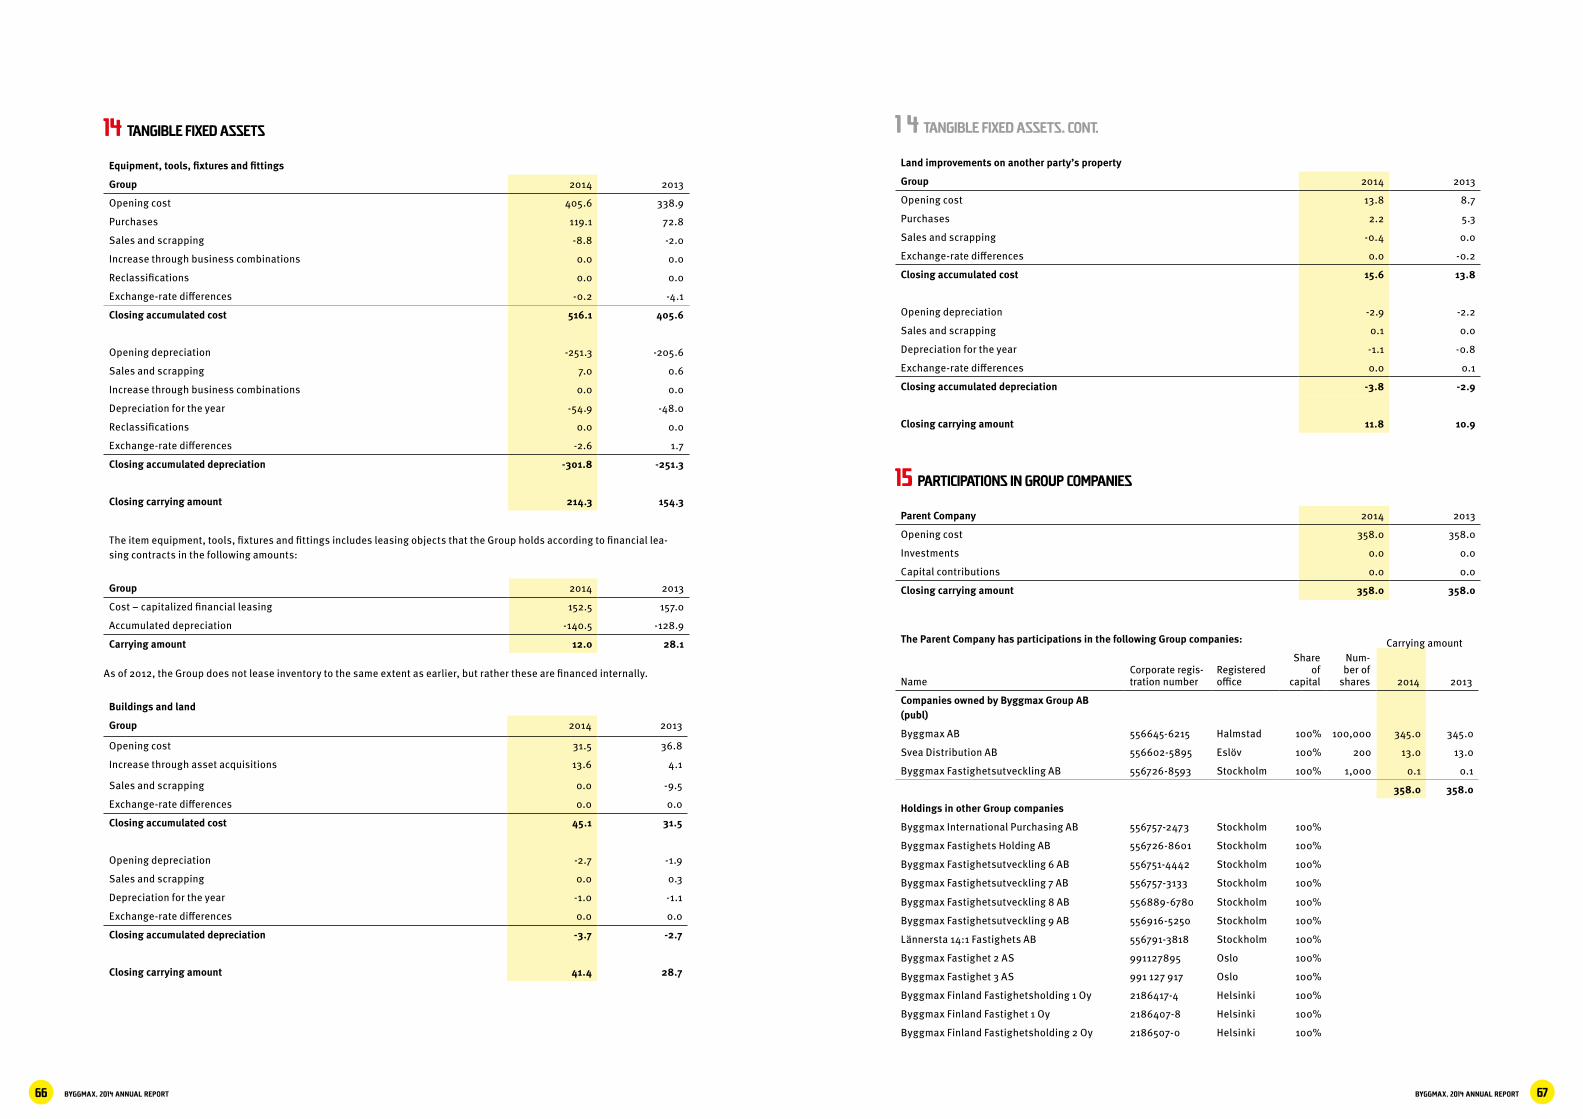
BYGGMAX, 2014 ANNUAL REPORT 67BYGGMAX, 2014 ANNUAL REPORT66
Land improvements on another party’s property
Group 2014 2013
Opening cost 13.8 8.7
Purchases 2.2 5.3
Sales and scrapping -0.4 0.0
Exchange-rate differences 0.0 -0.2
Closing accumulated cost 15.6 13.8
Opening depreciation -2.9 -2.2
Sales and scrapping 0.1 0.0
Depreciation for the year -1.1 -0.8
Exchange-rate differences 0.0 0.1
Closing accumulated depreciation -3.8 -2.9
Closing carrying amount 11.8 10.9
15 PARTICIPATIONS IN GROUP COMPANIES
Parent Company 2014 2013
Opening cost 358.0 358.0
Investments 0.0 0.0
Capital contributions 0.0 0.0
Closing carrying amount 358.0 358.0
The Parent Company has participations in the following Group companies: Carrying amount
NameCorporate regis-tration number
Registered office
Share of
capital
Num-ber of
shares 2014 2013
Companies owned by Byggmax Group AB (publ)
Byggmax AB 556645-6215 Halmstad 100% 100,000 345.0 345.0
Svea Distribution AB 556602-5895 Eslöv 100% 200 13.0 13.0
Byggmax Fastighetsutveckling AB 556726-8593 Stockholm 100% 1,000 0.1 0.1
358.0 358.0
Holdings in other Group companies
Byggmax International Purchasing AB 556757-2473 Stockholm 100%
Byggmax Fastighets Holding AB 556726-8601 Stockholm 100%
Byggmax Fastighetsutveckling 6 AB 556751-4442 Stockholm 100%
Byggmax Fastighetsutveckling 7 AB 556757-3133 Stockholm 100%
Byggmax Fastighetsutveckling 8 AB 556889-6780 Stockholm 100%
Byggmax Fastighetsutveckling 9 AB 556916-5250 Stockholm 100%
Lännersta 14:1 Fastighets AB 556791-3818 Stockholm 100%
Byggmax Fastighet 2 AS 991127895 Oslo 100%
Byggmax Fastighet 3 AS 991 127 917 Oslo 100%
Byggmax Finland Fastighetsholding 1 Oy 2186417-4 Helsinki 100%
Byggmax Finland Fastighet 1 Oy 2186407-8 Helsinki 100%
Byggmax Finland Fastighetsholding 2 Oy 2186507-0 Helsinki 100%
14 Tangible fixed assets
Equipment, tools, fixtures and fittings
Group 2014 2013
Opening cost 405.6 338.9
Purchases 119.1 72.8
Sales and scrapping -8.8 -2.0
Increase through business combinations 0.0 0.0
Reclassifications 0.0 0.0
Exchange-rate differences -0.2 -4.1
Closing accumulated cost 516.1 405.6
Opening depreciation -251.3 -205.6
Sales and scrapping 7.0 0.6
Increase through business combinations 0.0 0.0
Depreciation for the year -54.9 -48.0
Reclassifications 0.0 0.0
Exchange-rate differences -2.6 1.7
Closing accumulated depreciation -301.8 -251.3
Closing carrying amount 214.3 154.3
The item equipment, tools, fixtures and fittings includes leasing objects that the Group holds according to financial lea-sing contracts in the following amounts:
Group 2014 2013
Cost – capitalized financial leasing 152.5 157.0
Accumulated depreciation -140.5 -128.9
Carrying amount 12.0 28.1
As of 2012, the Group does not lease inventory to the same extent as earlier, but rather these are financed internally.
Buildings and land
Group 2014 2013
Opening cost 31.5 36.8
Increase through asset acquisitions 13.6 4.1
Sales and scrapping 0.0 -9.5
Exchange-rate differences 0.0 0.0
Closing accumulated cost 45.1 31.5
Opening depreciation -2.7 -1.9
Sales and scrapping 0.0 0.3
Depreciation for the year -1.0 -1.1
Exchange-rate differences 0.0 0.0
Closing accumulated depreciation -3.7 -2.7
Closing carrying amount 41.4 28.7
1 4 TANGIBLE FIXED ASSETS. CONT.
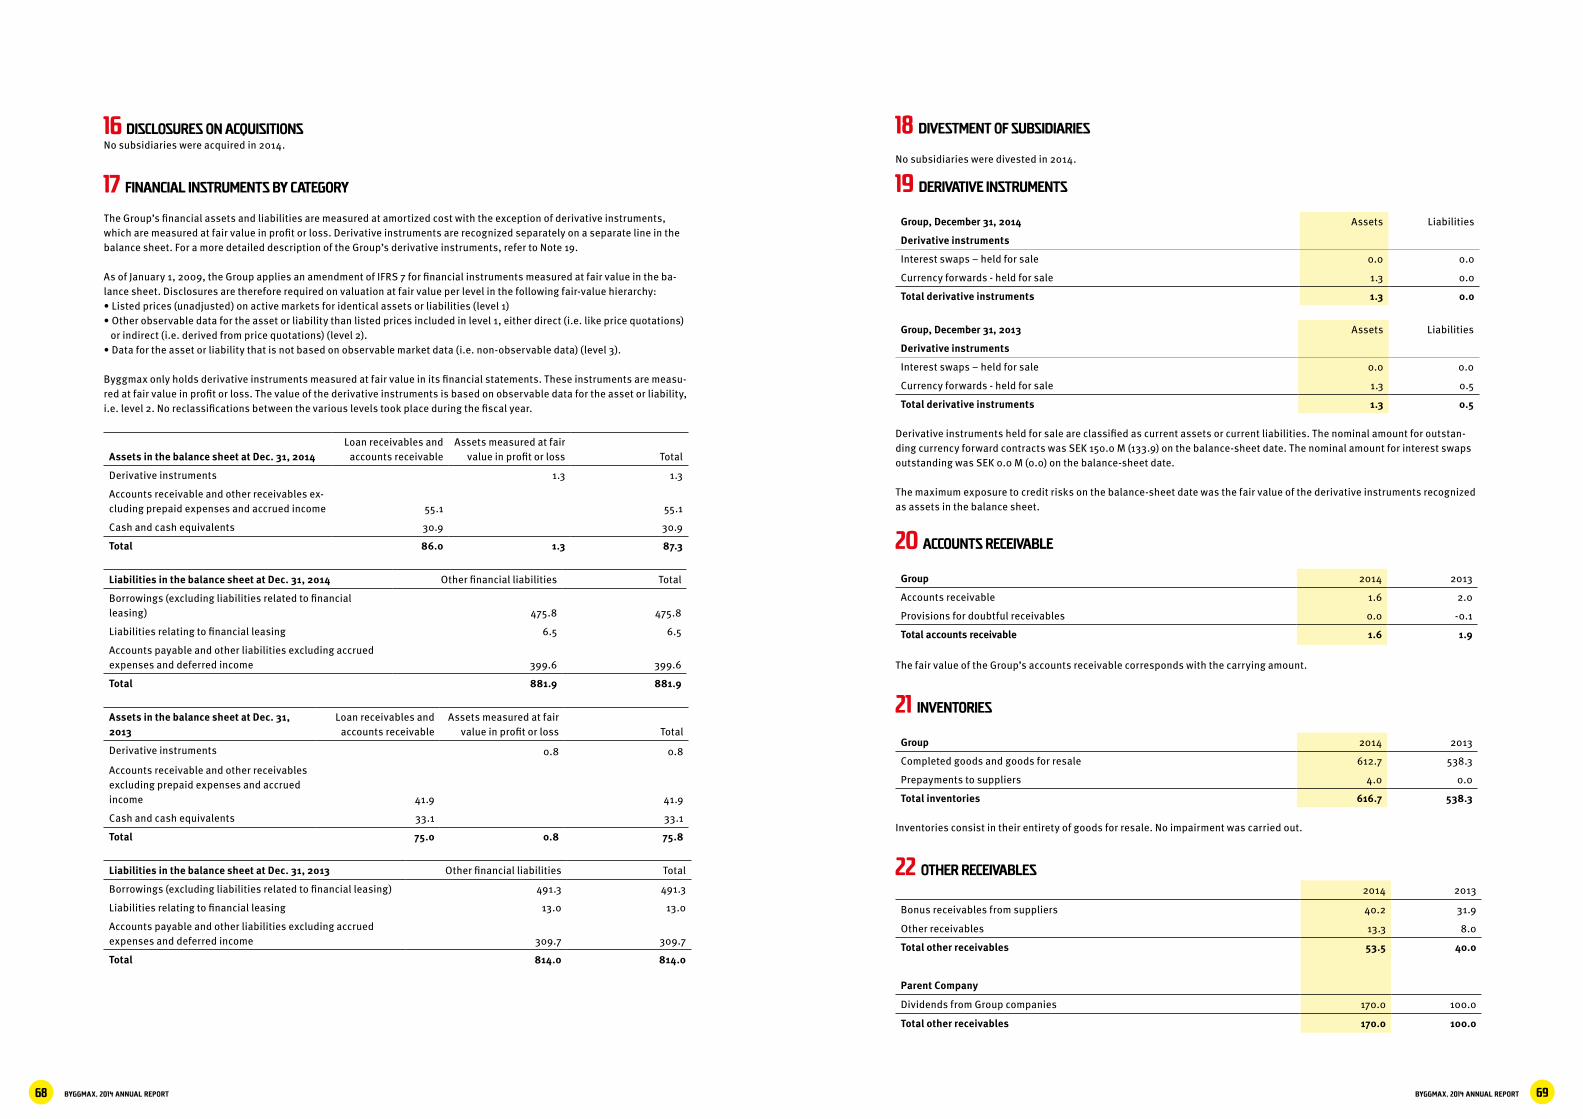
BYGGMAX, 2014 ANNUAL REPORT 69BYGGMAX, 2014 ANNUAL REPORT68
16 DISCLOSURES ON ACQUISITIONSNo subsidiaries were acquired in 2014.
17 FINANCIAL INSTRUMENTS BY CATEGORY
The Group’s financial assets and liabilities are measured at amortized cost with the exception of derivative instruments, which are measured at fair value in profit or loss. Derivative instruments are recognized separately on a separate line in the balance sheet. For a more detailed description of the Group’s derivative instruments, refer to Note 19.
As of January 1, 2009, the Group applies an amendment of IFRS 7 for financial instruments measured at fair value in the ba-lance sheet. Disclosures are therefore required on valuation at fair value per level in the following fair-value hierarchy:• Listed prices (unadjusted) on active markets for identical assets or liabilities (level 1)• Other observable data for the asset or liability than listed prices included in level 1, either direct (i.e. like price quotations) or indirect (i.e. derived from price quotations) (level 2).• Data for the asset or liability that is not based on observable market data (i.e. non-observable data) (level 3).
Byggmax only holds derivative instruments measured at fair value in its financial statements. These instruments are measu-red at fair value in profit or loss. The value of the derivative instruments is based on observable data for the asset or liability, i.e. level 2. No reclassifications between the various levels took place during the fiscal year.
Assets in the balance sheet at Dec. 31, 2014Loan receivables and
accounts receivableAssets measured at fair
value in profit or loss Total
Derivative instruments 1.3 1.3
Accounts receivable and other receivables ex-cluding prepaid expenses and accrued income 55.1 55.1
Cash and cash equivalents 30.9 30.9
Total 86.0 1.3 87.3
Liabilities in the balance sheet at Dec. 31, 2014 Other financial liabilities Total
Borrowings (excluding liabilities related to financial leasing) 475.8 475.8
Liabilities relating to financial leasing 6.5 6.5
Accounts payable and other liabilities excluding accrued expenses and deferred income 399.6 399.6
Total 881.9 881.9
Assets in the balance sheet at Dec. 31, 2013
Loan receivables and accounts receivable
Assets measured at fair value in profit or loss Total
Derivative instruments 0.8 0.8
Accounts receivable and other receivables excluding prepaid expenses and accrued income 41.9 41.9
Cash and cash equivalents 33.1 33.1
Total 75.0 0.8 75.8
Liabilities in the balance sheet at Dec. 31, 2013 Other financial liabilities Total
Borrowings (excluding liabilities related to financial leasing) 491.3 491.3
Liabilities relating to financial leasing 13.0 13.0
Accounts payable and other liabilities excluding accrued expenses and deferred income 309.7 309.7
Total 814.0 814.0
18 DIVESTMENT OF SUBSIDIARIES
No subsidiaries were divested in 2014.
19 Derivative instruments
Group, December 31, 2014 Assets Liabilities
Derivative instruments
Interest swaps – held for sale 0.0 0.0
Currency forwards - held for sale 1.3 0.0
Total derivative instruments 1.3 0.0
Group, December 31, 2013 Assets Liabilities
Derivative instruments
Interest swaps – held for sale 0.0 0.0
Currency forwards - held for sale 1.3 0.5
Total derivative instruments 1.3 0.5
Derivative instruments held for sale are classified as current assets or current liabilities. The nominal amount for outstan-ding currency forward contracts was SEK 150.0 M (133.9) on the balance-sheet date. The nominal amount for interest swaps outstanding was SEK 0.0 M (0.0) on the balance-sheet date.
The maximum exposure to credit risks on the balance-sheet date was the fair value of the derivative instruments recognized as assets in the balance sheet.
20 ACCOUNTS RECEIVABLE
Group 2014 2013
Accounts receivable 1.6 2.0
Provisions for doubtful receivables 0.0 -0.1
Total accounts receivable 1.6 1.9
The fair value of the Group’s accounts receivable corresponds with the carrying amount.
21 INVENTORIES
Group 2014 2013
Completed goods and goods for resale 612.7 538.3
Prepayments to suppliers 4.0 0.0
Total inventories 616.7 538.3
Inventories consist in their entirety of goods for resale. No impairment was carried out.
22 OTHER RECEIVABLES2014 2013
Bonus receivables from suppliers 40.2 31.9
Other receivables 13.3 8.0
Total other receivables 53.5 40.0
Parent Company
Dividends from Group companies 170.0 100.0
Total other receivables 170.0 100.0

BYGGMAX, 2014 ANNUAL REPORT 71BYGGMAX, 2014 ANNUAL REPORT70
22 OTHER RECEIVABLES, CONT.
Most bonus receivables are in SEK. As of the balance-sheet date, December 31, 2014, no other receivables were considered doubtful. In respect of existing bonus receivables, the majority of the items have a corresponding entry in accounts payable. The fair value of the Group’s other receivables corresponds to the carrying amount. Dividends from Group companies pertain to receivables for anticipated dividends.
23 PREPAID EXPENSES AND ACCRUED INCOME
Group 2014 2013
Prepaid rent 33.5 22.8
Prepaid leasing fees 0.3 0.5
Accrued interest income 0.0 0.0
Other items 6.2 4.8
Total prepaid expenses and accrued income 40.0 28.2
24 CASH AND CASH EQUIVALENTS
Cash and cash equivalents in the balance sheet and the cash-flow statement include the following:
Group 2014 2013
Balance sheet
Cash and bank balances 22.5 24.7
Blocked funds 8.4 8.4
Total cash and cash equivalents 30.9 33.1
Cash-flow statement
Cash and bank balances 22.5 24.7
Short-term investments 0.0 0.0
Total cash and cash equivalents 22.5 24.7
Blocked funds refer to rent deposits of SEK 1.9 M (1.9) and a customs credit of SEK 6.5 M (6.5).
25 SHARE CAPITAL AND OTHER CAPITAL CONTRIBUTIONS
The specification of changes in shareholders’ equity is presented in the report Changes in shareholders’ equity directly after the balance sheet.
GroupNo. of shares
(000s) Share capital
Other capital con-
tributions Total
At December 31, 2014 60.7 20.2 441.0 461.3
At December 31, 2013 60.7 20.2 441.0 461.3
The shares have a quotient value of SEK 0.33 per share (SEK 0.33 per share). Each share represents one vote. All registered shares were paid in full on the balance-sheet date.
26 RESERVES
The category Reserves within shareholders’ equity consists in its entirety of translation differences arising in the translation of foreign subsidiaries
27 BORROWING
Group 2014 2013
Long-term
Liabilities related to financial leasing 1.8 5.8
Total 1.8 5.8
Short-term 2014 2013
Liabilities to credit institutions 175.0 100.0
Overdraft facilities 300.8 391.3
Liabilities related to financial leasing 4.7 13.0
Total 480.5 504.3
Total borrowing 482.3 510.1
Parent Company 2014 2013
Liabilities to credit institutions 460.7 498.4
Overdraft facility 175.0 100.0
Total 635.7 598.4
Total borrowing 635.7 598.4
All borrowing within the Group is in SEK. All external loans have an interest period of three months, meaning that the car-rying amount closely corresponds to fair value. There are pledged assets for these loans. See Note 32.
The Group has the following unutilized credit facilities:
Group 2014 2013
Overdraft facility 99.2 78.7
Total 99.2 78.7
Of the above available overdraft facilities, SEK 6.5 M is a customs credit.
Financial leasing
Gross liabilities for financial leasing
Group 2014 2013
Within one year 5.1 13.3
Later than one year but within five years 2.1 6.2
Total 7.2 19.5
Future financial expenses for financial leasing -0.7 -0.7
Present value of liabilities related to financial leasing 6.5 18.8
In the balance-sheet item borrowing from credit institutions, financial leasing is included as follows:
Group 2014 2013
Within one year 4.7 13.0
Later than one year but within five years 1.8 5.8
Later than five years 0.0 0.0
Total 6.5 18.8
See also Note 33, Obligations.
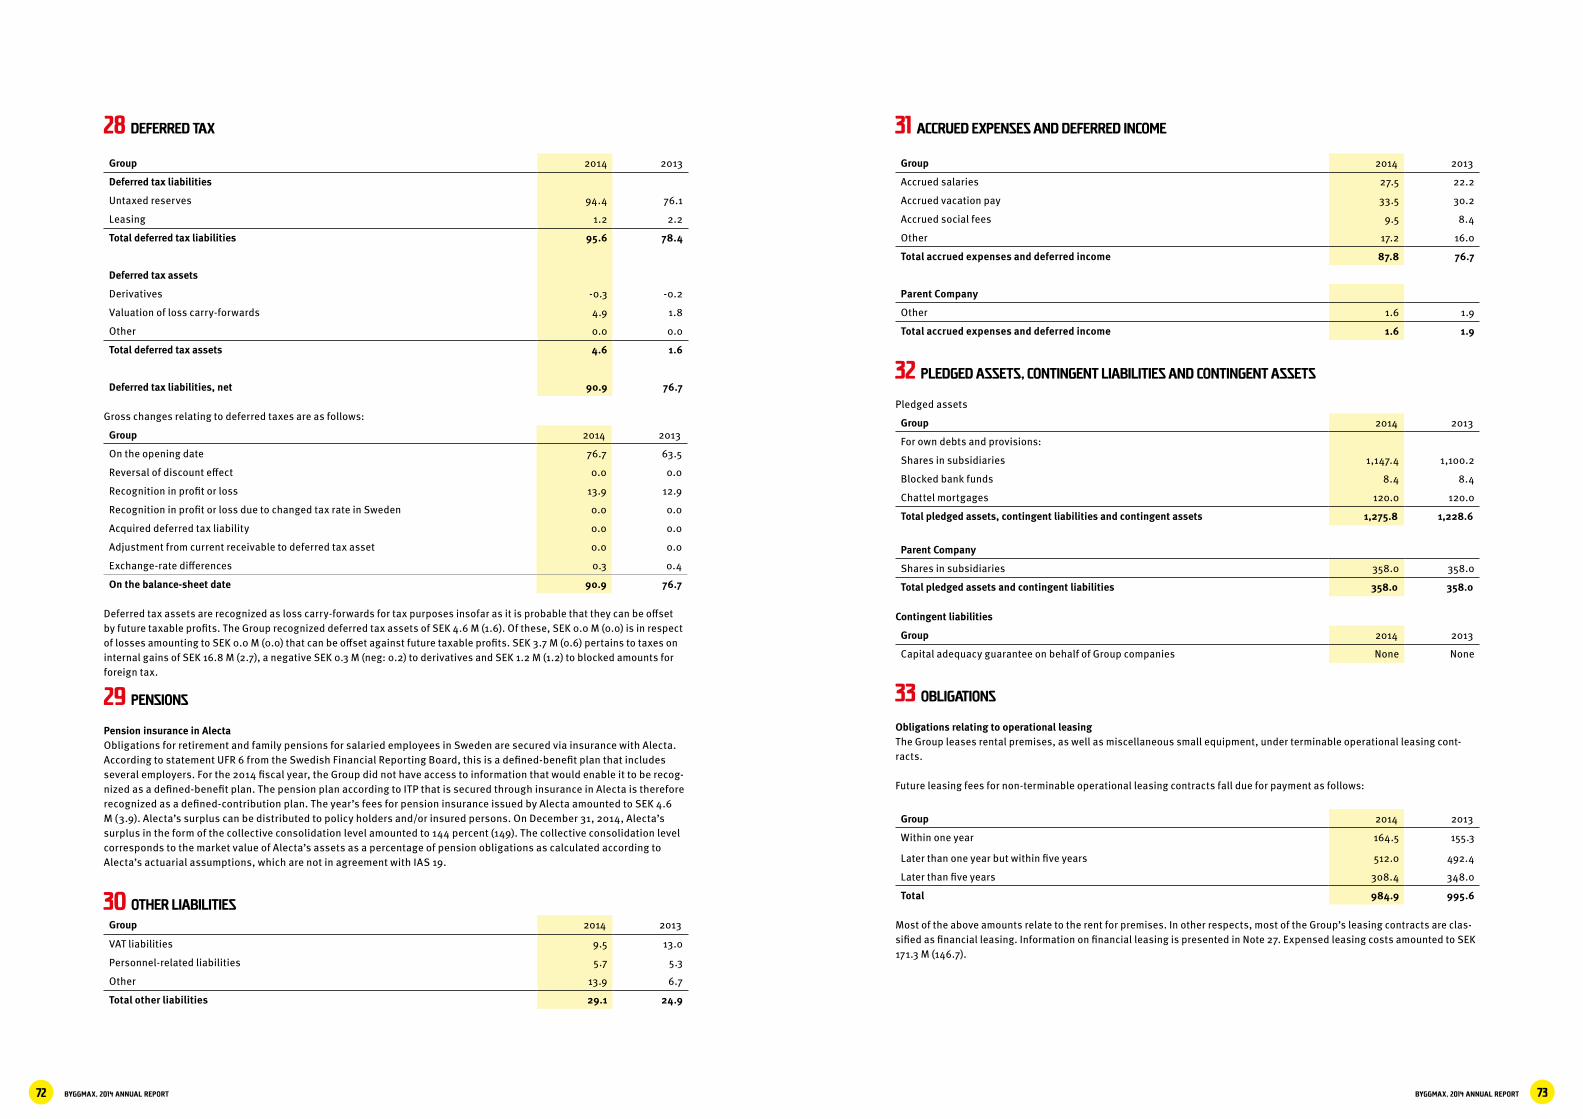
BYGGMAX, 2014 ANNUAL REPORT 73BYGGMAX, 2014 ANNUAL REPORT72
28 DEFERRED TAX
Group 2014 2013
Deferred tax liabilities
Untaxed reserves 94.4 76.1
Leasing 1.2 2.2
Total deferred tax liabilities 95.6 78.4
Deferred tax assets
Derivatives -0.3 -0.2
Valuation of loss carry-forwards 4.9 1.8
Other 0.0 0.0
Total deferred tax assets 4.6 1.6
Deferred tax liabilities, net 90.9 76.7
Gross changes relating to deferred taxes are as follows:
Group 2014 2013
On the opening date 76.7 63.5
Reversal of discount effect 0.0 0.0
Recognition in profit or loss 13.9 12.9
Recognition in profit or loss due to changed tax rate in Sweden 0.0 0.0
Acquired deferred tax liability 0.0 0.0
Adjustment from current receivable to deferred tax asset 0.0 0.0
Exchange-rate differences 0.3 0.4
On the balance-sheet date 90.9 76.7
Deferred tax assets are recognized as loss carry-forwards for tax purposes insofar as it is probable that they can be offset by future taxable profits. The Group recognized deferred tax assets of SEK 4.6 M (1.6). Of these, SEK 0.0 M (0.0) is in respect of losses amounting to SEK 0.0 M (0.0) that can be offset against future taxable profits. SEK 3.7 M (0.6) pertains to taxes on internal gains of SEK 16.8 M (2.7), a negative SEK 0.3 M (neg: 0.2) to derivatives and SEK 1.2 M (1.2) to blocked amounts for foreign tax.
29 PENSIONS
Pension insurance in AlectaObligations for retirement and family pensions for salaried employees in Sweden are secured via insurance with Alecta. According to statement UFR 6 from the Swedish Financial Reporting Board, this is a defined-benefit plan that includes several employers. For the 2014 fiscal year, the Group did not have access to information that would enable it to be recog-nized as a defined-benefit plan. The pension plan according to ITP that is secured through insurance in Alecta is therefore recognized as a defined-contribution plan. The year’s fees for pension insurance issued by Alecta amounted to SEK 4.6 M (3.9). Alecta’s surplus can be distributed to policy holders and/or insured persons. On December 31, 2014, Alecta’s surplus in the form of the collective consolidation level amounted to 144 percent (149). The collective consolidation level corresponds to the market value of Alecta’s assets as a percentage of pension obligations as calculated according to Alecta’s actuarial assumptions, which are not in agreement with IAS 19.
30 OTHER LIABILITIESGroup 2014 2013
VAT liabilities 9.5 13.0
Personnel-related liabilities 5.7 5.3
Other 13.9 6.7
Total other liabilities 29.1 24.9
31 ACCRUED EXPENSES AND DEFERRED INCOME
Group 2014 2013
Accrued salaries 27.5 22.2
Accrued vacation pay 33.5 30.2
Accrued social fees 9.5 8.4
Other 17.2 16.0
Total accrued expenses and deferred income 87.8 76.7
Parent Company
Other 1.6 1.9
Total accrued expenses and deferred income 1.6 1.9
32 PLEDGED ASSETS, CONTINGENT LIABILITIES AND CONTINGENT ASSETS
Pledged assets
Group 2014 2013
For own debts and provisions:
Shares in subsidiaries 1,147.4 1,100.2
Blocked bank funds 8.4 8.4
Chattel mortgages 120.0 120.0
Total pledged assets, contingent liabilities and contingent assets 1,275.8 1,228.6
Parent Company
Shares in subsidiaries 358.0 358.0
Total pledged assets and contingent liabilities 358.0 358.0
Contingent liabilities
Group 2014 2013
Capital adequacy guarantee on behalf of Group companies None None
33 OBLIGATIONS
Obligations relating to operational leasingThe Group leases rental premises, as well as miscellaneous small equipment, under terminable operational leasing cont-racts.
Future leasing fees for non-terminable operational leasing contracts fall due for payment as follows:
Group 2014 2013
Within one year 164.5 155.3
Later than one year but within five years 512.0 492.4
Later than five years 308.4 348.0
Total 984.9 995.6
Most of the above amounts relate to the rent for premises. In other respects, most of the Group’s leasing contracts are clas-sified as financial leasing. Information on financial leasing is presented in Note 27. Expensed leasing costs amounted to SEK 171.3 M (146.7).
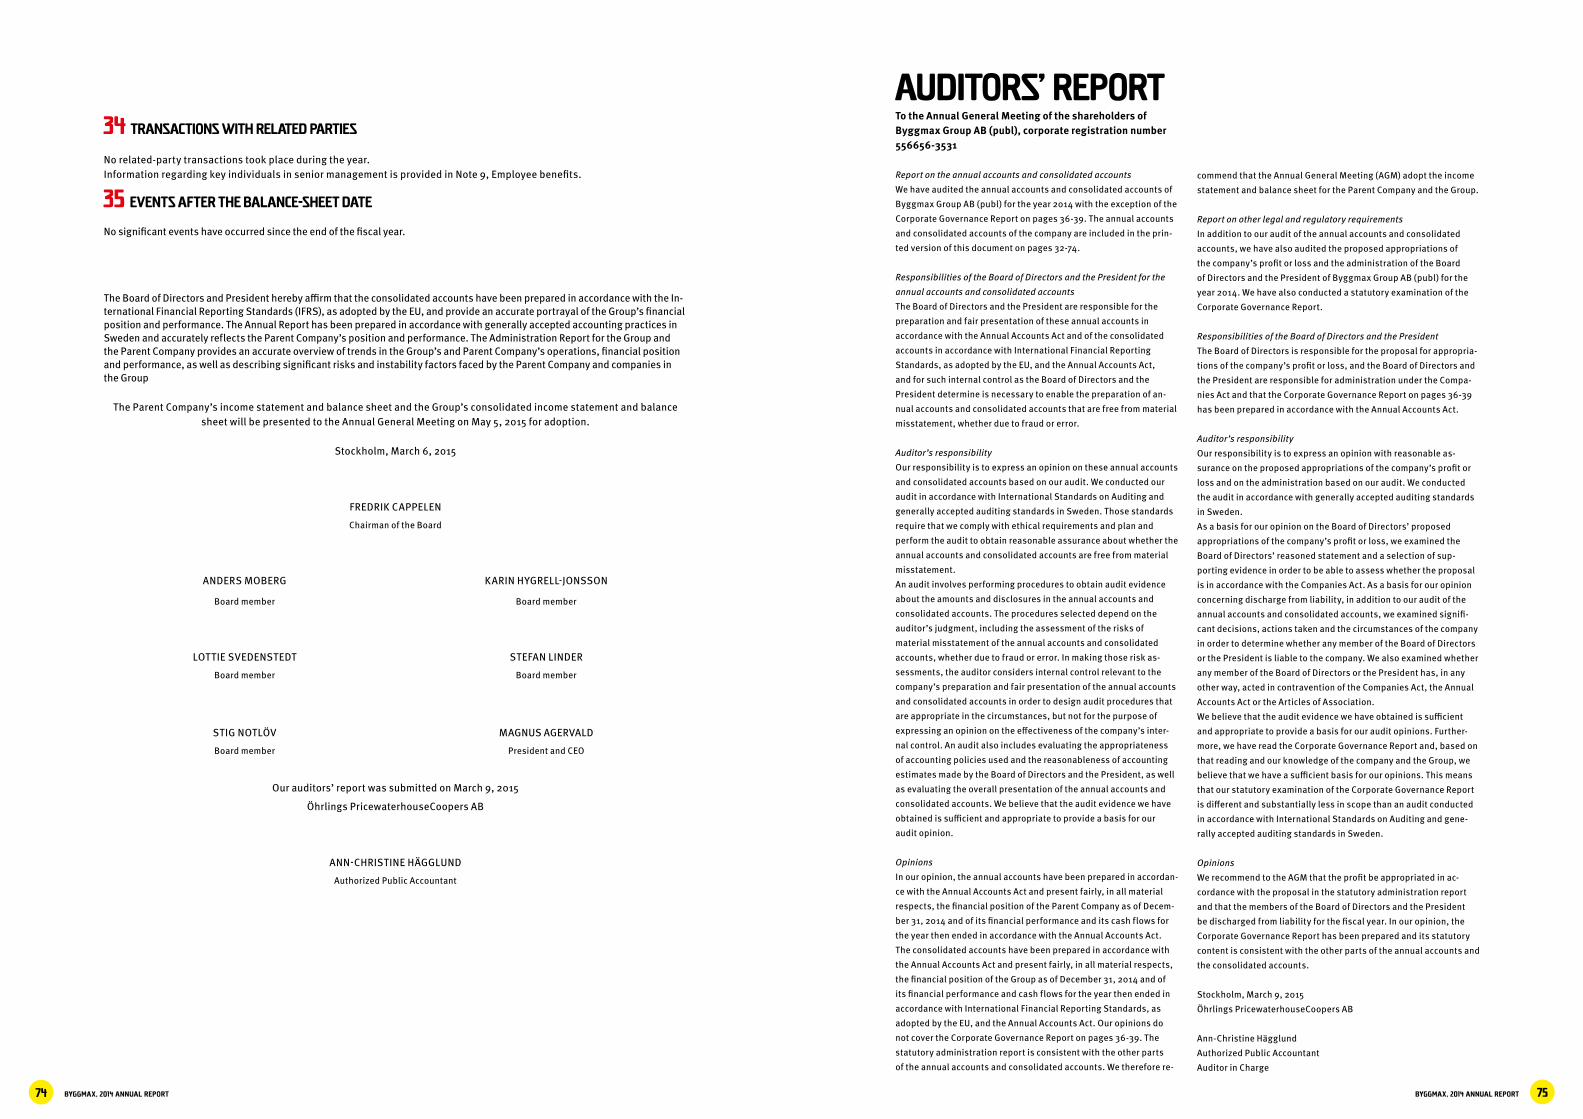
BYGGMAX, 2014 ANNUAL REPORT 75BYGGMAX, 2014 ANNUAL REPORT74
34 TRANSACTIONS WITH RELATED PARTIES
No related-party transactions took place during the year.Information regarding key individuals in senior management is provided in Note 9, Employee benefits.
35 EVENTS AFTER THE BALANCE-SHEET DATE
No significant events have occurred since the end of the fiscal year.
The Board of Directors and President hereby affirm that the consolidated accounts have been prepared in accordance with the In-ternational Financial Reporting Standards (IFRS), as adopted by the EU, and provide an accurate portrayal of the Group’s financial position and performance. The Annual Report has been prepared in accordance with generally accepted accounting practices in Sweden and accurately reflects the Parent Company’s position and performance. The Administration Report for the Group and the Parent Company provides an accurate overview of trends in the Group’s and Parent Company’s operations, financial position and performance, as well as describing significant risks and instability factors faced by the Parent Company and companies in the Group
The Parent Company’s income statement and balance sheet and the Group’s consolidated income statement and balance sheet will be presented to the Annual General Meeting on May 5, 2015 for adoption.
Stockholm, March 6, 2015
FREDRIK CAPPELEN
Chairman of the Board
ANDERS MOBERG KARIN HYGRELL-JONSSON
Board member Board member
LOTTIE SVEDENSTEDT STEFAN LINDER
Board member Board member
STIG NOTLÖV MAGNUS AGERVALD
Board member President and CEO
Our auditors’ report was submitted on March 9, 2015
Öhrlings PricewaterhouseCoopers AB
ANN-CHRISTINE HÄGGLUND
Authorized Public Accountant
AUDITORS’ REPORTTo the Annual General Meeting of the shareholders of Byggmax Group AB (publ), corporate registration number 556656-3531
Report on the annual accounts and consolidated accounts
We have audited the annual accounts and consolidated accounts of
Byggmax Group AB (publ) for the year 2014 with the exception of the
Corporate Governance Report on pages 36-39. The annual accounts
and consolidated accounts of the company are included in the prin-
ted version of this document on pages 32-74.
Responsibilities of the Board of Directors and the President for the
annual accounts and consolidated accounts
The Board of Directors and the President are responsible for the
preparation and fair presentation of these annual accounts in
accordance with the Annual Accounts Act and of the consolidated
accounts in accordance with International Financial Reporting
Standards, as adopted by the EU, and the Annual Accounts Act,
and for such internal control as the Board of Directors and the
President determine is necessary to enable the preparation of an-
nual accounts and consolidated accounts that are free from material
misstatement, whether due to fraud or error.
Auditor’s responsibility
Our responsibility is to express an opinion on these annual accounts
and consolidated accounts based on our audit. We conducted our
audit in accordance with International Standards on Auditing and
generally accepted auditing standards in Sweden. Those standards
require that we comply with ethical requirements and plan and
perform the audit to obtain reasonable assurance about whether the
annual accounts and consolidated accounts are free from material
misstatement.
An audit involves performing procedures to obtain audit evidence
about the amounts and disclosures in the annual accounts and
consolidated accounts. The procedures selected depend on the
auditor’s judgment, including the assessment of the risks of
material misstatement of the annual accounts and consolidated
accounts, whether due to fraud or error. In making those risk as-
sessments, the auditor considers internal control relevant to the
company’s preparation and fair presentation of the annual accounts
and consolidated accounts in order to design audit procedures that
are appropriate in the circumstances, but not for the purpose of
expressing an opinion on the effectiveness of the company’s inter-
nal control. An audit also includes evaluating the appropriateness
of accounting policies used and the reasonableness of accounting
estimates made by the Board of Directors and the President, as well
as evaluating the overall presentation of the annual accounts and
consolidated accounts. We believe that the audit evidence we have
obtained is sufficient and appropriate to provide a basis for our
audit opinion.
Opinions
In our opinion, the annual accounts have been prepared in accordan-
ce with the Annual Accounts Act and present fairly, in all material
respects, the financial position of the Parent Company as of Decem-
ber 31, 2014 and of its financial performance and its cash flows for
the year then ended in accordance with the Annual Accounts Act.
The consolidated accounts have been prepared in accordance with
the Annual Accounts Act and present fairly, in all material respects,
the financial position of the Group as of December 31, 2014 and of
its financial performance and cash flows for the year then ended in
accordance with International Financial Reporting Standards, as
adopted by the EU, and the Annual Accounts Act. Our opinions do
not cover the Corporate Governance Report on pages 36-39. The
statutory administration report is consistent with the other parts
of the annual accounts and consolidated accounts. We therefore re-
commend that the Annual General Meeting (AGM) adopt the income
statement and balance sheet for the Parent Company and the Group.
Report on other legal and regulatory requirements
In addition to our audit of the annual accounts and consolidated
accounts, we have also audited the proposed appropriations of
the company’s profit or loss and the administration of the Board
of Directors and the President of Byggmax Group AB (publ) for the
year 2014. We have also conducted a statutory examination of the
Corporate Governance Report.
Responsibilities of the Board of Directors and the President
The Board of Directors is responsible for the proposal for appropria-
tions of the company’s profit or loss, and the Board of Directors and
the President are responsible for administration under the Compa-
nies Act and that the Corporate Governance Report on pages 36-39
has been prepared in accordance with the Annual Accounts Act.
Auditor’s responsibility
Our responsibility is to express an opinion with reasonable as-
surance on the proposed appropriations of the company’s profit or
loss and on the administration based on our audit. We conducted
the audit in accordance with generally accepted auditing standards
in Sweden.
As a basis for our opinion on the Board of Directors’ proposed
appropriations of the company’s profit or loss, we examined the
Board of Directors’ reasoned statement and a selection of sup-
porting evidence in order to be able to assess whether the proposal
is in accordance with the Companies Act. As a basis for our opinion
concerning discharge from liability, in addition to our audit of the
annual accounts and consolidated accounts, we examined signifi-
cant decisions, actions taken and the circumstances of the company
in order to determine whether any member of the Board of Directors
or the President is liable to the company. We also examined whether
any member of the Board of Directors or the President has, in any
other way, acted in contravention of the Companies Act, the Annual
Accounts Act or the Articles of Association.
We believe that the audit evidence we have obtained is sufficient
and appropriate to provide a basis for our audit opinions. Further-
more, we have read the Corporate Governance Report and, based on
that reading and our knowledge of the company and the Group, we
believe that we have a sufficient basis for our opinions. This means
that our statutory examination of the Corporate Governance Report
is different and substantially less in scope than an audit conducted
in accordance with International Standards on Auditing and gene-
rally accepted auditing standards in Sweden.
Opinions
We recommend to the AGM that the profit be appropriated in ac-
cordance with the proposal in the statutory administration report
and that the members of the Board of Directors and the President
be discharged from liability for the fiscal year. In our opinion, the
Corporate Governance Report has been prepared and its statutory
content is consistent with the other parts of the annual accounts and
the consolidated accounts.
Stockholm, March 9, 2015
Öhrlings PricewaterhouseCoopers AB
Ann-Christine Hägglund
Authorized Public Accountant
Auditor in Charge
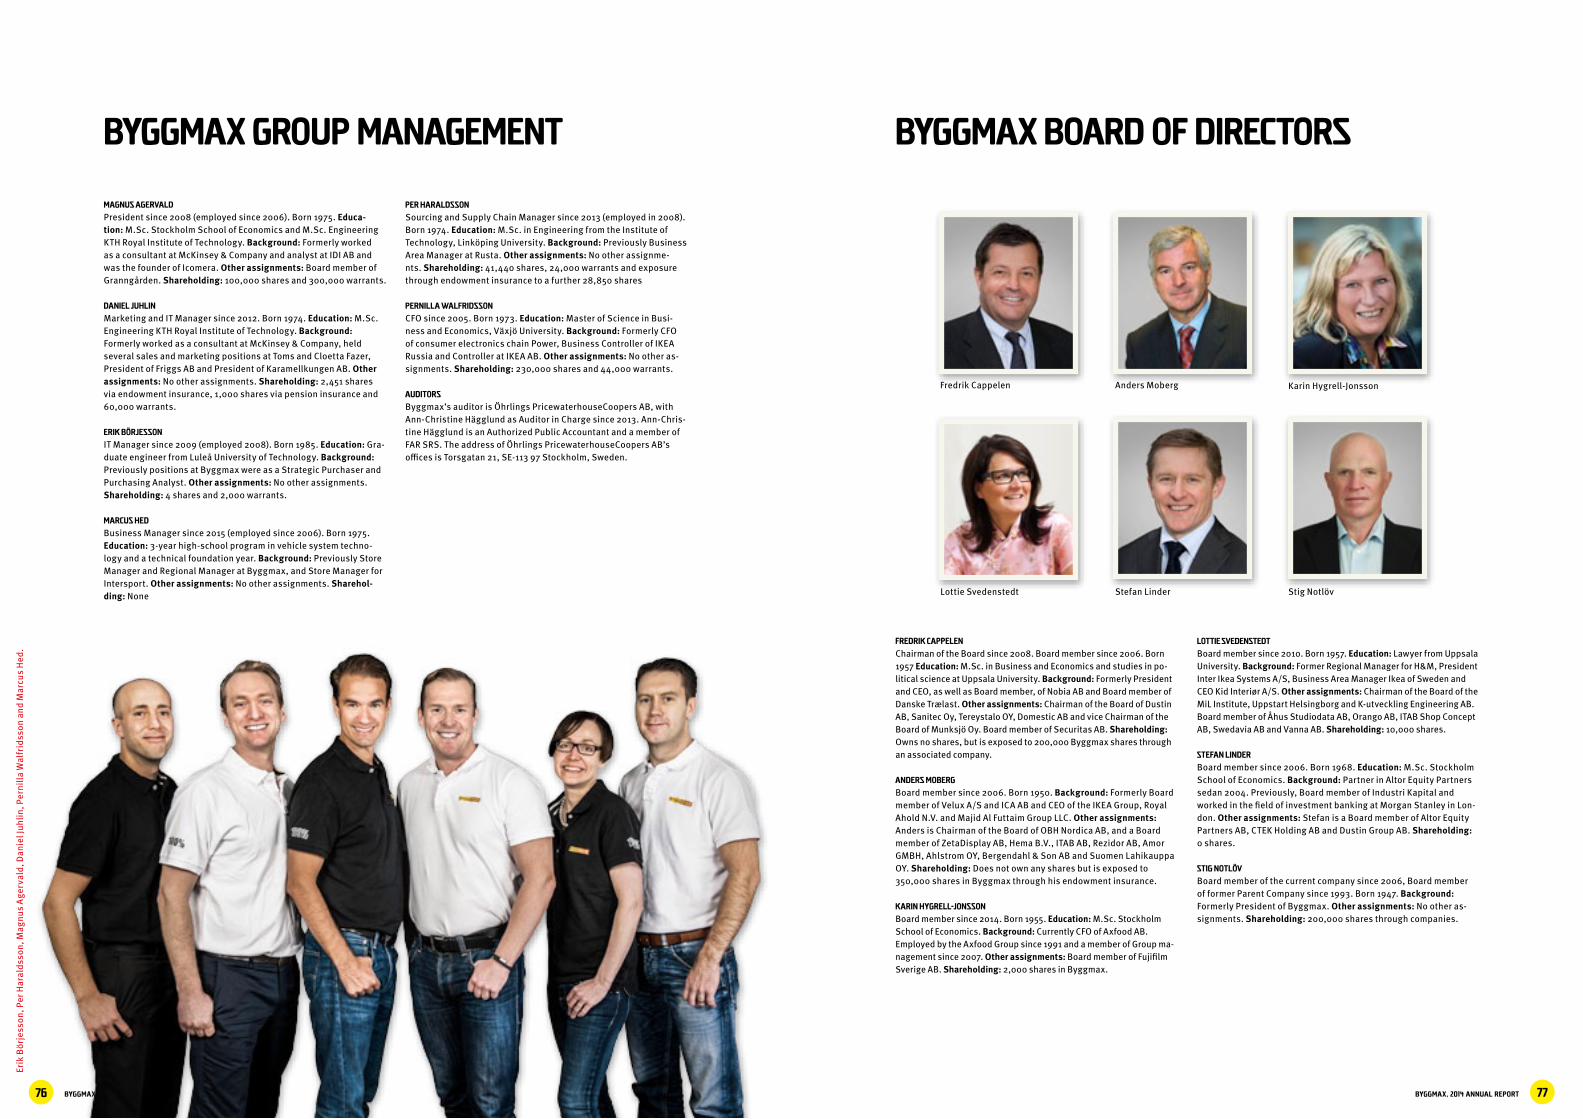
BYGGMAX, 2014 ANNUAL REPORT 77BYGGMAX, 2014 ANNUAL REPORT76
BYGGMAX BOARD OF DIRECTORS
Anders MobergFredrik Cappelen Karin Hygrell-Jonsson
Stefan LinderLottie Svedenstedt Stig Notlöv
Chairman of the Board since 2008. Board member since 2006. Born 1957 Education: M.Sc. in Business and Economics and studies in po-litical science at Uppsala University. Background: Formerly President and CEO, as well as Board member, of Nobia AB and Board member of Danske Trælast. Other assignments: Chairman of the Board of Dustin AB, Sanitec Oy, Tereystalo OY, Domestic AB and vice Chairman of the Board of Munksjö Oy. Board member of Securitas AB. Shareholding: Owns no shares, but is exposed to 200,000 Byggmax shares through an associated company.
ANDERS MOBERG
Board member since 2006. Born 1950. Background: Formerly Board member of Velux A/S and ICA AB and CEO of the IKEA Group, Royal Ahold N.V. and Majid Al Futtaim Group LLC. Other assignments: Anders is Chairman of the Board of OBH Nordica AB, and a Board member of ZetaDisplay AB, Hema B.V., ITAB AB, Rezidor AB, Amor GMBH, Ahlstrom OY, Bergendahl & Son AB and Suomen Lahikauppa OY. Shareholding: Does not own any shares but is exposed to 350,000 shares in Byggmax through his endowment insurance.
karin Hygrell-jonsson
Board member since 2014. Born 1955. Education: M.Sc. Stockholm School of Economics. Background: Currently CFO of Axfood AB. Employed by the Axfood Group since 1991 and a member of Group ma-nagement since 2007. Other assignments: Board member of Fujifilm Sverige AB. Shareholding: 2,000 shares in Byggmax.
Lottie Svedenstedt
Board member since 2010. Born 1957. Education: Lawyer from Uppsala University. Background: Former Regional Manager for H&M, President Inter Ikea Systems A/S, Business Area Manager Ikea of Sweden and CEO Kid Interiør A/S. Other assignments: Chairman of the Board of the MiL Institute, Uppstart Helsingborg and K-utveckling Engineering AB. Board member of Åhus Studiodata AB, Orango AB, ITAB Shop Concept AB, Swedavia AB and Vanna AB. Shareholding: 10,000 shares.
STEFAN LINDER
Board member since 2006. Born 1968. Education: M.Sc. Stockholm School of Economics. Background: Partner in Altor Equity Partners sedan 2004. Previously, Board member of Industri Kapital and worked in the field of investment banking at Morgan Stanley in Lon-don. Other assignments: Stefan is a Board member of Altor Equity Partners AB, CTEK Holding AB and Dustin Group AB. Shareholding: 0 shares.
STIG NOTLÖV
Board member of the current company since 2006, Board member of former Parent Company since 1993. Born 1947. Background: Formerly President of Byggmax. Other assignments: No other as-signments. Shareholding: 200,000 shares through companies.
FREDRIK CAPPELEN
MAGNUS AGERVALD
President since 2008 (employed since 2006). Born 1975. Educa-tion: M.Sc. Stockholm School of Economics and M.Sc. Engineering KTH Royal Institute of Technology. Background: Formerly worked as a consultant at McKinsey & Company and analyst at IDI AB and was the founder of Icomera. Other assignments: Board member of Granngården. Shareholding: 100,000 shares and 300,000 warrants.
Daniel Juhlin
Marketing and IT Manager since 2012. Born 1974. Education: M.Sc. Engineering KTH Royal Institute of Technology. Background: Formerly worked as a consultant at McKinsey & Company, held several sales and marketing positions at Toms and Cloetta Fazer, President of Friggs AB and President of Karamellkungen AB. Other assignments: No other assignments. Shareholding: 2,451 shares via endowment insurance, 1,000 shares via pension insurance and 60,000 warrants.
Erik börjesson
IT Manager since 2009 (employed 2008). Born 1985. Education: Gra-duate engineer from Luleå University of Technology. Background: Previously positions at Byggmax were as a Strategic Purchaser and Purchasing Analyst. Other assignments: No other assignments. Shareholding: 4 shares and 2,000 warrants.
Marcus Hed
Business Manager since 2015 (employed since 2006). Born 1975. Education: 3-year high-school program in vehicle system techno-logy and a technical foundation year. Background: Previously Store Manager and Regional Manager at Byggmax, and Store Manager for Intersport. Other assignments: No other assignments. Sharehol-ding: None
BYGGMAX GROUP MANAGEMENT
PER HARALDSSON
Sourcing and Supply Chain Manager since 2013 (employed in 2008). Born 1974. Education: M.Sc. in Engineering from the Institute of Technology, Linköping University. Background: Previously Business Area Manager at Rusta. Other assignments: No other assignme-nts. Shareholding: 41,440 shares, 24,000 warrants and exposure through endowment insurance to a further 28,850 shares
PERNILLA WALFRIDSSON
CFO since 2005. Born 1973. Education: Master of Science in Busi-ness and Economics, Växjö University. Background: Formerly CFO of consumer electronics chain Power, Business Controller of IKEA Russia and Controller at IKEA AB. Other assignments: No other as-signments. Shareholding: 230,000 shares and 44,000 warrants.
AUDITORS
Byggmax’s auditor is Öhrlings PricewaterhouseCoopers AB, with Ann-Christine Hägglund as Auditor in Charge since 2013. Ann-Chris-tine Hägglund is an Authorized Public Accountant and a member of FAR SRS. The address of Öhrlings PricewaterhouseCoopers AB’s offices is Torsgatan 21, SE-113 97 Stockholm, Sweden.
Erik
Bör
jess
on, P
er H
aral
dsso
n, M
agnu
s Ag
erva
ld, D
anie
l Juh
lin, P
erni
lla W
alfr
idss
on a
nd M
arcu
s H
ed.
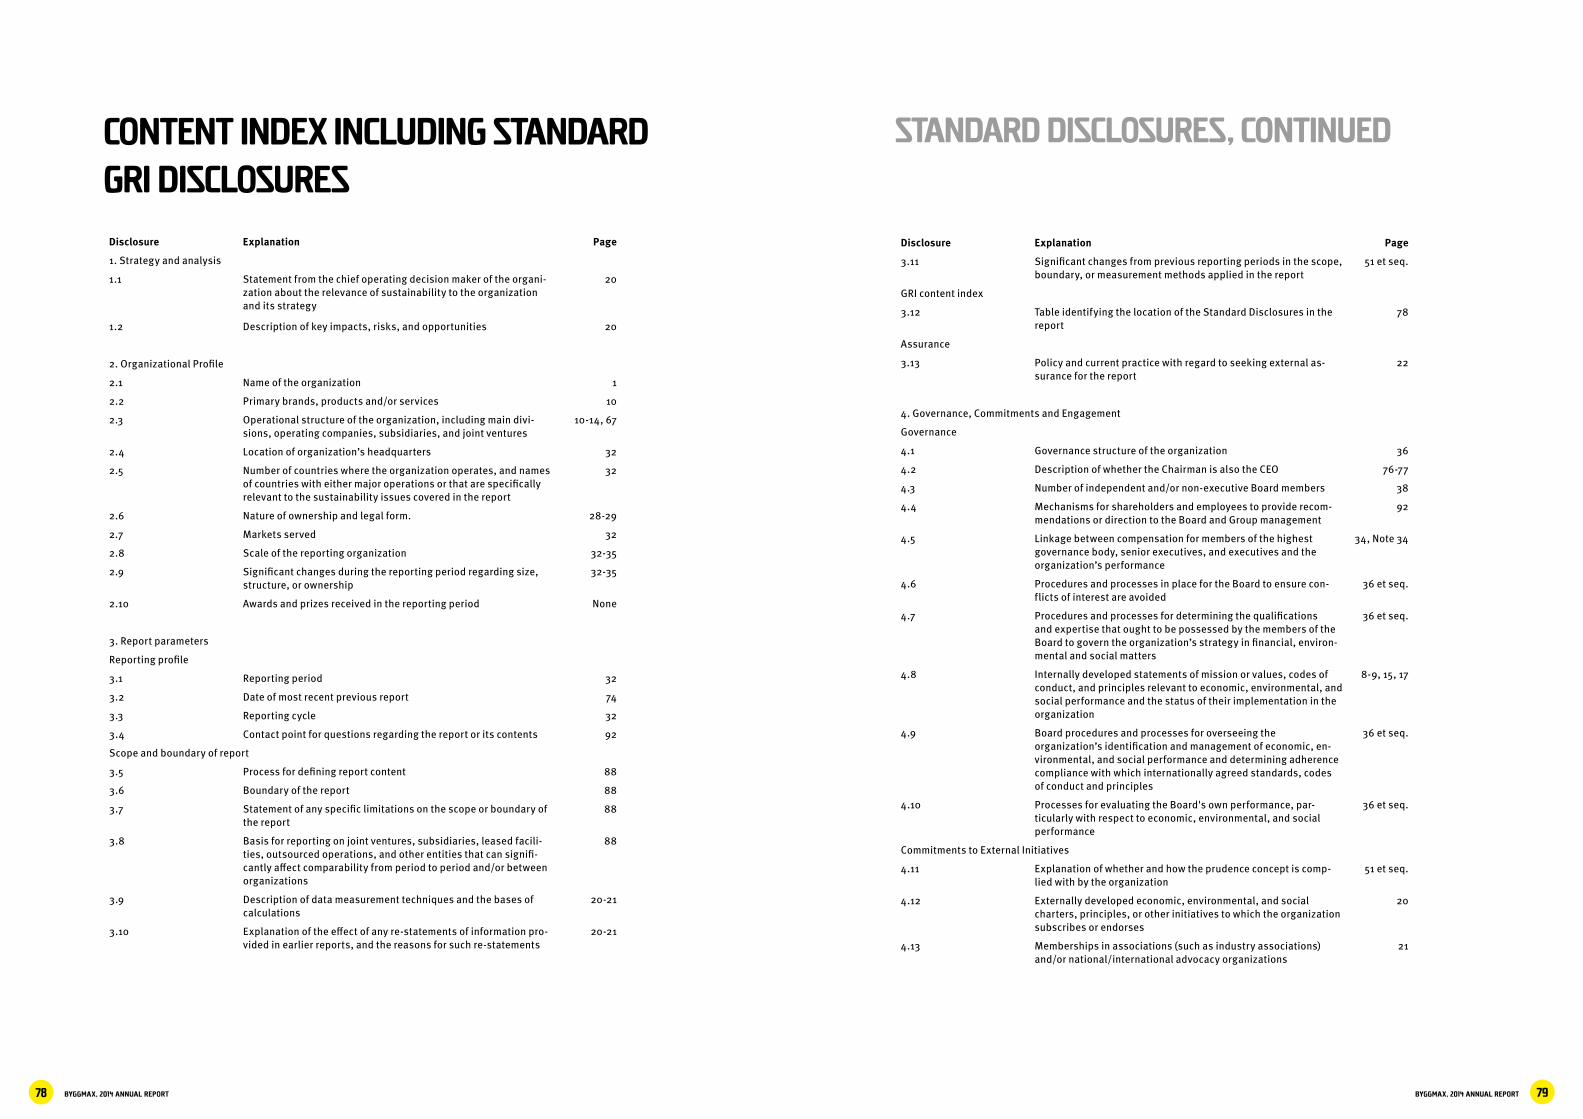
BYGGMAX, 2014 ANNUAL REPORT 79BYGGMAX, 2014 ANNUAL REPORT78
CONTENT INDEX INCLUDING STANDARD GRI DISCLOSURES
Disclosure Explanation Page
1. Strategy and analysis
1.1 Statement from the chief operating decision maker of the organi-zation about the relevance of sustainability to the organization and its strategy
20
1.2 Description of key impacts, risks, and opportunities 20
2. Organizational Profile
2.1 Name of the organization 1
2.2 Primary brands, products and/or services 10
2.3 Operational structure of the organization, including main divi-sions, operating companies, subsidiaries, and joint ventures
10-14, 67
2.4 Location of organization’s headquarters 32
2.5 Number of countries where the organization operates, and names of countries with either major operations or that are specifically relevant to the sustainability issues covered in the report
32
2.6 Nature of ownership and legal form. 28-29
2.7 Markets served 32
2.8 Scale of the reporting organization 32-35
2.9 Significant changes during the reporting period regarding size, structure, or ownership
32-35
2.10 Awards and prizes received in the reporting period None
3. Report parameters
Reporting profile
3.1 Reporting period 32
3.2 Date of most recent previous report 74
3.3 Reporting cycle 32
3.4 Contact point for questions regarding the report or its contents 92
Scope and boundary of report
3.5 Process for defining report content 88
3.6 Boundary of the report 88
3.7 Statement of any specific limitations on the scope or boundary of the report
88
3.8 Basis for reporting on joint ventures, subsidiaries, leased facili-ties, outsourced operations, and other entities that can signifi-cantly affect comparability from period to period and/or between organizations
88
3.9 Description of data measurement techniques and the bases of calculations
20-21
3.10 Explanation of the effect of any re-statements of information pro-vided in earlier reports, and the reasons for such re-statements
20-21
STANDARD DISCLOSURES, CONTINUED
Disclosure Explanation Page
3.11 Significant changes from previous reporting periods in the scope, boundary, or measurement methods applied in the report
51 et seq.
GRI content index
3.12 Table identifying the location of the Standard Disclosures in the report
78
Assurance
3.13 Policy and current practice with regard to seeking external as-surance for the report
22
4. Governance, Commitments and Engagement
Governance
4.1 Governance structure of the organization 36
4.2 Description of whether the Chairman is also the CEO 76-77
4.3 Number of independent and/or non-executive Board members 38
4.4 Mechanisms for shareholders and employees to provide recom-mendations or direction to the Board and Group management
92
4.5 Linkage between compensation for members of the highest governance body, senior executives, and executives and the organization’s performance
34, Note 34
4.6 Procedures and processes in place for the Board to ensure con-flicts of interest are avoided
36 et seq.
4.7 Procedures and processes for determining the qualifications and expertise that ought to be possessed by the members of the Board to govern the organization’s strategy in financial, environ-mental and social matters
36 et seq.
4.8 Internally developed statements of mission or values, codes of conduct, and principles relevant to economic, environmental, and social performance and the status of their implementation in the organization
8-9, 15, 17
4.9 Board procedures and processes for overseeing the organization’s identification and management of economic, en-vironmental, and social performance and determining adherence compliance with which internationally agreed standards, codes of conduct and principles
36 et seq.
4.10 Processes for evaluating the Board's own performance, par-ticularly with respect to economic, environmental, and social performance
36 et seq.
Commitments to External Initiatives
4.11 Explanation of whether and how the prudence concept is comp-lied with by the organization
51 et seq.
4.12 Externally developed economic, environmental, and social charters, principles, or other initiatives to which the organization subscribes or endorses
20
4.13 Memberships in associations (such as industry associations) and/or national/international advocacy organizations
21
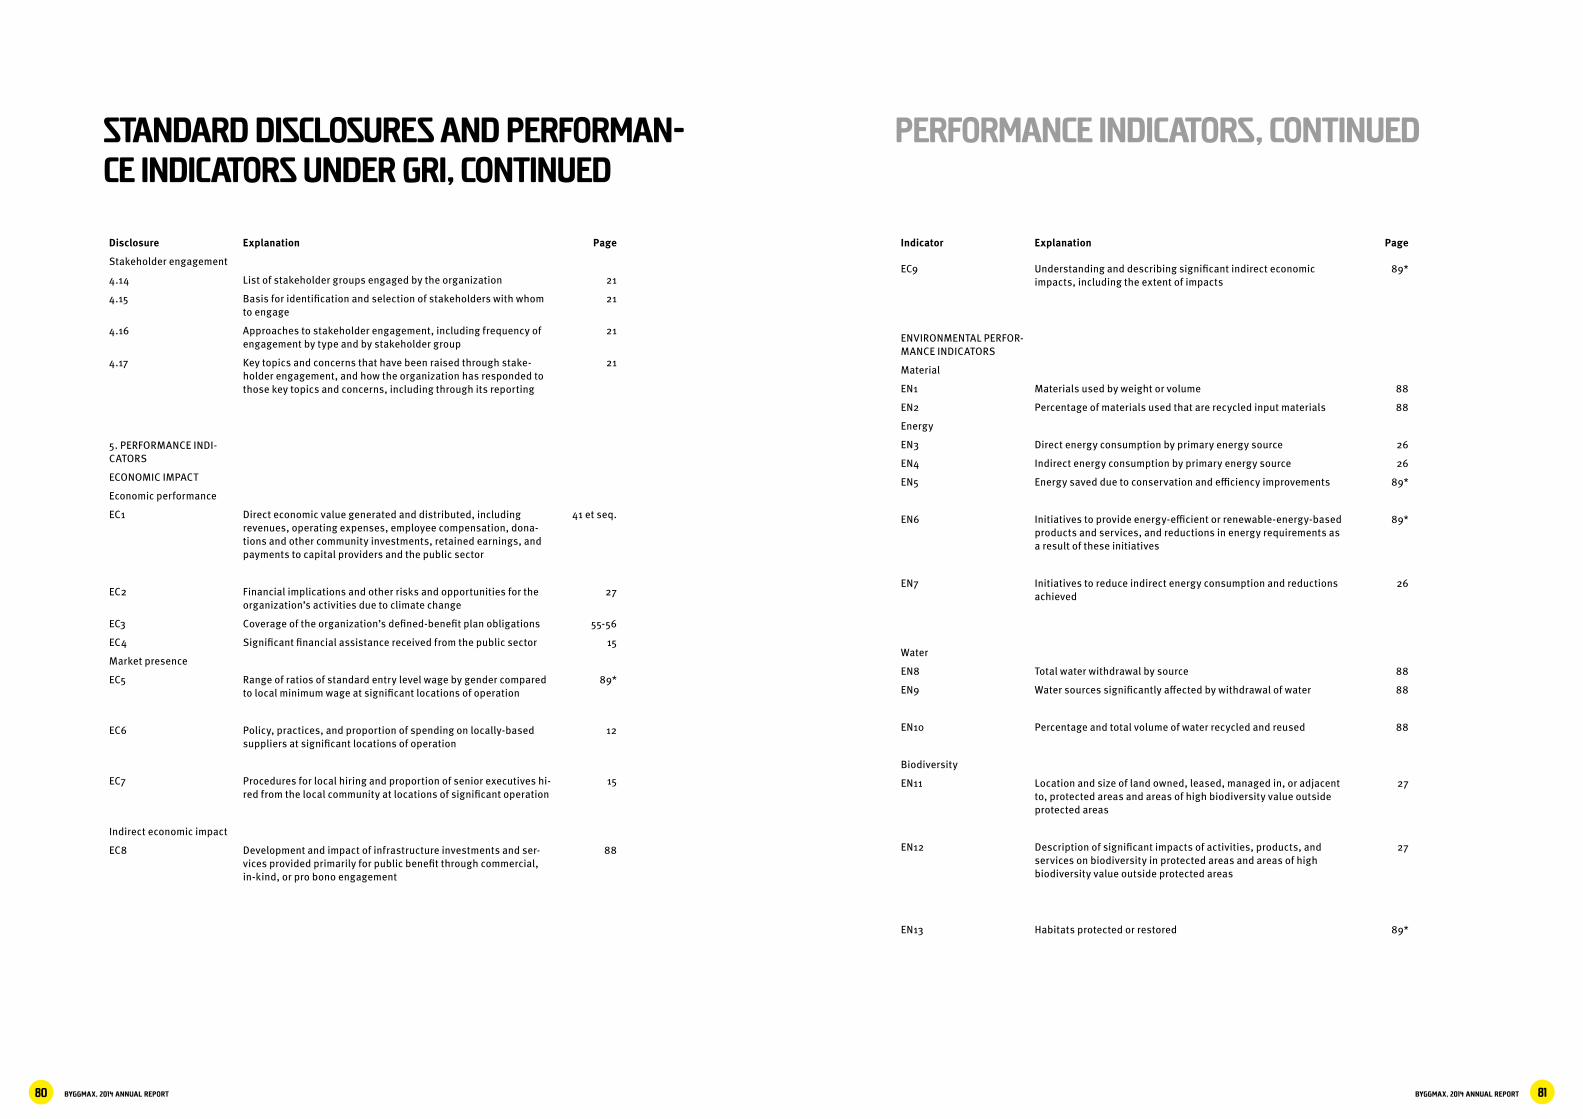
BYGGMAX, 2014 ANNUAL REPORT 81BYGGMAX, 2014 ANNUAL REPORT80
Disclosure Explanation Page
Stakeholder engagement
4.14 List of stakeholder groups engaged by the organization 21
4.15 Basis for identification and selection of stakeholders with whom to engage
21
4.16 Approaches to stakeholder engagement, including frequency of engagement by type and by stakeholder group
21
4.17 Key topics and concerns that have been raised through stake-holder engagement, and how the organization has responded to those key topics and concerns, including through its reporting
21
5. PERFORMANCE INDI-CATORS
ECONOMIC IMPACT
Economic performance
EC1 Direct economic value generated and distributed, including revenues, operating expenses, employee compensation, dona-tions and other community investments, retained earnings, and payments to capital providers and the public sector
41 et seq.
EC2 Financial implications and other risks and opportunities for the organization’s activities due to climate change
27
EC3 Coverage of the organization’s defined-benefit plan obligations 55-56
EC4 Significant financial assistance received from the public sector 15
Market presence
EC5 Range of ratios of standard entry level wage by gender compared to local minimum wage at significant locations of operation
89*
EC6 Policy, practices, and proportion of spending on locally-based suppliers at significant locations of operation
12
EC7 Procedures for local hiring and proportion of senior executives hi-red from the local community at locations of significant operation
15
Indirect economic impact
EC8 Development and impact of infrastructure investments and ser-vices provided primarily for public benefit through commercial, in-kind, or pro bono engagement
88
STANDARD DISCLOSURES AND PERFORMAN-CE INDICATORS UNDER GRI, CONTINUED
Indicator Explanation Page
EC9 Understanding and describing significant indirect economic impacts, including the extent of impacts
89*
ENVIRONMENTAL PERFOR-MANCE INDICATORS
Material
EN1 Materials used by weight or volume 88
EN2 Percentage of materials used that are recycled input materials 88
Energy
EN3 Direct energy consumption by primary energy source 26
EN4 Indirect energy consumption by primary energy source 26
EN5 Energy saved due to conservation and efficiency improvements 89*
EN6 Initiatives to provide energy-efficient or renewable-energy-based products and services, and reductions in energy requirements as a result of these initiatives
89*
EN7 Initiatives to reduce indirect energy consumption and reductions achieved
26
Water
EN8 Total water withdrawal by source 88
EN9 Water sources significantly affected by withdrawal of water 88
EN10 Percentage and total volume of water recycled and reused 88
Biodiversity
EN11 Location and size of land owned, leased, managed in, or adjacent to, protected areas and areas of high biodiversity value outside protected areas
27
EN12 Description of significant impacts of activities, products, and services on biodiversity in protected areas and areas of high biodiversity value outside protected areas
27
EN13 Habitats protected or restored 89*
PERFORMANCE INDICATORS, CONTINUED
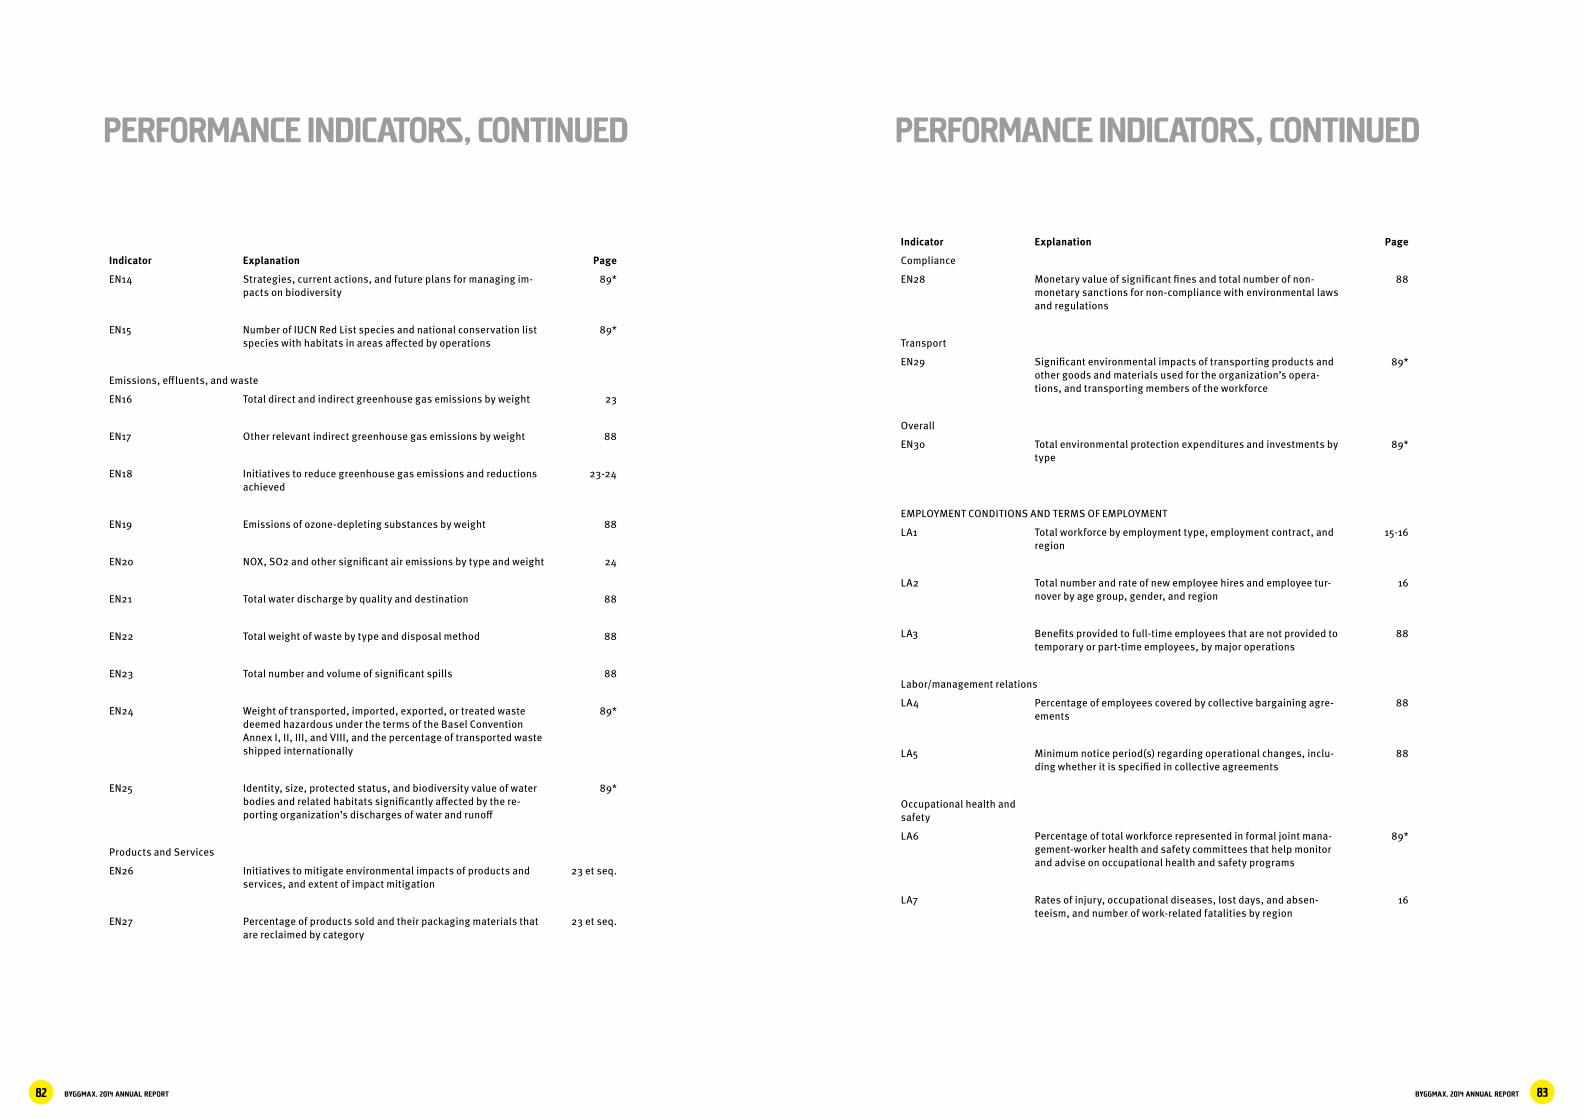
BYGGMAX, 2014 ANNUAL REPORT 83BYGGMAX, 2014 ANNUAL REPORT82
Indicator Explanation Page
EN14 Strategies, current actions, and future plans for managing im-pacts on biodiversity
89*
EN15 Number of IUCN Red List species and national conservation list species with habitats in areas affected by operations
89*
Emissions, effluents, and waste
EN16 Total direct and indirect greenhouse gas emissions by weight 23
EN17 Other relevant indirect greenhouse gas emissions by weight 88
EN18 Initiatives to reduce greenhouse gas emissions and reductions achieved
23-24
EN19 Emissions of ozone-depleting substances by weight 88
EN20 NOX, SO2 and other significant air emissions by type and weight 24
EN21 Total water discharge by quality and destination 88
EN22 Total weight of waste by type and disposal method 88
EN23 Total number and volume of significant spills 88
EN24 Weight of transported, imported, exported, or treated waste deemed hazardous under the terms of the Basel Convention Annex I, II, III, and VIII, and the percentage of transported waste shipped internationally
89*
EN25 Identity, size, protected status, and biodiversity value of water bodies and related habitats significantly affected by the re-porting organization’s discharges of water and runoff
89*
Products and Services
EN26 Initiatives to mitigate environmental impacts of products and services, and extent of impact mitigation
23 et seq.
EN27 Percentage of products sold and their packaging materials that are reclaimed by category
23 et seq.
PERFORMANCE INDICATORS, CONTINUED
Indicator Explanation Page
Compliance
EN28 Monetary value of significant fines and total number of non-monetary sanctions for non-compliance with environmental laws and regulations
88
Transport
EN29 Significant environmental impacts of transporting products and other goods and materials used for the organization’s opera-tions, and transporting members of the workforce
89*
Overall
EN30 Total environmental protection expenditures and investments by type
89*
EMPLOYMENT CONDITIONS AND TERMS OF EMPLOYMENT
LA1 Total workforce by employment type, employment contract, and region
15-16
LA2 Total number and rate of new employee hires and employee tur-nover by age group, gender, and region
16
LA3 Benefits provided to full-time employees that are not provided to temporary or part-time employees, by major operations
88
Labor/management relations
LA4 Percentage of employees covered by collective bargaining agre-ements
88
LA5 Minimum notice period(s) regarding operational changes, inclu-ding whether it is specified in collective agreements
88
Occupational health and safety
LA6 Percentage of total workforce represented in formal joint mana-gement-worker health and safety committees that help monitor and advise on occupational health and safety programs
89*
LA7 Rates of injury, occupational diseases, lost days, and absen-teeism, and number of work-related fatalities by region
16
PERFORMANCE INDICATORS, CONTINUED
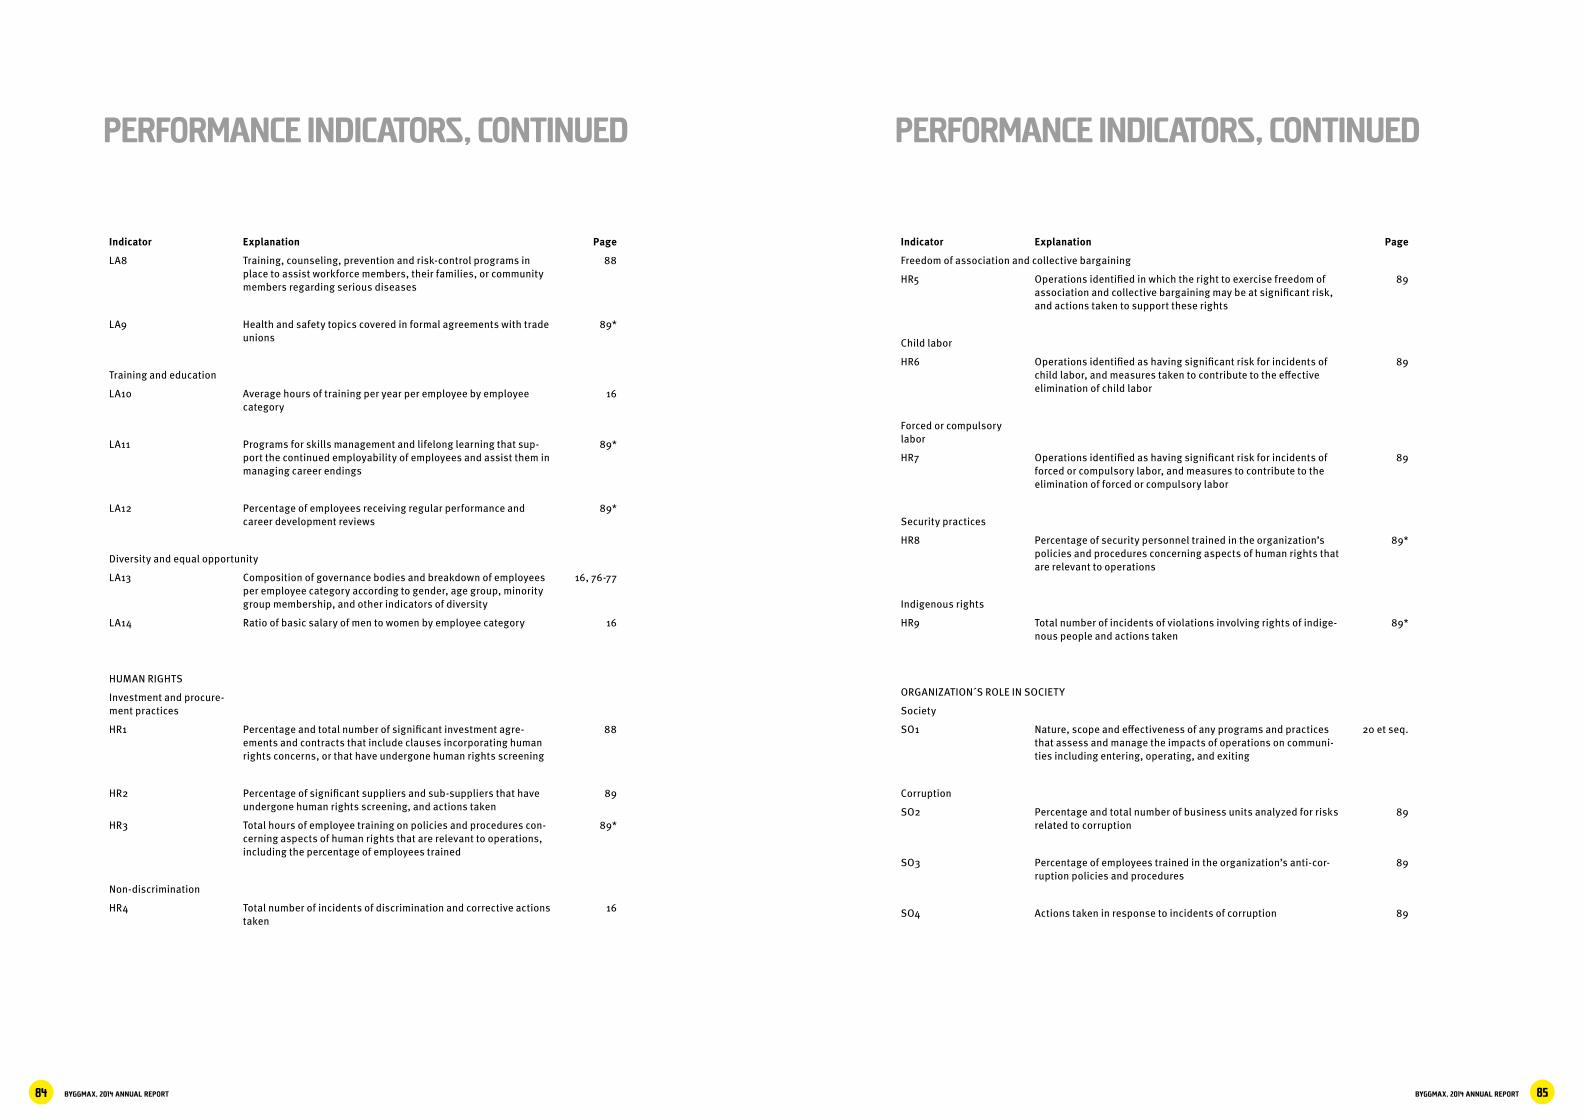
BYGGMAX, 2014 ANNUAL REPORT 85BYGGMAX, 2014 ANNUAL REPORT84
Indicator Explanation Page
LA8 Training, counseling, prevention and risk-control programs in place to assist workforce members, their families, or community members regarding serious diseases
88
LA9 Health and safety topics covered in formal agreements with trade unions
89*
Training and education
LA10 Average hours of training per year per employee by employee category
16
LA11 Programs for skills management and lifelong learning that sup-port the continued employability of employees and assist them in managing career endings
89*
LA12 Percentage of employees receiving regular performance and career development reviews
89*
Diversity and equal opportunity
LA13 Composition of governance bodies and breakdown of employees per employee category according to gender, age group, minority group membership, and other indicators of diversity
16, 76-77
LA14 Ratio of basic salary of men to women by employee category 16
HUMAN RIGHTS
Investment and procure-ment practices
HR1 Percentage and total number of significant investment agre-ements and contracts that include clauses incorporating human rights concerns, or that have undergone human rights screening
88
HR2 Percentage of significant suppliers and sub-suppliers that have undergone human rights screening, and actions taken
89
HR3 Total hours of employee training on policies and procedures con-cerning aspects of human rights that are relevant to operations, including the percentage of employees trained
89*
Non-discrimination
HR4 Total number of incidents of discrimination and corrective actions taken
16
PERFORMANCE INDICATORS, CONTINUED
Indicator Explanation Page
Freedom of association and collective bargaining
HR5 Operations identified in which the right to exercise freedom of association and collective bargaining may be at significant risk, and actions taken to support these rights
89
Child labor
HR6 Operations identified as having significant risk for incidents of child labor, and measures taken to contribute to the effective elimination of child labor
89
Forced or compulsory labor
HR7 Operations identified as having significant risk for incidents of forced or compulsory labor, and measures to contribute to the elimination of forced or compulsory labor
89
Security practices
HR8 Percentage of security personnel trained in the organization’s policies and procedures concerning aspects of human rights that are relevant to operations
89*
Indigenous rights
HR9 Total number of incidents of violations involving rights of indige-nous people and actions taken
89*
ORGANIZATION´S ROLE IN SOCIETY
Society
SO1 Nature, scope and effectiveness of any programs and practices that assess and manage the impacts of operations on communi-ties including entering, operating, and exiting
20 et seq.
Corruption
SO2 Percentage and total number of business units analyzed for risks related to corruption
89
SO3 Percentage of employees trained in the organization’s anti-cor-ruption policies and procedures
89
SO4 Actions taken in response to incidents of corruption 89
PERFORMANCE INDICATORS, CONTINUED
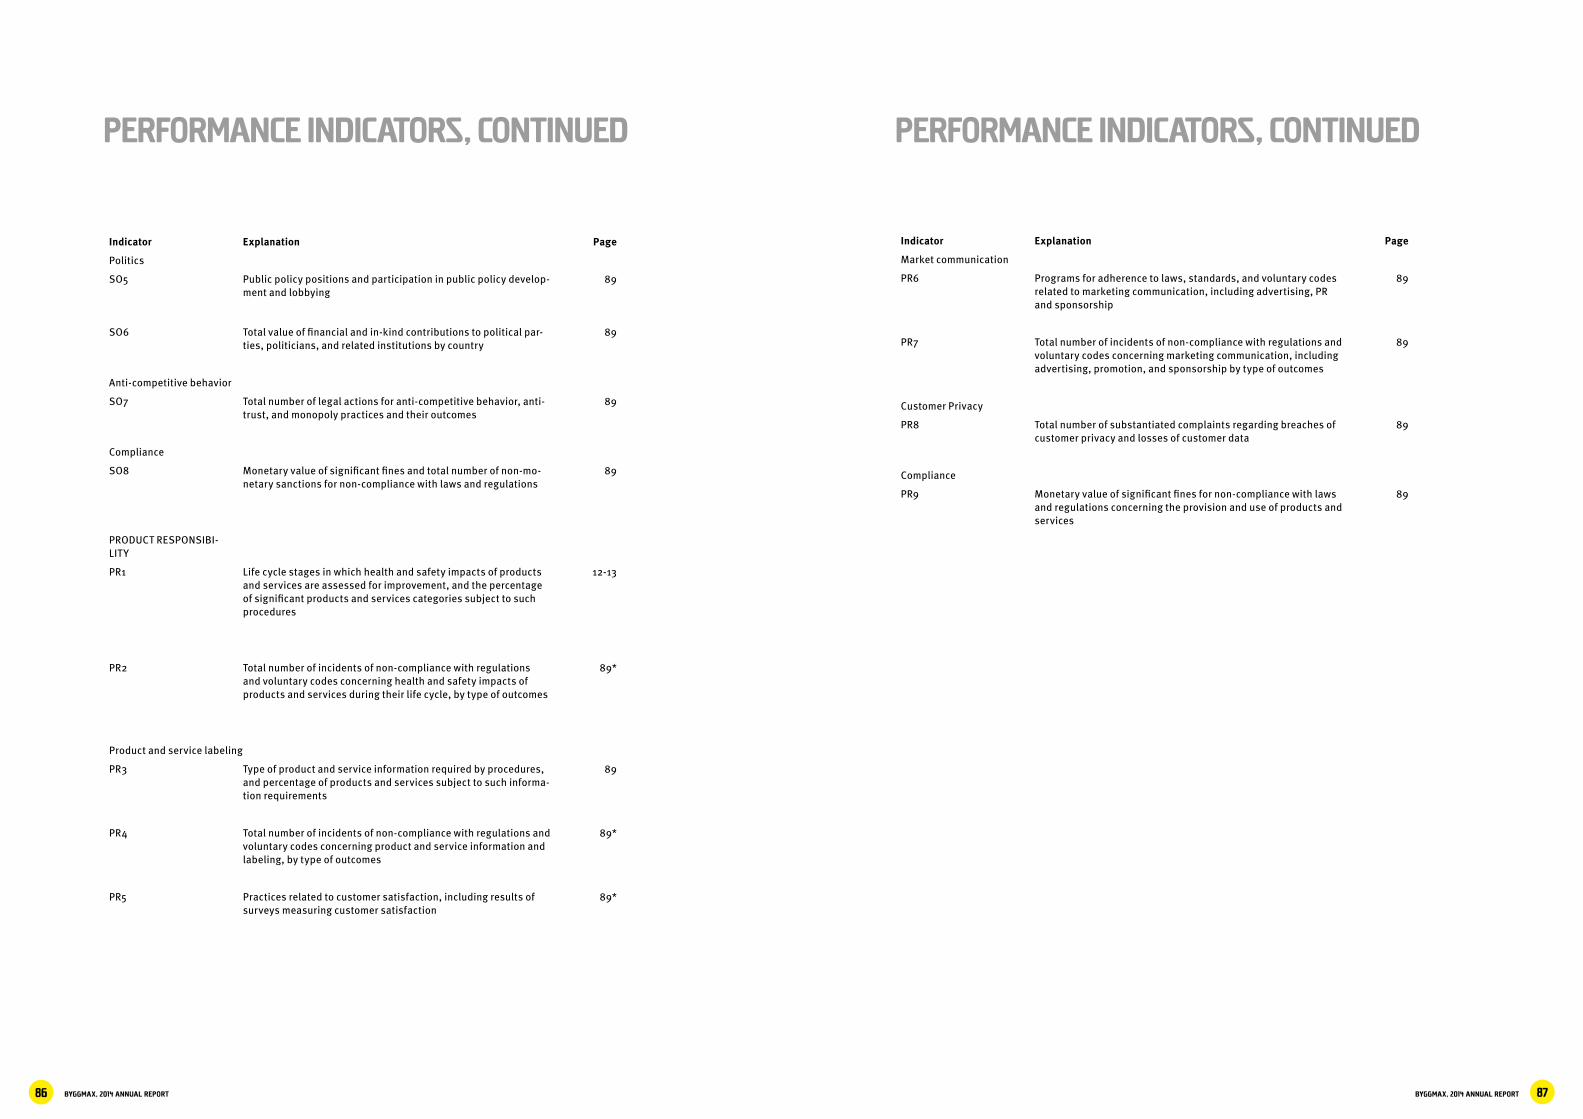
BYGGMAX, 2014 ANNUAL REPORT 87BYGGMAX, 2014 ANNUAL REPORT86
Indicator Explanation Page
Politics
SO5 Public policy positions and participation in public policy develop-ment and lobbying
89
SO6 Total value of financial and in-kind contributions to political par-ties, politicians, and related institutions by country
89
Anti-competitive behavior
SO7 Total number of legal actions for anti-competitive behavior, anti-trust, and monopoly practices and their outcomes
89
Compliance
SO8 Monetary value of significant fines and total number of non-mo-netary sanctions for non-compliance with laws and regulations
89
PRODUCT RESPONSIBI-LITY
PR1 Life cycle stages in which health and safety impacts of products and services are assessed for improvement, and the percentage of significant products and services categories subject to such procedures
12-13
PR2 Total number of incidents of non-compliance with regulations and voluntary codes concerning health and safety impacts of products and services during their life cycle, by type of outcomes
89*
Product and service labeling
PR3 Type of product and service information required by procedures, and percentage of products and services subject to such informa-tion requirements
89
PR4 Total number of incidents of non-compliance with regulations and voluntary codes concerning product and service information and labeling, by type of outcomes
89*
PR5 Practices related to customer satisfaction, including results of surveys measuring customer satisfaction
89*
PERFORMANCE INDICATORS, CONTINUED
Indicator Explanation Page
Market communication
PR6 Programs for adherence to laws, standards, and voluntary codes related to marketing communication, including advertising, PR and sponsorship
89
PR7 Total number of incidents of non-compliance with regulations and voluntary codes concerning marketing communication, including advertising, promotion, and sponsorship by type of outcomes
89
Customer Privacy
PR8 Total number of substantiated complaints regarding breaches of customer privacy and losses of customer data
89
Compliance
PR9 Monetary value of significant fines for non-compliance with laws and regulations concerning the provision and use of products and services
89
PERFORMANCE INDICATORS, CONTINUED
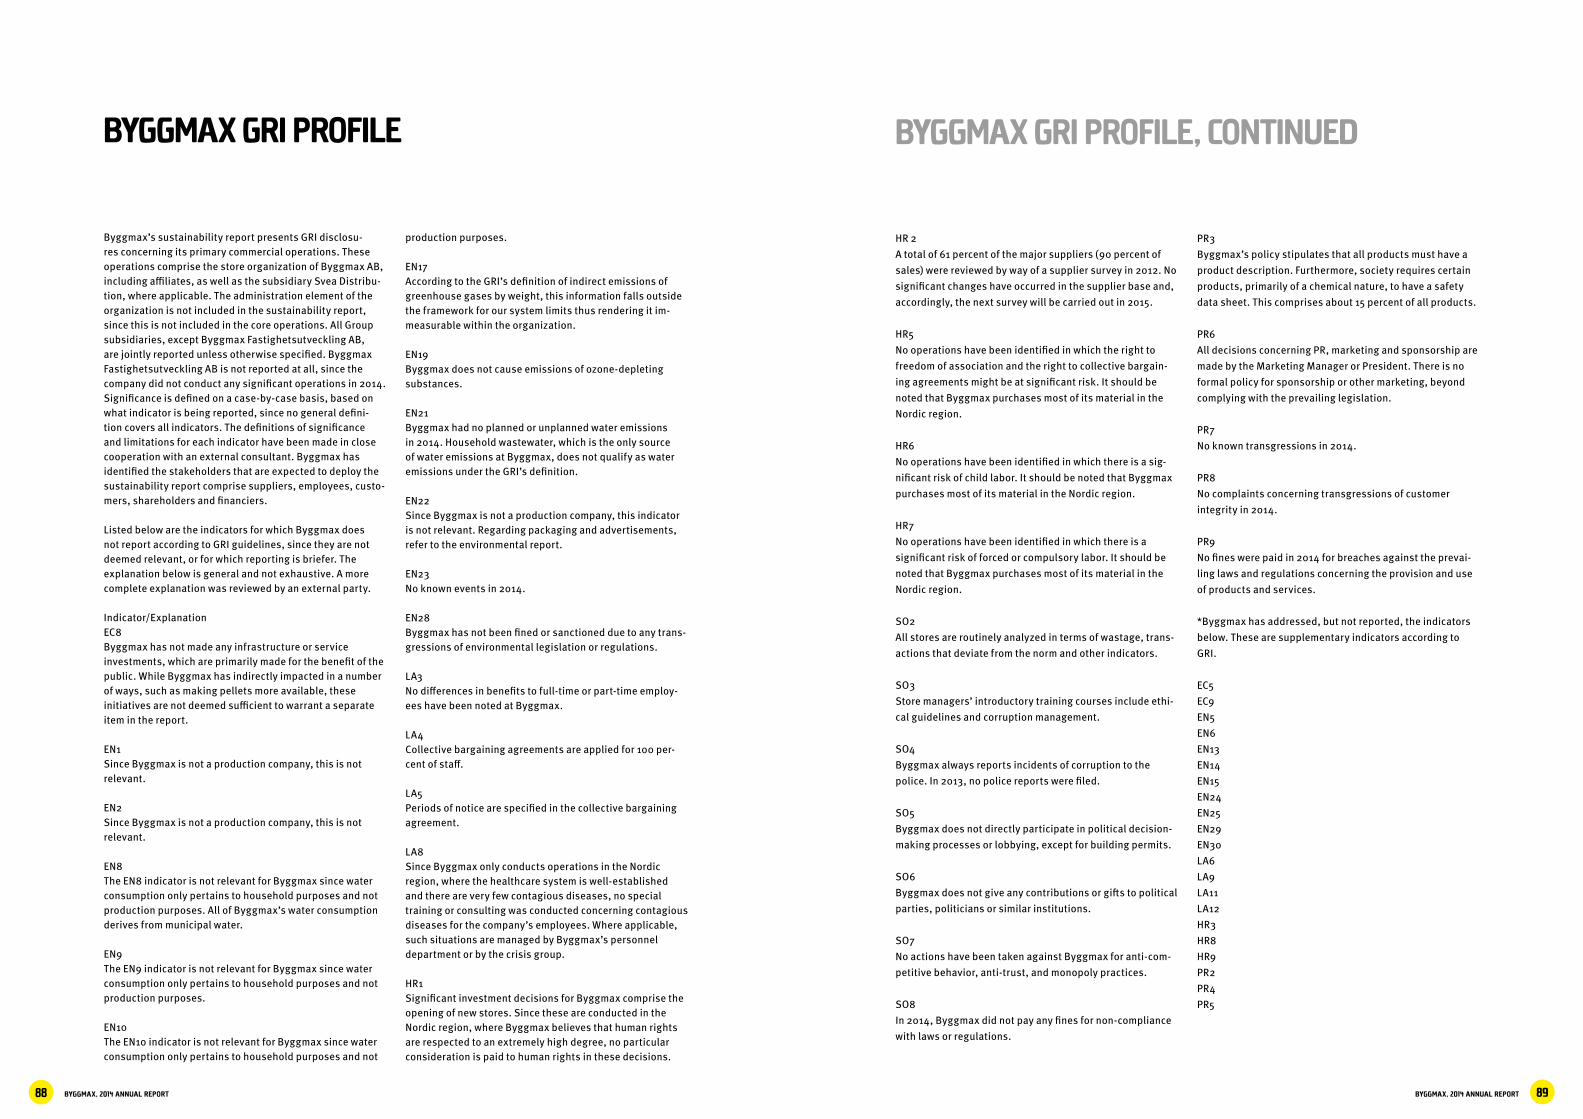
BYGGMAX, 2014 ANNUAL REPORT 89BYGGMAX, 2014 ANNUAL REPORT88
Byggmax’s sustainability report presents GRI disclosu-res concerning its primary commercial operations. These operations comprise the store organization of Byggmax AB, including affiliates, as well as the subsidiary Svea Distribu-tion, where applicable. The administration element of the organization is not included in the sustainability report, since this is not included in the core operations. All Group subsidiaries, except Byggmax Fastighetsutveckling AB, are jointly reported unless otherwise specified. Byggmax Fastighetsutveckling AB is not reported at all, since the company did not conduct any significant operations in 2014. Significance is defined on a case-by-case basis, based on what indicator is being reported, since no general defini-tion covers all indicators. The definitions of significance and limitations for each indicator have been made in close cooperation with an external consultant. Byggmax has identified the stakeholders that are expected to deploy the sustainability report comprise suppliers, employees, custo-mers, shareholders and financiers.
Listed below are the indicators for which Byggmax does not report according to GRI guidelines, since they are not deemed relevant, or for which reporting is briefer. The explanation below is general and not exhaustive. A more complete explanation was reviewed by an external party.
Indicator/ExplanationEC8Byggmax has not made any infrastructure or service investments, which are primarily made for the benefit of the public. While Byggmax has indirectly impacted in a number of ways, such as making pellets more available, these initiatives are not deemed sufficient to warrant a separate item in the report.
EN1Since Byggmax is not a production company, this is not relevant.
EN2Since Byggmax is not a production company, this is not relevant.
EN8The EN8 indicator is not relevant for Byggmax since water consumption only pertains to household purposes and not production purposes. All of Byggmax’s water consumption derives from municipal water.
EN9The EN9 indicator is not relevant for Byggmax since water consumption only pertains to household purposes and not production purposes.
EN10The EN10 indicator is not relevant for Byggmax since water consumption only pertains to household purposes and not
BYGGMAX GRI PROFILE
production purposes.
EN17According to the GRI’s definition of indirect emissions of greenhouse gases by weight, this information falls outside the framework for our system limits thus rendering it im-measurable within the organization.
EN19Byggmax does not cause emissions of ozone-depleting substances.
EN21Byggmax had no planned or unplanned water emissions in 2014. Household wastewater, which is the only source of water emissions at Byggmax, does not qualify as water emissions under the GRI’s definition.
EN22Since Byggmax is not a production company, this indicator is not relevant. Regarding packaging and advertisements, refer to the environmental report.
EN23No known events in 2014.
EN28Byggmax has not been fined or sanctioned due to any trans-gressions of environmental legislation or regulations.
LA3No differences in benefits to full-time or part-time employ-ees have been noted at Byggmax.
LA4Collective bargaining agreements are applied for 100 per-cent of staff.
LA5Periods of notice are specified in the collective bargaining agreement.
LA8Since Byggmax only conducts operations in the Nordic region, where the healthcare system is well-established and there are very few contagious diseases, no special training or consulting was conducted concerning contagious diseases for the company’s employees. Where applicable, such situations are managed by Byggmax’s personnel department or by the crisis group.
HR1Significant investment decisions for Byggmax comprise the opening of new stores. Since these are conducted in the Nordic region, where Byggmax believes that human rights are respected to an extremely high degree, no particular consideration is paid to human rights in these decisions.
BYGGMAX GRI PROFILE, CONTINUED
HR 2A total of 61 percent of the major suppliers (90 percent of sales) were reviewed by way of a supplier survey in 2012. No significant changes have occurred in the supplier base and, accordingly, the next survey will be carried out in 2015.
HR5No operations have been identified in which the right to freedom of association and the right to collective bargain-ing agreements might be at significant risk. It should be noted that Byggmax purchases most of its material in the Nordic region.
HR6No operations have been identified in which there is a sig-nificant risk of child labor. It should be noted that Byggmax purchases most of its material in the Nordic region.
HR7No operations have been identified in which there is a significant risk of forced or compulsory labor. It should be noted that Byggmax purchases most of its material in the Nordic region.
SO2All stores are routinely analyzed in terms of wastage, trans-actions that deviate from the norm and other indicators.
SO3Store managers’ introductory training courses include ethi-cal guidelines and corruption management.
SO4Byggmax always reports incidents of corruption to the police. In 2013, no police reports were filed.
SO5Byggmax does not directly participate in political decision-making processes or lobbying, except for building permits.
SO6Byggmax does not give any contributions or gifts to political parties, politicians or similar institutions.
SO7No actions have been taken against Byggmax for anti-com-petitive behavior, anti-trust, and monopoly practices.
SO8In 2014, Byggmax did not pay any fines for non-compliance with laws or regulations.
PR3Byggmax’s policy stipulates that all products must have a product description. Furthermore, society requires certain products, primarily of a chemical nature, to have a safety data sheet. This comprises about 15 percent of all products.
PR6All decisions concerning PR, marketing and sponsorship are made by the Marketing Manager or President. There is no formal policy for sponsorship or other marketing, beyond complying with the prevailing legislation.
PR7No known transgressions in 2014.
PR8No complaints concerning transgressions of customer integrity in 2014.
PR9No fines were paid in 2014 for breaches against the prevai-ling laws and regulations concerning the provision and use of products and services.
*Byggmax has addressed, but not reported, the indicators below. These are supplementary indicators according to GRI.
EC5EC9EN5EN6EN13EN14EN15EN24EN25EN29EN30LA6LA9LA11LA12HR3HR8HR9PR2PR4PR5

BYGGMAX, 2014 ANNUAL REPORT 91BYGGMAX, 2014 ANNUAL REPORT90
REVIEWER’S CONCLUSION
Tyréns (the Reviewer) has reviewed Byggmax’s sustainability report for the 2014 fiscal year. The review was based on GRI version 3.0. The Reviewer can affirm that the work was conducted in a goal-oriented and ambitious manner and that the information that is presented in the final sustainability report is truthful and traceable. Byggmax has responded appropria-tely to the reviewer’s questions and provided supplementary documentation upon request. When it has not been possible to comply with the GRI guidelines and the indicator index in its entirety, Byggmax has provided explanations that have been approved by the Reviewer.
In addition to reviewing the 2014 sustainability report, the Reviewer had good insight into the processes in 2011, 2012, 2013 and 2014 aimed at building up procedures for and implementing Byggmax’s first sustainability report for 2011. The Reviewer also had good insight into the decisions behind and preparation of documentation for the final report. The Reviewer noted positive progress in the organization’s management and reporting of sustainability issues. The scope and limitation of the report were also conducted in sufficient accordance with GRI’s instructions.
The Reviewer can with a high but not absolute degree of certainty state that the sustainability report fulfills the criteria for the A+ application level.
DEFINITIONS
DISTRIBUTION OF ANNUAL REPORT
DEFINITIONS OF FINANCIAL KEY RATIOS/REPORTING TER-MINOLOGY
Average net capital employed: Each year’s monthly net capital employed has been weighted in the same manner to calculate an average.
Average operating capital employed: Operating capital employed for the past two years divided by two.
Cash flow from business activities per share: Cash flow from operating activities for the period divided by the num-ber of shares.
Dividend per share: Dividend divided by the number of shares.
EBITA: EBIT after depreciation/amortization and impairment but before deduction for impairment of goodwill.
EBITDA: EBIT before depreciation/amortization and impair-ment.
Equity per share: Shareholders’ equity divided by the num-ber of outstanding shares.
Equity ratio/risk-bearing capital: Adjusted shareholders’ equity plus subordinated shareholder loans divided by total assets.
Interest-coverage ratio: EBITDA in relation to total interest expenses.
Net debt: Interest-bearing liabilities less cash and cash equivalents.
Net debt/EBITDA: Interest-bearing liabilities excluding shareholder loans minus cash and cash equivalents divided by EBITDA.
Net debt/equity ratio: Net debt divided by equity.
Net operating capital: Balance-sheet data from the principal ledger (not amended), measured as the total of inventory, accounts receivable, receivables on bonuses from suppli-ers, other receivables and prepaid expenses/accrued in-come less the total of accounts payable, tax liabilities, other current liabilities and accrued expenses/deferred income.
Byggmax’s Annual Report is available only via the Group’s website.
Operating capital: Shareholders’ equity plus net debt.
Operating margin (EBIT margin): EBIT (operating profit) divided by net sales.
Return on equity: Earnings for the year divided by average equity.
Return on operating capital employed: EBITA divided by average operating capital.
Stock turnover: Inventory costs for the year divided by the average inventory (mean value of incoming and outgoing inventory value).
DEFINITION OF SECTOR-SPECIFIC KEY RATIOS
Growth in like-for-like sales: A comparable unit (like-for-like unit) is regarded as comparable from the second year-end after the store has opened. For example, this means that a store that opened in 2011 is classified as a comparable unit from 2013. Stores relocated to new premises in an existing location are treated in the same manner.
DEFINITIONS FROM THE ENVIRONMENTAL REPORT
CO2 per ton of goods transported [kg]: CO2 emissions per ton of goods transported.
Landfill, unsorted: General waste that is not suitable for recycling or energy recovery.
Mixed waste: Unsorted material that is not packaging. Paper, corrugated board, wood and plastic, mixed scrap, textiles and non-combustible waste.
Sorted waste: Not landfill or mixed waste.
Transported goods [tons]: The amount of goods, in tons, that are transported from suppliers to Byggmax facilities and distribution centers.
Transport work [ton km]: The mass in tons of every indivi-dual type of goods multiplied by the transport distances in kilometers.
Transport work per ton [ton km/ton]: The amount of trans-port work per ton of goods transported.

ByggmaxBox 6063SE- 171 06 Solna, Swedenwww.byggmax.se
INFORMATION ABOUT THE ANNUAL GENERAL MEETINGThe Annual General Meeting (AGM) of Byggmax Group AB (publ), corporate registration number 556656-3531, will be held on Tuesday, May 5, 2015, at 10:00 a.m. at Primus confer-ence center, Primusgatan 18 in Stockholm, Sweden.
Right to participate in the AGMShareholders who wish to participate in the AGM must: both be listed in the register of shareholders maintained by Euro-clear Sweden AB on Tuesday, April 28, 2015, and notify the company of their intention to attend the AGM, no later than at 4:00 p.m. on Tuesday, April 28, 2015. NotificationNotice of participation in the AGM should be submitted in one of the following ways:• By e-mail: [email protected]• By telephone: +46 (0) 8 514 930 60• By mail: Byggmax Group AB, Box 6063, SE-171 06 Solna,
Sweden (Label the letter “AGM”)
On notification, shareholders must provide the following information:• Name• Personal ID/corporate registration number• Address and daytime telephone number• Shareholding in Byggmax• Where applicable, the names of any advisers, maximum
two, who will accompany the shareholder to the AGM, or the name of a proxy
When applicable, notice should be accompanied by full proof of authority such as the certificate of registration or its equivalent.
Trustee registered sharesShareholders who have registered their shares in the name of a trustee must temporarily re-register the shares in their own names in the register maintained by Euroclear Sweden AB in order to participate at the AGM. Such temporary re-registra-tion must be executed no later than Tuesday, April 28, 2015, which means that shareholders are advised to notify their trustee well in advance of this date.
Welcome to Byggmax’s investor relations pages on www.om.byggmax.se/en