Embed Size (px)
Citation preview
Operational ExcellenceBalance Sheet Strength
Responsible Mining
Delivering Results
ANNUAL REPORT 2014
KIN
ROSS G
OLD
2014 AN
NU
AL R
EP
OR
T
KINROSS GOLD CORPORATION25 York Street, 17th FloorToronto, Ontario, CanadaM5J 2V5
Kinross is a Canadian-based senior gold mining company with mines and projects in Brazil, Chile, Ghana, Mauritania, Russia and the United States. Kinross is focused on delivering value based on its core principles of operational excellence, balance sheet strength and responsible mining.Kinross maintains listings on the Toronto Stock Exchange (symbol:K) and the New York Stock Exchange (symbol:KGC).
LETTER TO SHAREHOLDERS 1
2014 ACHIEVEMENTS 4
DIRECTORS 6
CORPORATE GOVERNANCE HIGHLIGHTS 6
FINANCIAL REVIEW 7
CAUTIONARY STATEMENT ON 75 FORWARD-LOOKING INFORMATION
All figures in U.S. dollars and from continuing operations.
Endnotes can be found on page 77 of this 2014 Annual Report.
Read the annual report online:
2014ANNUALREPORT.KINROSS.COM
CORPORATE INFORMATION
Shareholder Information
Transfer Agent and Registrar
ComputershareInvestor Services Inc.Toronto, Ontario, CanadaToll-free: 1-800-564-6253
Proxy Solicitation Agent
Kingsdale Shareholder ServicesToronto, Ontario, Canada
Annual and Special Shareholders Meeting
Wednesday, May 6, 2015 at 10:00 a.m. EDT at the Glenn Gould Studio, 250 Front Street West, Toronto, Ontario, Canada
Trading Data
TSXK — commonNYSEKGC — common
Legal Counsel
Osler, Hoskin & Harcourt LLPToronto, Ontario, Canada
Sullivan & Cromwell LLPNew York, New York,United States
Auditors
KPMG LLPToronto, Ontario, Canada
Contact Information
General
Kinross Gold Corporation25 York Street, 17th FloorToronto, Ontario,Canada M5J 2V5
Website: Kinross.comTelephone: 416-365-5123Toll-free: 1-866-561-3636Facsimile: 416-363-6622Email: [email protected]
Media Relations
Andrea Mandel-CampbellVice-President, Corporate CommunicationsTelephone: 647-788-4179Email: [email protected]
Investor Relations
Tom Elliott, Vice-President,Investor RelationsTelephone: 416-365-3390Email: [email protected]
Shareholder Inquiries
ComputershareInvestor Services Inc.9th Floor,100 University AvenueToronto, Ontario,Canada M5J 2Y1www.computershare.com/kinrossToll-free: 1-800-564-6253Toll-free facsimile:1-888-453-0330
Publications
To obtain copies of Kinross’ publications, please visit our corporate website at Kinross.com, or contact us by email at [email protected] or call 1-866-561-3636.
Corporate Responsibility Report
Kinross publishes its corporate responsibility performance data annually and a comprehensiveGlobal Reporting Initiative (GRI) report every two years. Our 2013 CR Report is currently available on our website and provides a detailed account of our social, environmental, and health and safety performance for 2012 and 2013.
designed and produced by smith + associates www.smithandassoc.com Please recycle.
@KinrossGold
1KINROSS GOLD 2014 ANNUAL REPORT
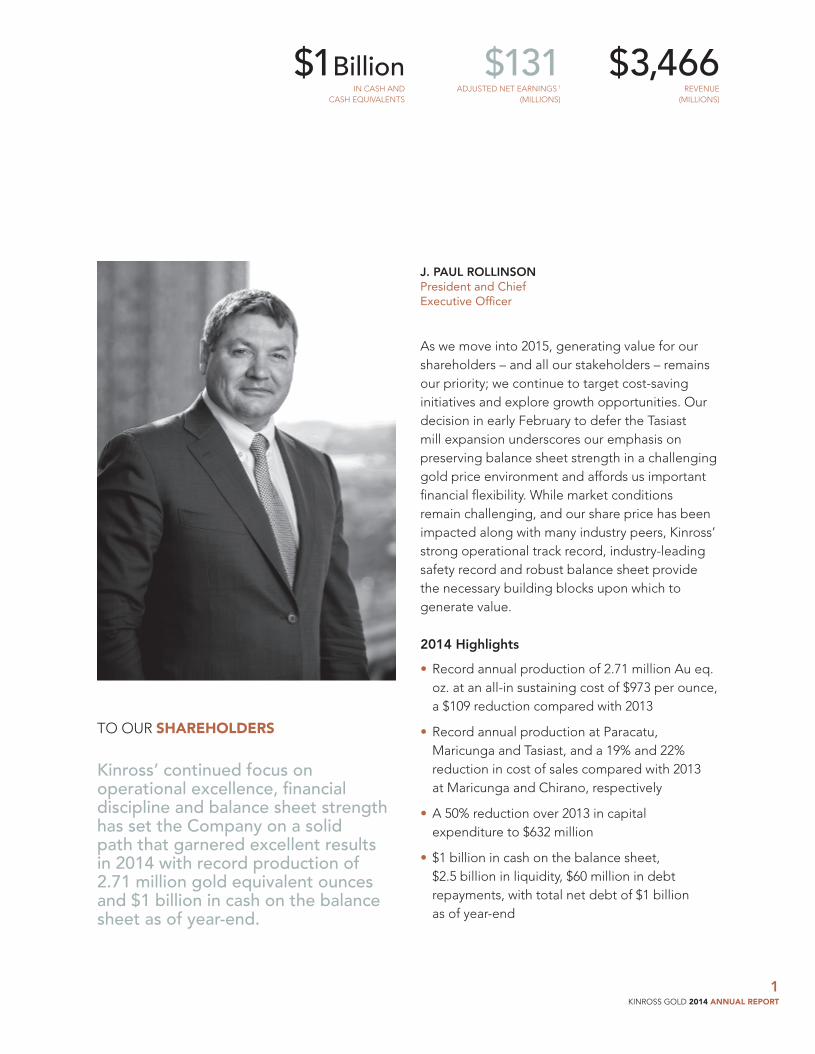
J. PAUL ROLLINSONPresident and Chief Executive Officer
TO OUR SHAREHOLDERS
Kinross’ continued focus on operational excellence, financial discipline and balance sheet strength has set the Company on a solid path that garnered excellent results in 2014 with record production of 2.71 million gold equivalent ounces and $1 billion in cash on the balance sheet as of year-end.
As we move into 2015, generating value for our shareholders – and all our stakeholders – remains our priority; we continue to target cost-saving initiatives and explore growth opportunities. Our decision in early February to defer the Tasiast mill expansion underscores our emphasis on preserving balance sheet strength in a challenging gold price environment and affords us important financial flexibility. While market conditions remain challenging, and our share price has been impacted along with many industry peers, Kinross’ strong operational track record, industry-leading safety record and robust balance sheet provide the necessary building blocks upon which to generate value.
2014 Highlights
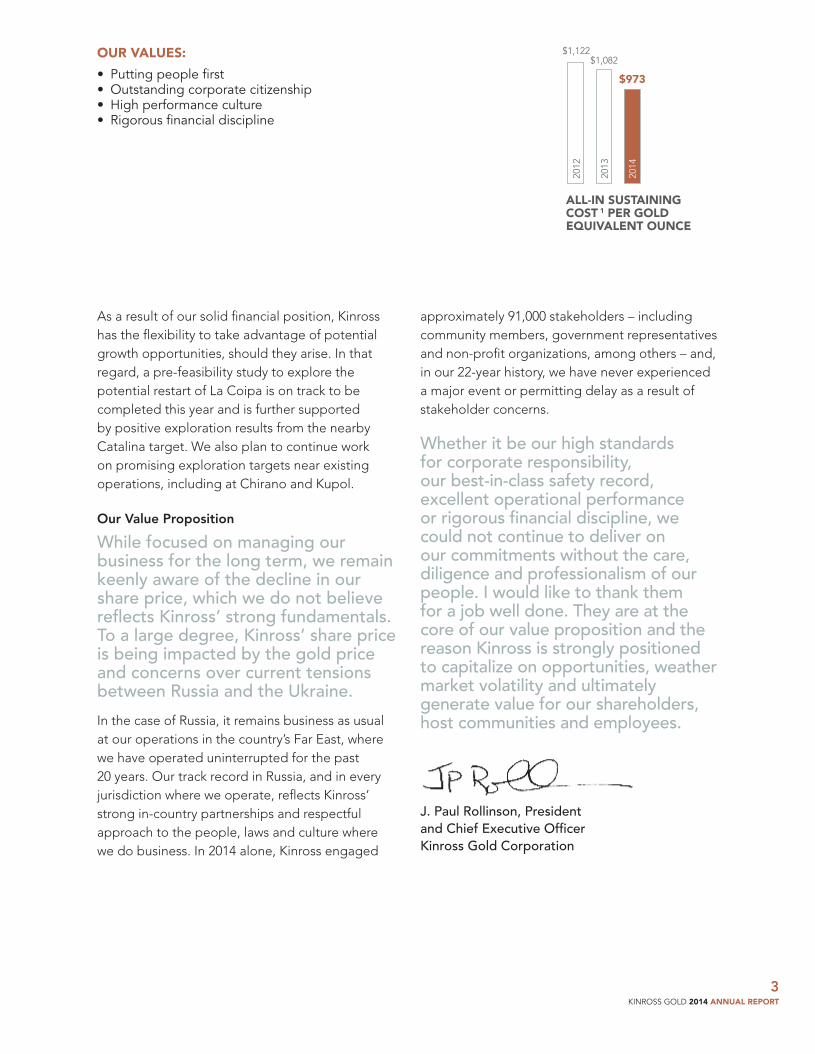
• Record annual production of 2.71 million Au eq. oz. at an all-in sustaining cost of $973 per ounce, a $109 reduction compared with 2013
• Record annual production at Paracatu, Maricunga and Tasiast, and a 19% and 22% reduction in cost of sales compared with 2013 at Maricunga and Chirano, respectively
• A 50% reduction over 2013 in capital expenditure to $632 million
• $1 billion in cash on the balance sheet, $2.5 billion in liquidity, $60 million in debt repayments, with total net debt of $1 billion as of year-end
$1BillionIN CASH AND
CASH EQUIVALENTS
$131ADJUSTED NET EARNINGS 1
(MILLIONS)
$3,466REVENUE
(MILLIONS)
2KINROSS GOLD 2014 ANNUAL REPORT
• Sale of interest in Aurelian Resources and the Fruta del Norte project for $240 million
• An industry-leading safety record, and the best in company history
• Delivered 687 local community programs and events, benefiting an estimated 805,000 people
2015 Guidance 2
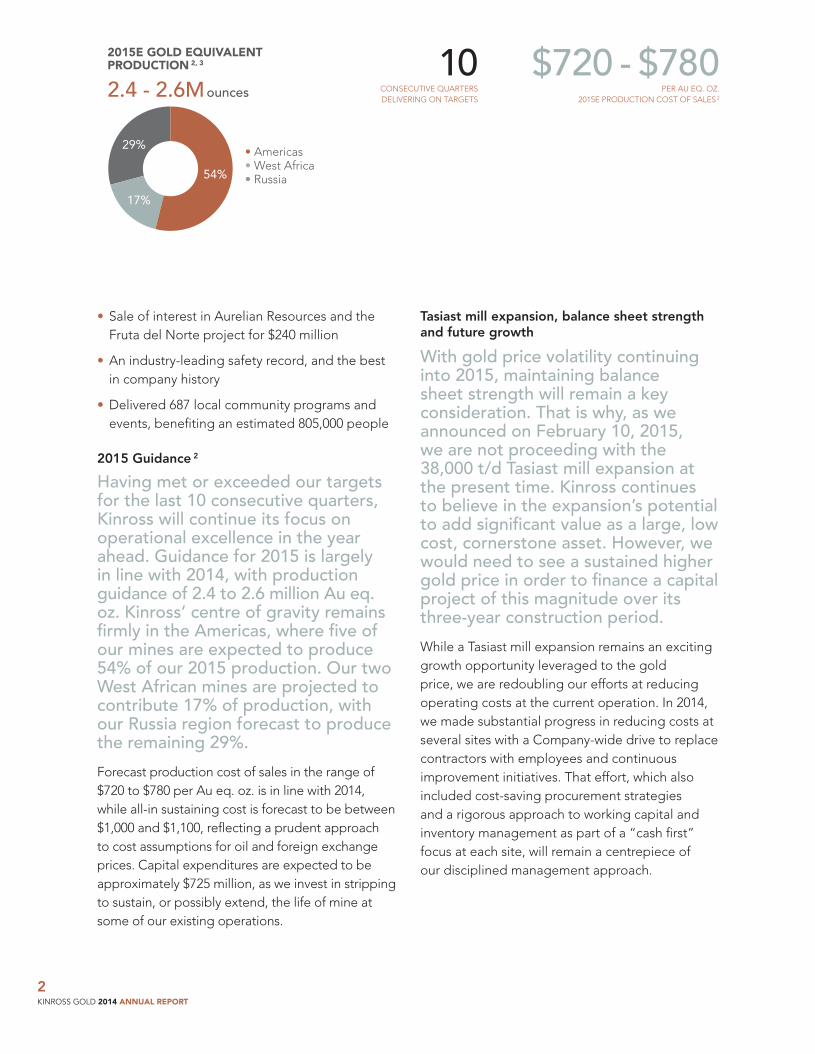
Having met or exceeded our targets for the last 10 consecutive quarters, Kinross will continue its focus on operational excellence in the year ahead. Guidance for 2015 is largely in line with 2014, with production guidance of 2.4 to 2.6 million Au eq. oz. Kinross’ centre of gravity remains firmly in the Americas, where five of our mines are expected to produce 54% of our 2015 production. Our two West African mines are projected to contribute 17% of production, with our Russia region forecast to produce the remaining 29%.
Forecast production cost of sales in the range of $720 to $780 per Au eq. oz. is in line with 2014, while all-in sustaining cost is forecast to be between $1,000 and $1,100, reflecting a prudent approach to cost assumptions for oil and foreign exchange prices. Capital expenditures are expected to be approximately $725 million, as we invest in stripping to sustain, or possibly extend, the life of mine at some of our existing operations.
Tasiast mill expansion, balance sheet strength and future growth
With gold price volatility continuing into 2015, maintaining balance sheet strength will remain a key consideration. That is why, as we announced on February 10, 2015, we are not proceeding with the 38,000 t/d Tasiast mill expansion at the present time. Kinross continues to believe in the expansion’s potential to add significant value as a large, low cost, cornerstone asset. However, we would need to see a sustained higher gold price in order to finance a capital project of this magnitude over its three-year construction period.
While a Tasiast mill expansion remains an exciting growth opportunity leveraged to the gold price, we are redoubling our efforts at reducing operating costs at the current operation. In 2014, we made substantial progress in reducing costs at several sites with a Company-wide drive to replace contractors with employees and continuous improvement initiatives. That effort, which also included cost-saving procurement strategies and a rigorous approach to working capital and inventory management as part of a “cash first” focus at each site, will remain a centrepiece of our disciplined management approach.
2.4 - 2.6Mounces
• Americas • West Africa • Russia54%
17%
29%$1.0
$1.5
2015E GOLD EQUIVALENT PRODUCTION 2, 3 $720 - $780
PER AU EQ. OZ.2015E PRODUCTION COST OF SALES 2
10CONSECUTIVE QUARTERS DELIVERING ON TARGETS
3KINROSS GOLD 2014 ANNUAL REPORT
As a result of our solid financial position, Kinross has the flexibility to take advantage of potential growth opportunities, should they arise. In that regard, a pre-feasibility study to explore the potential restart of La Coipa is on track to be completed this year and is further supported by positive exploration results from the nearby Catalina target. We also plan to continue work on promising exploration targets near existing operations, including at Chirano and Kupol.
Our Value Proposition
While focused on managing our business for the long term, we remain keenly aware of the decline in our share price, which we do not believe reflects Kinross’ strong fundamentals. To a large degree, Kinross’ share price is being impacted by the gold price and concerns over current tensions between Russia and the Ukraine.
In the case of Russia, it remains business as usual at our operations in the country’s Far East, where we have operated uninterrupted for the past 20 years. Our track record in Russia, and in every jurisdiction where we operate, reflects Kinross’ strong in-country partnerships and respectful approach to the people, laws and culture where we do business. In 2014 alone, Kinross engaged
approximately 91,000 stakeholders – including community members, government representatives and non-profit organizations, among others – and, in our 22-year history, we have never experienced a major event or permitting delay as a result of stakeholder concerns.
Whether it be our high standards for corporate responsibility, our best-in-class safety record, excellent operational performance or rigorous financial discipline, we could not continue to deliver on our commitments without the care, diligence and professionalism of our people. I would like to thank them for a job well done. They are at the core of our value proposition and the reason Kinross is strongly positioned to capitalize on opportunities, weather market volatility and ultimately generate value for our shareholders, host communities and employees.
J. Paul Rollinson, President and Chief Executive Officer Kinross Gold Corporation
OUR VALUES:
• Putting people first • Outstanding corporate citizenship • High performance culture • Rigorous financial discipline
ALL-IN SUSTAINING COST 1 PER GOLD EQUIVALENT OUNCE
$1,122$1,082
$973
2012
2013
2014
4KINROSS GOLD 2014 ANNUAL REPORT
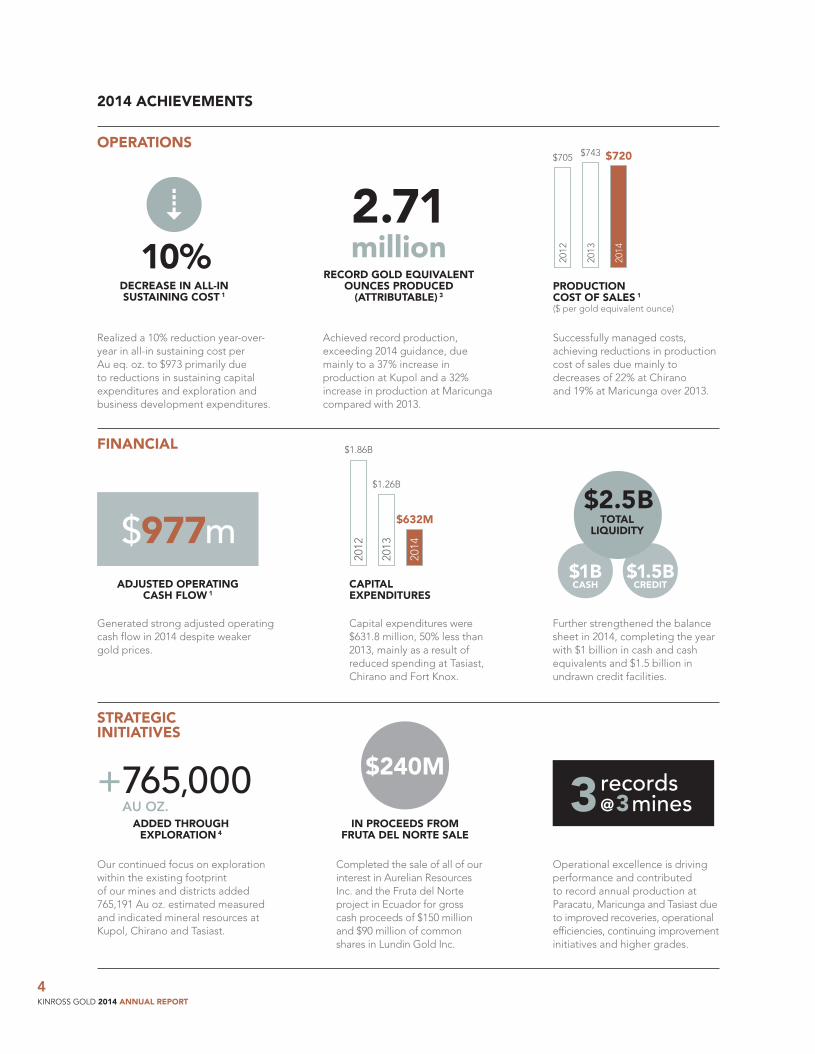
2014 ACHIEVEMENTS
OPERATIONS
Generated strong adjusted operating cash flow in 2014 despite weaker gold prices.
Our continued focus on exploration within the existing footprint of our mines and districts added 765,191 Au oz. estimated measured and indicated mineral resources at Kupol, Chirano and Tasiast.
Achieved record production, exceeding 2014 guidance, due mainly to a 37% increase in production at Kupol and a 32% increase in production at Maricunga compared with 2013.
Successfully managed costs, achieving reductions in production cost of sales due mainly to decreases of 22% at Chirano and 19% at Maricunga over 2013.
Capital expenditures were $631.8 million, 50% less than 2013, mainly as a result of reduced spending at Tasiast, Chirano and Fort Knox.
Further strengthened the balance sheet in 2014, completing the year with $1 billion in cash and cash equivalents and $1.5 billion in undrawn credit facilities.
Realized a 10% reduction year-over-year in all-in sustaining cost per Au eq. oz. to $973 primarily due to reductions in sustaining capital expenditures and exploration and business development expenditures.
Operational excellence is driving performance and contributed to record annual production at Paracatu, Maricunga and Tasiast due to improved recoveries, operational efficiencies, continuing improvement initiatives and higher grades.
FINANCIAL
STRATEGIC INITIATIVES
2.71 million
RECORD GOLD EQUIVALENT OUNCES PRODUCED
(ATTRIBUTABLE) 3
$977mADJUSTED OPERATING
CASH FLOW 1
PRODUCTION COST OF SALES 1
($ per gold equivalent ounce)
$705 $743 $720
2012
2013
2014
CAPITAL EXPENDITURES
$1.86B
$1.26B
$632M
2012
2013
2014
Completed the sale of all of our interest in Aurelian Resources Inc. and the Fruta del Norte project in Ecuador for gross cash proceeds of $150 million and $90 million of common shares in Lundin Gold Inc.
+765,000 AU OZ.
ADDED THROUGH EXPLORATION 4
10%DECREASE IN ALL-IN SUSTAINING COST 1
6
records@3mines3
$1B $1.5B
$2.5BTOTAL
LIQUIDITY
CASH CREDIT
$240M
IN PROCEEDS FROM FRUTA DEL NORTE SALE
5KINROSS GOLD 2014 ANNUAL REPORT
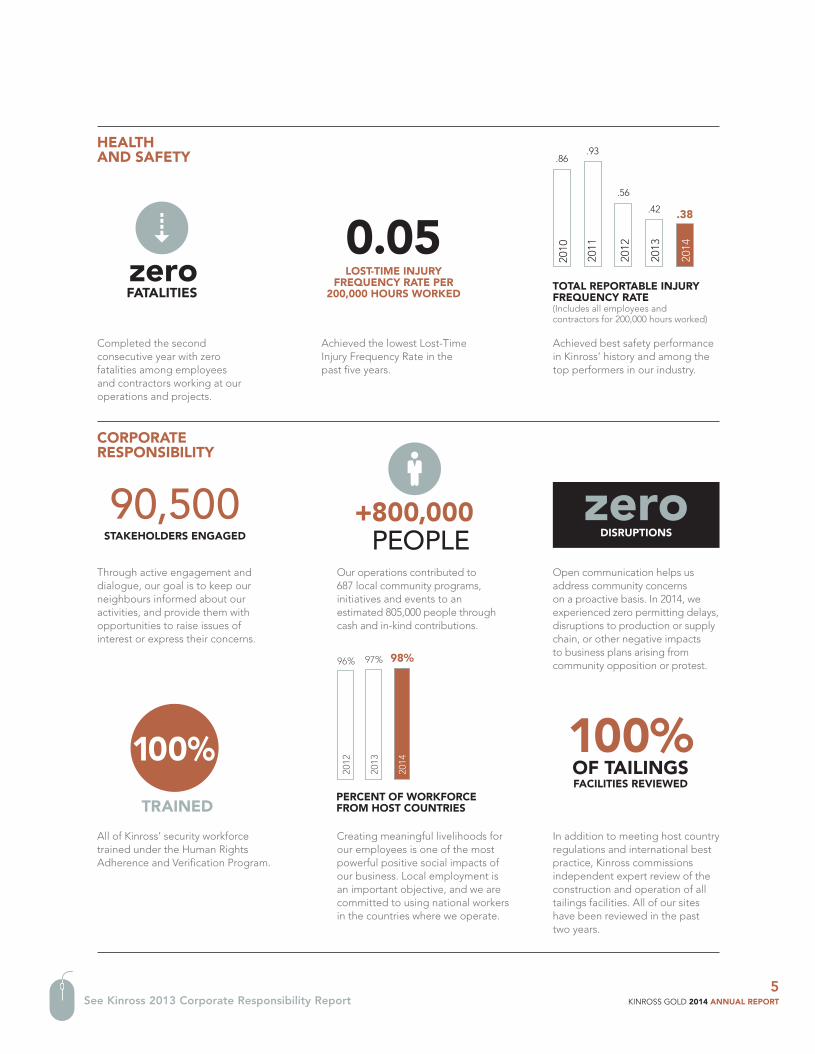
Completed the second consecutive year with zero fatalities among employees and contractors working at our operations and projects.
Achieved the lowest Lost-Time Injury Frequency Rate in the past five years.
Achieved best safety performance in Kinross’ history and among the top performers in our industry.
Through active engagement and dialogue, our goal is to keep our neighbours informed about our activities, and provide them with opportunities to raise issues of interest or express their concerns.
In addition to meeting host country regulations and international best practice, Kinross commissions independent expert review of the construction and operation of all tailings facilities. All of our sites have been reviewed in the past two years.
CORPORATE RESPONSIBILITY
HEALTH AND SAFETY
TOTAL REPORTABLE INJURY FREQUENCY RATE
(Includes all employees and contractors for 200,000 hours worked)
0.05LOST-TIME INJURY
FREQUENCY RATE PER 200,000 HOURS WORKED
.86.93
.56
.42 .38
2010
2011
2012
2013
2014
All of Kinross’ security workforce trained under the Human Rights Adherence and Verification Program.
TRAINED
100%
Open communication helps us address community concerns on a proactive basis. In 2014, we experienced zero permitting delays, disruptions to production or supply chain, or other negative impacts to business plans arising from community opposition or protest.
zeroDISRUPTIONS
90,500STAKEHOLDERS ENGAGED
100%OF TAILINGSFACILITIES REVIEWED
Our operations contributed to 687 local community programs, initiatives and events to an estimated 805,000 people through cash and in-kind contributions.
+ 800,000 PEOPLE
FATALITIESzero6
See Kinross 2013 Corporate Responsibility Report
Creating meaningful livelihoods for our employees is one of the most powerful positive social impacts of our business. Local employment is an important objective, and we are committed to using national workers in the countries where we operate.
PERCENT OF WORKFORCE FROM HOST COUNTRIES
96% 97% 98%
2012
2013
2014

6KINROSS GOLD 2014 ANNUAL REPORT
DIRECTORS*
JOHN A. BROUGHCorporate Director A, H
JOHN K. CARRINGTONCorporate Director CRT
JOHN M.H. HUXLEYCorporate Director A, CG, H
JOHN A. KEYES **
Corporate Director CRT
CATHERINE MCLEOD-SELTZERNon-Executive Chair, Bear Creek Mining Corporation H , CRT
JOHN E. OLIVERIndependent Chair H
UNA M. POWERChief Financial Officer and Senior Vice-President, Corporate Planning and Business Development, Nexen Inc. A, CRT
TERENCE C.W. REID **
Corporate Director A, CG
J. PAUL ROLLINSONPresident and Chief Executive Officer, Kinross Gold Corporation
RUTH G. WOODS **
Chief Operating Officer, Osler, Hoskin & Harcourt LLP CG, H
SENIOR LEADERSHIP TEAM
J. PAUL ROLLINSON President and Chief Executive Officer
JAMES CROSSLAND Executive Vice-President, Corporate Affairs
TONY S. GIARDINI Executive Vice-President and Chief Financial Officer
GEOFFREY P. GOLD Executive Vice-President, Corporate Development and Human Resources, Chief Legal Officer
WARWICK MORLEY-JEPSON Executive Vice-President and Chief Operating Officer
2014 CORPORATE GOVERNANCE HIGHLIGHTS
• The Board of Directors met six times in 2014, each meeting independent of management.
• Kinross ranked 41st out of 247 Canadian companies in the Globe and Mail annual corporate governance survey.
• Scored 132 out of 150 points on the Board Shareholder Confidence Index of the Clarkson Centre for Board Effectiveness.
• All directors, except the CEO, were independent and all committees were comprised solely of independent directors.
• Implemented a policy to increase Board diversity, with a 33% target of women directors.
• Approved policy which limits the term for Directors to 10 to 15 years, in addition to a mandatory retirement age of 73.
Read the annual report online:
2014ANNUALREPORT.KINROSS.COM
A Audit and Risk CommitteeCG Corporate Governance and
Nominating CommitteeCRT Corporate Responsibility
and Technical CommitteeH Human Resource and
Compensation Committee
* Kenneth C. Irving resigned from the Board on February 10, 2015.
** Will not be standing for re-election at Kinross’ 2015 Annual and Special Shareholders Meeting.
7KINROSS GOLD 2014 ANNUAL REPORT
FINANCIAL REVIEW Management’s Discussion and Analysis
MDA1
Management’s Responsibility for Financial Statements
FS1
Independent Auditors’ Report of Registered Public Accounting Firm
FS2
Consolidated Financial Statements and Notes
FS3
Mineral Reserve and Mineral Resource Statement
67
Summarized Five-Year Review
74
Kinross Share Trading Data 74
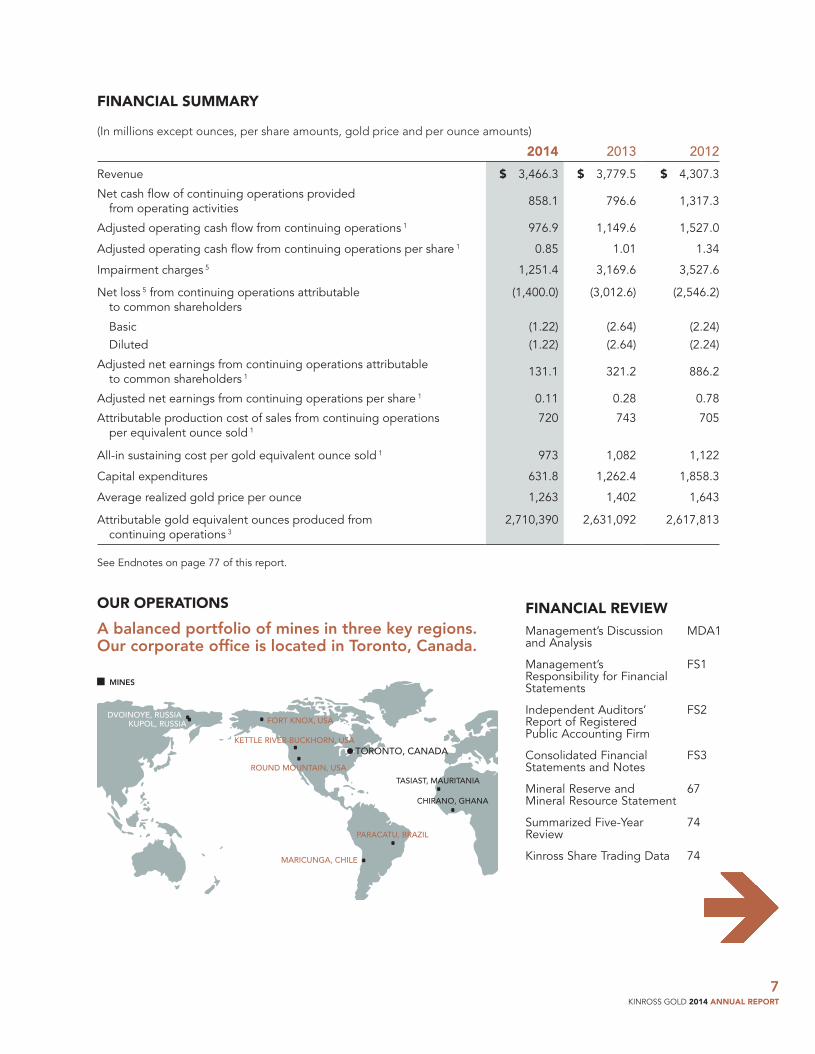
OUR OPERATIONS
A balanced portfolio of mines in three key regions. Our corporate office is located in Toronto, Canada.
FORT KNOX, USADVOINOYE, RUSSIA
KUPOL, RUSSIA
KETTLE RIVER-BUCKHORN, USA
ROUND MOUNTAIN, USA
TORONTO, CANADA
PARACATU, BRAZIL
MARICUNGA, CHILE
TASIAST, MAURITANIA
CHIRANO, GHANA
MINES
FINANCIAL SUMMARY
(In millions except ounces, per share amounts, gold price and per ounce amounts)
2014 2013 2012
Revenue $ 3,466.3 $ 3,779.5 $ 4,307.3
Net cash flow of continuing operations provided from operating activities
858.1 796.6 1,317.3
Adjusted operating cash flow from continuing operations 1 976.9 1,149.6 1,527.0
Adjusted operating cash flow from continuing operations per share 1 0.85 1.01 1.34
Impairment charges 5 1,251.4 3,169.6 3,527.6
Net loss 5 from continuing operations attributable to common shareholders
(1,400.0) (3,012.6) (2,546.2)
Basic (1.22) (2.64) (2.24) Diluted (1.22) (2.64) (2.24)
Adjusted net earnings from continuing operations attributable to common shareholders 1 131.1 321.2 886.2
Adjusted net earnings from continuing operations per share 1 0.11 0.28 0.78
Attributable production cost of sales from continuing operations per equivalent ounce sold 1
720 743 705
All-in sustaining cost per gold equivalent ounce sold 1 973 1,082 1,122
Capital expenditures 631.8 1,262.4 1,858.3
Average realized gold price per ounce 1,263 1,402 1,643
Attributable gold equivalent ounces produced from continuing operations 3
2,710,390 2,631,092 2,617,813
See Endnotes on page 77 of this report.
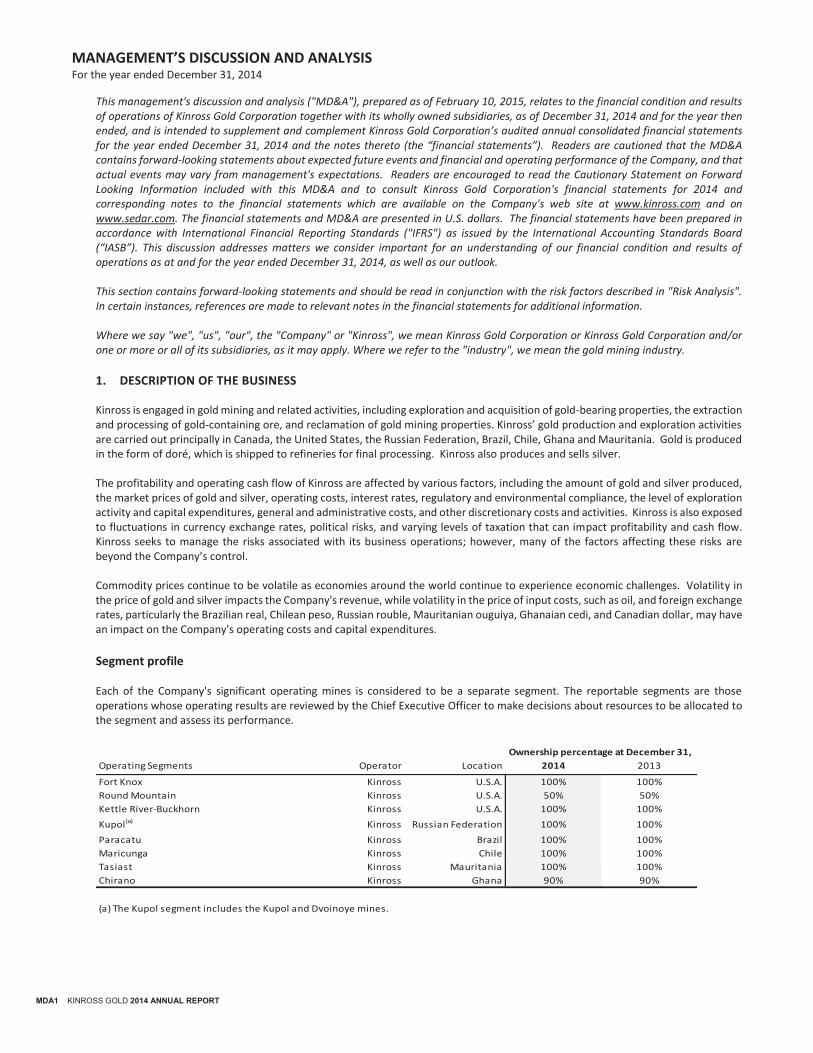
MANAGEMENT’S DISCUSSION AND ANALYSIS For the year ended December 31, 2014
MDA1 KINROSS GOLD 2014 ANNUAL REPORT
This management's discussion and analysis ("MD&A"), prepared as of February 10, 2015, relates to the financial condition and results of operations of Kinross Gold Corporation together with its wholly owned subsidiaries, as of December 31, 2014 and for the year then ended, and is intended to supplement and complement Kinross Gold Corporation’s audited annual consolidated financial statements for the year ended December 31, 2014 and the notes thereto (the “financial statements”). Readers are cautioned that the MD&A contains forward-looking statements about expected future events and financial and operating performance of the Company, and that actual events may vary from management's expectations. Readers are encouraged to read the Cautionary Statement on Forward Looking Information included with this MD&A and to consult Kinross Gold Corporation's financial statements for 2014 and corresponding notes to the financial statements which are available on the Company's web site at www.kinross.com and on www.sedar.com. The financial statements and MD&A are presented in U.S. dollars. The financial statements have been prepared in accordance with International Financial Reporting Standards ("IFRS") as issued by the International Accounting Standards Board (“IASB”). This discussion addresses matters we consider important for an understanding of our financial condition and results of operations as at and for the year ended December 31, 2014, as well as our outlook. This section contains forward-looking statements and should be read in conjunction with the risk factors described in "Risk Analysis". In certain instances, references are made to relevant notes in the financial statements for additional information. Where we say "we", "us", "our", the "Company" or "Kinross", we mean Kinross Gold Corporation or Kinross Gold Corporation and/or one or more or all of its subsidiaries, as it may apply. Where we refer to the "industry", we mean the gold mining industry.
1. DESCRIPTION OF THE BUSINESS Kinross is engaged in gold mining and related activities, including exploration and acquisition of gold-bearing properties, the extraction and processing of gold-containing ore, and reclamation of gold mining properties. Kinross’ gold production and exploration activities are carried out principally in Canada, the United States, the Russian Federation, Brazil, Chile, Ghana and Mauritania. Gold is produced in the form of doré, which is shipped to refineries for final processing. Kinross also produces and sells silver. The profitability and operating cash flow of Kinross are affected by various factors, including the amount of gold and silver produced, the market prices of gold and silver, operating costs, interest rates, regulatory and environmental compliance, the level of exploration activity and capital expenditures, general and administrative costs, and other discretionary costs and activities. Kinross is also exposed to fluctuations in currency exchange rates, political risks, and varying levels of taxation that can impact profitability and cash flow. Kinross seeks to manage the risks associated with its business operations; however, many of the factors affecting these risks are beyond the Company’s control. Commodity prices continue to be volatile as economies around the world continue to experience economic challenges. Volatility in the price of gold and silver impacts the Company's revenue, while volatility in the price of input costs, such as oil, and foreign exchange rates, particularly the Brazilian real, Chilean peso, Russian rouble, Mauritanian ouguiya, Ghanaian cedi, and Canadian dollar, may have an impact on the Company's operating costs and capital expenditures.
Segment profile Each of the Company's significant operating mines is considered to be a separate segment. The reportable segments are those operations whose operating results are reviewed by the Chief Executive Officer to make decisions about resources to be allocated to the segment and assess its performance.
Operating Segments Operator Location 2014 2013
Fort Knox Kinross U.S.A. 100% 100%
Round Mountain Kinross U.S.A. 50% 50%
Kettle River-Buckhorn Kinross U.S.A. 100% 100%
Kupol(a) Kinross Russian Federation 100% 100%
Paracatu Kinross Brazil 100% 100%
Maricunga Kinross Chile 100% 100%
Tasiast Kinross Mauritania 100% 100%
Chirano Kinross Ghana 90% 90%
(a) The Kupol segment includes the Kupol and Dvoinoye mines.
Ownership percentage at December 31,
MANAGEMENT’S DISCUSSION AND ANALYSIS For the year ended December 31, 2014
KINROSS GOLD 2014 ANNUAL REPORT MDA2
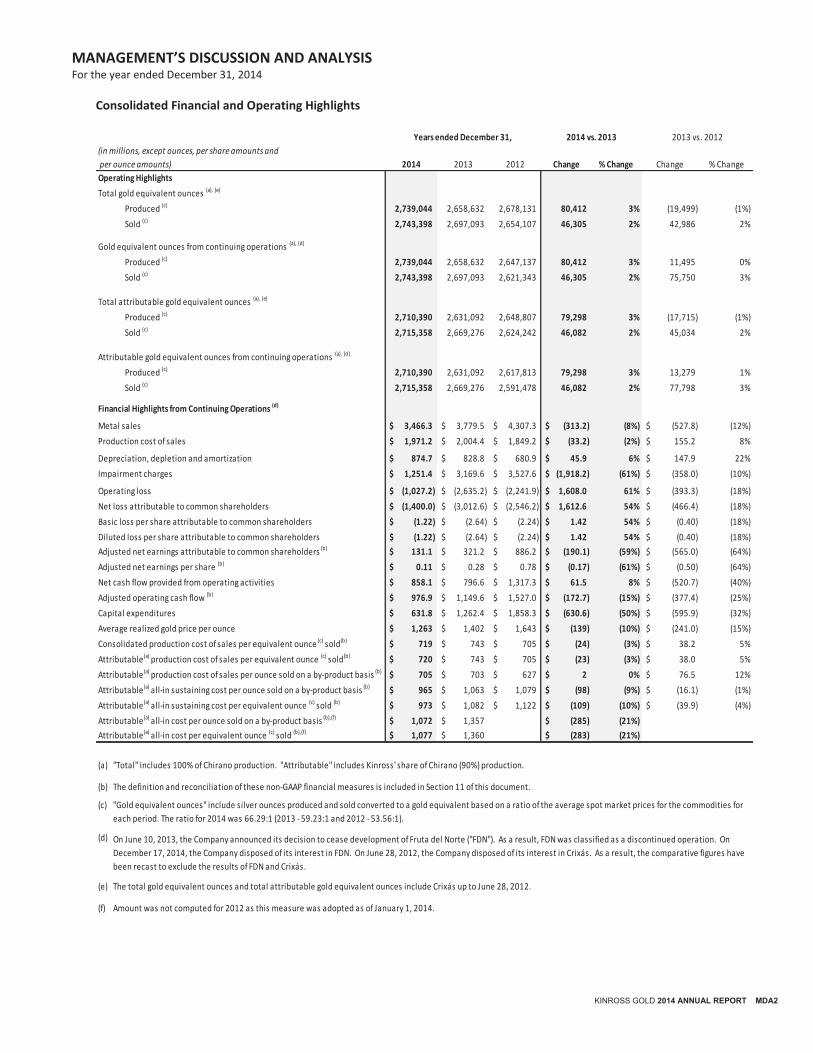
Consolidated Financial and Operating Highlights
2014 2013 2012 Change % Change Change % Change
Operating Highlights
Total gold equivalent ounces (a), (e)
Produced (c) 2,739,044 2,658,632 2,678,131 80,412 3% (19,499) (1%)
Sold (c) 2,743,398 2,697,093 2,654,107 46,305 2% 42,986 2%
Gold equivalent ounces from continuing operations (a), (d)
Produced (c) 2,739,044 2,658,632 2,647,137 80,412 3% 11,495 0%
Sold (c) 2,743,398 2,697,093 2,621,343 46,305 2% 75,750 3%
Total attributable gold equivalent ounces (a), (e)
Produced (c) 2,710,390 2,631,092 2,648,807 79,298 3% (17,715) (1%)
Sold (c) 2,715,358 2,669,276 2,624,242 46,082 2% 45,034 2%
Attributable gold equivalent ounces from continuing operations (a), (d)
Produced (c) 2,710,390 2,631,092 2,617,813 79,298 3% 13,279 1%
Sold (c) 2,715,358 2,669,276 2,591,478 46,082 2% 77,798 3%
Financial Highlights from Continuing Operations (d)
Metal sales 3,466.3$ 3,779.5$ 4,307.3$ (313.2)$ (8%) (527.8)$ (12%)
Production cost of sales 1,971.2$ 2,004.4$ 1,849.2$ (33.2)$ (2%) 155.2$ 8%
Depreciation, depletion and amortization 874.7$ 828.8$ 680.9$ 45.9$ 6% 147.9$ 22%
Impairment charges 1,251.4$ 3,169.6$ 3,527.6$ (1,918.2)$ (61%) (358.0)$ (10%)
Operating loss (1,027.2)$ (2,635.2)$ (2,241.9)$ 1,608.0$ 61% (393.3)$ (18%)
(1,400.0)$ (3,012.6)$ (2,546.2)$ 1,612.6$ 54% (466.4)$ (18%)
(1.22)$ (2.64)$ (2.24)$ 1.42$ 54% (0.40)$ (18%)
(1.22)$ (2.64)$ (2.24)$ 1.42$ 54% (0.40)$ (18%)
131.1$ 321.2$ 886.2$ (190.1)$ (59%) (565.0)$ (64%)
0.11$ 0.28$ 0.78$ (0.17)$ (61%) (0.50)$ (64%)
858.1$ 796.6$ 1,317.3$ 61.5$ 8% (520.7)$ (40%)
976.9$ 1,149.6$ 1,527.0$ (172.7)$ (15%) (377.4)$ (25%)
631.8$ 1,262.4$ 1,858.3$ (630.6)$ (50%) (595.9)$ (32%)
1,263$ 1,402$ 1,643$ (139)$ (10%) (241.0)$ (15%)
719$ 743$ 705$ (24)$ (3%) 38.2$ 5%
720$ 743$ 705$ (23)$ (3%) 38.0$ 5%
705$ 703$ 627$ 2$ 0% 76.5$ 12%
965$ 1,063$ 1,079$ (98)$ (9%) (16.1)$ (1%)
973$ 1,082$ 1,122$ (109)$ (10%) (39.9)$ (4%)
1,072$ 1,357$ (285)$ (21%)
1,077$ 1,360$ (283)$ (21%)
(a)
(b)
(c)
(d)
(e)
(f)
On June 10, 2013, the Company announced its decision to cease development of Fruta del Norte ("FDN"). As a result, FDN was classified as a discontinued operation. On
December 17, 2014, the Company disposed of its interest in FDN. On June 28, 2012, the Company disposed of its interest in Crixás. As a result, the comparative figures have
been recast to exclude the results of FDN and Crixás.
"Gold equivalent ounces" include silver ounces produced and sold converted to a gold equivalent based on a ratio of the average spot market prices for the commodities for
each period. The ratio for 2014 was 66.29:1 (2013 - 59.23:1 and 2012 - 53.56:1).
"Total" includes 100% of Chirano production. "Attributable" includes Kinross' share of Chirano (90%) production.
The definition and reconciliation of these non-GAAP financial measures is included in Section 11 of this document.
The total gold equivalent ounces and total attributable gold equivalent ounces include Crixás up to June 28, 2012.
Capital expenditures
Amount was not computed for 2012 as this measure was adopted as of January 1, 2014.
Attributable (a) production cost of sales per equivalent ounce (c) sold(b)
2013 vs. 2012Years ended December 31, 2014 vs. 2013
(in millions, except ounces, per share amounts and
per ounce amounts)
Attributable (a) all-in cost per equivalent ounce (c) sold (b),(f)
Attributable (a) production cost of sales per ounce sold on a by-product basis (b)
Adjusted net earnings attributable to common shareholders (b)
Adjusted net earnings per share (b)
Net cash flow provided from operating activities
Adjusted operating cash flow (b)
Average realized gold price per ounce
Net loss attributable to common shareholders
Basic loss per share attributable to common shareholders
Diluted loss per share attributable to common shareholders
Attributable (a) all-in sustaining cost per ounce sold on a by-product basis (b)
Attributable (a) all-in sustaining cost per equivalent ounce (c) sold (b)
Attributable (a) all-in cost per ounce sold on a by-product basis (b),(f)
Consolidated production cost of sales per equivalent ounce (c) sold(b)
MANAGEMENT’S DISCUSSION AND ANALYSIS For the year ended December 31, 2014
MDA3 KINROSS GOLD 2014 ANNUAL REPORT
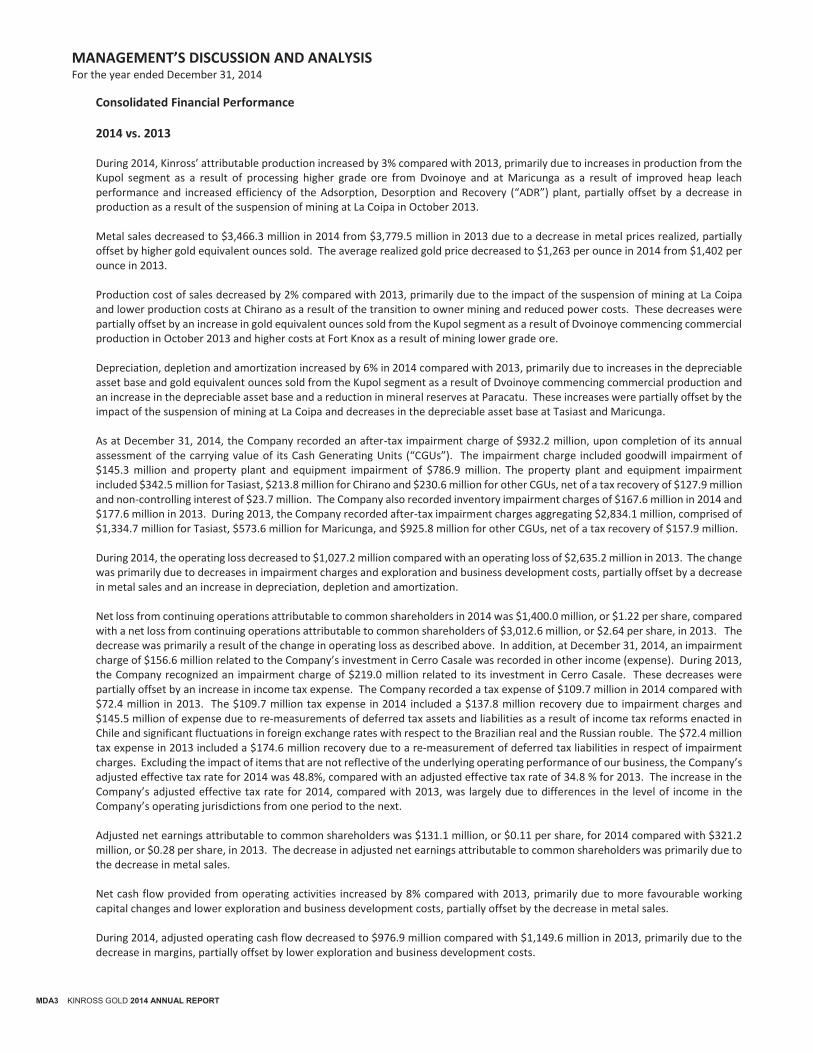
Consolidated Financial Performance
2014 vs. 2013 During 2014, Kinross’ attributable production increased by 3% compared with 2013, primarily due to increases in production from the Kupol segment as a result of processing higher grade ore from Dvoinoye and at Maricunga as a result of improved heap leach performance and increased efficiency of the Adsorption, Desorption and Recovery (“ADR”) plant, partially offset by a decrease in production as a result of the suspension of mining at La Coipa in October 2013. Metal sales decreased to $3,466.3 million in 2014 from $3,779.5 million in 2013 due to a decrease in metal prices realized, partially offset by higher gold equivalent ounces sold. The average realized gold price decreased to $1,263 per ounce in 2014 from $1,402 per ounce in 2013. Production cost of sales decreased by 2% compared with 2013, primarily due to the impact of the suspension of mining at La Coipa and lower production costs at Chirano as a result of the transition to owner mining and reduced power costs. These decreases were partially offset by an increase in gold equivalent ounces sold from the Kupol segment as a result of Dvoinoye commencing commercial production in October 2013 and higher costs at Fort Knox as a result of mining lower grade ore. Depreciation, depletion and amortization increased by 6% in 2014 compared with 2013, primarily due to increases in the depreciable asset base and gold equivalent ounces sold from the Kupol segment as a result of Dvoinoye commencing commercial production and an increase in the depreciable asset base and a reduction in mineral reserves at Paracatu. These increases were partially offset by the impact of the suspension of mining at La Coipa and decreases in the depreciable asset base at Tasiast and Maricunga. As at December 31, 2014, the Company recorded an after-tax impairment charge of $932.2 million, upon completion of its annual assessment of the carrying value of its Cash Generating Units (“CGUs”). The impairment charge included goodwill impairment of $145.3 million and property plant and equipment impairment of $786.9 million. The property plant and equipment impairment included $342.5 million for Tasiast, $213.8 million for Chirano and $230.6 million for other CGUs, net of a tax recovery of $127.9 million and non-controlling interest of $23.7 million. The Company also recorded inventory impairment charges of $167.6 million in 2014 and $177.6 million in 2013. During 2013, the Company recorded after-tax impairment charges aggregating $2,834.1 million, comprised of $1,334.7 million for Tasiast, $573.6 million for Maricunga, and $925.8 million for other CGUs, net of a tax recovery of $157.9 million. During 2014, the operating loss decreased to $1,027.2 million compared with an operating loss of $2,635.2 million in 2013. The change was primarily due to decreases in impairment charges and exploration and business development costs, partially offset by a decrease in metal sales and an increase in depreciation, depletion and amortization. Net loss from continuing operations attributable to common shareholders in 2014 was $1,400.0 million, or $1.22 per share, compared with a net loss from continuing operations attributable to common shareholders of $3,012.6 million, or $2.64 per share, in 2013. The decrease was primarily a result of the change in operating loss as described above. In addition, at December 31, 2014, an impairment charge of $156.6 million related to the Company’s investment in Cerro Casale was recorded in other income (expense). During 2013, the Company recognized an impairment charge of $219.0 million related to its investment in Cerro Casale. These decreases were partially offset by an increase in income tax expense. The Company recorded a tax expense of $109.7 million in 2014 compared with $72.4 million in 2013. The $109.7 million tax expense in 2014 included a $137.8 million recovery due to impairment charges and $145.5 million of expense due to re-measurements of deferred tax assets and liabilities as a result of income tax reforms enacted in Chile and significant fluctuations in foreign exchange rates with respect to the Brazilian real and the Russian rouble. The $72.4 million tax expense in 2013 included a $174.6 million recovery due to a re-measurement of deferred tax liabilities in respect of impairment charges. Excluding the impact of items that are not reflective of the underlying operating performance of our business, the Company’s adjusted effective tax rate for 2014 was 48.8%, compared with an adjusted effective tax rate of 34.8 % for 2013. The increase in the Company’s adjusted effective tax rate for 2014, compared with 2013, was largely due to differences in the level of income in the Company’s operating jurisdictions from one period to the next. Adjusted net earnings attributable to common shareholders was $131.1 million, or $0.11 per share, for 2014 compared with $321.2 million, or $0.28 per share, in 2013. The decrease in adjusted net earnings attributable to common shareholders was primarily due to the decrease in metal sales. Net cash flow provided from operating activities increased by 8% compared with 2013, primarily due to more favourable working capital changes and lower exploration and business development costs, partially offset by the decrease in metal sales. During 2014, adjusted operating cash flow decreased to $976.9 million compared with $1,149.6 million in 2013, primarily due to the decrease in margins, partially offset by lower exploration and business development costs.
MANAGEMENT’S DISCUSSION AND ANALYSIS For the year ended December 31, 2014
KINROSS GOLD 2014 ANNUAL REPORT MDA4
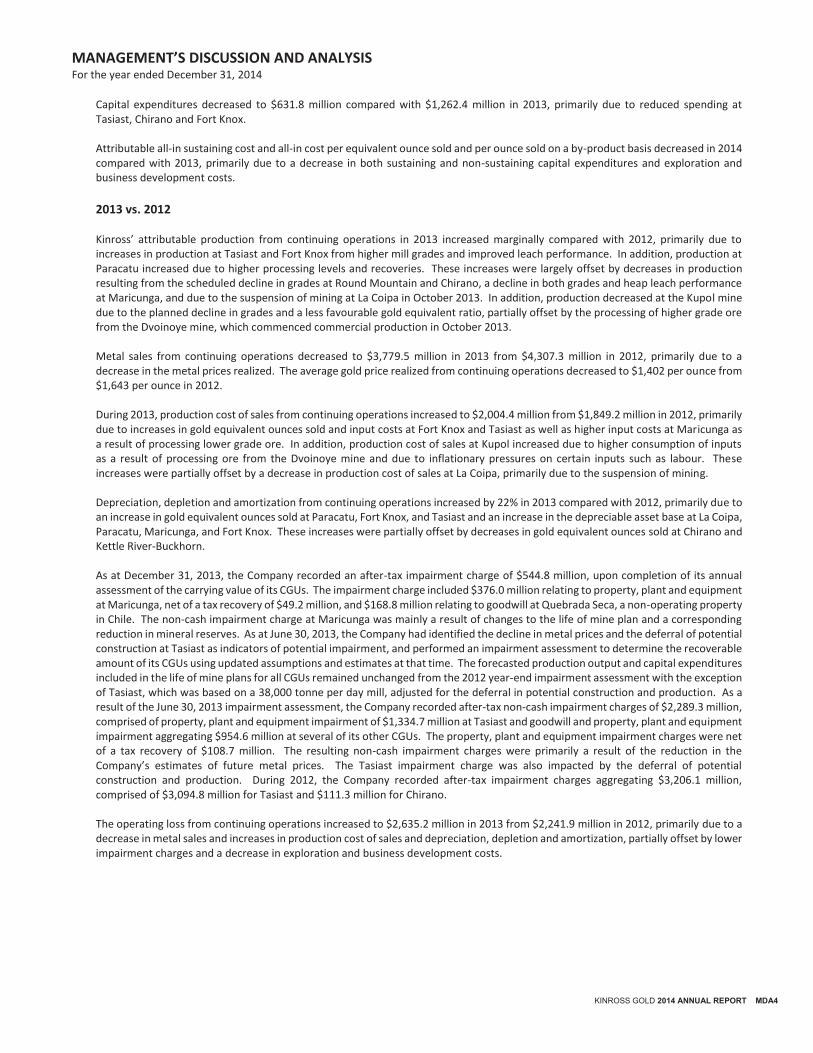
Capital expenditures decreased to $631.8 million compared with $1,262.4 million in 2013, primarily due to reduced spending at Tasiast, Chirano and Fort Knox. Attributable all-in sustaining cost and all-in cost per equivalent ounce sold and per ounce sold on a by-product basis decreased in 2014 compared with 2013, primarily due to a decrease in both sustaining and non-sustaining capital expenditures and exploration and business development costs.
2013 vs. 2012 Kinross’ attributable production from continuing operations in 2013 increased marginally compared with 2012, primarily due to increases in production at Tasiast and Fort Knox from higher mill grades and improved leach performance. In addition, production at Paracatu increased due to higher processing levels and recoveries. These increases were largely offset by decreases in production resulting from the scheduled decline in grades at Round Mountain and Chirano, a decline in both grades and heap leach performance at Maricunga, and due to the suspension of mining at La Coipa in October 2013. In addition, production decreased at the Kupol mine due to the planned decline in grades and a less favourable gold equivalent ratio, partially offset by the processing of higher grade ore from the Dvoinoye mine, which commenced commercial production in October 2013. Metal sales from continuing operations decreased to $3,779.5 million in 2013 from $4,307.3 million in 2012, primarily due to a decrease in the metal prices realized. The average gold price realized from continuing operations decreased to $1,402 per ounce from $1,643 per ounce in 2012. During 2013, production cost of sales from continuing operations increased to $2,004.4 million from $1,849.2 million in 2012, primarily due to increases in gold equivalent ounces sold and input costs at Fort Knox and Tasiast as well as higher input costs at Maricunga as a result of processing lower grade ore. In addition, production cost of sales at Kupol increased due to higher consumption of inputs as a result of processing ore from the Dvoinoye mine and due to inflationary pressures on certain inputs such as labour. These increases were partially offset by a decrease in production cost of sales at La Coipa, primarily due to the suspension of mining. Depreciation, depletion and amortization from continuing operations increased by 22% in 2013 compared with 2012, primarily due to an increase in gold equivalent ounces sold at Paracatu, Fort Knox, and Tasiast and an increase in the depreciable asset base at La Coipa, Paracatu, Maricunga, and Fort Knox. These increases were partially offset by decreases in gold equivalent ounces sold at Chirano and Kettle River-Buckhorn. As at December 31, 2013, the Company recorded an after-tax impairment charge of $544.8 million, upon completion of its annual assessment of the carrying value of its CGUs. The impairment charge included $376.0 million relating to property, plant and equipment at Maricunga, net of a tax recovery of $49.2 million, and $168.8 million relating to goodwill at Quebrada Seca, a non-operating property in Chile. The non-cash impairment charge at Maricunga was mainly a result of changes to the life of mine plan and a corresponding reduction in mineral reserves. As at June 30, 2013, the Company had identified the decline in metal prices and the deferral of potential construction at Tasiast as indicators of potential impairment, and performed an impairment assessment to determine the recoverable amount of its CGUs using updated assumptions and estimates at that time. The forecasted production output and capital expenditures included in the life of mine plans for all CGUs remained unchanged from the 2012 year-end impairment assessment with the exception of Tasiast, which was based on a 38,000 tonne per day mill, adjusted for the deferral in potential construction and production. As a result of the June 30, 2013 impairment assessment, the Company recorded after-tax non-cash impairment charges of $2,289.3 million, comprised of property, plant and equipment impairment of $1,334.7 million at Tasiast and goodwill and property, plant and equipment impairment aggregating $954.6 million at several of its other CGUs. The property, plant and equipment impairment charges were net of a tax recovery of $108.7 million. The resulting non-cash impairment charges were primarily a result of the reduction in the Company’s estimates of future metal prices. The Tasiast impairment charge was also impacted by the deferral of potential construction and production. During 2012, the Company recorded after-tax impairment charges aggregating $3,206.1 million, comprised of $3,094.8 million for Tasiast and $111.3 million for Chirano. The operating loss from continuing operations increased to $2,635.2 million in 2013 from $2,241.9 million in 2012, primarily due to a decrease in metal sales and increases in production cost of sales and depreciation, depletion and amortization, partially offset by lower impairment charges and a decrease in exploration and business development costs.
MANAGEMENT’S DISCUSSION AND ANALYSIS For the year ended December 31, 2014
MDA5 KINROSS GOLD 2014 ANNUAL REPORT
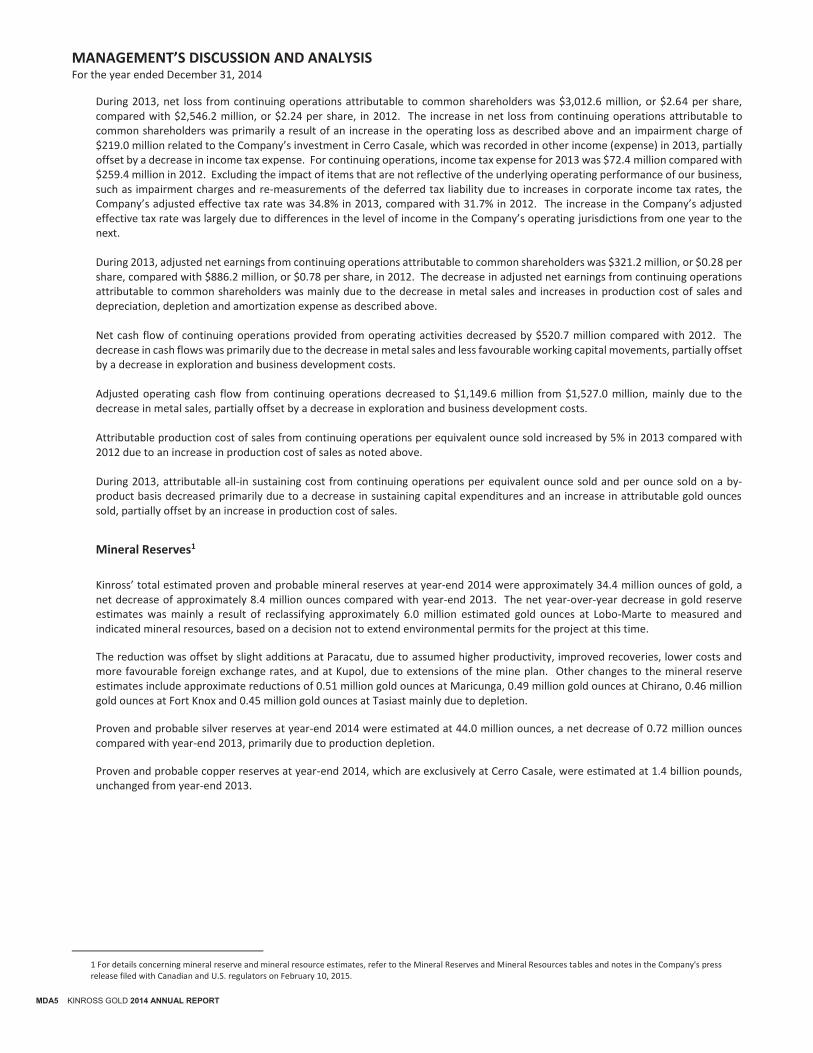
During 2013, net loss from continuing operations attributable to common shareholders was $3,012.6 million, or $2.64 per share, compared with $2,546.2 million, or $2.24 per share, in 2012. The increase in net loss from continuing operations attributable to common shareholders was primarily a result of an increase in the operating loss as described above and an impairment charge of $219.0 million related to the Company’s investment in Cerro Casale, which was recorded in other income (expense) in 2013, partially offset by a decrease in income tax expense. For continuing operations, income tax expense for 2013 was $72.4 million compared with $259.4 million in 2012. Excluding the impact of items that are not reflective of the underlying operating performance of our business, such as impairment charges and re-measurements of the deferred tax liability due to increases in corporate income tax rates, the Company’s adjusted effective tax rate was 34.8% in 2013, compared with 31.7% in 2012. The increase in the Company’s adjusted effective tax rate was largely due to differences in the level of income in the Company’s operating jurisdictions from one year to the next. During 2013, adjusted net earnings from continuing operations attributable to common shareholders was $321.2 million, or $0.28 per share, compared with $886.2 million, or $0.78 per share, in 2012. The decrease in adjusted net earnings from continuing operations attributable to common shareholders was mainly due to the decrease in metal sales and increases in production cost of sales and depreciation, depletion and amortization expense as described above. Net cash flow of continuing operations provided from operating activities decreased by $520.7 million compared with 2012. The decrease in cash flows was primarily due to the decrease in metal sales and less favourable working capital movements, partially offset by a decrease in exploration and business development costs. Adjusted operating cash flow from continuing operations decreased to $1,149.6 million from $1,527.0 million, mainly due to the decrease in metal sales, partially offset by a decrease in exploration and business development costs. Attributable production cost of sales from continuing operations per equivalent ounce sold increased by 5% in 2013 compared with 2012 due to an increase in production cost of sales as noted above. During 2013, attributable all-in sustaining cost from continuing operations per equivalent ounce sold and per ounce sold on a by-product basis decreased primarily due to a decrease in sustaining capital expenditures and an increase in attributable gold ounces sold, partially offset by an increase in production cost of sales.
Mineral Reserves1
Kinross’ total estimated proven and probable mineral reserves at year-end 2014 were approximately 34.4 million ounces of gold, a net decrease of approximately 8.4 million ounces compared with year-end 2013. The net year-over-year decrease in gold reserve estimates was mainly a result of reclassifying approximately 6.0 million estimated gold ounces at Lobo-Marte to measured and indicated mineral resources, based on a decision not to extend environmental permits for the project at this time.
The reduction was offset by slight additions at Paracatu, due to assumed higher productivity, improved recoveries, lower costs and more favourable foreign exchange rates, and at Kupol, due to extensions of the mine plan. Other changes to the mineral reserve estimates include approximate reductions of 0.51 million gold ounces at Maricunga, 0.49 million gold ounces at Chirano, 0.46 million gold ounces at Fort Knox and 0.45 million gold ounces at Tasiast mainly due to depletion.
Proven and probable silver reserves at year-end 2014 were estimated at 44.0 million ounces, a net decrease of 0.72 million ounces compared with year-end 2013, primarily due to production depletion.
Proven and probable copper reserves at year-end 2014, which are exclusively at Cerro Casale, were estimated at 1.4 billion pounds, unchanged from year-end 2013.
1 For details concerning mineral reserve and mineral resource estimates, refer to the Mineral Reserves and Mineral Resources tables and notes in the Company's press release filed with Canadian and U.S. regulators on February 10, 2015.
MANAGEMENT’S DISCUSSION AND ANALYSIS For the year ended December 31, 2014
KINROSS GOLD 2014 ANNUAL REPORT MDA6
2. IMPACT OF KEY ECONOMIC TRENDS
Price of Gold
Source: London Bullion Marketing Association London PM Fix, Bloomberg, GFMS, Company records
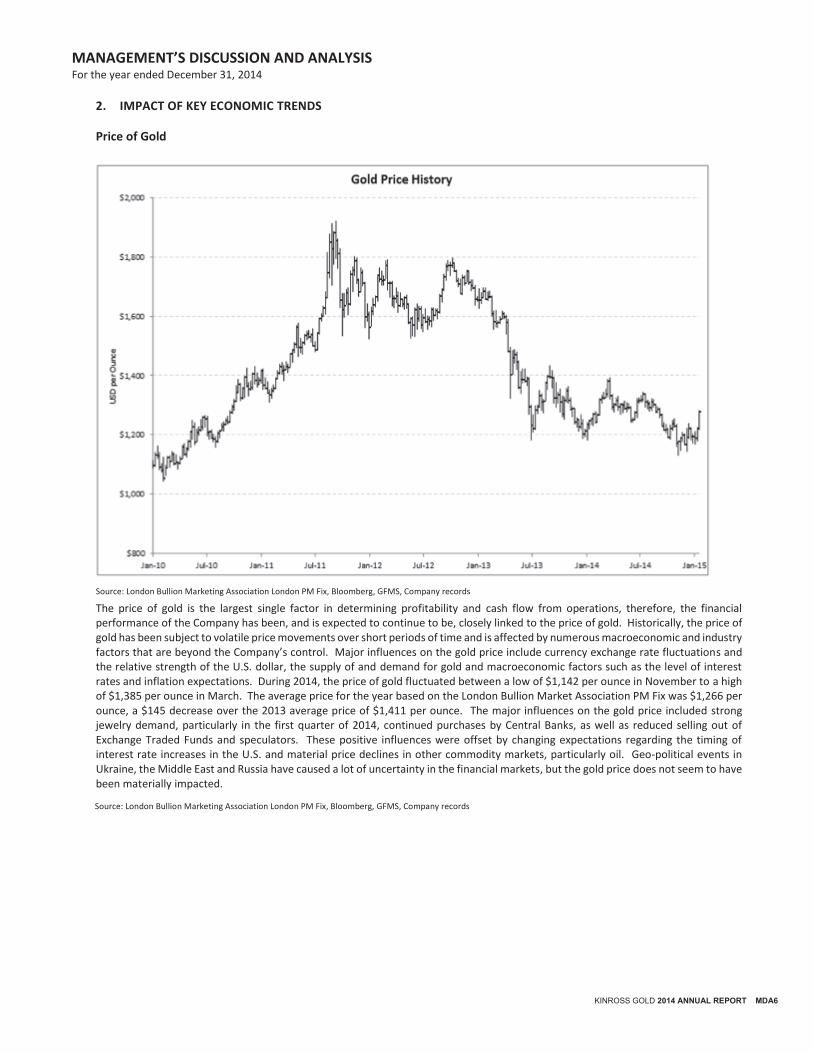
The price of gold is the largest single factor in determining profitability and cash flow from operations, therefore, the financial performance of the Company has been, and is expected to continue to be, closely linked to the price of gold. Historically, the price of gold has been subject to volatile price movements over short periods of time and is affected by numerous macroeconomic and industry factors that are beyond the Company’s control. Major influences on the gold price include currency exchange rate fluctuations and the relative strength of the U.S. dollar, the supply of and demand for gold and macroeconomic factors such as the level of interest rates and inflation expectations. During 2014, the price of gold fluctuated between a low of $1,142 per ounce in November to a high of $1,385 per ounce in March. The average price for the year based on the London Bullion Market Association PM Fix was $1,266 per ounce, a $145 decrease over the 2013 average price of $1,411 per ounce. The major influences on the gold price included strong jewelry demand, particularly in the first quarter of 2014, continued purchases by Central Banks, as well as reduced selling out of Exchange Traded Funds and speculators. These positive influences were offset by changing expectations regarding the timing of interest rate increases in the U.S. and material price declines in other commodity markets, particularly oil. Geo-political events in Ukraine, the Middle East and Russia have caused a lot of uncertainty in the financial markets, but the gold price does not seem to have been materially impacted.
Source: London Bullion Marketing Association London PM Fix, Bloomberg, GFMS, Company records
MANAGEMENT’S DISCUSSION AND ANALYSIS For the year ended December 31, 2014
MDA7 KINROSS GOLD 2014 ANNUAL REPORT
Source: London Bullion Marketing Association London PM Fix
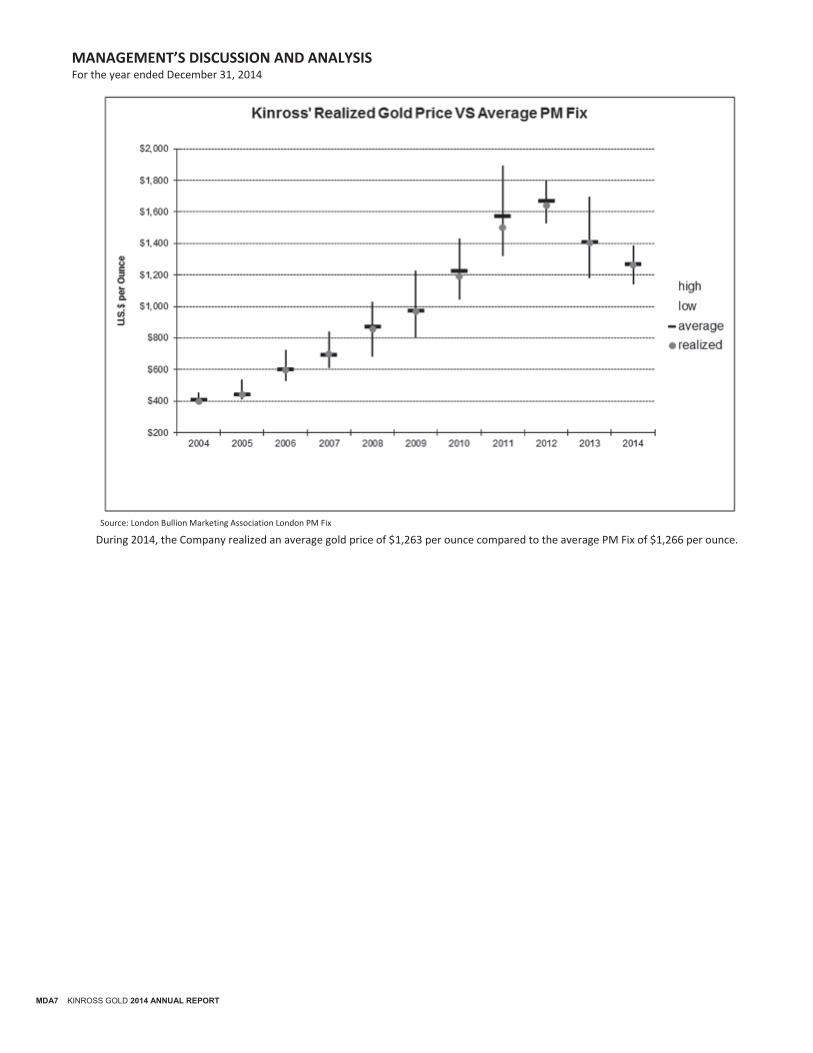
During 2014, the Company realized an average gold price of $1,263 per ounce compared to the average PM Fix of $1,266 per ounce.
MANAGEMENT’S DISCUSSION AND ANALYSIS For the year ended December 31, 2014
KINROSS GOLD 2014 ANNUAL REPORT MDA8
Gold Supply and Demand Fundamentals
Source: GFMS Gold Survey 2014
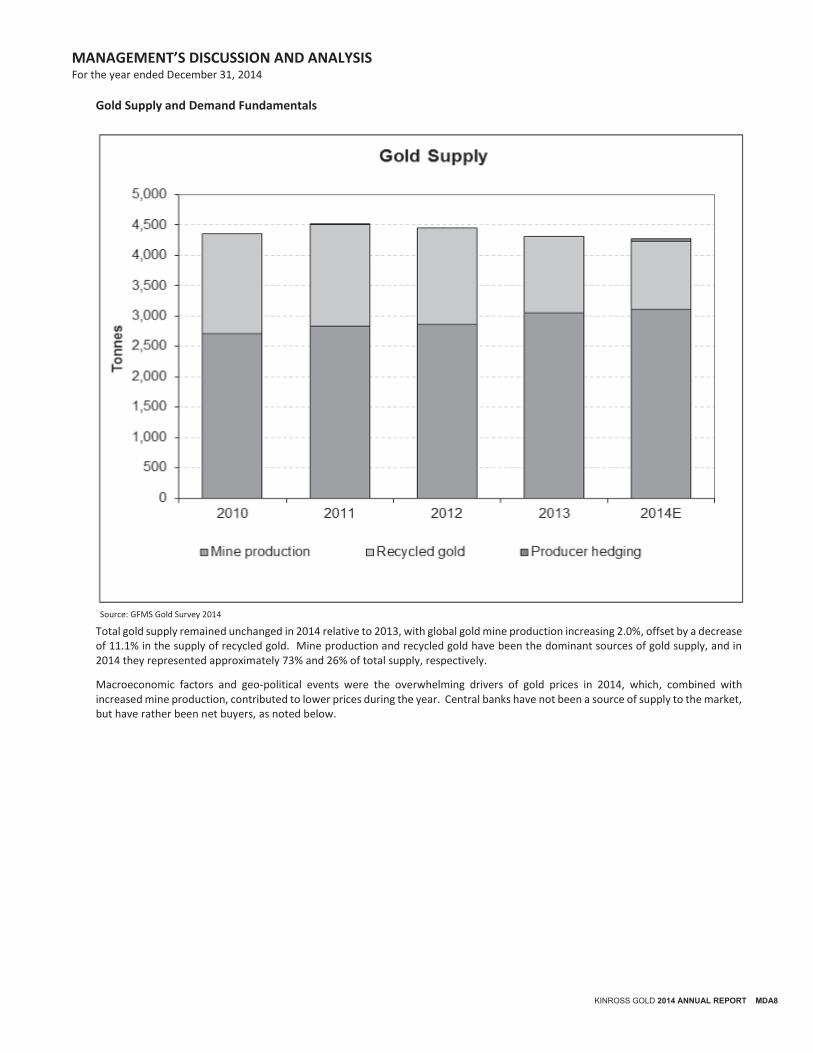
Total gold supply remained unchanged in 2014 relative to 2013, with global gold mine production increasing 2.0%, offset by a decrease of 11.1% in the supply of recycled gold. Mine production and recycled gold have been the dominant sources of gold supply, and in 2014 they represented approximately 73% and 26% of total supply, respectively.
Macroeconomic factors and geo-political events were the overwhelming drivers of gold prices in 2014, which, combined with increased mine production, contributed to lower prices during the year. Central banks have not been a source of supply to the market, but have rather been net buyers, as noted below.
MANAGEMENT’S DISCUSSION AND ANALYSIS For the year ended December 31, 2014
MDA9 KINROSS GOLD 2014 ANNUAL REPORT
Source: GFMS 2014 Gold Survey
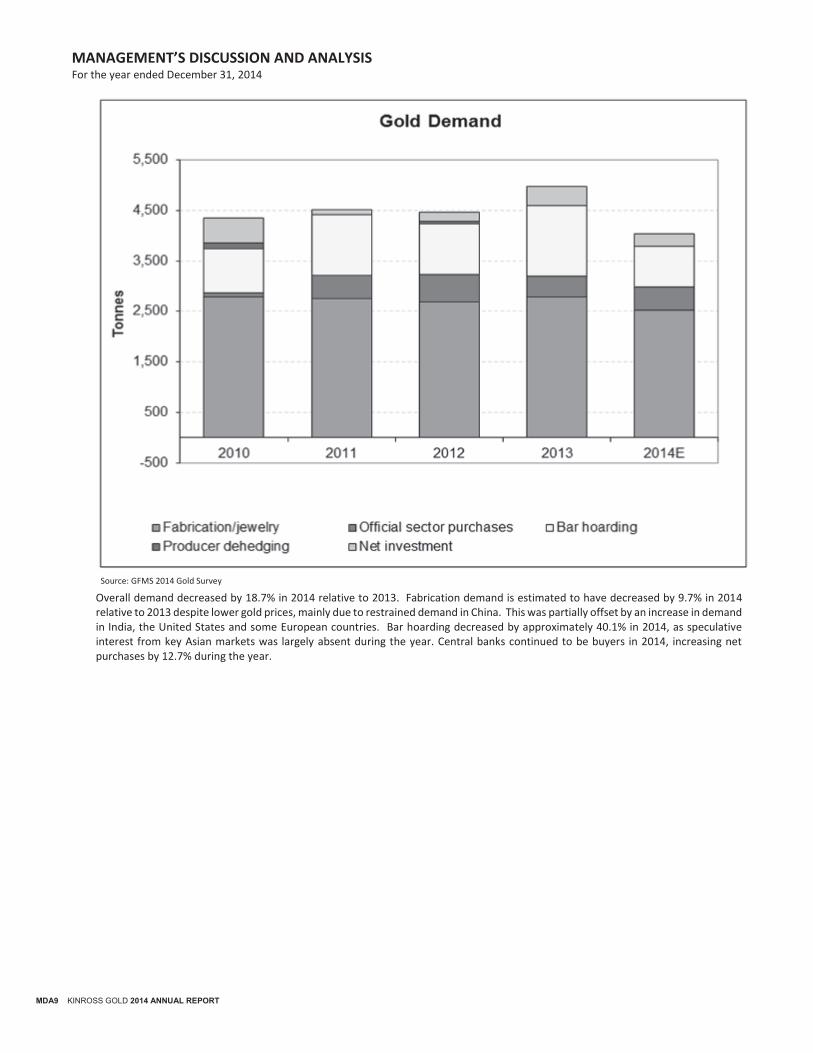
Overall demand decreased by 18.7% in 2014 relative to 2013. Fabrication demand is estimated to have decreased by 9.7% in 2014 relative to 2013 despite lower gold prices, mainly due to restrained demand in China. This was partially offset by an increase in demand in India, the United States and some European countries. Bar hoarding decreased by approximately 40.1% in 2014, as speculative interest from key Asian markets was largely absent during the year. Central banks continued to be buyers in 2014, increasing net purchases by 12.7% during the year.
MANAGEMENT’S DISCUSSION AND ANALYSIS For the year ended December 31, 2014
KINROSS GOLD 2014 ANNUAL REPORT MDA10
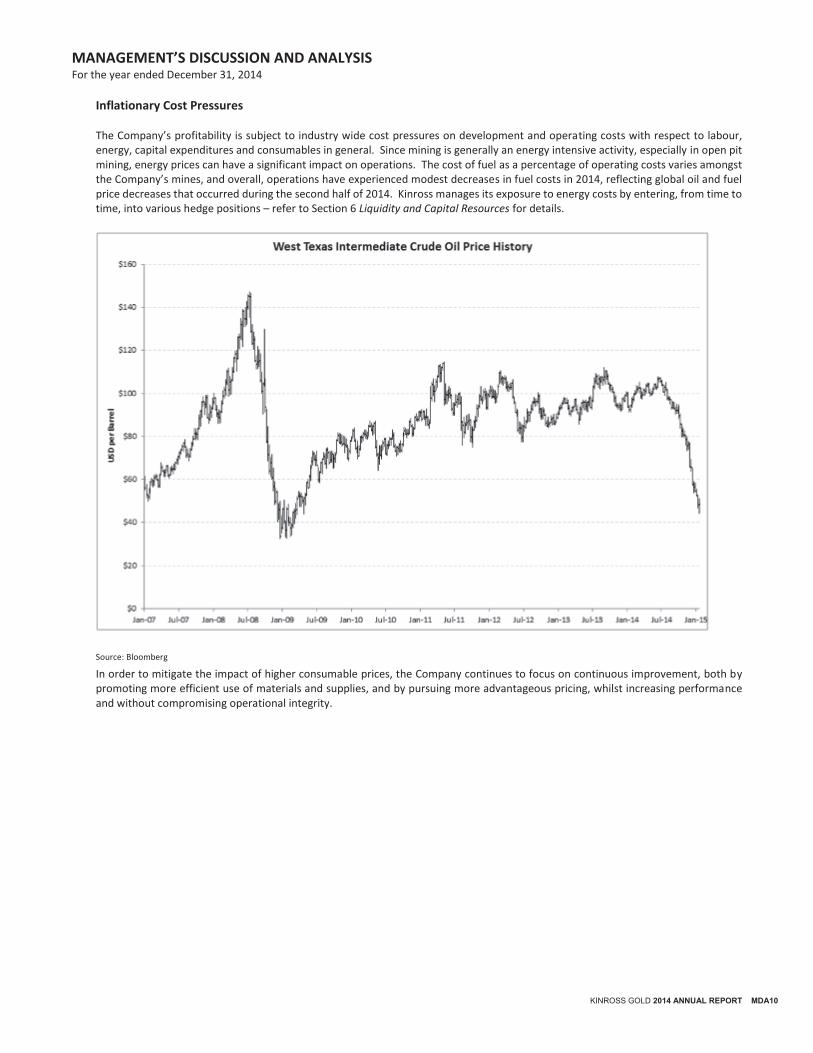
Inflationary Cost Pressures The Company’s profitability is subject to industry wide cost pressures on development and operating costs with respect to labour, energy, capital expenditures and consumables in general. Since mining is generally an energy intensive activity, especially in open pit mining, energy prices can have a significant impact on operations. The cost of fuel as a percentage of operating costs varies amongst the Company’s mines, and overall, operations have experienced modest decreases in fuel costs in 2014, reflecting global oil and fuel price decreases that occurred during the second half of 2014. Kinross manages its exposure to energy costs by entering, from time to time, into various hedge positions – refer to Section 6 Liquidity and Capital Resources for details.
Source: Bloomberg
In order to mitigate the impact of higher consumable prices, the Company continues to focus on continuous improvement, both by promoting more efficient use of materials and supplies, and by pursuing more advantageous pricing, whilst increasing performance and without compromising operational integrity.
MANAGEMENT’S DISCUSSION AND ANALYSIS For the year ended December 31, 2014
MDA11 KINROSS GOLD 2014 ANNUAL REPORT
Currency Fluctuations
Source: Bloomberg
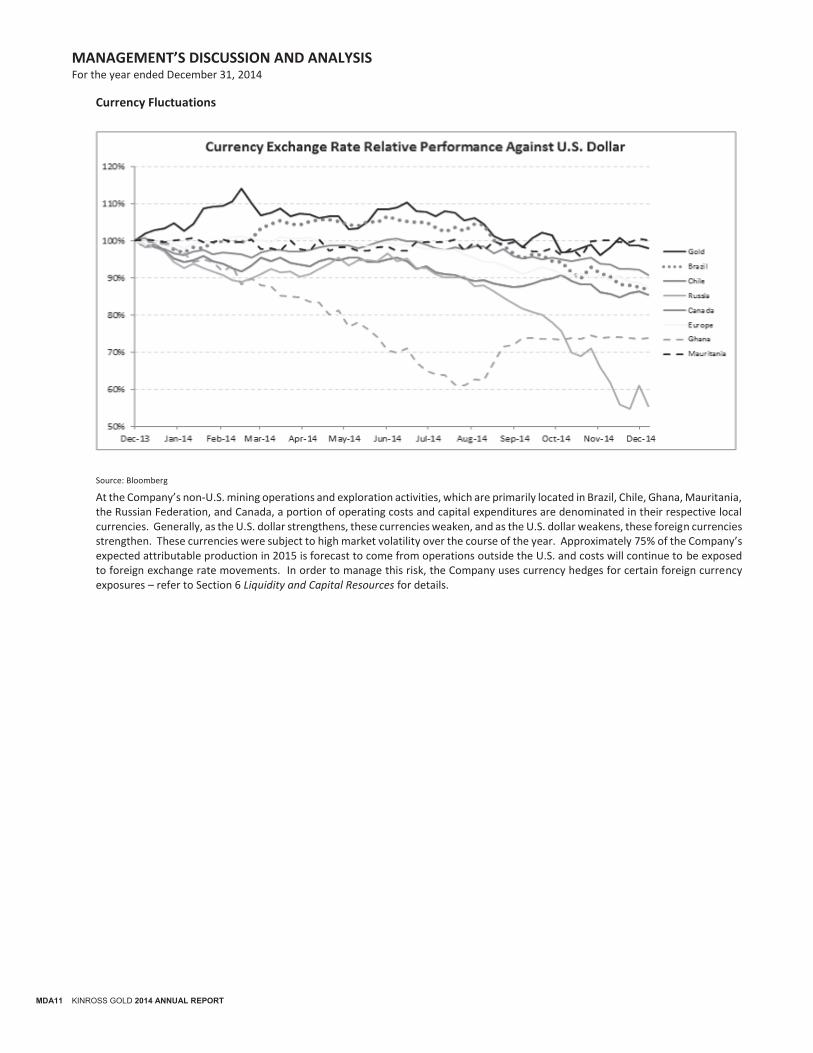
At the Company’s non-U.S. mining operations and exploration activities, which are primarily located in Brazil, Chile, Ghana, Mauritania, the Russian Federation, and Canada, a portion of operating costs and capital expenditures are denominated in their respective local currencies. Generally, as the U.S. dollar strengthens, these currencies weaken, and as the U.S. dollar weakens, these foreign currencies strengthen. These currencies were subject to high market volatility over the course of the year. Approximately 75% of the Company’s expected attributable production in 2015 is forecast to come from operations outside the U.S. and costs will continue to be exposed to foreign exchange rate movements. In order to manage this risk, the Company uses currency hedges for certain foreign currency exposures – refer to Section 6 Liquidity and Capital Resources for details.
MANAGEMENT’S DISCUSSION AND ANALYSIS For the year ended December 31, 2014
KINROSS GOLD 2014 ANNUAL REPORT MDA12
3. OUTLOOK
The forward-looking information contained in this section is subject to the risk factors and assumptions contained in the Cautionary Statement on Forward-Looking Information included with this MD&A and the risk factors set out in Section 10 – Risk Analysis.
Unless otherwise stated "attributable" production includes only Kinross' share of Chirano production (90%). Production cost of sales per attributable gold equivalent ounce is defined as production cost of sales as per the financial statements divided by the number of gold equivalent ounces sold, reduced for Chirano (10%) sales attributable to third parties. Approximately 60%-70% of the Company’s costs are denominated in U.S. dollars.
A 10% change in foreign exchange could result in an approximate $14 impact on production cost of sales per ounce2. Specific to the Russian rouble, a 10% change in the exchange rate would be expected to result in an approximate $11 impact on Russian production cost of sales per ounce.
A $10 per barrel change in the price of oil could result in an approximate $1 impact on production cost of sales per ounce. The impact on royalties of a $100 change in the gold price could result in an approximate $3 impact on production cost of sales per ounce.
Operational Outlook In 2015, Kinross expects to produce approximately 2.4 to 2.6 million gold equivalent ounces from its current operations, lower than the 2014 production of 2.71 million gold equivalent ounces. Production cost of sales per gold equivalent ounce is expected to be in the range of $720 to $780 for 2015. The Company has forecast an all-in sustaining cost for 2015 of $1,000 to $1,100 per gold equivalent ounce sold and per ounce sold on a by-product basis. Material assumptions used to forecast 2015 production costs are: a gold price of $1,200 per ounce, a silver price of $18 per ounce, an oil price of $90 per barrel, and foreign exchange rates of 2.5 Brazilian reais to the U.S. dollar, 1.10 Canadian dollar to the U.S. dollar, 40 Russian roubles to the U.S. dollar, 575 Chilean pesos to the U.S. dollar, 2.75 Ghanaian cedi to the U.S. dollar, 290 Mauritanian ouguiya to the U.S. dollar, and 1.30 U.S. dollars to the Euro. Taking into account existing currency and oil hedges, a 10% change in foreign currency exchange rates would be expected to result in an approximate $14 impact on our production cost of sales per ounce and specific to the Russian rouble, a 10% change in the exchange rate would be expected to result in an approximate $11 impact on Russian production cost of sales per ounce. A $10 per barrel change in the price of oil would be expected to result in an approximate $1 impact on our production cost of sales per ounce, and a $100 change in the price of gold would be expected to result in an approximate $3 impact on our production cost of sales per ounce as a result of a change in royalties. Total capital expenditures for 2015 are forecast to be approximately $725 million (including estimated capitalized interest of approximately $40 million). Of this amount, sustaining capital expenditures are expected to be approximately $505 million. Exploration expenditures are forecast to be approximately $95 million, none of which is expected to be capitalized. 2015 overhead (general and administrative expenses and business development) is expected to be approximately $205 million. Other operating costs are forecast to be approximately $50 million, including $11 million for care and maintenance costs at La Coipa. The above forecast expenses include approximately $30 million related to expected equity-based compensation. Income tax expenses are expected to be $55 million based on our assumed gold price plus approximately 24% of any profit resulting from higher gold prices. Depreciation, depletion and amortization is forecast to be approximately $330 per gold equivalent ounce.
2 Refers to all of the currencies in the countries where the Company has mining operations, fluctuating simultaneously by 10% in the same direction, either appreciating or depreciating, taking into consideration the impact of hedging and the weighting of each currency within our consolidated cost structure.
MANAGEMENT’S DISCUSSION AND ANALYSIS For the year ended December 31, 2014
MDA13 KINROSS GOLD 2014 ANNUAL REPORT
4. PROJECT UPDATES AND NEW DEVELOPMENTS Tasiast mill expansion update Following a comprehensive review, the Company has decided not to proceed with the 38,000 tonne per day mill expansion at the present time. The current gold price environment does not provide the Company with sufficient confidence that it will be able to maintain balance sheet strength while financing the expansion during the three-year construction period. In addition to a supportive gold price environment, the Company previously identified project financing, de-risking of the execution plan and conducive investment conditions in Mauritania as critical to a positive construction decision. Progress has been made towards securing project financing and de-risking execution. All necessary project permits have been secured from the Government of Mauritania, as well as approval for continuing to utilize 12-hour shifts. However, more work needs to be done to secure effective implementation of recent legislation granting the mining industry a VAT exemption. In addition, the Company has thus far been unable to reach a satisfactory agreement with the Government of Mauritania on payment of certain VAT refunds owed to the Company. Kinross continues to believe a Tasiast mill expansion has the potential to create significant value over the long term. The Company will continue to assess market conditions with a view to possibly expanding Tasiast, should circumstances change. In addition, Kinross will continue to focus on reducing operating costs at Tasiast, consistent with the Company’s standards of operational excellence and drive for continuous improvement.
La Coipa Phase 7 update A pre-feasibility study (“PFS”), begun in the second quarter of 2014, to explore potential re-start options at La Coipa, is on track to be completed during the third quarter of 2015. Kinross is also conducting a scoping study that focuses on processing options for known near-surface sulfide mineralization in the district. Exploration continues at La Coipa, with the assessment of some attractive opportunities to extend the mine life beyond what the PFS will contemplate. Metallurgical test work continues to be a major component of the study. Results to date confirm the complexity of the ore types, with more test work to follow.
Recent transactions Completion of $500.0 million unsecured debt offering On March 6, 2014, Kinross completed a $500.0 million offering of debt securities consisting of 5.950% senior notes due 2024. The notes are senior unsecured obligations of the Company. Kinross received net proceeds of $492.9 million from the offering, after discount, payment of the commissions to the initial purchasers and expenses of the offering. On March 10, 2014, the Company used the net proceeds raised from the above mentioned debt offering to repay $500.0 million of the term loan. Amendment of Letter of Credit guarantee facility On July 17, 2014, the Company entered into an amendment to increase the amount of its Letter of Credit guarantee facility with Export Development Canada (“EDC”) from $200.0 million to $250.0 million. Amendment of revolving credit and term loan facilities On July 28, 2014, the Company amended its $500.0 million term loan and $1,500.0 million revolving credit facility to extend the respective maturity dates by one year to August 10, 2018 and August 10, 2019, respectively. As part of this amendment, the interest charge on the term loan is now LIBOR plus 1.65%, based on the Company’s current credit rating, and consequently, the fixed rate on the hedged portion of the term loan is now 2.14%.
MANAGEMENT’S DISCUSSION AND ANALYSIS For the year ended December 31, 2014
KINROSS GOLD 2014 ANNUAL REPORT MDA14
Sale of Fruta del Norte (“FDN”) project in Ecuador On October 21, 2014, Kinross announced that it entered into an agreement with Fortress Minerals Corp. (“Fortress”, subsequently renamed Lundin Gold Inc. (“Lundin Gold”)), a member of the Lundin Group of Companies, to sell all of its interest in Aurelian Resources Inc. (“Aurelian”) and the FDN project in Ecuador for $240.0 million in cash and shares. On December 17, 2014, the Company completed the sale for gross cash proceeds of $150.0 million and $90.0 million of Lundin Gold common shares, resulting in an after-tax recovery of $238.0 million.
Other developments Board of Directors update Mr. John Macken resigned from the Kinross Board of Directors, effective July 30, 2014. Mr. Kenneth Irving is resigning from the Kinross Board of Directors, effective February 10, 2015. Temporary suspension of mill at Round Mountain mine Mill operations at Round Mountain have been temporarily suspended as of October 1, 2014, following a fire in the mill building. Mill repairs have commenced and the mill is expected to be re-commissioned in March 2015 with costs expected to be almost entirely covered by insurance. Production continues uninterrupted from the mine's heap leach facilities, which account for approximately 75% of production. There was no material impact on the region’s 2014 production guidance from the temporary suspension of mill operations.
MANAGEMENT’S DISCUSSION AND ANALYSIS For the year ended December 31, 2014
MDA15 KINROSS GOLD 2014 ANNUAL REPORT
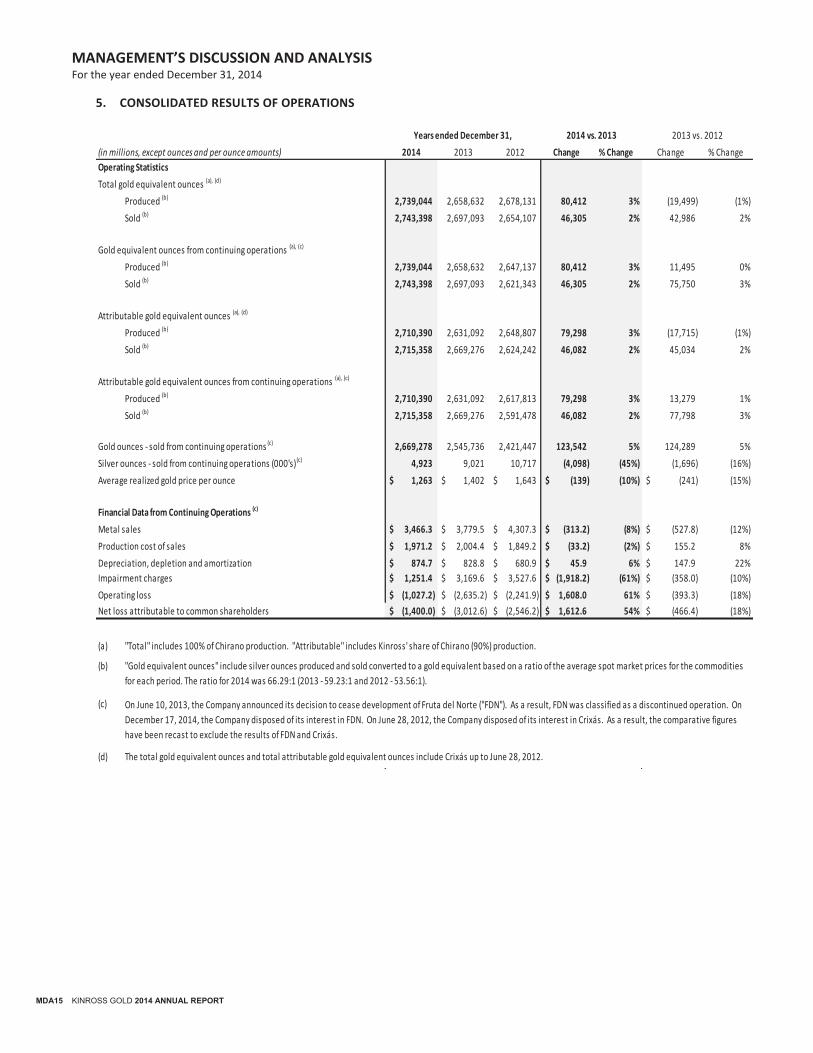
5. CONSOLIDATED RESULTS OF OPERATIONS
2014 2013 2012 Change % Change Change % Change
Operating Statistics
Total gold equivalent ounces (a), (d)
Produced (b) 2,739,044 2,658,632 2,678,131 80,412 3% (19,499) (1%)
Sold (b) 2,743,398 2,697,093 2,654,107 46,305 2% 42,986 2%
Gold equivalent ounces from continuing operations (a), (c)
Produced (b) 2,739,044 2,658,632 2,647,137 80,412 3% 11,495 0%
Sold (b) 2,743,398 2,697,093 2,621,343 46,305 2% 75,750 3%
Attributable gold equivalent ounces (a), (d)
Produced (b) 2,710,390 2,631,092 2,648,807 79,298 3% (17,715) (1%)
Sold (b) 2,715,358 2,669,276 2,624,242 46,082 2% 45,034 2%
Attributable gold equivalent ounces from continuing operations (a), (c)
Produced (b) 2,710,390 2,631,092 2,617,813 79,298 3% 13,279 1%
Sold (b) 2,715,358 2,669,276 2,591,478 46,082 2% 77,798 3%
Gold ounces - sold from continuing operations (c) 2,669,278 2,545,736 2,421,447 123,542 5% 124,289 5%
Silver ounces - sold from continuing operations (000's)(c) 4,923 9,021 10,717 (4,098) (45%) (1,696) (16%)
Average realized gold price per ounce 1,263$ 1,402$ 1,643$ (139)$ (10%) (241)$ (15%)
Financial Data from Continuing Operations (c)
Metal sales 3,466.3$ 3,779.5$ 4,307.3$ (313.2)$ (8%) (527.8)$ (12%)
Production cost of sales 1,971.2$ 2,004.4$ 1,849.2$ (33.2)$ (2%) 155.2$ 8%
Depreciation, depletion and amortization 874.7$ 828.8$ 680.9$ 45.9$ 6% 147.9$ 22%
Impairment charges 1,251.4$ 3,169.6$ 3,527.6$ (1,918.2)$ (61%) (358.0)$ (10%)
Operating loss (1,027.2)$ (2,635.2)$ (2,241.9)$ 1,608.0$ 61% (393.3)$ (18%)
(1,400.0)$ (3,012.6)$ (2,546.2)$ 1,612.6$ 54% (466.4)$ (18%)
(a)
(b)
(c)
(d) The total gold equivalent ounces and total attributable gold equivalent ounces include Crixás up to June 28, 2012.
2014 vs. 2013
(in millions, except ounces and per ounce amounts)
Net loss attributable to common shareholders
2013 vs. 2012
"Total" includes 100% of Chirano production. "Attributable" includes Kinross' share of Chirano (90%) production.
Years ended December 31,
On June 10, 2013, the Company announced its decision to cease development of Fruta del Norte ("FDN"). As a result, FDN was classified as a discontinued operation. On
December 17, 2014, the Company disposed of its interest in FDN. On June 28, 2012, the Company disposed of its interest in Crixás. As a result, the comparative figures
have been recast to exclude the results of FDN and Crixás.
"Gold equivalent ounces" include silver ounces produced and sold converted to a gold equivalent based on a ratio of the average spot market prices for the commodities
for each period. The ratio for 2014 was 66.29:1 (2013 - 59.23:1 and 2012 - 53.56:1).
MANAGEMENT’S DISCUSSION AND ANALYSIS For the year ended December 31, 2014
KINROSS GOLD 2014 ANNUAL REPORT MDA16
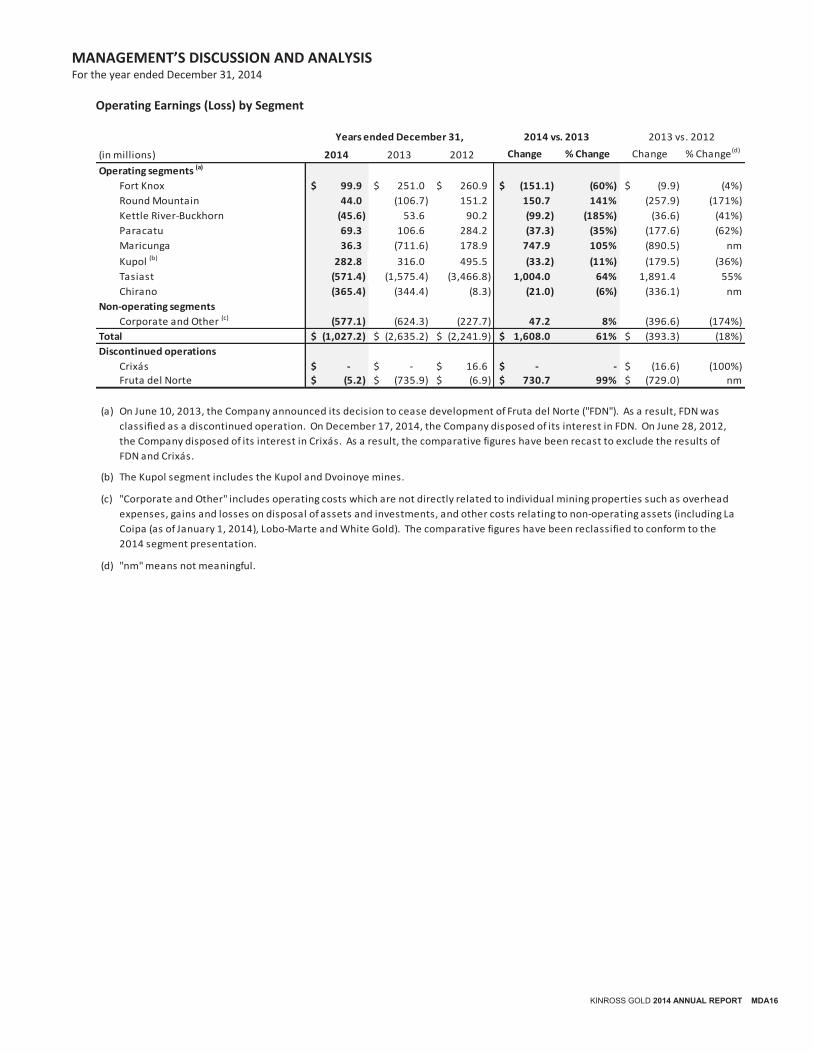
Operating Earnings (Loss) by Segment
(in millions) 2014 2013 2012 Change % Change Change % Change (d)
Operating segments (a)
Fort Knox 99.9$ 251.0$ 260.9$ (151.1)$ (60%) (9.9)$ (4%)
Round Mountain 44.0 (106.7) 151.2 150.7 141% (257.9) (171%)
Kettle River-Buckhorn (45.6) 53.6 90.2 (99.2) (185%) (36.6) (41%)
Paracatu 69.3 106.6 284.2 (37.3) (35%) (177.6) (62%)
Maricunga 36.3 (711.6) 178.9 747.9 105% (890.5) nm
Kupol (b) 282.8 316.0 495.5 (33.2) (11%) (179.5) (36%)
Tasiast (571.4) (1,575.4) (3,466.8) 1,004.0 64% 1,891.4 55%
Chirano (365.4) (344.4) (8.3) (21.0) (6%) (336.1) nm
Non-operating segments
Corporate and Other (c) (577.1) (624.3) (227.7) 47.2 8% (396.6) (174%)
Total (1,027.2)$ (2,635.2)$ (2,241.9)$ 1,608.0$ 61% (393.3)$ (18%)
Discontinued operations
Crixás -$ -$ 16.6$ -$ - (16.6)$ (100%)
Fruta del Norte (5.2)$ (735.9)$ (6.9)$ 730.7$ 99% (729.0)$ nm
(a)
(b)
(c)
(d)
Years ended December 31, 2014 vs. 2013 2013 vs. 2012
On June 10, 2013, the Company announced its decision to cease development of Fruta del Norte ("FDN"). As a result, FDN was
classified as a discontinued operation. On December 17, 2014, the Company disposed of its interest in FDN. On June 28, 2012,
the Company disposed of its interest in Crixás. As a result, the comparative figures have been recast to exclude the results of
FDN and Crixás.
The Kupol segment includes the Kupol and Dvoinoye mines.
"Corporate and Other" includes operating costs which are not directly related to individual mining properties such as overhead
expenses, gains and losses on disposal of assets and investments, and other costs relating to non-operating assets (including La
Coipa (as of January 1, 2014), Lobo-Marte and White Gold). The comparative figures have been reclassified to conform to the
2014 segment presentation.
"nm" means not meaningful.
MANAGEMENT’S DISCUSSION AND ANALYSIS For the year ended December 31, 2014
MDA17 KINROSS GOLD 2014 ANNUAL REPORT
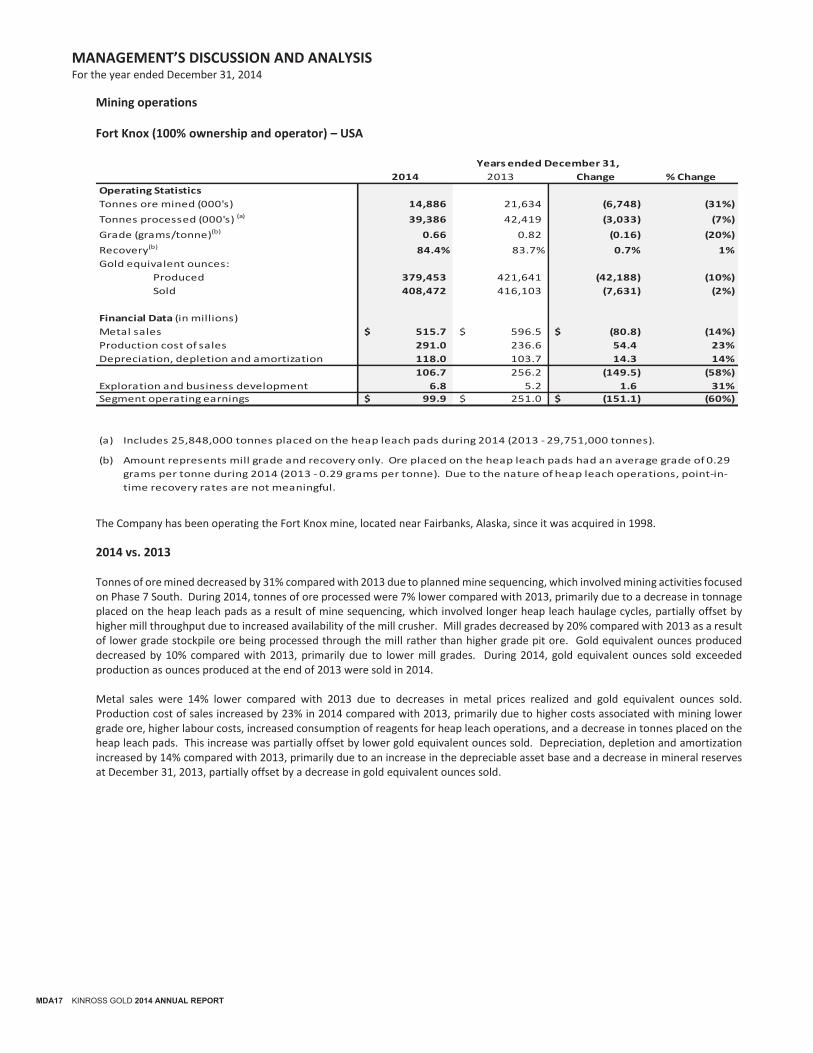
Mining operations
Fort Knox (100% ownership and operator) – USA
The Company has been operating the Fort Knox mine, located near Fairbanks, Alaska, since it was acquired in 1998.
2014 vs. 2013 Tonnes of ore mined decreased by 31% compared with 2013 due to planned mine sequencing, which involved mining activities focused on Phase 7 South. During 2014, tonnes of ore processed were 7% lower compared with 2013, primarily due to a decrease in tonnage placed on the heap leach pads as a result of mine sequencing, which involved longer heap leach haulage cycles, partially offset by higher mill throughput due to increased availability of the mill crusher. Mill grades decreased by 20% compared with 2013 as a result of lower grade stockpile ore being processed through the mill rather than higher grade pit ore. Gold equivalent ounces produced decreased by 10% compared with 2013, primarily due to lower mill grades. During 2014, gold equivalent ounces sold exceeded production as ounces produced at the end of 2013 were sold in 2014. Metal sales were 14% lower compared with 2013 due to decreases in metal prices realized and gold equivalent ounces sold. Production cost of sales increased by 23% in 2014 compared with 2013, primarily due to higher costs associated with mining lower grade ore, higher labour costs, increased consumption of reagents for heap leach operations, and a decrease in tonnes placed on the heap leach pads. This increase was partially offset by lower gold equivalent ounces sold. Depreciation, depletion and amortization increased by 14% compared with 2013, primarily due to an increase in the depreciable asset base and a decrease in mineral reserves at December 31, 2013, partially offset by a decrease in gold equivalent ounces sold.
2014 2013 Change % Change
Operating Statistics
Tonnes ore mined (000's) 14,886 21,634 (6,748) (31%)
Tonnes processed (000's) (a) 39,386 42,419 (3,033) (7%)
Grade (grams/tonne)(b) 0.66 0.82 (0.16) (20%)
Recovery(b) 84.4% 83.7% 0.7% 1%
Gold equivalent ounces:
Produced 379,453 421,641 (42,188) (10%)
Sold 408,472 416,103 (7,631) (2%)
Financial Data (in millions)
Metal sales 515.7$ 596.5$ (80.8)$ (14%)
Production cost of sales 291.0 236.6 54.4 23%
Depreciation, depletion and amortization 118.0 103.7 14.3 14%
106.7 256.2 (149.5) (58%)
Exploration and business development 6.8 5.2 1.6 31%
Segment operating earnings 99.9$ 251.0$ (151.1)$ (60%)
(a)
(b)
Includes 25,848,000 tonnes placed on the heap leach pads during 2014 (2013 - 29,751,000 tonnes).
Amount represents mill grade and recovery only. Ore placed on the heap leach pads had an average grade of 0.29
grams per tonne during 2014 (2013 - 0.29 grams per tonne). Due to the nature of heap leach operations, point-in-
time recovery rates are not meaningful.
Years ended December 31,
MANAGEMENT’S DISCUSSION AND ANALYSIS For the year ended December 31, 2014
KINROSS GOLD 2014 ANNUAL REPORT MDA18
Round Mountain (50% ownership and operator; Barrick 50% ownership) – USA
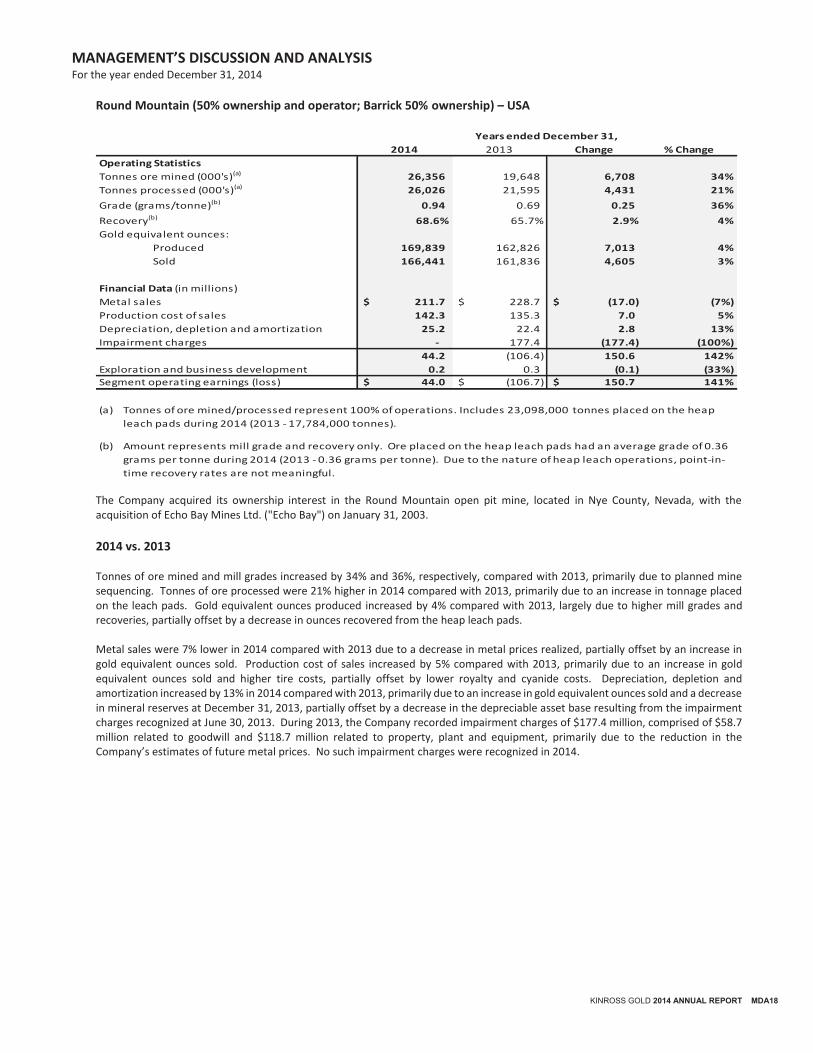
The Company acquired its ownership interest in the Round Mountain open pit mine, located in Nye County, Nevada, with the acquisition of Echo Bay Mines Ltd. ("Echo Bay") on January 31, 2003.
2014 vs. 2013 Tonnes of ore mined and mill grades increased by 34% and 36%, respectively, compared with 2013, primarily due to planned mine sequencing. Tonnes of ore processed were 21% higher in 2014 compared with 2013, primarily due to an increase in tonnage placed on the leach pads. Gold equivalent ounces produced increased by 4% compared with 2013, largely due to higher mill grades and recoveries, partially offset by a decrease in ounces recovered from the heap leach pads. Metal sales were 7% lower in 2014 compared with 2013 due to a decrease in metal prices realized, partially offset by an increase in gold equivalent ounces sold. Production cost of sales increased by 5% compared with 2013, primarily due to an increase in gold equivalent ounces sold and higher tire costs, partially offset by lower royalty and cyanide costs. Depreciation, depletion and amortization increased by 13% in 2014 compared with 2013, primarily due to an increase in gold equivalent ounces sold and a decrease in mineral reserves at December 31, 2013, partially offset by a decrease in the depreciable asset base resulting from the impairment charges recognized at June 30, 2013. During 2013, the Company recorded impairment charges of $177.4 million, comprised of $58.7 million related to goodwill and $118.7 million related to property, plant and equipment, primarily due to the reduction in the Company’s estimates of future metal prices. No such impairment charges were recognized in 2014.
2014 2013 Change % Change
Operating Statistics
Tonnes ore mined (000's)(a) 26,356 19,648 6,708 34%
Tonnes processed (000's)(a) 26,026 21,595 4,431 21%
Grade (grams/tonne)(b) 0.94 0.69 0.25 36%
Recovery(b) 68.6% 65.7% 2.9% 4%
Gold equivalent ounces:
Produced 169,839 162,826 7,013 4%
Sold 166,441 161,836 4,605 3%
Financial Data (in millions)
Metal sales 211.7$ 228.7$ (17.0)$ (7%)
Production cost of sales 142.3 135.3 7.0 5%
Depreciation, depletion and amortization 25.2 22.4 2.8 13%
Impairment charges - 177.4 (177.4) (100%)
44.2 (106.4) 150.6 142%
Exploration and business development 0.2 0.3 (0.1) (33%)
Segment operating earnings (loss) 44.0$ (106.7)$ 150.7$ 141%
(a)
(b)
Tonnes of ore mined/processed represent 100% of operations. Includes 23,098,000 tonnes placed on the heap
leach pads during 2014 (2013 - 17,784,000 tonnes).
Amount represents mill grade and recovery only. Ore placed on the heap leach pads had an average grade of 0.36
grams per tonne during 2014 (2013 - 0.36 grams per tonne). Due to the nature of heap leach operations, point-in-
time recovery rates are not meaningful.
Years ended December 31,
MANAGEMENT’S DISCUSSION AND ANALYSIS For the year ended December 31, 2014
MDA19 KINROSS GOLD 2014 ANNUAL REPORT
Kettle River–Buckhorn (100% ownership and operator) – USA
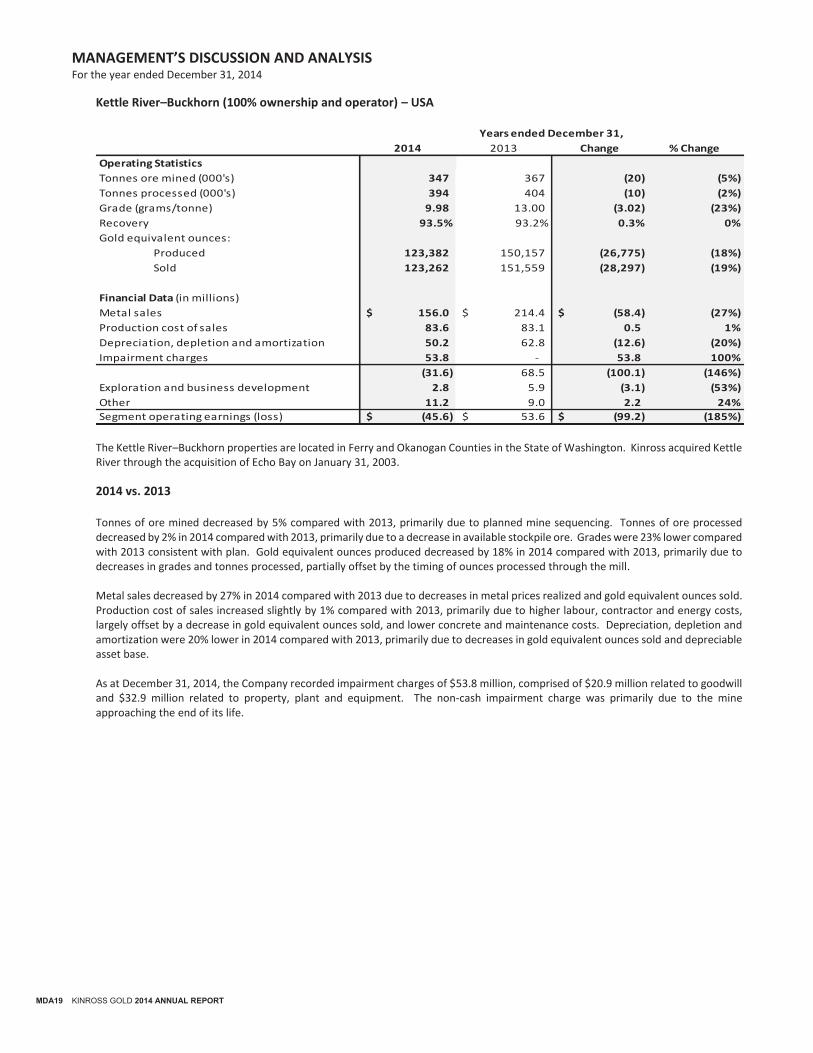
The Kettle River–Buckhorn properties are located in Ferry and Okanogan Counties in the State of Washington. Kinross acquired Kettle River through the acquisition of Echo Bay on January 31, 2003.
2014 vs. 2013 Tonnes of ore mined decreased by 5% compared with 2013, primarily due to planned mine sequencing. Tonnes of ore processed decreased by 2% in 2014 compared with 2013, primarily due to a decrease in available stockpile ore. Grades were 23% lower compared with 2013 consistent with plan. Gold equivalent ounces produced decreased by 18% in 2014 compared with 2013, primarily due to decreases in grades and tonnes processed, partially offset by the timing of ounces processed through the mill. Metal sales decreased by 27% in 2014 compared with 2013 due to decreases in metal prices realized and gold equivalent ounces sold. Production cost of sales increased slightly by 1% compared with 2013, primarily due to higher labour, contractor and energy costs, largely offset by a decrease in gold equivalent ounces sold, and lower concrete and maintenance costs. Depreciation, depletion and amortization were 20% lower in 2014 compared with 2013, primarily due to decreases in gold equivalent ounces sold and depreciable asset base. As at December 31, 2014, the Company recorded impairment charges of $53.8 million, comprised of $20.9 million related to goodwill and $32.9 million related to property, plant and equipment. The non-cash impairment charge was primarily due to the mine approaching the end of its life.
2014 2013 Change % Change
Operating Statistics
Tonnes ore mined (000's) 347 367 (20) (5%)
Tonnes processed (000's) 394 404 (10) (2%)
Grade (grams/tonne) 9.98 13.00 (3.02) (23%)
Recovery 93.5% 93.2% 0.3% 0%
Gold equivalent ounces:
Produced 123,382 150,157 (26,775) (18%)
Sold 123,262 151,559 (28,297) (19%)
Financial Data (in millions)
Metal sales 156.0$ 214.4$ (58.4)$ (27%)
Production cost of sales 83.6 83.1 0.5 1%
Depreciation, depletion and amortization 50.2 62.8 (12.6) (20%)
Impairment charges 53.8 - 53.8 100%
(31.6) 68.5 (100.1) (146%)
Exploration and business development 2.8 5.9 (3.1) (53%)
Other 11.2 9.0 2.2 24%
Segment operating earnings (loss) (45.6)$ 53.6$ (99.2)$ (185%)
Years ended December 31,
MANAGEMENT’S DISCUSSION AND ANALYSIS For the year ended December 31, 2014
KINROSS GOLD 2014 ANNUAL REPORT MDA20
Paracatu (100% ownership and operator) – Brazil
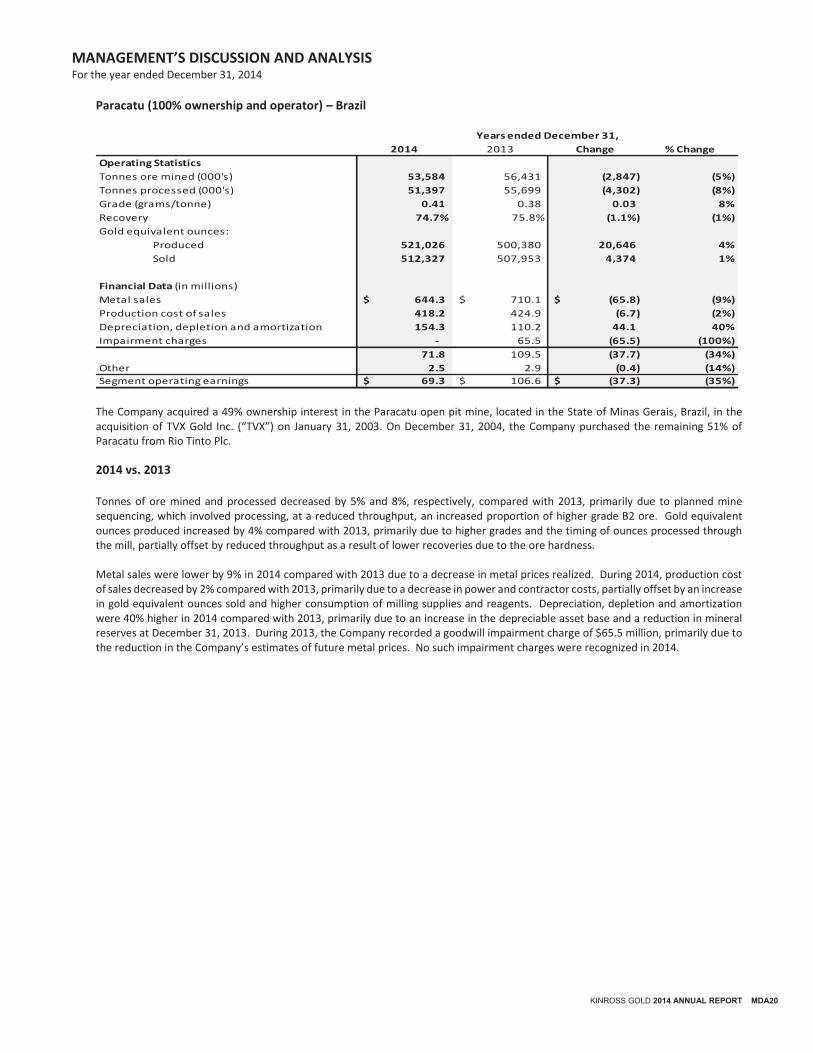
The Company acquired a 49% ownership interest in the Paracatu open pit mine, located in the State of Minas Gerais, Brazil, in the acquisition of TVX Gold Inc. (“TVX”) on January 31, 2003. On December 31, 2004, the Company purchased the remaining 51% of Paracatu from Rio Tinto Plc.
2014 vs. 2013 Tonnes of ore mined and processed decreased by 5% and 8%, respectively, compared with 2013, primarily due to planned mine sequencing, which involved processing, at a reduced throughput, an increased proportion of higher grade B2 ore. Gold equivalent ounces produced increased by 4% compared with 2013, primarily due to higher grades and the timing of ounces processed through the mill, partially offset by reduced throughput as a result of lower recoveries due to the ore hardness. Metal sales were lower by 9% in 2014 compared with 2013 due to a decrease in metal prices realized. During 2014, production cost of sales decreased by 2% compared with 2013, primarily due to a decrease in power and contractor costs, partially offset by an increase in gold equivalent ounces sold and higher consumption of milling supplies and reagents. Depreciation, depletion and amortization were 40% higher in 2014 compared with 2013, primarily due to an increase in the depreciable asset base and a reduction in mineral reserves at December 31, 2013. During 2013, the Company recorded a goodwill impairment charge of $65.5 million, primarily due to the reduction in the Company’s estimates of future metal prices. No such impairment charges were recognized in 2014.
2014 2013 Change % Change
Operating Statistics
Tonnes ore mined (000's) 53,584 56,431 (2,847) (5%)
Tonnes processed (000's) 51,397 55,699 (4,302) (8%)
Grade (grams/tonne) 0.41 0.38 0.03 8%
Recovery 74.7% 75.8% (1.1%) (1%)
Gold equivalent ounces:
Produced 521,026 500,380 20,646 4%
Sold 512,327 507,953 4,374 1%
Financial Data (in millions)
Metal sales 644.3$ 710.1$ (65.8)$ (9%)
Production cost of sales 418.2 424.9 (6.7) (2%)
Depreciation, depletion and amortization 154.3 110.2 44.1 40%
Impairment charges - 65.5 (65.5) (100%)
71.8 109.5 (37.7) (34%)
Other 2.5 2.9 (0.4) (14%)
Segment operating earnings 69.3$ 106.6$ (37.3)$ (35%)
Years ended December 31,
MANAGEMENT’S DISCUSSION AND ANALYSIS For the year ended December 31, 2014
MDA21 KINROSS GOLD 2014 ANNUAL REPORT
Maricunga (100% ownership and operator) – Chile
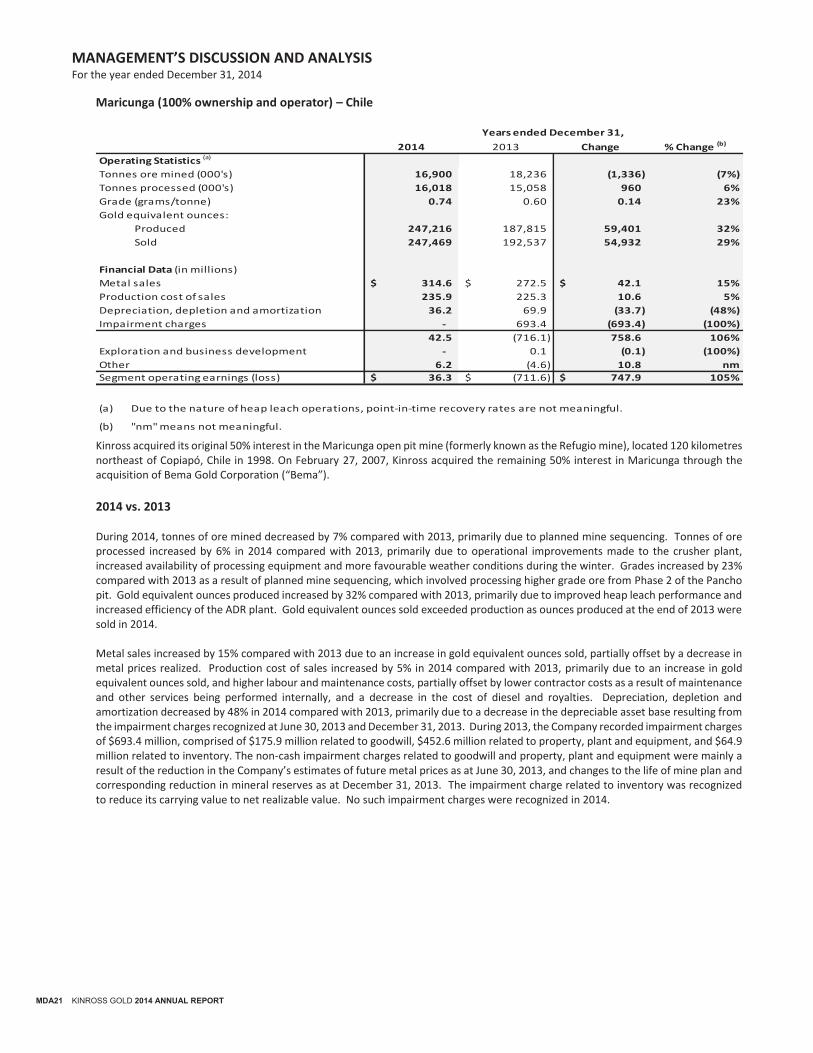
Kinross acquired its original 50% interest in the Maricunga open pit mine (formerly known as the Refugio mine), located 120 kilometres northeast of Copiapó, Chile in 1998. On February 27, 2007, Kinross acquired the remaining 50% interest in Maricunga through the acquisition of Bema Gold Corporation (“Bema”).
2014 vs. 2013 During 2014, tonnes of ore mined decreased by 7% compared with 2013, primarily due to planned mine sequencing. Tonnes of ore processed increased by 6% in 2014 compared with 2013, primarily due to operational improvements made to the crusher plant, increased availability of processing equipment and more favourable weather conditions during the winter. Grades increased by 23% compared with 2013 as a result of planned mine sequencing, which involved processing higher grade ore from Phase 2 of the Pancho pit. Gold equivalent ounces produced increased by 32% compared with 2013, primarily due to improved heap leach performance and increased efficiency of the ADR plant. Gold equivalent ounces sold exceeded production as ounces produced at the end of 2013 were sold in 2014. Metal sales increased by 15% compared with 2013 due to an increase in gold equivalent ounces sold, partially offset by a decrease in metal prices realized. Production cost of sales increased by 5% in 2014 compared with 2013, primarily due to an increase in gold equivalent ounces sold, and higher labour and maintenance costs, partially offset by lower contractor costs as a result of maintenance and other services being performed internally, and a decrease in the cost of diesel and royalties. Depreciation, depletion and amortization decreased by 48% in 2014 compared with 2013, primarily due to a decrease in the depreciable asset base resulting from the impairment charges recognized at June 30, 2013 and December 31, 2013. During 2013, the Company recorded impairment charges of $693.4 million, comprised of $175.9 million related to goodwill, $452.6 million related to property, plant and equipment, and $64.9 million related to inventory. The non-cash impairment charges related to goodwill and property, plant and equipment were mainly a result of the reduction in the Company’s estimates of future metal prices as at June 30, 2013, and changes to the life of mine plan and corresponding reduction in mineral reserves as at December 31, 2013. The impairment charge related to inventory was recognized to reduce its carrying value to net realizable value. No such impairment charges were recognized in 2014.
2014 2013 Change % Change (b)
Operating Statistics (a)
Tonnes ore mined (000's) 16,900 18,236 (1,336) (7%)
Tonnes processed (000's) 16,018 15,058 960 6%
Grade (grams/tonne) 0.74 0.60 0.14 23%
Gold equivalent ounces:
Produced 247,216 187,815 59,401 32%
Sold 247,469 192,537 54,932 29%
Financial Data (in millions)
Metal sales 314.6$ 272.5$ 42.1$ 15%
Production cost of sales 235.9 225.3 10.6 5%
Depreciation, depletion and amortization 36.2 69.9 (33.7) (48%)
Impairment charges - 693.4 (693.4) (100%)
42.5 (716.1) 758.6 106%
Exploration and business development - 0.1 (0.1) (100%)
Other 6.2 (4.6) 10.8 nm
Segment operating earnings (loss) 36.3$ (711.6)$ 747.9$ 105%
(a)
(b) "nm" means not meaningful.
Years ended December 31,
Due to the nature of heap leach operations, point-in-time recovery rates are not meaningful.
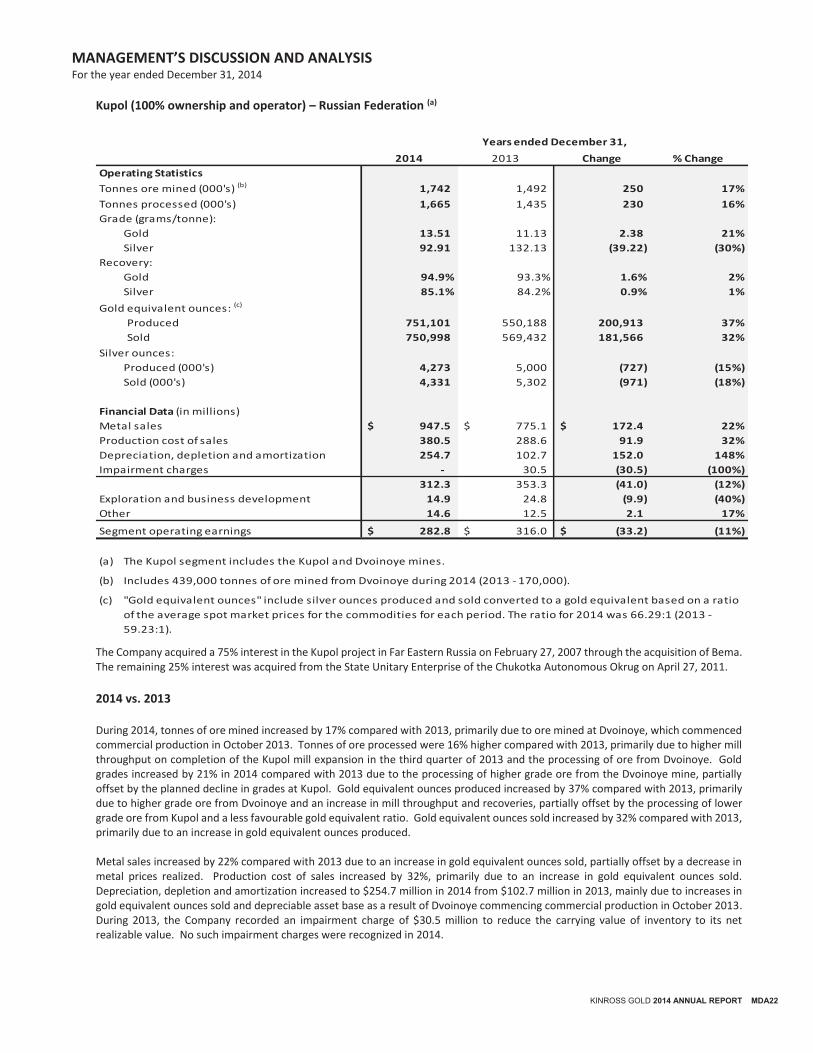
MANAGEMENT’S DISCUSSION AND ANALYSIS For the year ended December 31, 2014
KINROSS GOLD 2014 ANNUAL REPORT MDA22
Kupol (100% ownership and operator) – Russian Federation (a)
The Company acquired a 75% interest in the Kupol project in Far Eastern Russia on February 27, 2007 through the acquisition of Bema. The remaining 25% interest was acquired from the State Unitary Enterprise of the Chukotka Autonomous Okrug on April 27, 2011.
2014 vs. 2013 During 2014, tonnes of ore mined increased by 17% compared with 2013, primarily due to ore mined at Dvoinoye, which commenced commercial production in October 2013. Tonnes of ore processed were 16% higher compared with 2013, primarily due to higher mill throughput on completion of the Kupol mill expansion in the third quarter of 2013 and the processing of ore from Dvoinoye. Gold grades increased by 21% in 2014 compared with 2013 due to the processing of higher grade ore from the Dvoinoye mine, partially offset by the planned decline in grades at Kupol. Gold equivalent ounces produced increased by 37% compared with 2013, primarily due to higher grade ore from Dvoinoye and an increase in mill throughput and recoveries, partially offset by the processing of lower grade ore from Kupol and a less favourable gold equivalent ratio. Gold equivalent ounces sold increased by 32% compared with 2013, primarily due to an increase in gold equivalent ounces produced. Metal sales increased by 22% compared with 2013 due to an increase in gold equivalent ounces sold, partially offset by a decrease in metal prices realized. Production cost of sales increased by 32%, primarily due to an increase in gold equivalent ounces sold. Depreciation, depletion and amortization increased to $254.7 million in 2014 from $102.7 million in 2013, mainly due to increases in gold equivalent ounces sold and depreciable asset base as a result of Dvoinoye commencing commercial production in October 2013. During 2013, the Company recorded an impairment charge of $30.5 million to reduce the carrying value of inventory to its net realizable value. No such impairment charges were recognized in 2014.
2014 2013 Change % Change
Operating Statistics
Tonnes ore mined (000's) (b) 1,742 1,492 250 17%
Tonnes processed (000's) 1,665 1,435 230 16%
Grade (grams/tonne):
Gold 13.51 11.13 2.38 21%
Silver 92.91 132.13 (39.22) (30%)
Recovery:
Gold 94.9% 93.3% 1.6% 2%
Silver 85.1% 84.2% 0.9% 1%
Gold equivalent ounces: (c)
Produced 751,101 550,188 200,913 37%
Sold 750,998 569,432 181,566 32%
Silver ounces:
Produced (000's) 4,273 5,000 (727) (15%)
Sold (000's) 4,331 5,302 (971) (18%)
Financial Data (in millions)
Metal sales 947.5$ 775.1$ 172.4$ 22%
Production cost of sales 380.5 288.6 91.9 32%
Depreciation, depletion and amortization 254.7 102.7 152.0 148%
Impairment charges - 30.5 (30.5) (100%)
312.3 353.3 (41.0) (12%)
Exploration and business development 14.9 24.8 (9.9) (40%)
Other 14.6 12.5 2.1 17%
Segment operating earnings 282.8$ 316.0$ (33.2)$ (11%)
(a)
(b)
(c)
The Kupol segment includes the Kupol and Dvoinoye mines.
"Gold equivalent ounces" include silver ounces produced and sold converted to a gold equivalent based on a ratio
of the average spot market prices for the commodities for each period. The ratio for 2014 was 66.29:1 (2013 -
59.23:1).
Includes 439,000 tonnes of ore mined from Dvoinoye during 2014 (2013 - 170,000).
Years ended December 31,
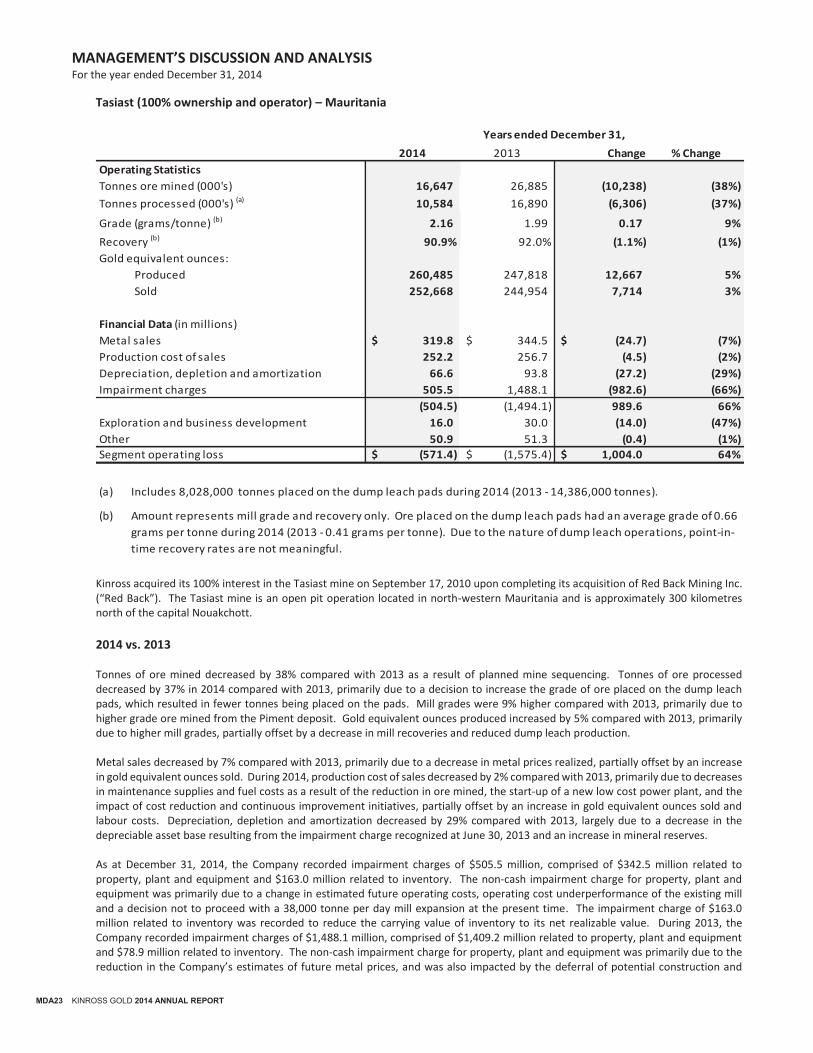
MANAGEMENT’S DISCUSSION AND ANALYSIS For the year ended December 31, 2014
MDA23 KINROSS GOLD 2014 ANNUAL REPORT
Tasiast (100% ownership and operator) – Mauritania
Kinross acquired its 100% interest in the Tasiast mine on September 17, 2010 upon completing its acquisition of Red Back Mining Inc. (“Red Back”). The Tasiast mine is an open pit operation located in north-western Mauritania and is approximately 300 kilometres north of the capital Nouakchott. 2014 vs. 2013 Tonnes of ore mined decreased by 38% compared with 2013 as a result of planned mine sequencing. Tonnes of ore processed decreased by 37% in 2014 compared with 2013, primarily due to a decision to increase the grade of ore placed on the dump leach pads, which resulted in fewer tonnes being placed on the pads. Mill grades were 9% higher compared with 2013, primarily due to higher grade ore mined from the Piment deposit. Gold equivalent ounces produced increased by 5% compared with 2013, primarily due to higher mill grades, partially offset by a decrease in mill recoveries and reduced dump leach production. Metal sales decreased by 7% compared with 2013, primarily due to a decrease in metal prices realized, partially offset by an increase in gold equivalent ounces sold. During 2014, production cost of sales decreased by 2% compared with 2013, primarily due to decreases in maintenance supplies and fuel costs as a result of the reduction in ore mined, the start-up of a new low cost power plant, and the impact of cost reduction and continuous improvement initiatives, partially offset by an increase in gold equivalent ounces sold and labour costs. Depreciation, depletion and amortization decreased by 29% compared with 2013, largely due to a decrease in the depreciable asset base resulting from the impairment charge recognized at June 30, 2013 and an increase in mineral reserves. As at December 31, 2014, the Company recorded impairment charges of $505.5 million, comprised of $342.5 million related to property, plant and equipment and $163.0 million related to inventory. The non-cash impairment charge for property, plant and equipment was primarily due to a change in estimated future operating costs, operating cost underperformance of the existing mill and a decision not to proceed with a 38,000 tonne per day mill expansion at the present time. The impairment charge of $163.0 million related to inventory was recorded to reduce the carrying value of inventory to its net realizable value. During 2013, the Company recorded impairment charges of $1,488.1 million, comprised of $1,409.2 million related to property, plant and equipment and $78.9 million related to inventory. The non-cash impairment charge for property, plant and equipment was primarily due to the reduction in the Company’s estimates of future metal prices, and was also impacted by the deferral of potential construction and
2014 2013 Change % Change
Operating Statistics
Tonnes ore mined (000's) 16,647 26,885 (10,238) (38%)
Tonnes processed (000's) (a) 10,584 16,890 (6,306) (37%)
Grade (grams/tonne) (b) 2.16 1.99 0.17 9%
Recovery (b) 90.9% 92.0% (1.1%) (1%)
Gold equivalent ounces:
Produced 260,485 247,818 12,667 5%
Sold 252,668 244,954 7,714 3%
Financial Data (in millions)
Metal sales 319.8$ 344.5$ (24.7)$ (7%)
Production cost of sales 252.2 256.7 (4.5) (2%)
Depreciation, depletion and amortization 66.6 93.8 (27.2) (29%)
Impairment charges 505.5 1,488.1 (982.6) (66%)
(504.5) (1,494.1) 989.6 66%
Exploration and business development 16.0 30.0 (14.0) (47%)
Other 50.9 51.3 (0.4) (1%)
Segment operating loss (571.4)$ (1,575.4)$ 1,004.0$ 64%
(a)
(b)
Includes 8,028,000 tonnes placed on the dump leach pads during 2014 (2013 - 14,386,000 tonnes).
Years ended December 31,
Amount represents mill grade and recovery only. Ore placed on the dump leach pads had an average grade of 0.66
grams per tonne during 2014 (2013 - 0.41 grams per tonne). Due to the nature of dump leach operations, point-in-
time recovery rates are not meaningful.
MANAGEMENT’S DISCUSSION AND ANALYSIS For the year ended December 31, 2014
KINROSS GOLD 2014 ANNUAL REPORT MDA24
production at Tasiast. The impairment charge of $78.9 million related to inventory was recorded to reduce the carrying value of inventory to its net realizable value. Exploration and business development costs decreased by 47% compared with 2013, primarily due to a decrease in exploration activity.

MANAGEMENT’S DISCUSSION AND ANALYSIS For the year ended December 31, 2014
MDA25 KINROSS GOLD 2014 ANNUAL REPORT
Chirano (90% ownership and operator) – Ghana(a)
Kinross acquired its 90% interest in the Chirano mine on September 17, 2010 upon completing its acquisition of Red Back. Chirano is located in southwestern Ghana, approximately 100 kilometres southwest of Kumasi, Ghana's second largest city. A 10% carried interest is held by the government of Ghana.
2014 vs. 2013 During 2014, tonnes of ore mined decreased by 15% compared with 2013 due to planned reduction in open pit mining activity as a result of the Obra open pit having been fully mined in the first quarter of 2014. In addition, tonnes mined from the Tano open pit and the Paboase and Akwaaba underground deposits decreased compared with 2013. Tonnes of ore processed were 6% lower compared with 2013, primarily due to repairs at the mill, which were completed in June 2014. Grades were 14% higher compared with 2013, largely due to the processing of higher grade ore from the Akwaaba deposit. Gold equivalent ounces produced were 4% higher compared with 2013, primarily due to higher grades, partially offset by a decrease in tonnes processed. Metal sales decreased by 8% in 2014 compared with 2013 due to a decrease in metal prices realized. Production cost of sales decreased by 22% compared with 2013, primarily due to a decrease in contractor costs as a result of the transition to owner mining and lower power costs due to a decrease in unit costs and consumption, partially offset by higher labour and plant maintenance costs and an increase in gold equivalent ounces sold. Depreciation, depletion and amortization were 11% higher compared with 2013, due to increases in the depreciable asset base attributable to the acquired self-perform equipment and gold equivalent ounces sold, and a decline in mineral reserves at December 31, 2013. As at December 31, 2014, the Company recorded impairment charges of $370.0 million, comprised of $365.4 million related to property, plant and equipment and $4.6 million related to inventory. The non-cash impairment charge for property, plant and equipment was mainly a result of a decrease in exploration potential. The impairment charge of $4.6 million related to inventory was recorded to reduce the carrying value of inventory to its net realizable value. During 2013, the Company recorded a goodwill impairment charge of $359.8 million at Chirano, primarily due to the reduction in the Company’s estimates of future metal prices.
2014 2013 Change % Change
Operating Statistics
Tonnes ore mined (000's) 3,221 3,786 (565) (15%)
Tonnes processed (000's) 3,144 3,360 (216) (6%)
Grade (grams/tonne) 3.08 2.71 0.37 14%
Recovery 91.9% 93.8% (1.9%) (2%)
Gold equivalent ounces:
Produced 286,542 275,402 11,140 4%
Sold 280,396 278,171 2,225 1%
Financial Data (in millions)
Metal sales 354.9$ 387.8$ (32.9)$ (8%)
Production cost of sales 165.8 211.7 (45.9) (22%)
Depreciation, depletion and amortization 159.7 144.1 15.6 11%
Impairment charges 370.0 359.8 10.2 3%
(340.6) (327.8) (12.8) (4%)
Exploration and business development 13.1 10.2 2.9 28%
Other 11.7 6.4 5.3 83%
Segment operating loss (365.4)$ (344.4)$ (21.0)$ (6%)
(a) Operating and financial data are at 100% for all periods.
Years ended December 31,
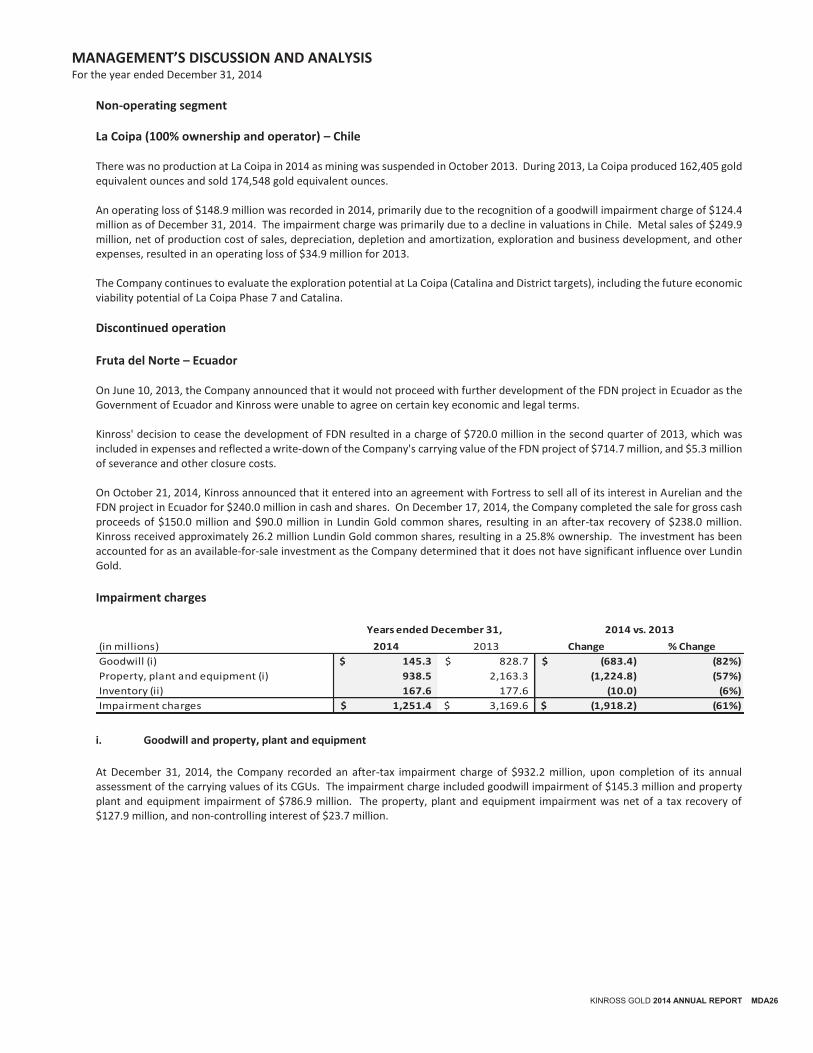
MANAGEMENT’S DISCUSSION AND ANALYSIS For the year ended December 31, 2014
KINROSS GOLD 2014 ANNUAL REPORT MDA26
Non-operating segment
La Coipa (100% ownership and operator) – Chile There was no production at La Coipa in 2014 as mining was suspended in October 2013. During 2013, La Coipa produced 162,405 gold equivalent ounces and sold 174,548 gold equivalent ounces. An operating loss of $148.9 million was recorded in 2014, primarily due to the recognition of a goodwill impairment charge of $124.4 million as of December 31, 2014. The impairment charge was primarily due to a decline in valuations in Chile. Metal sales of $249.9 million, net of production cost of sales, depreciation, depletion and amortization, exploration and business development, and other expenses, resulted in an operating loss of $34.9 million for 2013. The Company continues to evaluate the exploration potential at La Coipa (Catalina and District targets), including the future economic viability potential of La Coipa Phase 7 and Catalina.
Discontinued operation Fruta del Norte – Ecuador On June 10, 2013, the Company announced that it would not proceed with further development of the FDN project in Ecuador as the Government of Ecuador and Kinross were unable to agree on certain key economic and legal terms. Kinross' decision to cease the development of FDN resulted in a charge of $720.0 million in the second quarter of 2013, which was included in expenses and reflected a write-down of the Company's carrying value of the FDN project of $714.7 million, and $5.3 million of severance and other closure costs. On October 21, 2014, Kinross announced that it entered into an agreement with Fortress to sell all of its interest in Aurelian and the FDN project in Ecuador for $240.0 million in cash and shares. On December 17, 2014, the Company completed the sale for gross cash proceeds of $150.0 million and $90.0 million in Lundin Gold common shares, resulting in an after-tax recovery of $238.0 million. Kinross received approximately 26.2 million Lundin Gold common shares, resulting in a 25.8% ownership. The investment has been accounted for as an available-for-sale investment as the Company determined that it does not have significant influence over Lundin Gold.
Impairment charges
i. Goodwill and property, plant and equipment
At December 31, 2014, the Company recorded an after-tax impairment charge of $932.2 million, upon completion of its annual assessment of the carrying values of its CGUs. The impairment charge included goodwill impairment of $145.3 million and property plant and equipment impairment of $786.9 million. The property, plant and equipment impairment was net of a tax recovery of $127.9 million, and non-controlling interest of $23.7 million.
(in millions) 2014 2013 Change % Change
Goodwill (i) 145.3$ 828.7$ (683.4)$ (82%)
Property, plant and equipment (i) 938.5 2,163.3 (1,224.8) (57%)
Inventory (ii) 167.6 177.6 (10.0) (6%)
Impairment charges 1,251.4$ 3,169.6$ (1,918.2)$ (61%)
Years ended December 31, 2014 vs. 2013
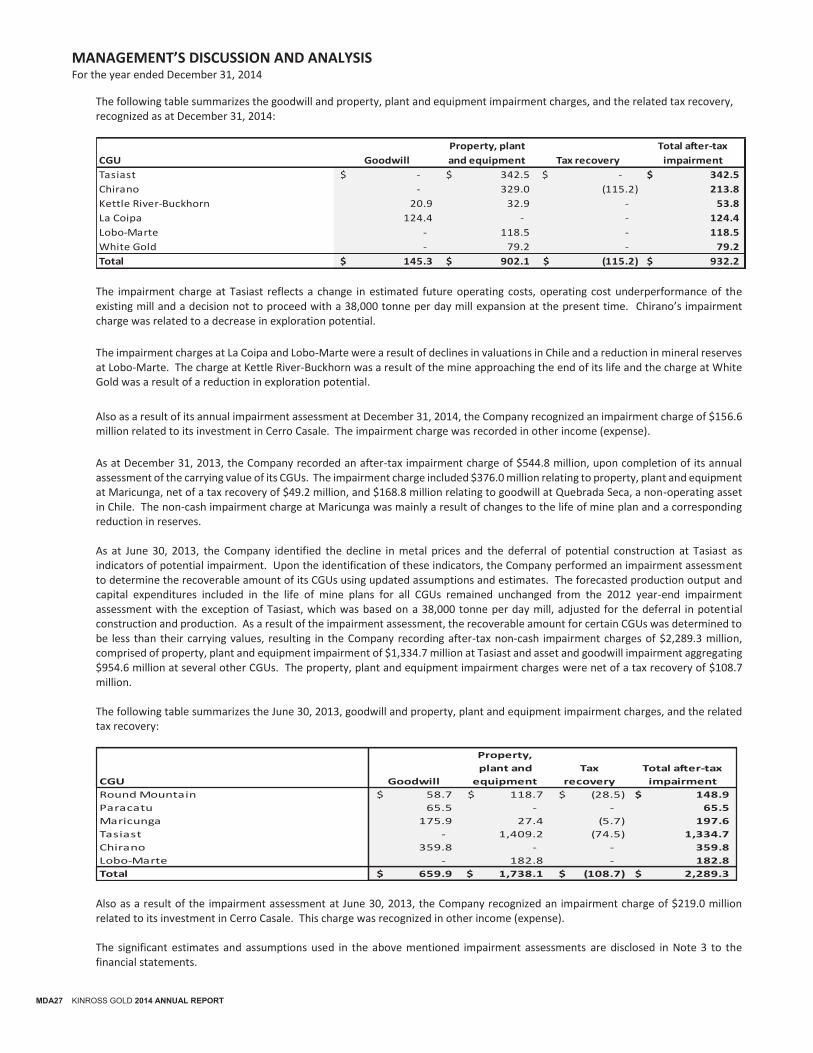
MANAGEMENT’S DISCUSSION AND ANALYSIS For the year ended December 31, 2014
MDA27 KINROSS GOLD 2014 ANNUAL REPORT
The following table summarizes the goodwill and property, plant and equipment impairment charges, and the related tax recovery, recognized as at December 31, 2014:
The impairment charge at Tasiast reflects a change in estimated future operating costs, operating cost underperformance of the existing mill and a decision not to proceed with a 38,000 tonne per day mill expansion at the present time. Chirano’s impairment charge was related to a decrease in exploration potential.
The impairment charges at La Coipa and Lobo-Marte were a result of declines in valuations in Chile and a reduction in mineral reserves at Lobo-Marte. The charge at Kettle River-Buckhorn was a result of the mine approaching the end of its life and the charge at White Gold was a result of a reduction in exploration potential.
Also as a result of its annual impairment assessment at December 31, 2014, the Company recognized an impairment charge of $156.6 million related to its investment in Cerro Casale. The impairment charge was recorded in other income (expense).
As at December 31, 2013, the Company recorded an after-tax impairment charge of $544.8 million, upon completion of its annual assessment of the carrying value of its CGUs. The impairment charge included $376.0 million relating to property, plant and equipment at Maricunga, net of a tax recovery of $49.2 million, and $168.8 million relating to goodwill at Quebrada Seca, a non-operating asset in Chile. The non-cash impairment charge at Maricunga was mainly a result of changes to the life of mine plan and a corresponding reduction in reserves. As at June 30, 2013, the Company identified the decline in metal prices and the deferral of potential construction at Tasiast as indicators of potential impairment. Upon the identification of these indicators, the Company performed an impairment assessment to determine the recoverable amount of its CGUs using updated assumptions and estimates. The forecasted production output and capital expenditures included in the life of mine plans for all CGUs remained unchanged from the 2012 year-end impairment assessment with the exception of Tasiast, which was based on a 38,000 tonne per day mill, adjusted for the deferral in potential construction and production. As a result of the impairment assessment, the recoverable amount for certain CGUs was determined to be less than their carrying values, resulting in the Company recording after-tax non-cash impairment charges of $2,289.3 million, comprised of property, plant and equipment impairment of $1,334.7 million at Tasiast and asset and goodwill impairment aggregating $954.6 million at several other CGUs. The property, plant and equipment impairment charges were net of a tax recovery of $108.7 million. The following table summarizes the June 30, 2013, goodwill and property, plant and equipment impairment charges, and the related tax recovery:
Also as a result of the impairment assessment at June 30, 2013, the Company recognized an impairment charge of $219.0 million related to its investment in Cerro Casale. This charge was recognized in other income (expense). The significant estimates and assumptions used in the above mentioned impairment assessments are disclosed in Note 3 to the financial statements.
CGU Goodwill
Property, plant
and equipment Tax recovery
Total after-tax
impairment
Tasiast -$ 342.5$ -$ 342.5$
Chirano - 329.0 (115.2) 213.8
Kettle River-Buckhorn 20.9 32.9 - 53.8
La Coipa 124.4 - - 124.4
Lobo-Marte - 118.5 - 118.5
White Gold - 79.2 - 79.2
Total 145.3$ 902.1$ (115.2)$ 932.2$
CGU Goodwill
Property,
plant and
equipment
Tax
recovery
Total after-tax
impairment
Round Mountain 58.7$ 118.7$ (28.5)$ 148.9$
Paracatu 65.5 - - 65.5
Maricunga 175.9 27.4 (5.7) 197.6
Tasiast - 1,409.2 (74.5) 1,334.7
Chirano 359.8 - - 359.8
Lobo-Marte - 182.8 - 182.8
Total 659.9$ 1,738.1$ (108.7)$ 2,289.3$
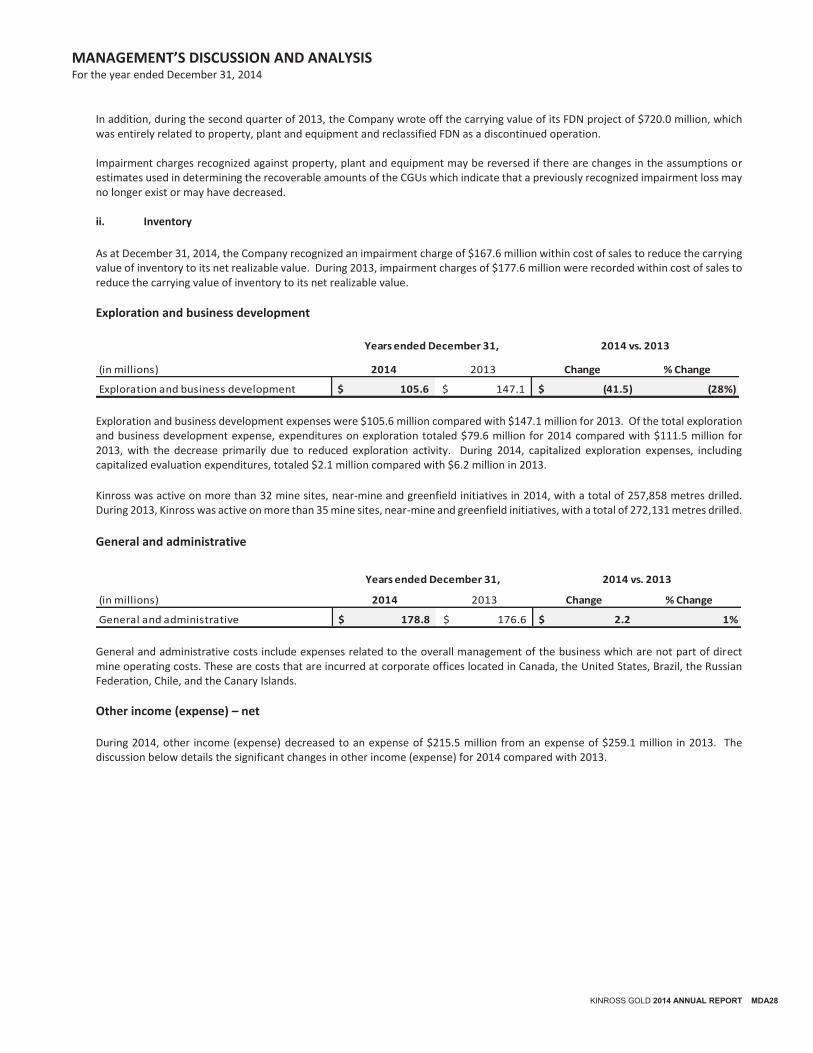
MANAGEMENT’S DISCUSSION AND ANALYSIS For the year ended December 31, 2014
KINROSS GOLD 2014 ANNUAL REPORT MDA28
In addition, during the second quarter of 2013, the Company wrote off the carrying value of its FDN project of $720.0 million, which was entirely related to property, plant and equipment and reclassified FDN as a discontinued operation. Impairment charges recognized against property, plant and equipment may be reversed if there are changes in the assumptions or estimates used in determining the recoverable amounts of the CGUs which indicate that a previously recognized impairment loss may no longer exist or may have decreased. ii. Inventory
As at December 31, 2014, the Company recognized an impairment charge of $167.6 million within cost of sales to reduce the carrying value of inventory to its net realizable value. During 2013, impairment charges of $177.6 million were recorded within cost of sales to reduce the carrying value of inventory to its net realizable value.
Exploration and business development
Exploration and business development expenses were $105.6 million compared with $147.1 million for 2013. Of the total exploration and business development expense, expenditures on exploration totaled $79.6 million for 2014 compared with $111.5 million for 2013, with the decrease primarily due to reduced exploration activity. During 2014, capitalized exploration expenses, including capitalized evaluation expenditures, totaled $2.1 million compared with $6.2 million in 2013.
Kinross was active on more than 32 mine sites, near-mine and greenfield initiatives in 2014, with a total of 257,858 metres drilled. During 2013, Kinross was active on more than 35 mine sites, near-mine and greenfield initiatives, with a total of 272,131 metres drilled.
General and administrative
General and administrative costs include expenses related to the overall management of the business which are not part of direct mine operating costs. These are costs that are incurred at corporate offices located in Canada, the United States, Brazil, the Russian Federation, Chile, and the Canary Islands.
Other income (expense) – net During 2014, other income (expense) decreased to an expense of $215.5 million from an expense of $259.1 million in 2013. The discussion below details the significant changes in other income (expense) for 2014 compared with 2013.
(in millions) 2014 2013 Change % Change
Exploration and business development 105.6$ 147.1$ (41.5)$ (28%)
Years ended December 31, 2014 vs. 2013
(in millions) 2014 2013 Change % Change
General and administrative 178.8$ 176.6$ 2.2$ 1%
Years ended December 31, 2014 vs. 2013
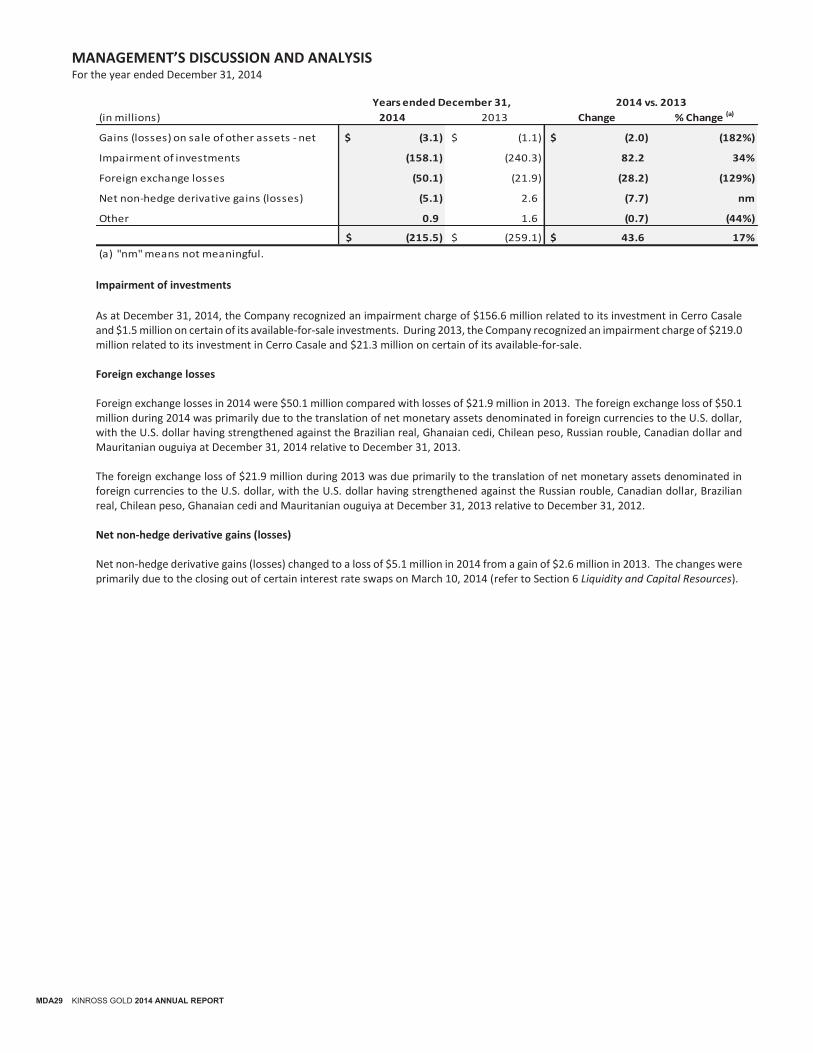
MANAGEMENT’S DISCUSSION AND ANALYSIS For the year ended December 31, 2014
MDA29 KINROSS GOLD 2014 ANNUAL REPORT
Impairment of investments
As at December 31, 2014, the Company recognized an impairment charge of $156.6 million related to its investment in Cerro Casale and $1.5 million on certain of its available-for-sale investments. During 2013, the Company recognized an impairment charge of $219.0 million related to its investment in Cerro Casale and $21.3 million on certain of its available-for-sale. Foreign exchange losses Foreign exchange losses in 2014 were $50.1 million compared with losses of $21.9 million in 2013. The foreign exchange loss of $50.1 million during 2014 was primarily due to the translation of net monetary assets denominated in foreign currencies to the U.S. dollar, with the U.S. dollar having strengthened against the Brazilian real, Ghanaian cedi, Chilean peso, Russian rouble, Canadian dollar and Mauritanian ouguiya at December 31, 2014 relative to December 31, 2013. The foreign exchange loss of $21.9 million during 2013 was due primarily to the translation of net monetary assets denominated in foreign currencies to the U.S. dollar, with the U.S. dollar having strengthened against the Russian rouble, Canadian dollar, Brazilian real, Chilean peso, Ghanaian cedi and Mauritanian ouguiya at December 31, 2013 relative to December 31, 2012. Net non-hedge derivative gains (losses) Net non-hedge derivative gains (losses) changed to a loss of $5.1 million in 2014 from a gain of $2.6 million in 2013. The changes were primarily due to the closing out of certain interest rate swaps on March 10, 2014 (refer to Section 6 Liquidity and Capital Resources).
(in millions) 2014 2013 Change % Change (a)
Gains (losses) on sale of other assets - net (3.1)$ (1.1)$ (2.0)$ (182%)
Impairment of investments (158.1) (240.3) 82.2 34%
Foreign exchange losses (50.1) (21.9) (28.2) (129%)
Net non-hedge derivative gains (losses) (5.1) 2.6 (7.7) nm
Other 0.9 1.6 (0.7) (44%)
(215.5)$ (259.1)$ 43.6$ 17%
(a) "nm" means not meaningful.
Years ended December 31, 2014 vs. 2013
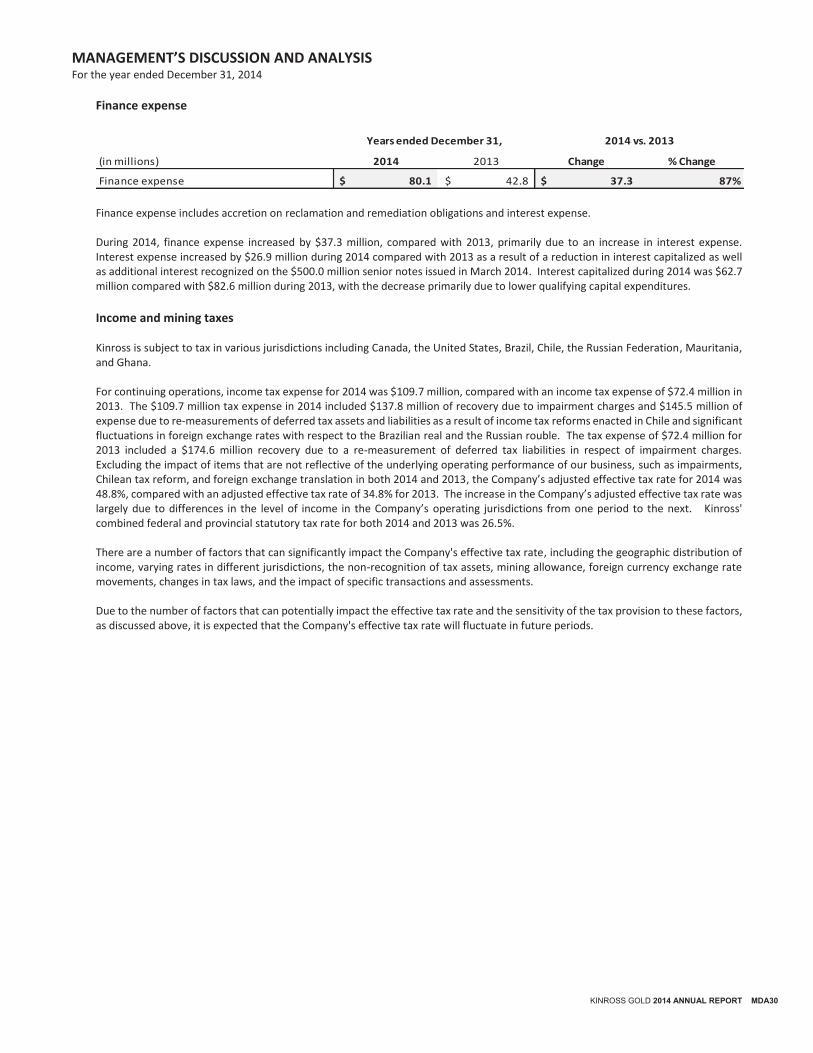
MANAGEMENT’S DISCUSSION AND ANALYSIS For the year ended December 31, 2014
KINROSS GOLD 2014 ANNUAL REPORT MDA30
Finance expense
Finance expense includes accretion on reclamation and remediation obligations and interest expense. During 2014, finance expense increased by $37.3 million, compared with 2013, primarily due to an increase in interest expense. Interest expense increased by $26.9 million during 2014 compared with 2013 as a result of a reduction in interest capitalized as well as additional interest recognized on the $500.0 million senior notes issued in March 2014. Interest capitalized during 2014 was $62.7 million compared with $82.6 million during 2013, with the decrease primarily due to lower qualifying capital expenditures.
Income and mining taxes Kinross is subject to tax in various jurisdictions including Canada, the United States, Brazil, Chile, the Russian Federation, Mauritania, and Ghana. For continuing operations, income tax expense for 2014 was $109.7 million, compared with an income tax expense of $72.4 million in 2013. The $109.7 million tax expense in 2014 included $137.8 million of recovery due to impairment charges and $145.5 million of expense due to re-measurements of deferred tax assets and liabilities as a result of income tax reforms enacted in Chile and significant fluctuations in foreign exchange rates with respect to the Brazilian real and the Russian rouble. The tax expense of $72.4 million for 2013 included a $174.6 million recovery due to a re-measurement of deferred tax liabilities in respect of impairment charges. Excluding the impact of items that are not reflective of the underlying operating performance of our business, such as impairments, Chilean tax reform, and foreign exchange translation in both 2014 and 2013, the Company’s adjusted effective tax rate for 2014 was 48.8%, compared with an adjusted effective tax rate of 34.8% for 2013. The increase in the Company’s adjusted effective tax rate was largely due to differences in the level of income in the Company’s operating jurisdictions from one period to the next. Kinross' combined federal and provincial statutory tax rate for both 2014 and 2013 was 26.5%. There are a number of factors that can significantly impact the Company's effective tax rate, including the geographic distribution of income, varying rates in different jurisdictions, the non-recognition of tax assets, mining allowance, foreign currency exchange rate movements, changes in tax laws, and the impact of specific transactions and assessments. Due to the number of factors that can potentially impact the effective tax rate and the sensitivity of the tax provision to these factors, as discussed above, it is expected that the Company's effective tax rate will fluctuate in future periods.
(in millions) 2014 2013 Change % Change
Finance expense 80.1$ 42.8$ 37.3$ 87%
Years ended December 31, 2014 vs. 2013
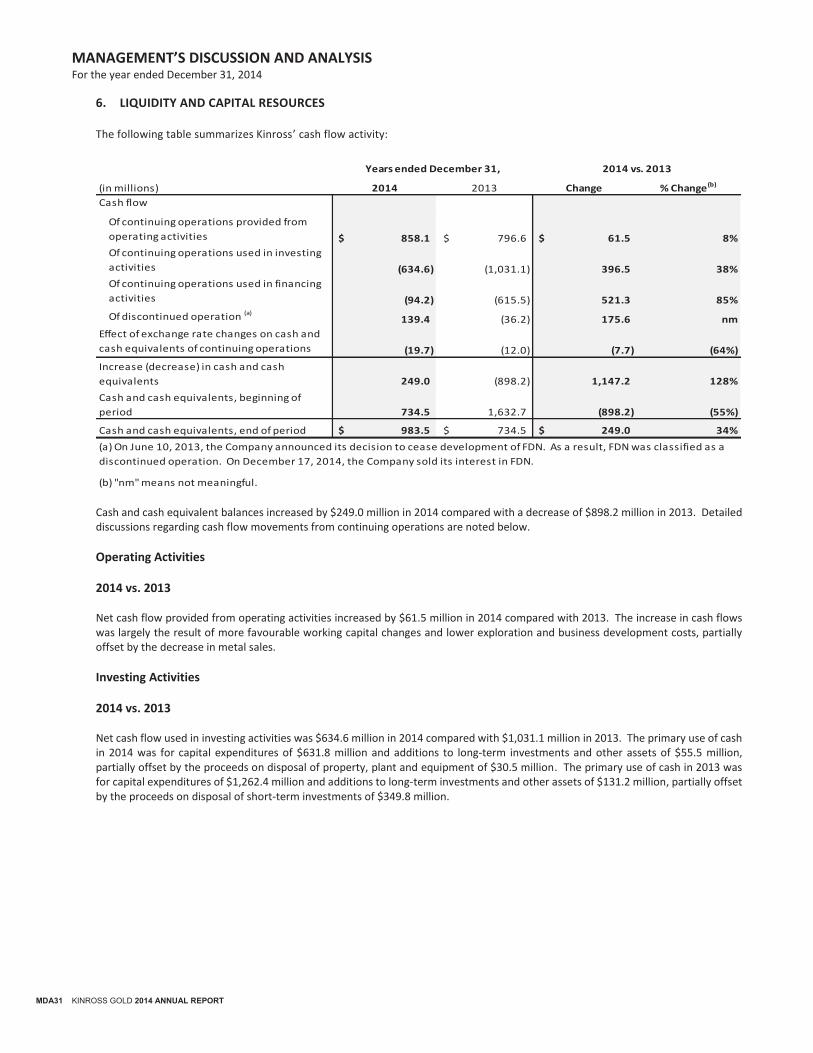
MANAGEMENT’S DISCUSSION AND ANALYSIS For the year ended December 31, 2014
MDA31 KINROSS GOLD 2014 ANNUAL REPORT
6. LIQUIDITY AND CAPITAL RESOURCES
The following table summarizes Kinross’ cash flow activity:
Cash and cash equivalent balances increased by $249.0 million in 2014 compared with a decrease of $898.2 million in 2013. Detailed discussions regarding cash flow movements from continuing operations are noted below.
Operating Activities
2014 vs. 2013 Net cash flow provided from operating activities increased by $61.5 million in 2014 compared with 2013. The increase in cash flows was largely the result of more favourable working capital changes and lower exploration and business development costs, partially offset by the decrease in metal sales.
Investing Activities
2014 vs. 2013 Net cash flow used in investing activities was $634.6 million in 2014 compared with $1,031.1 million in 2013. The primary use of cash in 2014 was for capital expenditures of $631.8 million and additions to long-term investments and other assets of $55.5 million, partially offset by the proceeds on disposal of property, plant and equipment of $30.5 million. The primary use of cash in 2013 was for capital expenditures of $1,262.4 million and additions to long-term investments and other assets of $131.2 million, partially offset by the proceeds on disposal of short-term investments of $349.8 million.
(in millions) 2014 2013 Change % Change(b)
Cash flow
Of continuing operations provided from
operating activities 858.1$ 796.6$ 61.5$ 8%
Of continuing operations used in investing
activities (634.6) (1,031.1) 396.5 38%
Of continuing operations used in financing
activities (94.2) (615.5) 521.3 85%
Of discontinued operation (a)139.4 (36.2) 175.6 nm
Effect of exchange rate changes on cash and
cash equivalents of continuing operations (19.7) (12.0) (7.7) (64%)
Increase (decrease) in cash and cash
equivalents 249.0 (898.2) 1,147.2 128%
Cash and cash equivalents, beginning of
period 734.5 1,632.7 (898.2) (55%)
Cash and cash equivalents, end of period 983.5$ 734.5$ 249.0$ 34%
Years ended December 31, 2014 vs. 2013
(a) On June 10, 2013, the Company announced its decision to cease development of FDN. As a result, FDN was classified as a
discontinued operation. On December 17, 2014, the Company sold its interest in FDN.
(b) "nm" means not meaningful.
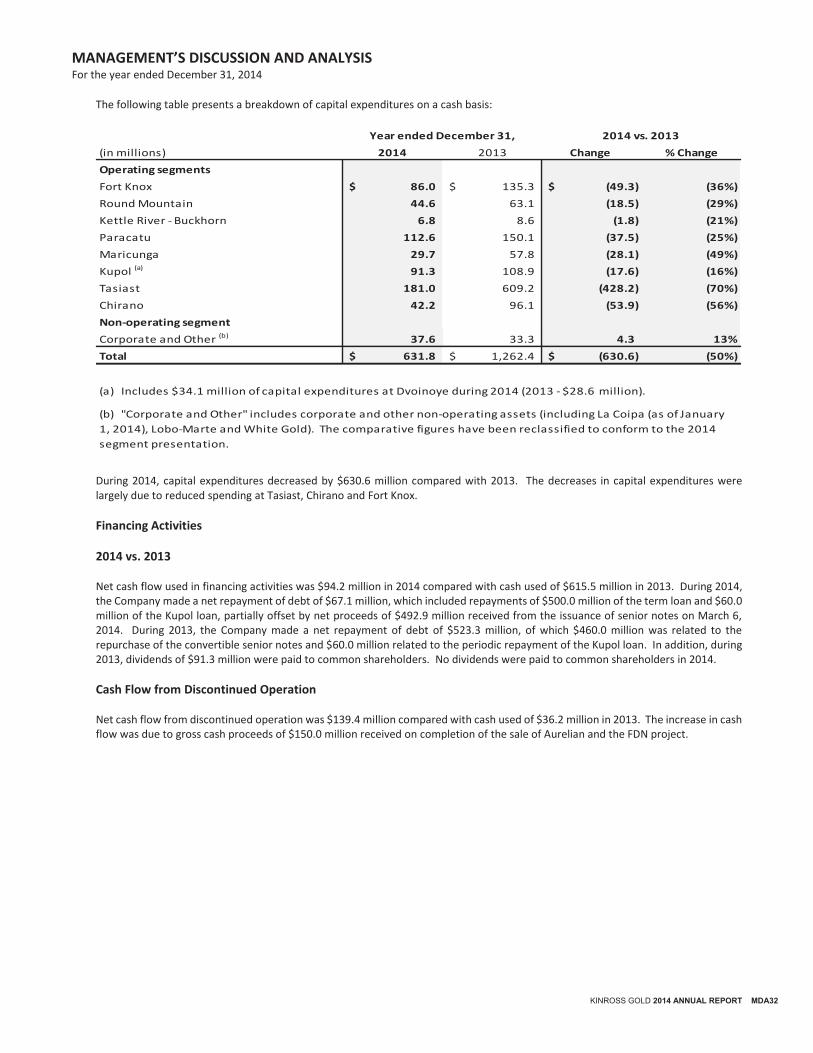
MANAGEMENT’S DISCUSSION AND ANALYSIS For the year ended December 31, 2014
KINROSS GOLD 2014 ANNUAL REPORT MDA32
The following table presents a breakdown of capital expenditures on a cash basis:
During 2014, capital expenditures decreased by $630.6 million compared with 2013. The decreases in capital expenditures were largely due to reduced spending at Tasiast, Chirano and Fort Knox.
Financing Activities
2014 vs. 2013 Net cash flow used in financing activities was $94.2 million in 2014 compared with cash used of $615.5 million in 2013. During 2014, the Company made a net repayment of debt of $67.1 million, which included repayments of $500.0 million of the term loan and $60.0 million of the Kupol loan, partially offset by net proceeds of $492.9 million received from the issuance of senior notes on March 6, 2014. During 2013, the Company made a net repayment of debt of $523.3 million, of which $460.0 million was related to the repurchase of the convertible senior notes and $60.0 million related to the periodic repayment of the Kupol loan. In addition, during 2013, dividends of $91.3 million were paid to common shareholders. No dividends were paid to common shareholders in 2014.
Cash Flow from Discontinued Operation Net cash flow from discontinued operation was $139.4 million compared with cash used of $36.2 million in 2013. The increase in cash flow was due to gross cash proceeds of $150.0 million received on completion of the sale of Aurelian and the FDN project.
(in millions) 2014 2013 Change % Change
Operating segments
Fort Knox 86.0$ 135.3$ (49.3)$ (36%)
Round Mountain 44.6 63.1 (18.5) (29%)
Kettle River - Buckhorn 6.8 8.6 (1.8) (21%)
Paracatu 112.6 150.1 (37.5) (25%)
Maricunga 29.7 57.8 (28.1) (49%)
Kupol (a) 91.3 108.9 (17.6) (16%)
Tasiast 181.0 609.2 (428.2) (70%)
Chirano 42.2 96.1 (53.9) (56%)
Non-operating segment
Corporate and Other (b) 37.6 33.3 4.3 13%
Total 631.8$ 1,262.4$ (630.6)$ (50%)
(a) Includes $34.1 million of capital expenditures at Dvoinoye during 2014 (2013 - $28.6 million).
(b) "Corporate and Other" includes corporate and other non-operating assets (including La Coipa (as of January
1, 2014), Lobo-Marte and White Gold). The comparative figures have been reclassified to conform to the 2014
segment presentation.
Year ended December 31, 2014 vs. 2013
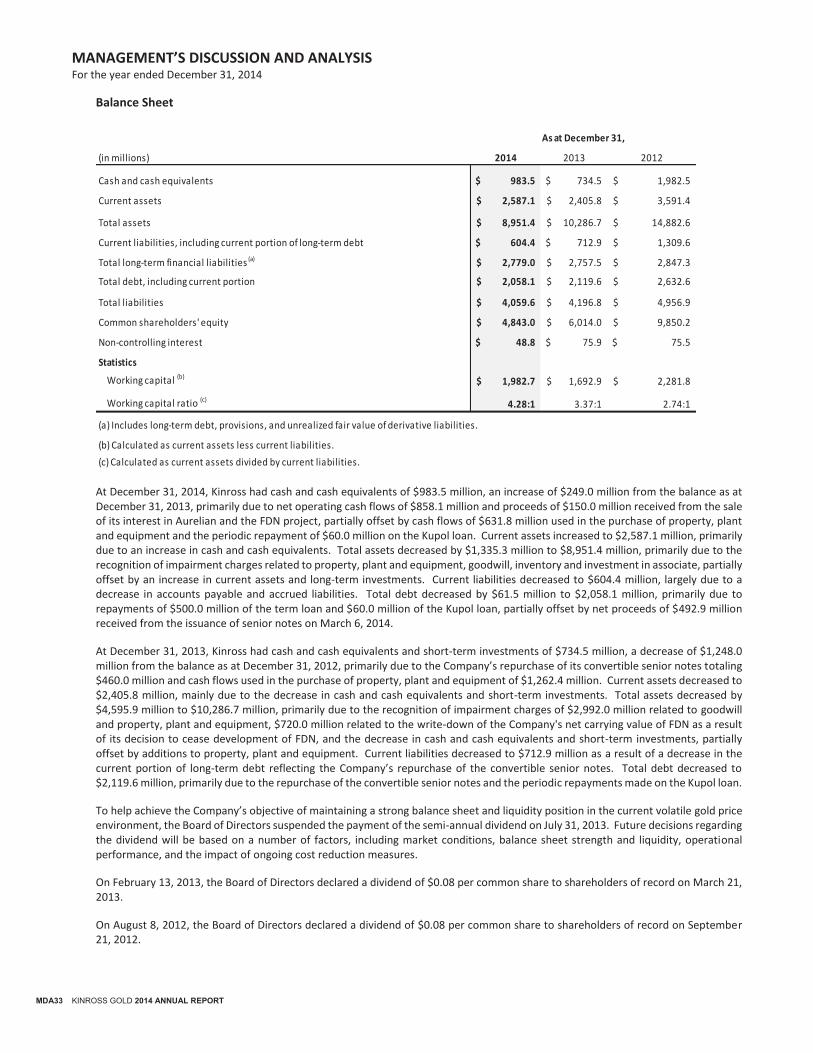
MANAGEMENT’S DISCUSSION AND ANALYSIS For the year ended December 31, 2014
MDA33 KINROSS GOLD 2014 ANNUAL REPORT
Balance Sheet
At December 31, 2014, Kinross had cash and cash equivalents of $983.5 million, an increase of $249.0 million from the balance as at December 31, 2013, primarily due to net operating cash flows of $858.1 million and proceeds of $150.0 million received from the sale of its interest in Aurelian and the FDN project, partially offset by cash flows of $631.8 million used in the purchase of property, plant and equipment and the periodic repayment of $60.0 million on the Kupol loan. Current assets increased to $2,587.1 million, primarily due to an increase in cash and cash equivalents. Total assets decreased by $1,335.3 million to $8,951.4 million, primarily due to the recognition of impairment charges related to property, plant and equipment, goodwill, inventory and investment in associate, partially offset by an increase in current assets and long-term investments. Current liabilities decreased to $604.4 million, largely due to a decrease in accounts payable and accrued liabilities. Total debt decreased by $61.5 million to $2,058.1 million, primarily due to repayments of $500.0 million of the term loan and $60.0 million of the Kupol loan, partially offset by net proceeds of $492.9 million received from the issuance of senior notes on March 6, 2014.
At December 31, 2013, Kinross had cash and cash equivalents and short-term investments of $734.5 million, a decrease of $1,248.0 million from the balance as at December 31, 2012, primarily due to the Company’s repurchase of its convertible senior notes totaling $460.0 million and cash flows used in the purchase of property, plant and equipment of $1,262.4 million. Current assets decreased to $2,405.8 million, mainly due to the decrease in cash and cash equivalents and short-term investments. Total assets decreased by $4,595.9 million to $10,286.7 million, primarily due to the recognition of impairment charges of $2,992.0 million related to goodwill and property, plant and equipment, $720.0 million related to the write-down of the Company's net carrying value of FDN as a result of its decision to cease development of FDN, and the decrease in cash and cash equivalents and short-term investments, partially offset by additions to property, plant and equipment. Current liabilities decreased to $712.9 million as a result of a decrease in the current portion of long-term debt reflecting the Company’s repurchase of the convertible senior notes. Total debt decreased to $2,119.6 million, primarily due to the repurchase of the convertible senior notes and the periodic repayments made on the Kupol loan.
To help achieve the Company’s objective of maintaining a strong balance sheet and liquidity position in the current volatile gold price environment, the Board of Directors suspended the payment of the semi-annual dividend on July 31, 2013. Future decisions regarding the dividend will be based on a number of factors, including market conditions, balance sheet strength and liquidity, operational performance, and the impact of ongoing cost reduction measures.
On February 13, 2013, the Board of Directors declared a dividend of $0.08 per common share to shareholders of record on March 21, 2013.
On August 8, 2012, the Board of Directors declared a dividend of $0.08 per common share to shareholders of record on September 21, 2012.
(in millions) 2014 2013 2012
Cash and cash equivalents 983.5$ 734.5$ 1,982.5$
Current assets 2,587.1$ 2,405.8$ 3,591.4$
Total assets 8,951.4$ 10,286.7$ 14,882.6$
Current liabilities, including current portion of long-term debt 604.4$ 712.9$ 1,309.6$
Total long-term financial liabilities (a) 2,779.0$ 2,757.5$ 2,847.3$
Total debt, including current portion 2,058.1$ 2,119.6$ 2,632.6$
Total liabilities 4,059.6$ 4,196.8$ 4,956.9$
Common shareholders' equity 4,843.0$ 6,014.0$ 9,850.2$
Non-controlling interest 48.8$ 75.9$ 75.5$
Statistics
Working capital (b)1,982.7$ 1,692.9$ 2,281.8$
Working capital ratio (c)4.28:1 3.37:1 2.74:1
(a) Includes long-term debt, provisions, and unrealized fair value of derivative liabilities.
(b) Calculated as current assets less current liabilities.
(c) Calculated as current assets divided by current liabilities.
As at December 31,
MANAGEMENT’S DISCUSSION AND ANALYSIS For the year ended December 31, 2014
KINROSS GOLD 2014 ANNUAL REPORT MDA34
On February 15, 2012, the Board of Directors declared a dividend of $0.08 per common share to shareholders of record on March 23, 2012.
As of February 9, 2015, there were 1,144.6 million common shares of the Company issued and outstanding. In addition, at the same date, the Company had 14.1 million share purchase options outstanding under its share option plan.
Financings and Credit Facilities Senior notes On August 22, 2011, the Company completed a $1.0 billion offering of debt securities, consisting of $250.0 million principal amount of 3.625% senior notes due 2016, $500.0 million principal amount of 5.125% senior notes due 2021 and $250.0 million principal amount of 6.875% senior notes due 2041. Kinross received net proceeds of $980.9 million from the offering, after discount and payment of fees and expenses related to the offering. On March 6, 2014, the Company completed a $500.0 million offering of debt securities consisting of 5.950% senior notes due 2024. Kinross received net proceeds of $492.9 million from the offering, after discount and payment of fees and expenses related to the offering. The senior notes referred to above (collectively, the “notes”) pay interest semi-annually. Except as noted below, the notes are redeemable by the Company, in whole or part, for cash at any time prior to maturity, at a redemption price equal to the greater of 100% of the principal amount or the sum of the present value of the remaining scheduled principal and interest payments on the notes discounted at the applicable treasury rate, as defined in the indentures, plus a premium of between 40 and 50 basis points, plus accrued interest, if any. Within three months of maturity of the notes due in 2021 and 2024 and within six months of maturity of the notes due in 2041, the Company can only redeem the notes in whole at 100% of the principal amount plus accrued interest, if any. In addition, the Company is required to make an offer to repurchase the notes prior to maturity upon certain fundamental changes at a repurchase price equal to 101% of the principal amount of the notes plus accrued and unpaid interest to the repurchase date, if any.
Kupol loan On December 21, 2011, the Company completed a $200.0 million non-recourse loan from a group of international financial institutions. The non-recourse loan carries a term of five years, maturing on September 30, 2016 and bears annual interest of LIBOR plus 2.5%. Semi-annual principal repayments of $30.0 million commenced in March 2013 and will continue through September 30, 2015. Principal repayments due on March 31, 2016 and September 30, 2016 are reduced to $13.0 million and $7.0 million, respectively. The Company may prepay the loan in whole or in part, without penalty, but subject to customary break costs, if any. The agreement contains various requirements that include limits on distributions if certain minimum debt service coverage levels are not achieved. Property, plant and equipment with a carrying amount of $170.7 million (December 31, 2013 - $154.7 million) are pledged as security as part of the Kupol loan. As at December 31, 2014, cash of $34.0 million (December 31, 2013 - $34.0 million) was restricted for payments related to the loan.
Corporate revolving credit and term loan facilities In August 2012, the Company completed a new unsecured term loan facility for $1,000.0 million. The facility was set to mature on August 10, 2015, with the full amount having been drawn on August 22, 2012. Also, in August 2012, under the same agreement, the Company amended the revolving credit facility increasing the available amount to $1,500.0 million and extending the maturity date from March 2015 to August 2017. On June 10, 2013, the Company amended its $1,500.0 million revolving credit facility and $1,000.0 million term loan to extend the respective maturity dates and remove the minimum tangible net worth covenant. The revolving credit facility’s term was extended by one year to August 10, 2018 from August 10, 2017, and the term loan was extended by two years to mature on August 10, 2017 from August 10, 2015. On March 10, 2014, the Company repaid $500.0 million of the term loan, leaving a balance of $500.0 million outstanding. On July 28, 2014, the Company extended the maturity dates of the term loan and revolving credit facility by one year to August 10, 2018 and August 10, 2019, respectively. As at December 31, 2014, the Company had utilized $32.1 million (December 31, 2013 – $31.9 million) of the amended revolving credit facility. The amount utilized was entirely for letters of credit.
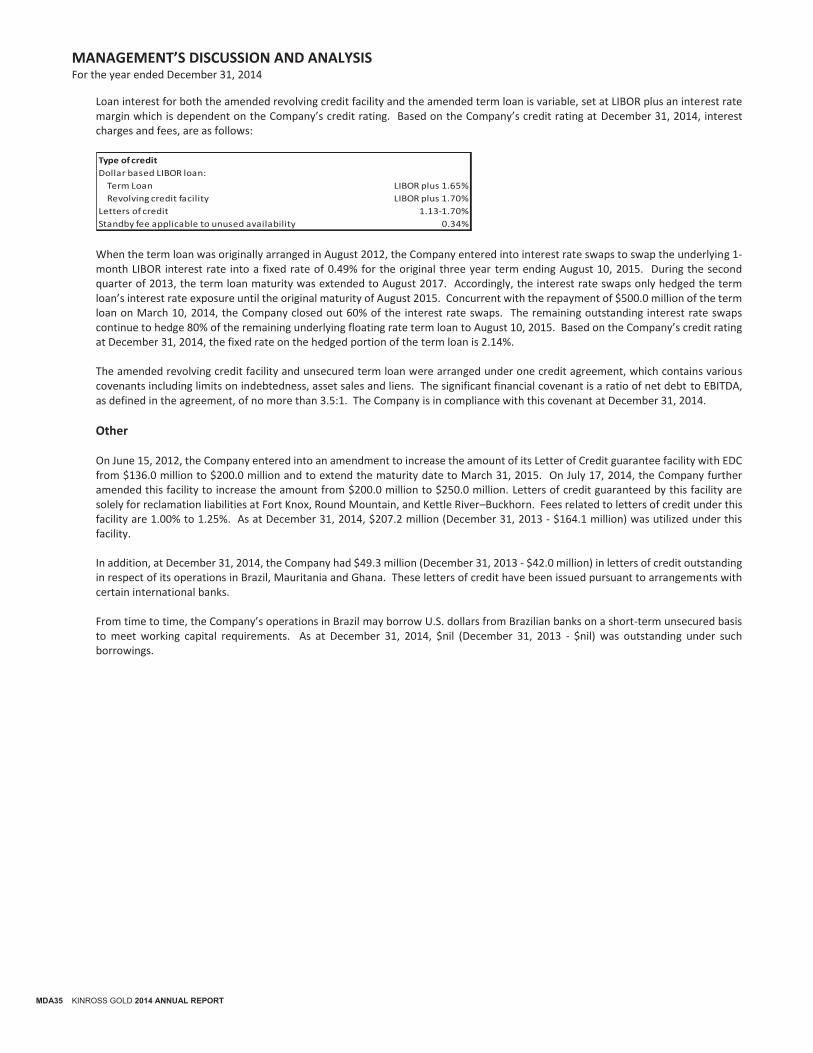
MANAGEMENT’S DISCUSSION AND ANALYSIS For the year ended December 31, 2014
MDA35 KINROSS GOLD 2014 ANNUAL REPORT
Loan interest for both the amended revolving credit facility and the amended term loan is variable, set at LIBOR plus an interest rate margin which is dependent on the Company’s credit rating. Based on the Company’s credit rating at December 31, 2014, interest charges and fees, are as follows:
When the term loan was originally arranged in August 2012, the Company entered into interest rate swaps to swap the underlying 1-month LIBOR interest rate into a fixed rate of 0.49% for the original three year term ending August 10, 2015. During the second quarter of 2013, the term loan maturity was extended to August 2017. Accordingly, the interest rate swaps only hedged the term loan’s interest rate exposure until the original maturity of August 2015. Concurrent with the repayment of $500.0 million of the term loan on March 10, 2014, the Company closed out 60% of the interest rate swaps. The remaining outstanding interest rate swaps continue to hedge 80% of the remaining underlying floating rate term loan to August 10, 2015. Based on the Company’s credit rating at December 31, 2014, the fixed rate on the hedged portion of the term loan is 2.14%. The amended revolving credit facility and unsecured term loan were arranged under one credit agreement, which contains various covenants including limits on indebtedness, asset sales and liens. The significant financial covenant is a ratio of net debt to EBITDA, as defined in the agreement, of no more than 3.5:1. The Company is in compliance with this covenant at December 31, 2014.
Other On June 15, 2012, the Company entered into an amendment to increase the amount of its Letter of Credit guarantee facility with EDC from $136.0 million to $200.0 million and to extend the maturity date to March 31, 2015. On July 17, 2014, the Company further amended this facility to increase the amount from $200.0 million to $250.0 million. Letters of credit guaranteed by this facility are solely for reclamation liabilities at Fort Knox, Round Mountain, and Kettle River–Buckhorn. Fees related to letters of credit under this facility are 1.00% to 1.25%. As at December 31, 2014, $207.2 million (December 31, 2013 - $164.1 million) was utilized under this facility. In addition, at December 31, 2014, the Company had $49.3 million (December 31, 2013 - $42.0 million) in letters of credit outstanding in respect of its operations in Brazil, Mauritania and Ghana. These letters of credit have been issued pursuant to arrangements with certain international banks.
From time to time, the Company’s operations in Brazil may borrow U.S. dollars from Brazilian banks on a short-term unsecured basis to meet working capital requirements. As at December 31, 2014, $nil (December 31, 2013 - $nil) was outstanding under such borrowings.
Type of credit
Dollar based LIBOR loan:
Term Loan LIBOR plus 1.65%
Revolving credit facility LIBOR plus 1.70%
Letters of credit 1.13-1.70%
Standby fee applicable to unused availability 0.34%
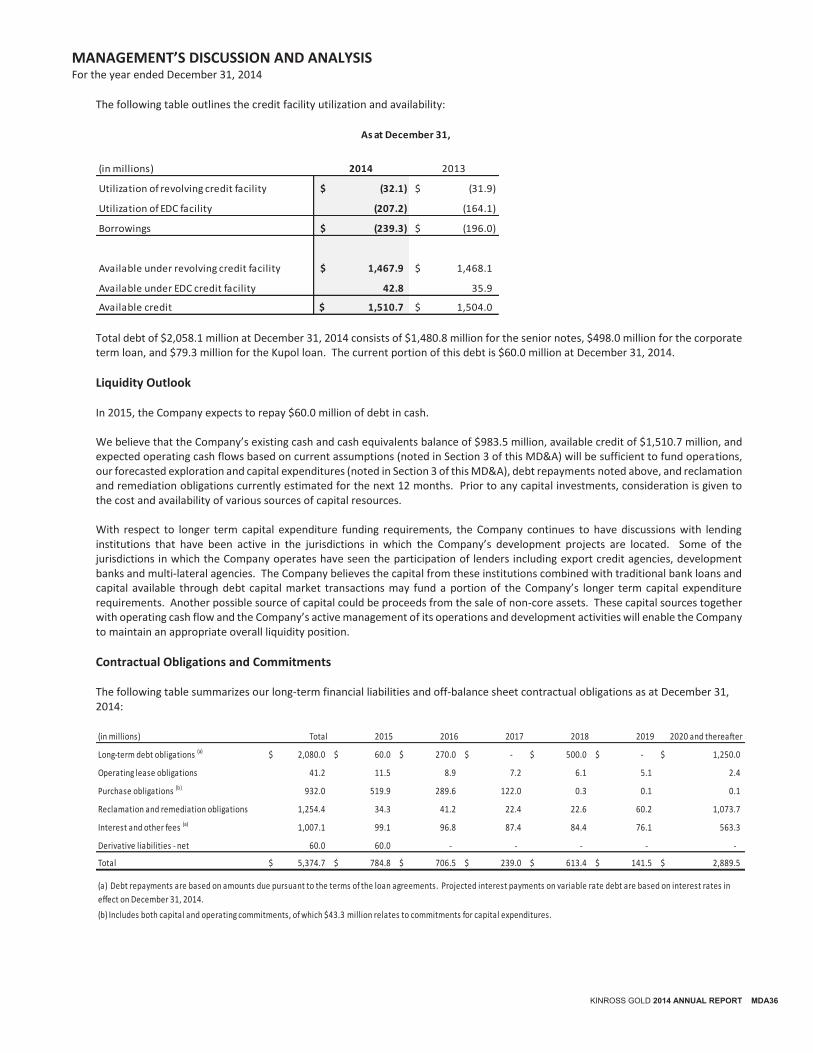
MANAGEMENT’S DISCUSSION AND ANALYSIS For the year ended December 31, 2014
KINROSS GOLD 2014 ANNUAL REPORT MDA36
The following table outlines the credit facility utilization and availability:
Total debt of $2,058.1 million at December 31, 2014 consists of $1,480.8 million for the senior notes, $498.0 million for the corporate term loan, and $79.3 million for the Kupol loan. The current portion of this debt is $60.0 million at December 31, 2014.
Liquidity Outlook
In 2015, the Company expects to repay $60.0 million of debt in cash. We believe that the Company’s existing cash and cash equivalents balance of $983.5 million, available credit of $1,510.7 million, and expected operating cash flows based on current assumptions (noted in Section 3 of this MD&A) will be sufficient to fund operations, our forecasted exploration and capital expenditures (noted in Section 3 of this MD&A), debt repayments noted above, and reclamation and remediation obligations currently estimated for the next 12 months. Prior to any capital investments, consideration is given to the cost and availability of various sources of capital resources.
With respect to longer term capital expenditure funding requirements, the Company continues to have discussions with lending institutions that have been active in the jurisdictions in which the Company’s development projects are located. Some of the jurisdictions in which the Company operates have seen the participation of lenders including export credit agencies, development banks and multi-lateral agencies. The Company believes the capital from these institutions combined with traditional bank loans and capital available through debt capital market transactions may fund a portion of the Company’s longer term capital expenditure requirements. Another possible source of capital could be proceeds from the sale of non-core assets. These capital sources together with operating cash flow and the Company’s active management of its operations and development activities will enable the Company to maintain an appropriate overall liquidity position.
Contractual Obligations and Commitments
The following table summarizes our long-term financial liabilities and off-balance sheet contractual obligations as at December 31, 2014:
(in millions) 2014 2013
Utilization of revolving credit facility (32.1)$ (31.9)$
Utilization of EDC facility (207.2) (164.1)
Borrowings (239.3)$ (196.0)$
Available under revolving credit facility 1,467.9$ 1,468.1$
Available under EDC credit facility 42.8 35.9
Available credit 1,510.7$ 1,504.0$
As at December 31,
(in millions) Total 2015 2016 2017 2018 2019 2020 and thereafter
Long-term debt obligations (a) 2,080.0$ 60.0$ 270.0$ -$ 500.0$ -$ 1,250.0$
Operating lease obligations 41.2 11.5 8.9 7.2 6.1 5.1 2.4
Purchase obligations (b) 932.0 519.9 289.6 122.0 0.3 0.1 0.1
Reclamation and remediation obligations 1,254.4 34.3 41.2 22.4 22.6 60.2 1,073.7
Interest and other fees (a) 1,007.1 99.1 96.8 87.4 84.4 76.1 563.3
Derivative liabilities - net 60.0 60.0 - - - - -
Total 5,374.7$ 784.8$ 706.5$ 239.0$ 613.4$ 141.5$ 2,889.5$
(a) Debt repayments are based on amounts due pursuant to the terms of the loan agreements. Projected interest payments on variable rate debt are based on interest rates in
effect on December 31, 2014.
(b) Includes both capital and operating commitments, of which $43.3 million relates to commitments for capital expenditures.
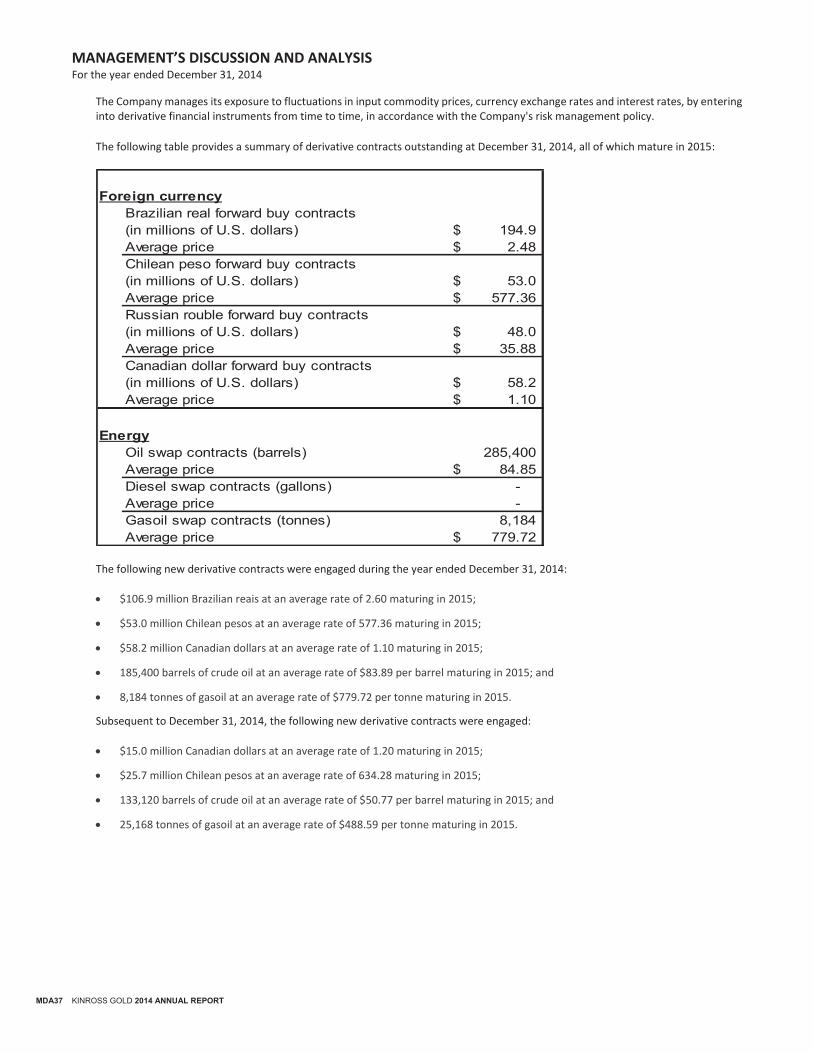
MANAGEMENT’S DISCUSSION AND ANALYSIS For the year ended December 31, 2014
MDA37 KINROSS GOLD 2014 ANNUAL REPORT
The Company manages its exposure to fluctuations in input commodity prices, currency exchange rates and interest rates, by entering into derivative financial instruments from time to time, in accordance with the Company's risk management policy.
The following table provides a summary of derivative contracts outstanding at December 31, 2014, all of which mature in 2015:
The following new derivative contracts were engaged during the year ended December 31, 2014:
$106.9 million Brazilian reais at an average rate of 2.60 maturing in 2015;
$53.0 million Chilean pesos at an average rate of 577.36 maturing in 2015;
$58.2 million Canadian dollars at an average rate of 1.10 maturing in 2015;
185,400 barrels of crude oil at an average rate of $83.89 per barrel maturing in 2015; and
8,184 tonnes of gasoil at an average rate of $779.72 per tonne maturing in 2015.
Subsequent to December 31, 2014, the following new derivative contracts were engaged:
$15.0 million Canadian dollars at an average rate of 1.20 maturing in 2015;
$25.7 million Chilean pesos at an average rate of 634.28 maturing in 2015;
133,120 barrels of crude oil at an average rate of $50.77 per barrel maturing in 2015; and
25,168 tonnes of gasoil at an average rate of $488.59 per tonne maturing in 2015.
Foreign currencyBrazilian real forward buy contracts(in millions of U.S. dollars) 194.9$ Average price 2.48$ Chilean peso forward buy contracts(in millions of U.S. dollars) 53.0$ Average price 577.36$ Russian rouble forward buy contracts(in millions of U.S. dollars) 48.0$ Average price 35.88$ Canadian dollar forward buy contracts(in millions of U.S. dollars) 58.2$ Average price 1.10$
EnergyOil swap contracts (barrels) 285,400 Average price 84.85$ Diesel swap contracts (gallons) - Average price - Gasoil swap contracts (tonnes) 8,184 Average price 779.72$
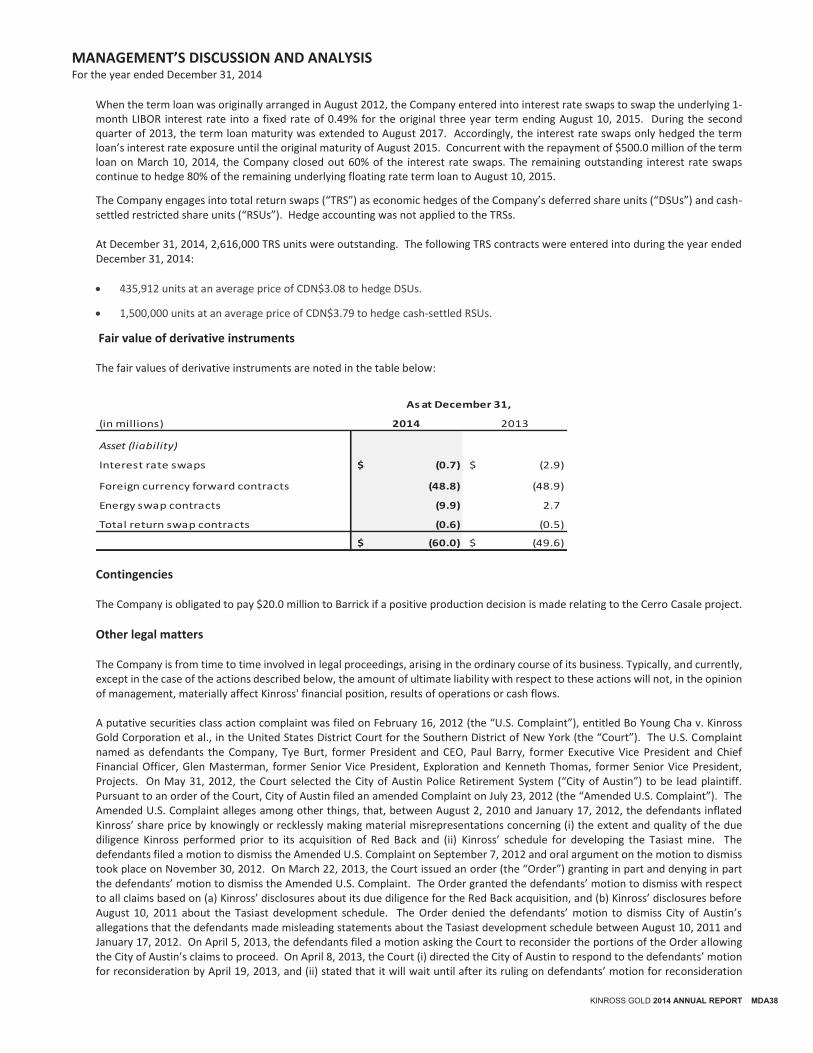
MANAGEMENT’S DISCUSSION AND ANALYSIS For the year ended December 31, 2014
KINROSS GOLD 2014 ANNUAL REPORT MDA38
When the term loan was originally arranged in August 2012, the Company entered into interest rate swaps to swap the underlying 1-month LIBOR interest rate into a fixed rate of 0.49% for the original three year term ending August 10, 2015. During the second quarter of 2013, the term loan maturity was extended to August 2017. Accordingly, the interest rate swaps only hedged the term loan’s interest rate exposure until the original maturity of August 2015. Concurrent with the repayment of $500.0 million of the term loan on March 10, 2014, the Company closed out 60% of the interest rate swaps. The remaining outstanding interest rate swaps continue to hedge 80% of the remaining underlying floating rate term loan to August 10, 2015.
The Company engages into total return swaps (“TRS”) as economic hedges of the Company’s deferred share units (“DSUs”) and cash-settled restricted share units (“RSUs”). Hedge accounting was not applied to the TRSs. At December 31, 2014, 2,616,000 TRS units were outstanding. The following TRS contracts were entered into during the year ended December 31, 2014:
435,912 units at an average price of CDN$3.08 to hedge DSUs.
1,500,000 units at an average price of CDN$3.79 to hedge cash-settled RSUs.
Fair value of derivative instruments The fair values of derivative instruments are noted in the table below:
Contingencies The Company is obligated to pay $20.0 million to Barrick if a positive production decision is made relating to the Cerro Casale project.
Other legal matters The Company is from time to time involved in legal proceedings, arising in the ordinary course of its business. Typically, and currently, except in the case of the actions described below, the amount of ultimate liability with respect to these actions will not, in the opinion of management, materially affect Kinross' financial position, results of operations or cash flows.
A putative securities class action complaint was filed on February 16, 2012 (the “U.S. Complaint”), entitled Bo Young Cha v. Kinross Gold Corporation et al., in the United States District Court for the Southern District of New York (the “Court”). The U.S. Complaint named as defendants the Company, Tye Burt, former President and CEO, Paul Barry, former Executive Vice President and Chief Financial Officer, Glen Masterman, former Senior Vice President, Exploration and Kenneth Thomas, former Senior Vice President, Projects. On May 31, 2012, the Court selected the City of Austin Police Retirement System (“City of Austin”) to be lead plaintiff. Pursuant to an order of the Court, City of Austin filed an amended Complaint on July 23, 2012 (the “Amended U.S. Complaint”). The Amended U.S. Complaint alleges among other things, that, between August 2, 2010 and January 17, 2012, the defendants inflated Kinross’ share price by knowingly or recklessly making material misrepresentations concerning (i) the extent and quality of the due diligence Kinross performed prior to its acquisition of Red Back and (ii) Kinross’ schedule for developing the Tasiast mine. The defendants filed a motion to dismiss the Amended U.S. Complaint on September 7, 2012 and oral argument on the motion to dismiss took place on November 30, 2012. On March 22, 2013, the Court issued an order (the “Order”) granting in part and denying in part the defendants’ motion to dismiss the Amended U.S. Complaint. The Order granted the defendants’ motion to dismiss with respect to all claims based on (a) Kinross’ disclosures about its due diligence for the Red Back acquisition, and (b) Kinross’ disclosures before August 10, 2011 about the Tasiast development schedule. The Order denied the defendants’ motion to dismiss City of Austin’s allegations that the defendants made misleading statements about the Tasiast development schedule between August 10, 2011 and January 17, 2012. On April 5, 2013, the defendants filed a motion asking the Court to reconsider the portions of the Order allowing the City of Austin’s claims to proceed. On April 8, 2013, the Court (i) directed the City of Austin to respond to the defendants’ motion for reconsideration by April 19, 2013, and (ii) stated that it will wait until after its ruling on defendants’ motion for reconsideration
(in millions) 2014 2013
Asset (liability)
Interest rate swaps (0.7)$ (2.9)$
Foreign currency forward contracts (48.8) (48.9)
Energy swap contracts (9.9) 2.7
Total return swap contracts (0.6) (0.5)
(60.0)$ (49.6)$
As at December 31,
MANAGEMENT’S DISCUSSION AND ANALYSIS For the year ended December 31, 2014
MDA39 KINROSS GOLD 2014 ANNUAL REPORT
before entering a case management schedule governing any future proceedings in the lawsuit. The City of Austin filed a response on April 19, 2013 and the defendants filed a reply on May 1, 2013. On June 6, 2013 the Court issued an opinion and order denying the defendants’ motion for reconsideration. On July 8, 2013 the defendants filed their answer to the Amended U.S. Complaint. The parties have completed the initial fact discovery phase of litigation, which included the production of information and documents and the oral depositions of witnesses. The parties have completed the submission of written arguments and supporting expert reports in respect of the plaintiffs’ Application for Class Certification, which is expected to be heard and decided in the first quarter of 2015. Should the plaintiffs’ application be successful, submissions in respect of the defendants’ Motion on Summary Judgment are expected to be made in the first half of 2015, with a hearing and decision expected in the second half of 2015. The defendants intend to vigorously defend against the surviving claims of the Amended U.S. Complaint and believe they are without merit. A notice of action in a proposed class proceeding under Ontario’s Class Proceedings Act, 1992, was filed in the Ontario Superior Court of Justice (the “Ontario Court”) on March 12, 2012, entitled Trustees of the Musicians’ Pension Fund of Canada v. Kinross Gold Corporation et al. (the “Ontario Action”). A statement of claim in the Ontario Action was subsequently served on April 11, 2012. The Ontario Action named as defendants the Company, Tye Burt, former President and CEO, Paul Barry, former Executive Vice President and Chief Financial Officer, Glen Masterman, former Senior Vice President, Exploration, and Kenneth Thomas, former Senior Vice President, Projects. The Ontario Action alleges, among other things, that Kinross made a number of misrepresentations relating to the quantity and quality of gold ore at the Tasiast mine and the costs of operating the mine, and that Kinross and the individual defendants knew that such misrepresentations were false or misleading when made. In a motion to the Ontario Court, the plaintiffs sought certification of the action as a class proceeding and leave to proceed under the statutory civil liability provisions of Ontario’s Securities Act. In their written argument on the motion, the plaintiffs also sought leave and certification of a claim based on allegations that Kinross made a number of misrepresentations relating to the schedule for the Tasiast expansion project, and that Kinross and the individual defendants knew that such misrepresentations were false or misleading when made. These claims were added to the plaintiffs’ statement of claim in January 2014. A hearing on the plaintiffs’ leave and certification motions was held from October 22–24, 2013. On November 5, 2013, the Ontario Court issued Reasons For Decision dismissing the leave motion in respect of the statutory claims and dismissing the certification motion in respect of both the statutory claims and the common law negligent misrepresentation claims. The plaintiffs appealed the Order of the Ontario Court to the Ontario Court of Appeal. The plaintiffs’ appeal was dismissed in its entirety by the Ontario Court of Appeal on December 17, 2014. The plaintiffs are entitled to seek leave to appeal the Court of Appeal’s decision to the Supreme Court of Canada. To date, the plaintiffs have not delivered an application for leave to appeal to the Supreme Court of Canada, although Kinross believes that the plaintiffs will do so. Kinross believes that the claims are without merit and intends to continue to vigorously defend against them.
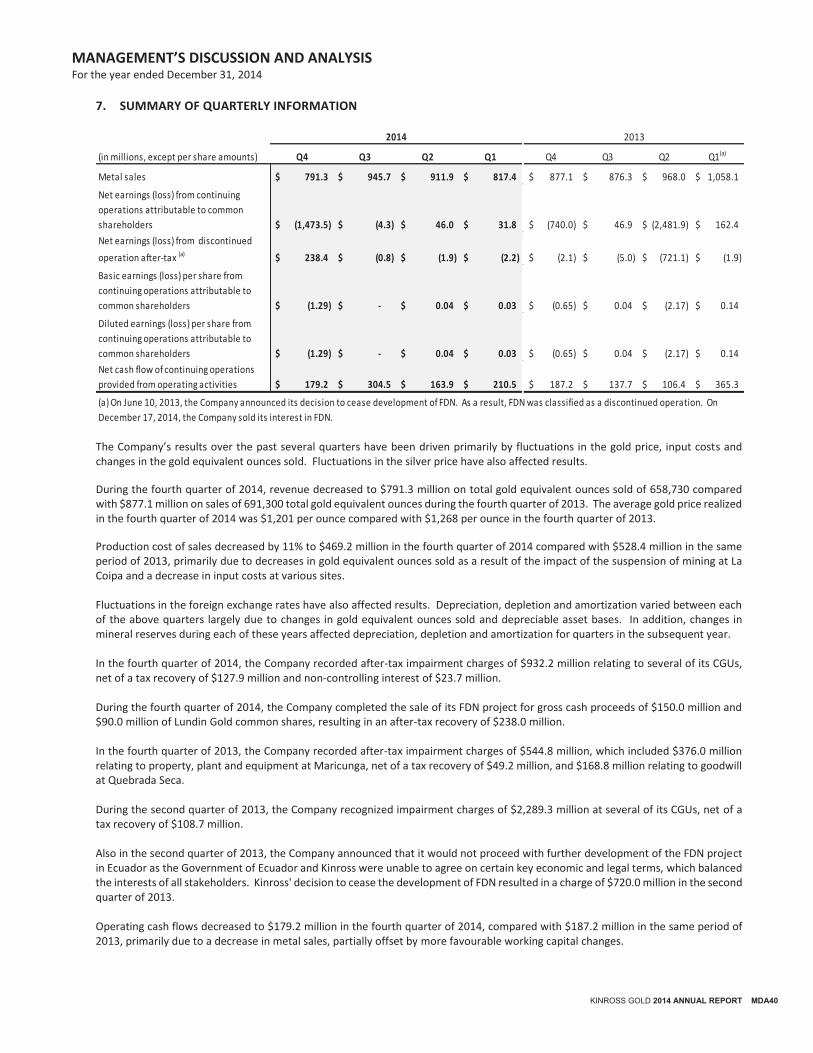
MANAGEMENT’S DISCUSSION AND ANALYSIS For the year ended December 31, 2014
KINROSS GOLD 2014 ANNUAL REPORT MDA40
7. SUMMARY OF QUARTERLY INFORMATION
The Company’s results over the past several quarters have been driven primarily by fluctuations in the gold price, input costs and changes in the gold equivalent ounces sold. Fluctuations in the silver price have also affected results.
During the fourth quarter of 2014, revenue decreased to $791.3 million on total gold equivalent ounces sold of 658,730 compared with $877.1 million on sales of 691,300 total gold equivalent ounces during the fourth quarter of 2013. The average gold price realized in the fourth quarter of 2014 was $1,201 per ounce compared with $1,268 per ounce in the fourth quarter of 2013.
Production cost of sales decreased by 11% to $469.2 million in the fourth quarter of 2014 compared with $528.4 million in the same period of 2013, primarily due to decreases in gold equivalent ounces sold as a result of the impact of the suspension of mining at La Coipa and a decrease in input costs at various sites. Fluctuations in the foreign exchange rates have also affected results. Depreciation, depletion and amortization varied between each of the above quarters largely due to changes in gold equivalent ounces sold and depreciable asset bases. In addition, changes in mineral reserves during each of these years affected depreciation, depletion and amortization for quarters in the subsequent year. In the fourth quarter of 2014, the Company recorded after-tax impairment charges of $932.2 million relating to several of its CGUs, net of a tax recovery of $127.9 million and non-controlling interest of $23.7 million. During the fourth quarter of 2014, the Company completed the sale of its FDN project for gross cash proceeds of $150.0 million and $90.0 million of Lundin Gold common shares, resulting in an after-tax recovery of $238.0 million. In the fourth quarter of 2013, the Company recorded after-tax impairment charges of $544.8 million, which included $376.0 million relating to property, plant and equipment at Maricunga, net of a tax recovery of $49.2 million, and $168.8 million relating to goodwill at Quebrada Seca. During the second quarter of 2013, the Company recognized impairment charges of $2,289.3 million at several of its CGUs, net of a tax recovery of $108.7 million. Also in the second quarter of 2013, the Company announced that it would not proceed with further development of the FDN project in Ecuador as the Government of Ecuador and Kinross were unable to agree on certain key economic and legal terms, which balanced the interests of all stakeholders. Kinross' decision to cease the development of FDN resulted in a charge of $720.0 million in the second quarter of 2013. Operating cash flows decreased to $179.2 million in the fourth quarter of 2014, compared with $187.2 million in the same period of 2013, primarily due to a decrease in metal sales, partially offset by more favourable working capital changes.
(in millions, except per share amounts) Q4 Q3 Q2 Q1 Q4 Q3 Q2 Q1(a)
Metal sales 791.3$ 945.7$ 911.9$ 817.4$ 877.1$ 876.3$ 968.0$ 1,058.1$
(1,473.5)$ (4.3)$ 46.0$ 31.8$ (740.0)$ 46.9$ (2,481.9)$ 162.4$
238.4$ (0.8)$ (1.9)$ (2.2)$ (2.1)$ (5.0)$ (721.1)$ (1.9)$
(1.29)$ -$ 0.04$ 0.03$ (0.65)$ 0.04$ (2.17)$ 0.14$
(1.29)$ -$ 0.04$ 0.03$ (0.65)$ 0.04$ (2.17)$ 0.14$
179.2$ 304.5$ 163.9$ 210.5$ 187.2$ 137.7$ 106.4$ 365.3$
Net earnings (loss) from continuing
operations attributable to common
shareholders
Net earnings (loss) from discontinued
operation after-tax (a)
Basic earnings (loss) per share from
continuing operations attributable to
common shareholders
Diluted earnings (loss) per share from
continuing operations attributable to
common shareholders
Net cash flow of continuing operations
provided from operating activities
(a) On June 10, 2013, the Company announced its decision to cease development of FDN. As a result, FDN was classified as a discontinued operation. On
December 17, 2014, the Company sold its interest in FDN.
20132014
MANAGEMENT’S DISCUSSION AND ANALYSIS For the year ended December 31, 2014
MDA41 KINROSS GOLD 2014 ANNUAL REPORT
8. DISCLOSURE CONTROLS AND PROCEDURES AND INTERNAL CONTROL OVER FINANCIAL REPORTING Pursuant to regulations adopted by the U.S. Securities and Exchange Commission, under the Sarbanes-Oxley Act of 2002 and those of the Canadian Securities Administrators, Kinross' management evaluates the effectiveness of the design and operation of the Company's disclosure controls and procedures, and internal controls over financial reporting. This evaluation is done under the supervision of, and with the participation of, the Chief Executive Officer and the Chief Financial Officer. As of the end of the period covered by this MD&A and the accompanying financial statements, Kinross’ management evaluated the effectiveness of its disclosure controls and procedures and internal controls over financial reporting. In making this assessment, management used the Internal Controls - Integrated Framework (2013) issued by the Committee of the Sponsoring Organizations of the Treadway Commission. Based on that evaluation, the Chief Executive Officer and the Chief Financial Officer have concluded that Kinross’ disclosure controls and procedures, and internal controls over financial reporting, provide reasonable assurance that they were effective as at December 31, 2014. During 2014, Tasiast converted to a new ERP system. The ERP system conversion has not resulted in any significant changes in internal controls during the year ended December 31, 2014. Management employed appropriate procedures to ensure internal controls were in place during and after the conversion.
Limitations of Controls and Procedures Kinross’ management, including the Chief Executive Officer and the Chief Financial Officer, believes that any disclosure controls and procedures and internal controls over financial reporting, no matter how well designed and operated, can have inherent limitations. Therefore, even those systems determined to be effective can provide only reasonable assurance that the objectives of the control system are met.
9. CRITICAL ACCOUNTING POLICIES, ESTIMATES AND ACCOUNTING CHANGES
Critical Accounting Policies and Estimates Kinross’ accounting policies are described in Note 3 to the financial statements. The preparation of the Company’s financial statements in accordance with IFRS requires management to make judgments, estimates and assumptions that affect the reported amounts of assets and liabilities and disclosures of contingent assets and liabilities at the date of the financial statements and the reported amounts of revenues and expenses during the reporting period. Estimates and assumptions are continually evaluated and are based on management’s experience and other factors, including expectations of future events that are believed to be reasonable under the circumstances. Actual results could differ from these estimates.
The areas which require management to make significant judgments, estimates and assumptions in determining carrying values include, but are not limited to:
Mineral Reserves and Mineral Resources Proven and probable mineral reserves are the economically mineable parts of the Company’s measured and indicated mineral resources demonstrated by at least a preliminary feasibility study. The Company estimates its proven and probable mineral reserves and measured and indicated and inferred mineral resources based on information compiled by appropriately qualified persons. The information relating to the geological data on the size, depth and shape of the ore body requires complex geological judgments to interpret the data. The estimation of future cash flows related to proven and probable mineral reserves is based upon factors such as estimates of foreign exchange rates, commodity prices, future capital requirements and production costs along with geological assumptions and judgments made in estimating the size and grade of the ore body. Changes in the proven and probable minerals reserves or measured and indicated and inferred mineral resources estimates may impact the carrying value of property, plant and equipment, goodwill, reclamation and remediation obligations, recognition of deferred tax amounts and depreciation, depletion and amortization.
Depreciation, Depletion and Amortization Plants and other facilities used directly in mining activities are depreciated using the units-of-production (“UOP”) method over a period not to exceed the estimated life of the ore body based on recoverable ounces to be mined from proven and probable mineral reserves. Mobile and other equipment is depreciated, net of residual value, on a straight-line basis, over the useful life of the equipment but does not exceed the related estimated life of the mine based on proven and probable mineral reserves. The calculation of the UOP rate, and therefore the annual depreciation, depletion and amortization expense, could be materially affected by changes in the underlying estimates. Changes in estimates can be the result of actual future production differing from current forecasts of future production, expansion of mineral reserves through exploration activities, differences between estimated
MANAGEMENT’S DISCUSSION AND ANALYSIS For the year ended December 31, 2014
KINROSS GOLD 2014 ANNUAL REPORT MDA42
and actual costs of mining and differences in gold price used in the estimation of mineral reserves. Significant judgment is involved in the determination of useful life and residual values for the computation of depreciation, depletion and amortization and no assurance can be given that actual useful lives and residual values will not differ significantly from current assumptions.
Impairment of Goodwill and Other Assets Goodwill is tested for impairment annually or more frequently if there is an indication of impairment. The carrying value of property, plant and equipment is reviewed each reporting period to determine whether there is any indication of impairment. If the carrying amount of an asset exceeds its recoverable amount, the asset is impaired and an impairment loss is recognized in the consolidated statement of operations. The assessment of fair values, including those of the CGUs for purposes of testing goodwill, require the use of estimates and assumptions for recoverable production, long-term commodity prices, discount rates, NAV multiples, foreign exchange rates, future capital requirements and operating performance. Changes in any of the assumptions or estimates used in determining the fair value of goodwill or other assets could impact the impairment analysis. Impairment charges recognized against property, plant and equipment may be reversed if there are changes in the assumptions or estimates used in determining the recoverable amounts of the CGUs which indicate that a previously recognized impairment loss may no longer exist or may have decreased.
Inventories Expenditures incurred, and depreciation, depletion and amortization of assets used in mining and processing activities are deferred and accumulated as the cost of ore in stockpiles, ore on leach pads, in-process and finished metal inventories. These deferred amounts are carried at the lower of average cost or net realizable value (“NRV”). Write-downs of ore in stockpiles, ore on leach pads, in-process and finished metal inventories resulting from NRV impairments are reported as a component of current period costs. The primary factors that influence the need to record write-downs include prevailing and long-term metal prices and prevailing costs for production inputs such as labour, fuel and energy, materials and supplies, as well as realized ore grades and actual production levels. Costs are attributed to the leach pads based on current mining costs, including applicable depreciation, depletion and amortization relating to mining operations incurred up to the point of placing the ore on the pad. Costs are removed from the leach pad based on the average cost per recoverable ounce of gold on the leach pad as the gold is recovered. Estimates of recoverable gold on the leach pads are calculated from the quantities of ore placed on the pads, the grade of ore placed on the leach pads and an estimated percentage of recovery. Timing and ultimate actual recovery of gold contained on leach pads can vary significantly from the estimates. The quantities of recoverable gold placed on the leach pads are reconciled to the quantities of gold actually recovered (metallurgical balancing), by comparing the grades of ore placed on the leach pads to actual ounces recovered. The nature of the leaching process inherently limits the ability to precisely monitor inventory levels. As a result, the metallurgical balancing process is constantly monitored and the engineering estimates are refined based on actual results over time. The ultimate actual recovery of gold from a pad will not be known until the leaching process is completed. The allocation of costs to ore in stockpiles, ore on leach pads and in-process inventories and the determination of NRV involve the use of estimates. There is a high degree of judgment in estimating future costs, future production levels, proven and probable reserves estimates, gold and silver prices, and the ultimate estimated recovery for ore on leach pads. There can be no assurance that actual results will not differ significantly from estimates used in the determination of the carrying value of inventories.
Provision for reclamation and remediation
The Company assesses its provision for reclamation and remediation on an annual basis or when new material information becomes available. Mining and exploration activities are subject to various laws and regulations governing the protection of the environment. In general, these laws and regulations are continually changing and the Company has made, and intends to make in the future, expenditures to comply with such laws and regulations. Accounting for reclamation and remediation obligations requires management to make estimates of the future costs the Company will incur to complete the reclamation and remediation work required to comply with existing laws and regulations at each mining operation. Actual costs incurred may differ from those amounts estimated. Also, future changes to environmental laws and regulations could increase the extent of reclamation and remediation work required to be performed by the Company. Increases in future costs could materially impact the amounts charged to operations for reclamation and remediation. The provision represents management’s best estimate of the present value of the future reclamation and remediation obligation. The actual future expenditures may differ from the amounts currently provided.

MANAGEMENT’S DISCUSSION AND ANALYSIS For the year ended December 31, 2014
MDA43 KINROSS GOLD 2014 ANNUAL REPORT
Taxes The Company recognizes the deferred tax benefit related to deferred income and resource tax assets to the extent recovery is probable. Assessing the recoverability of deferred income tax assets requires management to make significant estimates of future taxable profit. To the extent that future cash flows and taxable profit differ significantly from estimates, the ability of the Company to realize the net deferred tax assets recorded at the balance sheet date could be impacted. In addition, future changes in tax laws could limit the ability of the Company to obtain tax deductions in future periods from deferred income and resource tax assets. In addition, the Company is subject to income taxes in numerous jurisdictions. Significant judgment is required in determining the provision for income taxes, due to the complexity of legislation. There are many transactions and calculations for which the ultimate tax determination is uncertain during the ordinary course of business.
Contingencies Due to the size, complexity and nature of the Company’s operations, various legal and tax matters are outstanding from time to time. Contingencies can be possible assets or liabilities arising from past events which, by their nature, will only be resolved when one or more future events not wholly within our control occur or fail to occur. The assessment of such contingencies involves the use of significant judgment and estimates. In the event that management’s estimate of the future resolution of these matters changes, the Company will recognize the effects of the changes in its consolidated financial statements on the date such changes occur.
Recent Accounting Pronouncements
Revenue recognition In May 2014, the IASB issued IFRS 15 “Revenue from Contracts with Customers” (“IFRS 15”). The standard replaces IAS 11 “Construction Contracts”, IAS 18 “Revenue”, IFRIC 13 “Customer Loyalty Programmes”, IFRIC 15 “Agreements for the Construction of Real Estate”, IFRIC 18 “Transfer of Assets From Customers” and SIC 31 “Revenue – Barter Transactions Involving Advertising Services”. IFRS 15 establishes principles for reporting the nature, amount, timing, and uncertainty of revenue and cash flows arising from an entity’s contract with customers. This standard is effective for annual periods beginning on or after January 1, 2017, and permits early adoption. The Company is in the process of determining the impact of IFRS 15 on its financial statements.
Financial instruments In July 2014, the IASB issued the final version of IFRS 9 “Financial Instruments”. This standard is effective for annual periods beginning on or after January 1, 2018, and permits early adoption. IFRS 9 provides a revised model for recognition and measurement and impairment of financial instruments. IFRS 9 also includes a substantially reformed approach to hedge accounting. The Company is in the process of determining the impact of IFRS 9 on its consolidated financial statements.
MANAGEMENT’S DISCUSSION AND ANALYSIS For the year ended December 31, 2014
KINROSS GOLD 2014 ANNUAL REPORT MDA44
10. RISK ANALYSIS The business of Kinross contains significant risk due to the nature of mining, exploration, and development activities. Certain risk factors, including but not limited to those listed below, are related to the mining industry in general while others are specific to Kinross. Included in the risk factors below are details on how Kinross seeks to mitigate these risks wherever possible. For additional discussion of risk factors please refer to the Company's Annual Information Form for the year ended December 31, 2013, which is available on the Company's website www.kinross.com and on www.sedar.com or is available upon request from the Company, and to the Company’s Annual Information Form for the year ended December 31, 2014, which will be filed on SEDAR. Gold Price and Silver Price The profitability of Kinross' operations is significantly affected by changes in the market price of gold and silver. Gold and silver prices fluctuate on a daily basis and are affected by numerous factors beyond the control of Kinross. The price of gold and/or silver can be subject to volatile price movements and future serious price declines could cause continued commercial production to be impractical. Depending on the prices of gold and silver, cash flow from mining operations may not be sufficient to cover costs of production and capital expenditures. If, as a result of a decline in gold and/or silver prices, revenues from metal sales were to fall below cash operating costs, production may be discontinued. The factors that may affect the price of gold and silver include industry factors such as: industrial and jewelry demand; the level of demand for the metal as an investment; central bank lending, sales and purchases of the metal; speculative trading; and costs of and levels of global production by producers of the metal. Gold and silver prices may also be affected by macroeconomic factors, including: expectations of the future rate of inflation; the strength of, and confidence in, the US dollar, the currency in which the price of the metal is generally quoted, and other currencies; interest rates; and global or regional political or economic uncertainties. In 2014, the Company’s average gold price realized decreased to $1,263 per ounce from $1,402 per ounce in 2013. If the world market price of gold and/or silver continued to drop and the prices realized by Kinross on gold and/or silver sales were to decrease further and remain at such a level for any substantial period, Kinross' profitability and cash flow would be negatively affected. In such circumstances, Kinross may determine that it is not economically feasible to continue commercial production at some or all of its operations or the development of some or all of its current projects, which could have an adverse impact on Kinross' financial performance and results of operations. Kinross may curtail or suspend some or all of its exploration activities, with the result that depleted reserves are not replaced. In addition, the market value of Kinross' gold and/or silver inventory may be reduced and existing reserves may be reduced to the extent that ore cannot be mined and processed economically at the prevailing prices. Furthermore, certain of Kinross' mineral projects include copper which is similarly subject to price volatility based on factors beyond Kinross' control.
Nature of Mineral Exploration and Mining The exploration and development of mineral deposits involves significant financial and other risks over an extended period of time which may not be eliminated even with careful evaluation, experience and knowledge. While discovery of gold-bearing structures may result in substantial rewards, few properties explored are ultimately developed into producing mines. Major expenditures are required to establish reserves by drilling and to construct mining and processing facilities at a site. It is impossible to ensure that the current or proposed exploration programs on properties in which Kinross has an interest will result in profitable commercial mining operations.
The operations of Kinross are subject to the hazards and risks normally incident to exploration, development and production of gold and silver, any of which could result in damage to life or property, environmental damage and possible legal liability for such damage. The activities of Kinross may be subject to prolonged disruptions due to weather conditions depending on the location of operations in which it has interests. Hazards, such as unusual or unexpected formations, rock bursts, pressures, cave-ins, flooding, pit wall failures or other conditions, may be encountered in the drilling and removal of material. While Kinross may obtain insurance against certain risks, potential claims could exceed policy limits or could be excluded from coverage. There are also risks against which Kinross cannot or may elect not to insure. The potential costs which could be associated with any liabilities not covered by insurance or in excess of insurance coverage or compliance with applicable laws and regulations may cause substantial delays and require significant capital outlays, adversely affecting the future earnings and competitive position of Kinross and, potentially, its financial viability. Whether a gold deposit will be commercially viable depends on a number of factors, some of which include the particular attributes of the deposit, such as its size and grade, costs and efficiency of the recovery methods that can be employed, proximity to infrastructure, financing costs and governmental regulations, including regulations relating to prices, taxes, royalties, infrastructure, land and water use, importing and exporting of gold and environmental protection. The effect of these factors cannot be accurately predicted, but the combination of these factors may result in Kinross not receiving an adequate return on its invested capital. Kinross mitigates the likelihood and potential severity of these mining risks it encounters in its day-to-day operations through the

MANAGEMENT’S DISCUSSION AND ANALYSIS For the year ended December 31, 2014
MDA45 KINROSS GOLD 2014 ANNUAL REPORT
application of high operating standards. In addition, Kinross reviews its insurance coverage at least annually to ensure that the most complete and cost-effective coverage is obtained.
Environmental Risks Kinross' mining and processing operations and exploration activities in the United States, the Russian Federation, Brazil, Chile, Mauritania, Ghana and Canada are subject to various laws and regulations governing the protection of the environment, exploration, development, production, exports, taxes, labour standards, occupational health, waste disposal, toxic substances, mine safety, and other matters. New laws and regulations, amendments to existing laws and regulations, or more stringent implementation of existing laws and regulations could have a material adverse impact on Kinross through increased costs, a reduction in levels of production and/or a delay or prevention of the development of new mining properties. Compliance with these laws and regulations requires significant expenditures and increases Kinross' mine development and operating costs. Permits from various governmental authorities are necessary in order to engage in mining operations in all jurisdictions in which Kinross operates. Such permits relate to many aspects of mining operations, including maintenance of air, water and soil quality standards. In most jurisdictions, the requisite permits cannot be obtained prior to completion of an environmental impact statement and, in some cases, public consultation. Further, Kinross may be required to submit for government approval a reclamation plan, to post financial assurance for the reclamation costs of the mine site, and to pay for the reclamation of the mine site upon the completion of mining activities. Kinross mitigates this risk by performing certain reclamation activities concurrent with production. Mining, like many other extractive natural resource industries, is subject to potential risks and liabilities concerning the environmental effects associated with mineral exploration and production. Environmental liability may result from mining activities conducted by others prior to Kinross' ownership of a property. To the extent Kinross is subject to uninsured environmental liabilities, the payment of such liabilities would reduce funds otherwise available for business activities and could have a material adverse effect on Kinross. Should Kinross be unable to fully fund the cost of remedying an environmental problem, Kinross might be required to suspend operations or enter into interim compliance measures pending completion of the required remedy, which could have a material adverse effect. Kinross mitigates the likelihood and potential severity of these environmental risks it encounters in its day-to-day operations through the application of high operating standards.
Mineral Reserve and Mineral Resource Estimates The mineral reserve and mineral resource figures are estimates, and no assurance can be given that the anticipated tonnages and grades will be achieved or that the indicated level of recovery will be realized. Market fluctuations in the price of gold may render the mining of mineral reserves and mineral resources uneconomical and require Kinross to take a write-down of an asset or to discontinue development or production. Moreover, short-term operating factors relating to the mineral reserves, such as the need for orderly development of the ore body or the processing of new or different ore grades, may cause a mining operation to be unprofitable in any particular accounting period. Proven and probable mineral reserves at Kinross' mines and development projects were estimated as of December 31, 2014, based upon a gold price of $1,200 per ounce of gold. Prolonged declines in the market price of gold below this level may render mineral reserves containing relatively lower grades of gold mineralization uneconomic to exploit and could materially reduce Kinross' mineral reserves. Should such reductions occur, material write-downs of Kinross' investments in mining properties or the discontinuation of development or production might be required, and there could be material delays in the development of new projects and reduced income and cash flow. There are numerous uncertainties inherent in estimating quantities of proven and probable mineral reserves. The estimates in this document are based on various assumptions relating to gold prices and exchange rates during the expected life of production and the results of additional planned development work. Actual future production rates and amounts, revenues, taxes, operating expenses, environmental and regulatory compliance expenditures, development expenditures and recovery rates may vary substantially from those assumed in the estimates. Any significant change in these assumptions, including changes that result from variances between projected and actual results, could result in a material downward or upward revision of current estimates.
MANAGEMENT’S DISCUSSION AND ANALYSIS For the year ended December 31, 2014
KINROSS GOLD 2014 ANNUAL REPORT MDA46
Kinross’ future plans rely on mine development projects, which involve significant uncertainties The Company’s ability to increase or maintain present gold and silver production levels is dependent in part on the successful development of new mines and/or expansion of existing mining operations. Kinross is dependent on future growth from development projects. Development projects rely on the accuracy of predicted factors including: capital and operating costs; metallurgical recoveries; reserve estimates; and future metal prices. Development projects are also subject to accurate feasibility studies, the acquisition of surface or land rights and the issuance of necessary governmental permits. Unforeseen circumstances, including those related to the amount and nature of the mineralization at the development site, technological impediments to extraction and processing, legal restrictions or governmental intervention, infrastructure limitations, environmental issues, disputes with local communities or other events, could result in one or more of our planned developments becoming impractical or uneconomic to complete. Any such occurrence could have an adverse impact on Kinross’ financial condition and results of operations. In addition, as a result of the substantial expenditures involved in development projects, developments are prone to material cost overruns versus budget. The capital expenditures and time required to develop new mines are considerable and changes in cost or construction schedules can significantly increase both the time and capital required to build the project. The project development schedules are also dependent on obtaining the governmental approvals necessary for the operation of a project. The timeline to obtain these government approvals is often beyond the control of Kinross. It is not unusual in the mining industry for new mining operations to experience unexpected problems during the start-up phase, resulting in delays and requiring more capital than anticipated.
Production and Cost Estimates The Company prepares estimates of future production, operating costs and capital costs for its operations. Despite the Company’s best efforts to budget and estimate such costs, as a result of the substantial expenditures involved in the development of mineral projects and the fluctuation and increase of costs over time, development projects may be prone to material cost overruns. Kinross' actual costs may vary from estimates for a variety of reasons, including: increased competition for resources and development inputs; cost inflation affecting the mining industry in general; short term operating factors; revisions to mine plans; risks and hazards associated with mining; natural phenomena, such as inclement weather conditions, water availability, floods, and earthquakes; and unexpected labour shortages or strikes. Operating costs may also be affected by a variety of factors, including: ore grade metallurgy, labour costs, cost of commodities and other inputs, general inflationary pressures and currency exchange rates. Many of these factors are beyond Kinross’ control. No assurance can be given that Kinross’ cost estimates will be achieved. Failure to achieve production or cost estimates or material increases in costs could have an adverse impact on Kinross’ future cash flows, profitability, results of operations and financial condition. Kinross’ actual production and costs may vary from estimates for a variety of reasons, including: actual ore mined varying from estimates of grade, tonnage, dilution and metallurgical and other characteristics; short-term operating factors relating to the ore reserves, such as the need for sequential development of ore bodies and the processing of new or different ore grades; revisions to mine plans; difficulties with supply chain management, including the implementation and management of enterprise resource planning software; risks and hazards associated with mining; natural phenomena, such as inclement weather conditions, floods, and earthquakes; and unexpected labour shortages or strikes. Costs of production may also be affected by a variety of factors, including: changing waste-to-ore ratios, ore grade metallurgy, labour costs, the cost of supplies and services (for example, power and fuel), general inflationary pressures and currency exchange rates.
Shortages and Price Volatility of Input Commodities and Equipment The Company is dependent on various input commodities (such as diesel fuel, electricity, natural gas, steel, concrete and cyanide) and equipment (including parts) to conduct its mining operations and development projects. A shortage of such input commodities or equipment or a significant increase in their cost could have a material adverse effect on the Company’s ability to carry out its operations and therefore limit, or increase the cost of, production. The Company is also dependent on access to and supply of water to carry out its mining operations, and such access and supply may not be readily available, especially at the Company’s operations in Chile. Market prices of input commodities can be subject to volatile price movements which can be material, occur over short periods of time and are affected by factors that are beyond the Company’s control. An increase in the cost, or decrease in the availability, of input commodities or equipment may affect the timely conduct and cost of Kinross’ operations and development projects. If the costs of certain input commodities consumed or otherwise used in connection with Kinross’ operations and development projects were to increase significantly, and remain at such levels for a substantial period, the Company may determine that it is not economically feasible to continue commercial production at some or all of its operations or the development of some or all of its current projects, which could have an adverse impact on the Company’s financial performance and results of operations.
MANAGEMENT’S DISCUSSION AND ANALYSIS For the year ended December 31, 2014
MDA47 KINROSS GOLD 2014 ANNUAL REPORT
Political Developments and Uncertainty in the Russian Federation Ongoing political tensions and uncertainties as a result of the Russian Federation’s foreign policy decisions and actions in respect of Ukraine have resulted in the imposition of economic sanctions and increased the risk that certain governments may impose further economic, or other, sanctions or penalties on, or may take other actions against, the Russian Federation or on persons and/or companies conducting business in the Russian Federation or may otherwise act in support of Ukraine. There can be no assurance that sanctions or other penalties will not be imposed, or other actions will not be taken, by the Russian Federation, including in response to existing or threatened sanctions or other penalties or actions by Canada, the United States or the European Union and/or other governments against the Russian Federation or persons and/or companies conducting business in the Russian Federation. The imposition of such economic sanctions or other penalties, or such other actions by the Russian Federation and/or other governments, could have a material adverse effect on the Company’s assets and operations.
Political, Economic and Legislative Risk The Company has mining and exploration operations in various regions of the world, including the United States, Canada, Brazil, Chile, the Russian Federation, Mauritania and Ghana and such operations are exposed to various levels of political, economic, and other risks and uncertainties. These risks and uncertainties vary from country to country and include, but are not limited to: terrorism; hostage taking; extreme fluctuations in currency exchange rates; high rates of inflation; labour unrest; the risks of civil unrest; expropriation and nationalization; renegotiation or nullification of existing concessions, licenses, permits and contracts; illegal mining; changes to policies and regulations impacting the mining sector; restrictions on foreign exchange and repatriation; and changing political conditions, currency controls, and governmental regulations that favour or require the awarding of contracts to local contractors or require foreign contractors to employ citizens of, or purchase supplies from, a particular jurisdiction. Future political and economic conditions in these countries may result in these governments adopting different policies with respect to foreign investment, and development and ownership of mineral resources. Any changes in such policies may result in changes in laws affecting ownership of assets, foreign investment, mining exploration and development, taxation, royalties, currency exchange rates, gold sales, environmental protection, labour relations, price controls, repatriation of income, and return of capital, which may affect both the ability of Kinross to undertake exploration and development activities in respect of future properties in the manner currently contemplated, as well as its ability to continue to explore, develop, and operate those properties to which it has rights relating to exploration, development, and operation. Future governments in these countries may adopt substantially different policies, which might extend to, as an example, expropriation of assets. The tax regimes in these countries may be subject to differing interpretations and are subject to change from time to time. Kinross' interpretation of taxation law as applied to its transactions and activities may not coincide with that of the tax authorities in a given country. As a result, transactions may be challenged by tax authorities and Kinross' operations may be assessed, which could result in significant additional taxes, penalties and interest. The Company is subject to the considerations and risks of operating in the Russian Federation. Certain currency conversion risks exist in the Russian economy. Russian legislation currently permits the conversion of rouble revenues into foreign currency. Any delay or other difficulty in converting roubles into a foreign currency to make a payment or delay in or restriction on the transfer of foreign currency could limit our ability to meet our payment and debt obligations, which could result in the loss of suppliers, acceleration of debt obligations, etc. Although the Company has completed the sale of all of its interest in Aurelian and the FDN project in Ecuador to Lundin Gold, certain residual risks may remain in respect of FDN. Certain liabilities and obligations exist under the purchase agreement with Lundin Gold. In addition, the Company has also signed a bilateral treaty with the government of Ecuador in respect of the transition of the FDN assets to Lundin Gold. There can be no guarantee that the Company (and/or any of its directors, officers or employees) will not be subject to any obligations or liabilities, litigation, or other claims or actions in respect of its ongoing contractual obligations, or any of the Company’s prior activities on or in respect thereof or otherwise in Ecuador.
Licenses and Permits The operations of Kinross require licenses and permits from various governmental authorities. However, such licenses and permits are subject to challenge and change in various circumstances. There can be no guarantee that Kinross will be able to obtain or maintain all necessary licenses and permits that may be required to explore and develop its properties, commence construction or operation of mining facilities and properties under exploration or development or to maintain continued operations that economically justify the cost. Kinross endeavors to be in compliance with these regulations and permits at all times.
MANAGEMENT’S DISCUSSION AND ANALYSIS For the year ended December 31, 2014
KINROSS GOLD 2014 ANNUAL REPORT MDA48
The Federal Public Attorney (“FPA”) in Brazil filed a lawsuit relating to alleged rights of Quilombola peoples in connection with certain lands being used to construct the Eustaquio tailings facility at Paracatu. As part of the lawsuit, the FPA had applied for an injunction seeking to enjoin the issuance by the state authority of the permit to operate the Eustaquio tailings facility. The FPA's injunction was denied, the permit to operate was issued and the Eustaquio tailings facility has been operating since July 2012. In December, 2013 and January of 2014, the trial court judge issued decisions denying the FPA's claim. In the fourth quarter of 2014, the FPA filed appeals challenging the decisions of the trial court. Kinross has filed its response to the appeals and will continue to vigorously oppose the lawsuit. The Company believes that the lawsuit by the FPA should not be successful.
Title to Properties and Community Relations The validity of mining claims which constitute most of Kinross' property holdings may, in certain cases, be uncertain and subject to being contested. Kinross' titles, particularly title to undeveloped properties, may be defective and open to being challenged by governmental authorities and local communities. Certain of Kinross’ properties may be subject to the rights or the asserted rights of various community stakeholders, including indigenous people. The presence of community stakeholders may also impact on the Company’s ability to develop or operate its mining properties. In certain circumstances, consultation with such stakeholders may be required and the outcome may affect the Company’s ability to develop or operate its mining properties.
Competition The mineral exploration and mining business is competitive in all of its phases. In the search for and the acquisition of attractive mineral properties, Kinross competes with numerous other companies and individuals, including competitors with greater financial, technical and other resources than Kinross. The ability of the Company to operate successfully in the future will depend not only on its ability to develop its present properties, but also on its ability to select and acquire suitable producing properties or prospects for mineral exploration. Kinross may be unable to compete successfully with its competitors in acquiring such properties or prospects on terms it considers acceptable, if at all.
Joint Arrangements Certain of the operations in which the Company has an interest are operated through joint arrangements with other mining companies. Any failure of such other companies to meet their obligations to Kinross or to third parties could have a material adverse effect on the joint arrangement. In addition, Kinross may be unable to exert control over strategic decisions made in respect of such properties.
Disclosures About Market Risks To determine its market risk sensitivities, Kinross uses an internally generated financial forecast model that is sensitized to various gold prices, currency exchange rates, interest rates and energy prices. The variable with the greatest impact is the gold price, and Kinross prepares a base case scenario and then sensitizes it by a 10% increase and decrease in the gold price. For 2015, sensitivity to a 10% change in the gold price is estimated to have an approximate $300 million impact on pre-tax earnings. Kinross' financial forecast covers the projected life of its mines. In each year, gold is produced according to the mine plan. Additionally, for 2015, sensitivity to a 10% change in the silver price is estimated to have a $9 million impact on pre-tax earnings. Costs are estimated based on current production costs plus the impact of any major changes to the operation during its life.
Interest Rate Fluctuations Fluctuations in interest rates can affect the Company’s results of operations and cash flow. The Company’s corporate revolving credit and term loan facilities and the Kupol project financing are subject to variable interest rates. Hedging Risks The Company’s earnings can vary significantly with fluctuations in the market price of gold and silver. Kinross’ practice is not to hedge metal sales. On occasion, however, the Company may assume or enter into forward sales contracts or similar instruments if hedges are acquired in a business acquisition, if hedges are required under project financing requirements, or when deemed advantageous by management. As at December 31, 2014, there were no gold or silver derivative financial instruments outstanding. In addition, Kinross is not subject to margin requirements on any of its hedging lines.
MANAGEMENT’S DISCUSSION AND ANALYSIS For the year ended December 31, 2014
MDA49 KINROSS GOLD 2014 ANNUAL REPORT
Foreign Currency Exchange Risk Currency fluctuations may affect the revenues which the Company will realize from its operations since gold is sold in the world market in United States dollars. The costs of Kinross are incurred principally in Canadian dollars, United States dollars, Chilean pesos, Brazilian reais, Russian roubles, Mauritanian ouguiya and Ghanaian cedis. The appreciation of non-U.S. dollar currencies against the U.S. dollar increases the cost of gold production in U.S. dollar terms. Kinross’ results are positively affected when the U.S. dollar strengthens against these foreign currencies and are adversely affected when the U.S. dollar weakens against these foreign currencies. Where possible, Kinross’ cash and cash equivalent balances are primarily held in U.S. dollars. From time to time, Kinross transacts currency hedging to reduce the risk associated with currency fluctuations. While the Chilean peso, Brazilian real, and Russian rouble are currently convertible into Canadian and United States dollars, they may not always be convertible in the future. The Mauritanian ouguiya and Ghanaian cedis are convertible into Canadian and United States dollars, but conversion may be subject to regulatory and/or central bank approval. The sensitivity of the Company’s pre-tax earnings to changes in the U.S. dollar is disclosed in Note 11 of the Company’s financial statements for the year ended December 31, 2014. Credit, Counterparty and Liquidity Risk Credit risk relates to cash and cash equivalents, accounts receivable, and derivative contracts and arises from the possibility that a counterparty to an instrument fails to perform. Counterparty risk is the risk that a third party might fail to fulfill its performance obligations under the terms of a financial instrument. The Company is subject to counterparty risk and may be affected, in the event that a counterparty becomes insolvent. To manage both counterparty and credit risk, the Company proactively manages its exposure to individual counterparties. The Company only transacts with highly-rated counterparties. A limit on contingent exposure has been established for each counterparty based on the counterparty's credit rating, and the Company monitors the financial condition of each counterparty. As at December 31, 2014, the Company's gross credit exposure, including cash and cash equivalents, was $1,176.0 million and at December 31, 2013, the gross credit exposure, including cash and cash equivalents, was $917.9 million. Liquidity risk is the risk that the Company may not have sufficient cash resources available to meet its payment obligations. To manage liquidity risk, the Company maintains cash positions and has financing in place that the Company expects will be sufficient to meet its operating and capital expenditure requirements. Potential sources for liquidity could include, but are not limited to: the Company's current cash position, existing credit facilities, future operating cash flow, and potential private and public financing. Additionally, the Company reviews its short-term operational forecasts regularly and long-term budgets to determine its cash requirements. The Company has investment grade credit ratings from Moody’s, Fitch Ratings and Standard & Poor’s. However, there is no assurance that these credit ratings will remain in effect for any given period of time or that any such ratings will not be revised or withdrawn entirely by a rating agency. Real or anticipated changes in credit ratings can affect the price of the Company’s existing debt as well as the Company’s ability to access the capital markets and the cost of such debt financing.
Potential for Incurring Unexpected Costs or Liabilities as a Result of Acquisitions Although the Company has conducted investigations in connection with recent acquisitions, risks remain regarding any undisclosed or unknown liabilities associated with these acquisitions. The Company may discover that it has acquired substantial undisclosed liabilities. The Company may have little recourse against the seller if any of the representations or warranties provided in connection with these acquisitions proves to be inaccurate. Such liabilities could have an adverse impact on the Company's business, financial condition, results of operations and cash flows.
MANAGEMENT’S DISCUSSION AND ANALYSIS For the year ended December 31, 2014
KINROSS GOLD 2014 ANNUAL REPORT MDA50
Global Financial Condition The volatility and challenges that economies continue to experience around the world continues to affect the profitability and liquidity of businesses in most industries, which in turn has resulted in the following conditions that may have an effect on the profitability and cash flows of the Company:
• Volatility in commodity prices and foreign exchange rates;
• Tightening of credit markets;
• Increased counterparty risk; and
• Volatility in the prices of publicly traded entities.
The volatility in commodity prices and foreign exchange rates directly impact the Company’s revenues, earnings and cash flows, as noted above in the sections titled “Gold Price and Silver Price” and “Foreign Currency Exchange Risk”. Although the tighter credit markets have restricted the ability of certain companies to access capital, to date this has not affected the Company's liquidity. The Company re-negotiated its revolving credit facility and term loan in 2014 to extend their terms to August 2019 and August 2018, respectively, and remove the minimum tangible net worth covenant. As at December 31, 2014, the Company had $1,510.7 million available under its credit facility arrangements. However, continued tightening of credit markets may affect the ability of the Company to obtain equity or debt financing in the future on terms favourable to the Company. The Company has not experienced any difficulties to date relating to the counterparties it transacts with. The counterparties continue to be highly rated, and as noted above, the Company has employed measures to reduce the impact of counterparty risk. Continued volatility in equity markets may affect the value of publicly listed companies in Kinross' equity portfolio. Should declines in the equity values continue and are deemed to be other than temporary, impairment losses may result.
Market Price Risk Kinross’ common shares are listed on the Toronto Stock Exchange and the New York Stock Exchange (“NYSE”). The price of Kinross’ common shares is likely to be significantly affected by short-term changes in the gold price or in its financial condition or results of operations as reflected in its quarterly earnings reports. Other factors unrelated to the performance of Kinross that may have an effect on the price of the Kinross common shares include the following: a reduction in analytical coverage of Kinross by investment banks with research capabilities; increased political risk in countries where the Company operates; a drop in trading volume and general market interest in the securities of Kinross may adversely affect an investor’s ability to liquidate an investment and consequently an investor’s interest in acquiring a significant stake in Kinross; a failure of Kinross to meet the reporting and other obligations under Canadian and U.S. securities laws or imposed by the exchanges could result in a delisting of the Kinross common shares; and a substantial decline in the price of the Kinross common shares that persists for a significant period of time could cause the Kinross common shares to be delisted from the NYSE further reducing market liquidity. As a result of any of these factors, the market price of Kinross’ common shares at any given point in time may not accurately reflect Kinross’ long-term value. Securities class action litigation has been brought against companies, including Kinross, following periods of volatility or significant decline in the market price of their securities. Securities litigation, including current proceedings against Kinross as well as potential future proceedings, could result in substantial costs and damages and divert management’s attention and resources. Any decision resulting from any such litigation that is adverse to the Company could have a negative impact on the Company’s financial position.
Impairment Kinross evaluates, on at least an annual basis, the carrying amount of its CGUs to determine whether current events and circumstances indicate that such carrying amount may no longer be recoverable. Goodwill is required to be tested annually for impairment and Kinross performs this annual test at the end of the fourth quarter. In addition, at each reporting period end, Kinross assesses whether there is any indication that any of its CGUs’ carrying amounts exceed their recoverable amounts, and if there is such an indication, the Company would test for potential impairment at that time. The recoverable amounts, or fair values, of its CGUs are based, in part, on certain factors that may be partially or totally outside of Kinross’ control. Kinross’ fair value estimates are based on numerous
MANAGEMENT’S DISCUSSION AND ANALYSIS For the year ended December 31, 2014
MDA51 KINROSS GOLD 2014 ANNUAL REPORT
assumptions, some of which may be subjective, and it is possible that actual fair value could be significantly different than those estimates. As at December 31, 2014, Kinross recorded an after-tax impairment charge of $932.2 million. The impairment charge included goodwill impairment of $145.3 million and property plant and equipment impairment of $786.9 million. The property, plant and equipment impairment was net of a tax recovery of $127.9 million and non-controlling interest of $23.7 million. In the absence of any mitigating valuation factors, Kinross’ failure to achieve its valuation assumptions or declines in the fair values of its CGUs may, over time, result in further impairment charges.
MANAGEMENT’S DISCUSSION AND ANALYSIS For the year ended December 31, 2014
KINROSS GOLD 2014 ANNUAL REPORT MDA52
11. SUPPLEMENTAL INFORMATION
Reconciliation of non-GAAP financial measures The Company has included certain non-GAAP financial measures in this document. These measures are not defined under IFRS and should not be considered in isolation. The Company believes that these measures, together with measures determined in accordance with IFRS, provide investors with an improved ability to evaluate the underlying performance of the Company. The inclusion of these measures is meant to provide additional information and should not be used as a substitute for performance measures prepared in accordance with IFRS. These measures are not necessarily standard and therefore may not be comparable to other issuers.
Adjusted Net Earnings Attributable to Common Shareholders and Adjusted Net Earnings per Share Adjusted net earnings attributable to common shareholders and adjusted net earnings per share are non-GAAP measures which determine the performance of the Company, excluding certain impacts which the Company believes are not reflective of the Company’s underlying performance for the reporting period, such as the impact of foreign exchange gains and losses, reassessment of prior year taxes and/or taxes otherwise not related to the current period, impairment charges, gains and losses and other one-time costs related to acquisitions, dispositions and other transactions, and non-hedge derivative gains and losses. Although some of the items are recurring, the Company believes that they are not reflective of the underlying operating performance of its current business and are not necessarily indicative of future operating results. Management believes that these measures, which are used internally to assess performance and in planning and forecasting future operating results, provide investors with the ability to better evaluate underlying performance, particularly since the excluded items are typically not included in public guidance. However, adjusted net earnings and adjusted net earnings per share measures are not necessarily indicative of net earnings and earnings per share measures as determined under IFRS.
The following table provides a reconciliation of net earnings from continuing operations to adjusted net earnings from continuing operations for the periods presented:
(in millions, except share and per share amounts) 2014 2013
Net loss from continuing operations attributable to common shareholders - as reported (1,400.0)$ (3,012.6)$
Adjusting items:
Foreign exchange losses 50.1 21.9
Non-hedge derivatives losses (gains) - net of tax 4.5 (2.2)
Losses on sale of other assets - net of tax 3.1 1.1
Foreign exchange losses on translation of tax basis and foreign exchange on deferred income
taxes within income tax expense 112.8 70.6
Change in deferred income taxes due to tax reforms enacted in Chile 32.7 -
Taxes in respect of prior years 45.2 8.3
Impairment charges - net of tax 1,098.2 2,995.0
Impairment of investments and other - net of tax 162.6 240.3
Reclamation and remediation expense - net of tax 21.9 (1.2)
1,531.1 3,333.8
131.1$ 321.2$
Weighted average number of common shares outstanding - Basic 1,144.3 1,142.1
Adjusted net earnings from continuing operations per share 0.11$ 0.28$
Years ended December 31,
Adjusted net earnings from continuing operations attributable to common shareholders
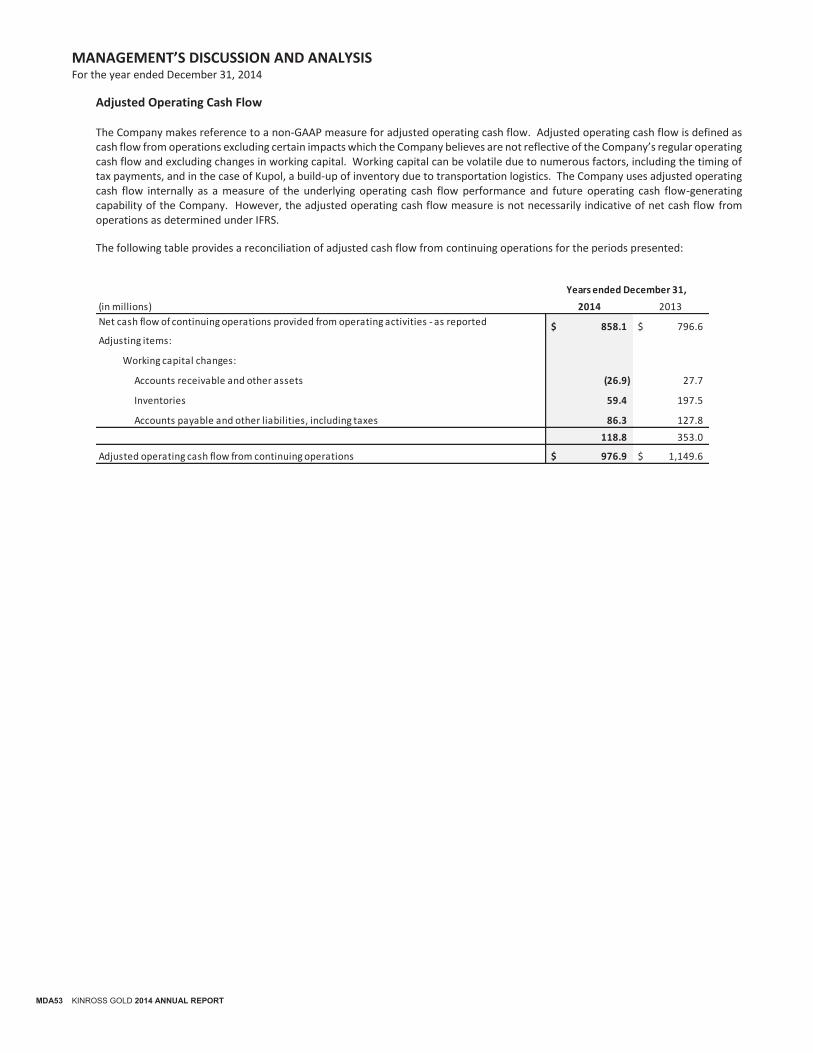
MANAGEMENT’S DISCUSSION AND ANALYSIS For the year ended December 31, 2014
MDA53 KINROSS GOLD 2014 ANNUAL REPORT
Adjusted Operating Cash Flow The Company makes reference to a non-GAAP measure for adjusted operating cash flow. Adjusted operating cash flow is defined as cash flow from operations excluding certain impacts which the Company believes are not reflective of the Company’s regular operating cash flow and excluding changes in working capital. Working capital can be volatile due to numerous factors, including the timing of tax payments, and in the case of Kupol, a build-up of inventory due to transportation logistics. The Company uses adjusted operating cash flow internally as a measure of the underlying operating cash flow performance and future operating cash flow-generating capability of the Company. However, the adjusted operating cash flow measure is not necessarily indicative of net cash flow from operations as determined under IFRS.
The following table provides a reconciliation of adjusted cash flow from continuing operations for the periods presented:
(in millions) 2014 2013
858.1$ 796.6$
Adjusting items:
Working capital changes:
Accounts receivable and other assets (26.9) 27.7
Inventories 59.4 197.5
Accounts payable and other liabilities, including taxes 86.3 127.8
118.8 353.0
Adjusted operating cash flow from continuing operations 976.9$ 1,149.6$
Net cash flow of continuing operations provided from operating activities - as reported
Years ended December 31,
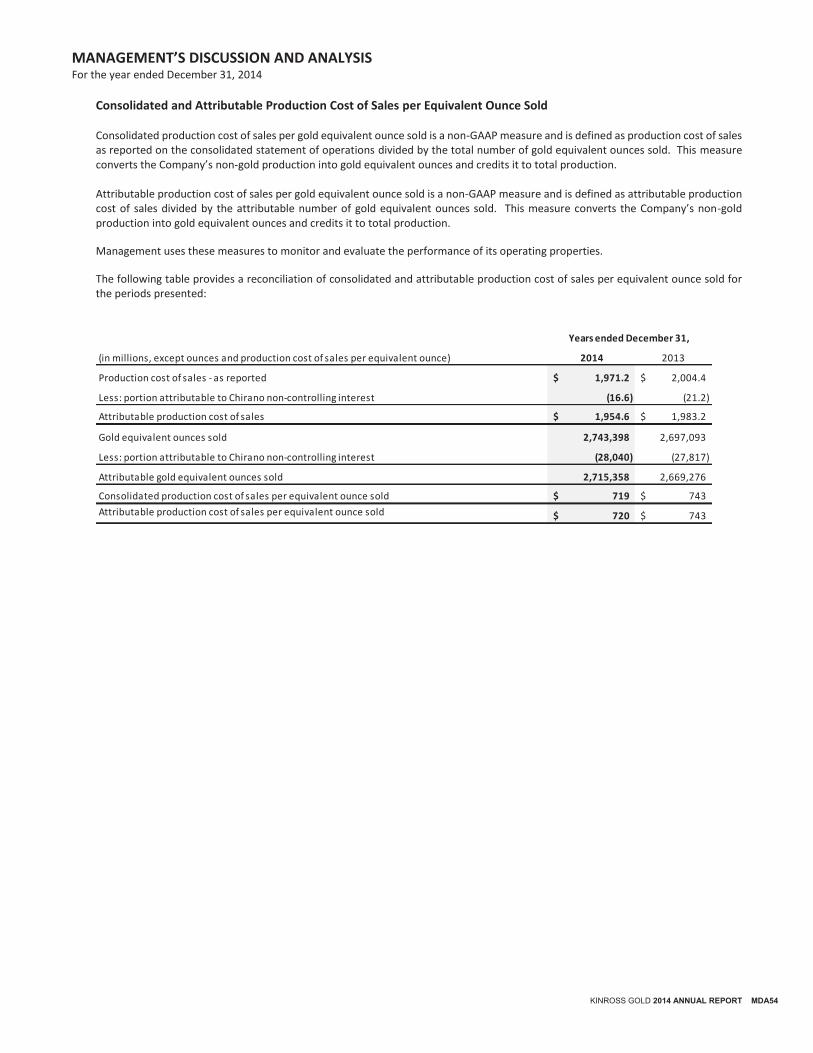
MANAGEMENT’S DISCUSSION AND ANALYSIS For the year ended December 31, 2014
KINROSS GOLD 2014 ANNUAL REPORT MDA54
Consolidated and Attributable Production Cost of Sales per Equivalent Ounce Sold Consolidated production cost of sales per gold equivalent ounce sold is a non-GAAP measure and is defined as production cost of sales as reported on the consolidated statement of operations divided by the total number of gold equivalent ounces sold. This measure converts the Company’s non-gold production into gold equivalent ounces and credits it to total production. Attributable production cost of sales per gold equivalent ounce sold is a non-GAAP measure and is defined as attributable production cost of sales divided by the attributable number of gold equivalent ounces sold. This measure converts the Company’s non-gold production into gold equivalent ounces and credits it to total production.
Management uses these measures to monitor and evaluate the performance of its operating properties.
The following table provides a reconciliation of consolidated and attributable production cost of sales per equivalent ounce sold for the periods presented:
(in millions, except ounces and production cost of sales per equivalent ounce) 2014 2013
Production cost of sales - as reported 1,971.2$ 2,004.4$
Less: portion attributable to Chirano non-controlling interest (16.6) (21.2)
Attributable production cost of sales 1,954.6$ 1,983.2$
Gold equivalent ounces sold 2,743,398 2,697,093
Less: portion attributable to Chirano non-controlling interest (28,040) (27,817)
Attributable gold equivalent ounces sold 2,715,358 2,669,276
719$ 743$
720$ 743$ Attributable production cost of sales per equivalent ounce sold
Consolidated production cost of sales per equivalent ounce sold
Years ended December 31,
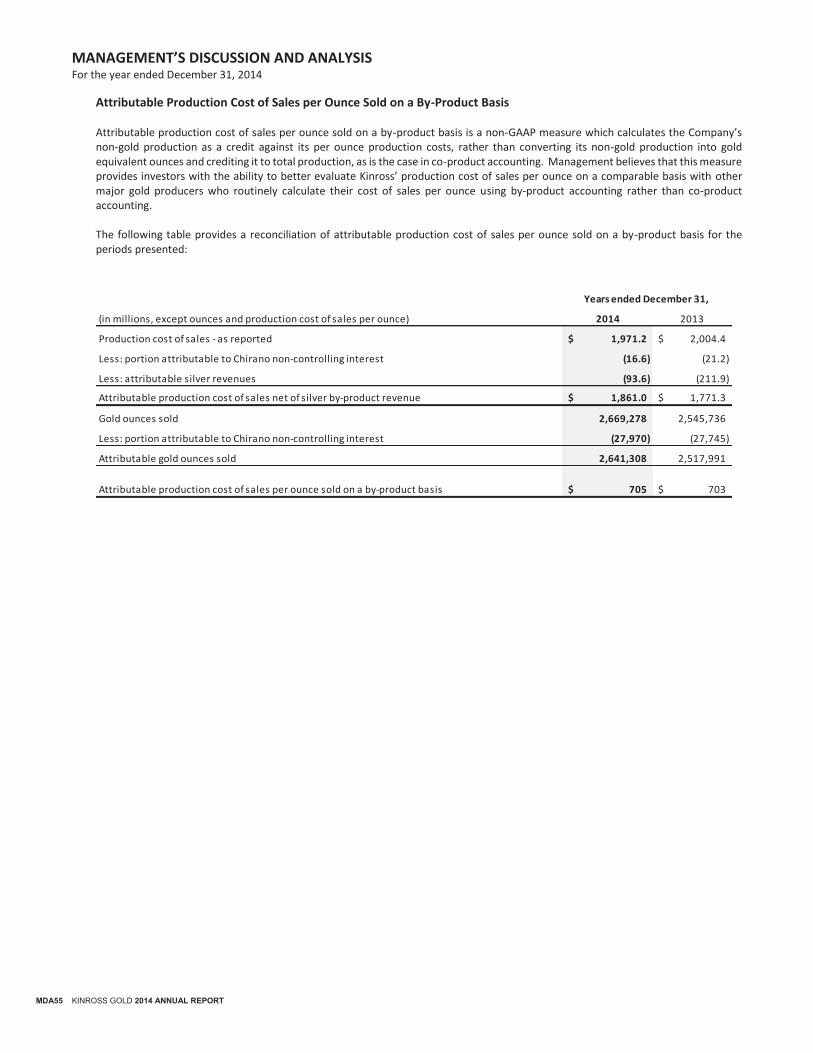
MANAGEMENT’S DISCUSSION AND ANALYSIS For the year ended December 31, 2014
MDA55 KINROSS GOLD 2014 ANNUAL REPORT
Attributable Production Cost of Sales per Ounce Sold on a By-Product Basis Attributable production cost of sales per ounce sold on a by-product basis is a non-GAAP measure which calculates the Company’s non-gold production as a credit against its per ounce production costs, rather than converting its non-gold production into gold equivalent ounces and crediting it to total production, as is the case in co-product accounting. Management believes that this measure provides investors with the ability to better evaluate Kinross’ production cost of sales per ounce on a comparable basis with other major gold producers who routinely calculate their cost of sales per ounce using by-product accounting rather than co-product accounting. The following table provides a reconciliation of attributable production cost of sales per ounce sold on a by-product basis for the periods presented:
(in millions, except ounces and production cost of sales per ounce) 2014 2013
Production cost of sales - as reported 1,971.2$ 2,004.4$
Less: portion attributable to Chirano non-controlling interest (16.6) (21.2)
Less: attributable silver revenues (93.6) (211.9)
1,861.0$ 1,771.3$
Gold ounces sold 2,669,278 2,545,736
Less: portion attributable to Chirano non-controlling interest (27,970) (27,745)
Attributable gold ounces sold 2,641,308 2,517,991
705$ 703$
Attributable production cost of sales net of silver by-product revenue
Attributable production cost of sales per ounce sold on a by-product basis
Years ended December 31,
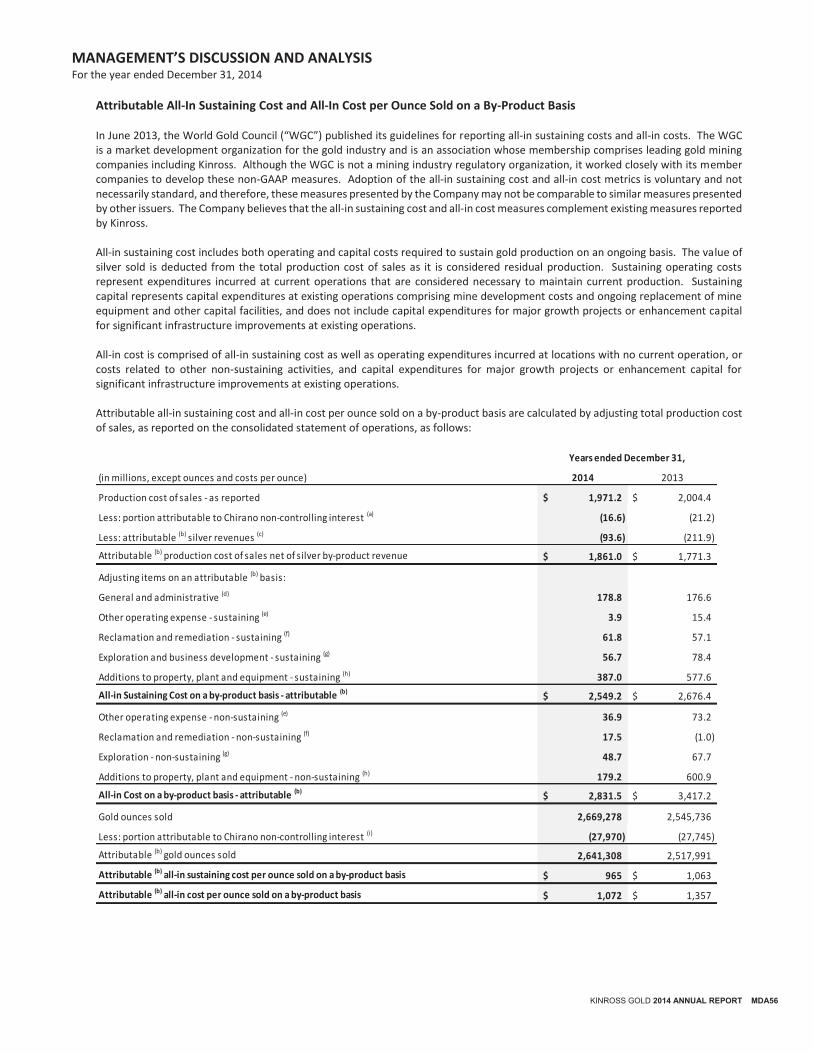
MANAGEMENT’S DISCUSSION AND ANALYSIS For the year ended December 31, 2014
KINROSS GOLD 2014 ANNUAL REPORT MDA56
Attributable All-In Sustaining Cost and All-In Cost per Ounce Sold on a By-Product Basis In June 2013, the World Gold Council (“WGC”) published its guidelines for reporting all-in sustaining costs and all-in costs. The WGC is a market development organization for the gold industry and is an association whose membership comprises leading gold mining companies including Kinross. Although the WGC is not a mining industry regulatory organization, it worked closely with its member companies to develop these non-GAAP measures. Adoption of the all-in sustaining cost and all-in cost metrics is voluntary and not necessarily standard, and therefore, these measures presented by the Company may not be comparable to similar measures presented by other issuers. The Company believes that the all-in sustaining cost and all-in cost measures complement existing measures reported by Kinross. All-in sustaining cost includes both operating and capital costs required to sustain gold production on an ongoing basis. The value of silver sold is deducted from the total production cost of sales as it is considered residual production. Sustaining operating costs represent expenditures incurred at current operations that are considered necessary to maintain current production. Sustaining capital represents capital expenditures at existing operations comprising mine development costs and ongoing replacement of mine equipment and other capital facilities, and does not include capital expenditures for major growth projects or enhancement capital for significant infrastructure improvements at existing operations. All-in cost is comprised of all-in sustaining cost as well as operating expenditures incurred at locations with no current operation, or costs related to other non-sustaining activities, and capital expenditures for major growth projects or enhancement capital for significant infrastructure improvements at existing operations. Attributable all-in sustaining cost and all-in cost per ounce sold on a by-product basis are calculated by adjusting total production cost of sales, as reported on the consolidated statement of operations, as follows:
(in millions, except ounces and costs per ounce) 2014 2013
Production cost of sales - as reported 1,971.2$ 2,004.4$
Less: portion attributable to Chirano non-controlling interest (a) (16.6) (21.2)
Less: attributable (b) silver revenues (c) (93.6) (211.9)
Attributable (b) production cost of sales net of silver by-product revenue 1,861.0$ 1,771.3$
Adjusting items on an attributable (b) basis:
General and administrative (d) 178.8 176.6
Other operating expense - sustaining (e) 3.9 15.4
Reclamation and remediation - sustaining (f) 61.8 57.1
Exploration and business development - sustaining (g) 56.7 78.4
Additions to property, plant and equipment - sustaining (h) 387.0 577.6
All-in Sustaining Cost on a by-product basis - attributable (b)2,549.2$ 2,676.4$
Other operating expense - non-sustaining (e) 36.9 73.2
Reclamation and remediation - non-sustaining (f) 17.5 (1.0)
Exploration - non-sustaining (g) 48.7 67.7
Additions to property, plant and equipment - non-sustaining (h) 179.2 600.9
All-in Cost on a by-product basis - attributable (b)2,831.5$ 3,417.2$
Gold ounces sold 2,669,278 2,545,736
Less: portion attributable to Chirano non-controlling interest (i) (27,970) (27,745)
Attributable (b) gold ounces sold 2,641,308 2,517,991
Attributable (b) all-in sustaining cost per ounce sold on a by-product basis 965$ 1,063$
Attributable (b) all-in cost per ounce sold on a by-product basis 1,072$ 1,357$
Years ended December 31,
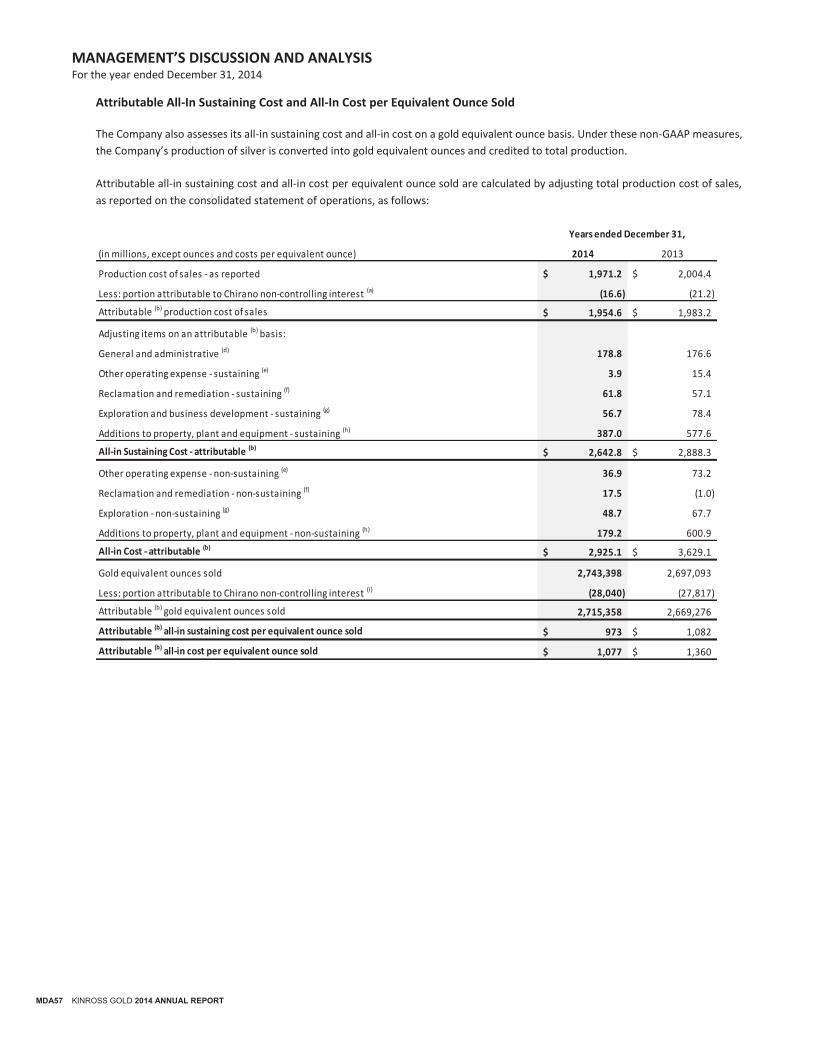
MANAGEMENT’S DISCUSSION AND ANALYSIS For the year ended December 31, 2014
MDA57 KINROSS GOLD 2014 ANNUAL REPORT
Attributable All-In Sustaining Cost and All-In Cost per Equivalent Ounce Sold The Company also assesses its all-in sustaining cost and all-in cost on a gold equivalent ounce basis. Under these non-GAAP measures,
the Company’s production of silver is converted into gold equivalent ounces and credited to total production.
Attributable all-in sustaining cost and all-in cost per equivalent ounce sold are calculated by adjusting total production cost of sales,
as reported on the consolidated statement of operations, as follows:
(in millions, except ounces and costs per equivalent ounce) 2014 2013
Production cost of sales - as reported 1,971.2$ 2,004.4$
Less: portion attributable to Chirano non-controlling interest (a) (16.6) (21.2)
Attributable (b) production cost of sales 1,954.6$ 1,983.2$
Adjusting items on an attributable (b) basis:
General and administrative (d) 178.8 176.6
Other operating expense - sustaining (e) 3.9 15.4
Reclamation and remediation - sustaining (f) 61.8 57.1
Exploration and business development - sustaining (g) 56.7 78.4
Additions to property, plant and equipment - sustaining (h) 387.0 577.6
All-in Sustaining Cost - attributable (b)2,642.8$ 2,888.3$
Other operating expense - non-sustaining (e) 36.9 73.2
Reclamation and remediation - non-sustaining (f) 17.5 (1.0)
Exploration - non-sustaining (g) 48.7 67.7
Additions to property, plant and equipment - non-sustaining (h) 179.2 600.9
All-in Cost - attributable (b)2,925.1$ 3,629.1$
Gold equivalent ounces sold 2,743,398 2,697,093
Less: portion attributable to Chirano non-controlling interest (i) (28,040) (27,817)
Attributable (b) gold equivalent ounces sold 2,715,358 2,669,276
Attributable (b) all-in sustaining cost per equivalent ounce sold 973$ 1,082$
Attributable (b) all-in cost per equivalent ounce sold 1,077$ 1,360$
Years ended December 31,
MANAGEMENT’S DISCUSSION AND ANALYSIS For the year ended December 31, 2014
KINROSS GOLD 2014 ANNUAL REPORT MDA58
(a) Portion attributable to Chirano non-controlling interest represents the non-controlling interest (10%) in the production cost of sales for
the Chirano mine.
(b) “Attributable” includes Kinross' share of Chirano (90%) production.
(c) “Attributable silver revenues” represents the attributable portion of metal sales realized from the production of the secondary or by-
product metal (i.e. silver). Revenue from the sale of silver, which is produced as a by-product of the process used to produce gold, effectively
reduces the cost of gold production.
(d) “General and administrative” expenses is as reported on the consolidated statement of operations, net of certain severance expenses.
General and administrative expenses are considered sustaining costs as they are required to be absorbed on a continuing basis for the
effective operation and governance of the Company.
(e) “Other operating expense – sustaining” is calculated as “Other operating expense” as reported on the consolidated statement of
operations, less other operating and reclamation and remediation expenses related to non-sustaining activities as well as other items not
reflective of the underlying operating performance of our business. Other operating expenses are classified as either sustaining or non-
sustaining based on the type and location of the expenditure incurred. The majority of other operating expenses that are incurred at existing
operations are considered costs necessary to sustain operations, and are therefore classified as sustaining. Other operating expenses
incurred at locations where there is no current operation or related to other non-sustaining activities are classified as non-sustaining.
(f) “Reclamation and remediation - sustaining” is calculated as current period accretion related to reclamation and remediation obligations
plus current period amortization of the corresponding reclamation and remediation assets, and is intended to reflect the periodic cost of
reclamation and remediation for currently operating mines. Reclamation and remediation costs for development projects or closed mines
are excluded from this amount and classified as non-sustaining.
(g) “Exploration and business development – sustaining” is calculated as “Exploration and business development” expenses as reported on
the consolidated statement of operations, less non-sustaining exploration expenses. Exploration expenses are classified as either
sustaining or non-sustaining based on a determination of the type and location of the exploration expenditure. Exploration expenditures
within the footprint of operating mines are considered costs required to sustain current operations and so are included in sustaining costs.
Exploration expenditures focused on new ore bodies near existing mines (i.e. brownfield), new exploration projects (i.e. greenfield) or for
other generative exploration activity not linked to existing mining operations are classified as non-sustaining. Business development
expenses are considered sustaining costs as they are required for general operations.
(h) “Additions to property, plant and equipment – sustaining” represents the majority of capital expenditures at existing operations including
capitalized exploration costs, capitalized stripping and underground mine development costs, ongoing replacement of mine equipment and
other capital facilities and other capital expenditures and is calculated as total additions to property, plant and equipment (as reported on
the consolidated statements of cash flows), less capitalized interest and non-sustaining capital. Non-sustaining capital represents capital
expenditures for major growth projects as well as enhancement capital for significant infrastructure improvements at existing operations.
Non-sustaining capital expenditures during the year ended December 31, 2014 relate to projects at Tasiast, Chirano and Dvoinoye.
(i) “Portion attributable to Chirano non-controlling interest” represents the non-controlling interest (10%) in the ounces sold from the
Chirano mine.
MANAGEMENT’S DISCUSSION AND ANALYSIS For the year ended December 31, 2014
MDA59 KINROSS GOLD 2014 ANNUAL REPORT
Cautionary Statement on Forward-Looking Information All statements, other than statements of historical fact, contained or incorporated by reference in this MD&A including, but not limited to, any information as to the future financial or operating performance of Kinross, constitute ‘‘forward-looking information’’ or ‘‘forward-looking statements’’ within the meaning of certain securities laws, including the provisions of the Securities Act (Ontario) and the provisions for ‘‘safe harbour’’ under the United States Private Securities Litigation Reform Act of 1995 and are based on expectations, estimates and projections as of the date of this MD&A. Forward-looking statements contained in this MD&A, include, but are not limited to, those under the headings “Mineral Reserves”, “Outlook, “Tasiast mill expansion update”, “La Coipa Phase 7 update” and include, without limitation, statements with respect to our guidance for production; production costs of sales, all-in sustaining cost and capital expenditures; mineral reserve and mineral resource estimates; expected savings pursuant to our cost review and reduction initiatives including, without limitation, optimization of projects and operations, as well as references to other possible events, the future price of gold and silver, the estimation of mineral reserves and mineral resources, the realization of mineral reserve and mineral resource estimates, the timing and amount of estimated future production, costs of production, capital expenditures, costs and timing of the development of projects and new deposits, success of exploration, development and mining activities, permitting timelines, currency fluctuations, requirements for additional capital, government regulation of mining operations, environmental risks, unanticipated reclamation expenses, title disputes or claims and limitations on insurance coverage. The words “anticipate”, “believe”, “estimates”, ‘‘expects’’, ‘‘explore’’, ‘‘forecasts”, “focus”, “guidance”, “indicative”, “initiative”, “intend”, “on track”, “options”, “outlook”, “plan”, “possible”, “potential”, “seek”, “schedule”, “study”, “target”, or “view”, or variations of or similar such words and phrases or statements that certain actions, events or results may, could, should or will be achieved, received or taken, or will occur or result and similar such expressions identify forward-looking statements. Forward-looking statements are necessarily based upon a number of estimates and assumptions that, while considered reasonable by Kinross as of the date of such statements, are inherently subject to significant business, economic and competitive uncertainties and contingencies. The estimates, models and assumptions of Kinross referenced, contained or incorporated by reference in this MD&A, which may prove to be incorrect, include, but are not limited to, the various assumptions set forth herein and in our most recently filed Annual Information Form and our Management’s Discussion and Analysis as well as: (1) there being no significant disruptions affecting the operations of the Company or any entity in which it now or hereafter directly or indirectly holds an investment, whether due to labour disruptions, supply disruptions, power disruptions, damage to equipment or otherwise; (2) permitting, development, operations and expansion at Paracatu (including, without limitation, land acquisitions and permitting for the construction and operation of the new tailings facility) being consistent with our current expectations;(3) political and legal developments in any jurisdiction in which the Company, or any entity in which it now or hereafter directly or indirectly holds an investment, operates being consistent with its current expectations including, without limitation, the impact of escalating political tensions and uncertainty in the Russian Federation and Ukraine or any related sanctions and any other similar restrictions or penalties imposed, or actions taken, by any government, and any potential amendments to the Brazilian Mining Code, the Mauritanian Customs Code, the Mauritanian Mining Code, the Mauritanian VAT regime and water legislation or other water use restrictions in Chile (including, but not limited to, the interpretation, implementation and application of any such amendments), being consistent with Kinross’ current expectations; (4) the exchange rate between the Canadian dollar, Brazilian real, Chilean peso, Russian rouble, Mauritanian ouguiya, Ghanaian cedi and the U.S. dollar being approximately consistent with current levels; (5) certain price assumptions for gold and silver; (6) prices for diesel, natural gas, fuel oil, electricity and other key supplies being approximately consistent with current levels; (7) production and cost of sales forecasts for the Company, and entities in which it now or hereafter directly or indirectly holds an investment, meeting expectations; (8) the accuracy of the current mineral reserve and mineral resource estimates of the Company (including but not limited to ore tonnage and ore grade estimates); (9) labour and materials costs increasing on a basis consistent with Kinross’ current expectations; (10) the development of, operations at and production from the Company’s operations, being consistent with Kinross’ current expectations; (11) the terms and conditions of the legal and fiscal stability agreements for the Tasiast and Chirano operations being interpreted and applied in a manner consistent with their intent and Kinross’ expectations; (12) goodwill and/or asset impairment potential; and (13) access to capital markets, including but not limited to maintaining an investment grade debt rating and, as required, maintaining partial project financing for Dvoinoye and Kupol being consistent with the Company’s current expectations. Known and unknown factors could cause actual results to differ materially from those projected in the forward-looking statements. Such factors include, but are not limited to: sanctions (any other similar restrictions or penalties) now or subsequently imposed, or other actions taken, by, against, in respect of or otherwise impacting any jurisdiction in which the Company is domiciled or operates (including but not limited to the Russian Federation, Canada, the European Union and the United States), or any government or citizens of, persons or companies domiciled in, or the Company’s business, operations or other activities in, any such jurisdiction; litigation commenced, or other claims or actions brought, against the Company (and/or any of its directors, officers or employees) in respect of the cessation by the Company of investment in and development of FDN and its sale, or any of the Company’s prior activities on or in respect thereof or otherwise in Ecuador; fluctuations in the currency markets; fluctuations in the spot and forward price of gold or certain other commodities (such as fuel and electricity); changes in the discount rates applied to calculate the present value of net future cash flows based on country-specific real weighted average cost of capital; changes in the market valuations of peer group gold producers and the Company, and the resulting impact on market price to net asset value multiples; changes in various market variables, such as interest rates, foreign exchange rates, gold or silver prices and lease rates, or global fuel prices, that could impact the mark-to-market value of outstanding derivative instruments and ongoing payments/receipts under any financial obligations; risks arising from holding derivative instruments (such as credit risk, market liquidity risk and mark-to-market risk); changes in national and local government legislation, taxation (including but not limited to income tax, advance income tax, stamp tax, withholding tax, capital tax, tariffs, value-added or sales tax, capital outflow tax, capital gains tax, windfall or windfall profits tax, royalty, excise tax, customs/import or export taxes/duties, asset taxes, asset transfer tax, property use or other real estate tax, together with any related fine, penalty, surcharge, or interest imposed in connection with such taxes), controls, policies and regulations; the security of personnel and assets; political or economic developments in Canada, the United States, Chile, Brazil, Russia, Ecuador, Mauritania, Ghana, or other countries in which Kinross, or entities in which it now or hereafter directly or indirectly holds an interest, do business or may carry on business; business opportunities that may be presented to, or pursued by, us; our ability to successfully integrate acquisitions and complete divestitures; operating or technical difficulties in connection with mining or development activities; employee relations; litigation or other claims against, or regulatory investigations and/or any enforcement actions or sanctions in respect of the Company (and/or its directors, officers, or employees) including, but not limited to, securities class action litigation in Canada and/or the United States, or any investigations, enforcement actions and/or sanctions under any applicable anti-bribery, international sanctions and/or anti-money laundering laws and regulations in Canada, the United Stated or any other applicable jurisdiction; the speculative nature of gold exploration and development including, but not limited to, the risks of obtaining necessary licenses and permits; diminishing quantities or grades of reserves; adverse changes in our credit rating; and contests over title to properties, particularly title to undeveloped properties. In addition, there are risks and hazards associated with the business of gold exploration, development and mining, including environmental hazards, industrial accidents, unusual or unexpected formations, pressures, cave-ins, flooding and gold bullion losses (and the risk of inadequate insurance, or the inability to obtain insurance, to cover these risks). Many of these uncertainties and contingencies can directly or indirectly affect, and could cause, Kinross’ actual results to differ materially from those expressed or implied in any forward-looking statements made by, or on behalf of, Kinross, including but not limited to resulting in an impairment charge on goodwill and/or assets. There can be no assurance that forward-looking statements will prove to be accurate, as actual results and future events could differ materially from those anticipated in such statements. Forward-looking statements are provided for the purpose of providing information about management’s expectations and plans relating to the future. All of the forward-looking statements made in this MD&A are qualified by these cautionary statements and those made in our other filings with the securities regulators of Canada and the United States including, but not limited to, the cautionary statements made in the ‘‘Risk Factors’’ section of our most recently filed Annual Information Form and Management Discussion and Analysis. These factors are not intended to represent a complete list of the factors that could affect Kinross. Kinross disclaims any intention or
MANAGEMENT’S DISCUSSION AND ANALYSIS For the year ended December 31, 2014
KINROSS GOLD 2014 ANNUAL REPORT MDA60
obligation to update or revise any forward-looking statements or to explain any material difference between subsequent actual events and such forward-looking statements, except to the extent required by applicable law.
Key Sensitivities
Approximately 60%-70 of the Company's costs are denominated in U.S. dollars.
A 10% change in foreign exchange could result in an approximate $14 impact on production cost of sales per ounce3.
Specific to the Russian rouble, a 10% change in the exchange rate would be expected to result in an approximate $11 impact on Russian production cost of sales per ounce.
A $10 per barrel change in the price of oil could result in an approximate $1 impact on production cost of sales per ounce.
The impact on royalties of a $100 change in the gold price could result in an approximate $3 impact on production cost of sales per ounce. Other information
Where we say ‘‘we’’, ‘‘us’’, ‘‘our’’, the ‘‘Company’’, or ‘‘Kinross’’ in this MD&A, we mean Kinross Gold Corporation and/or one or more or all of its subsidiaries, as may be applicable. The technical information about the Company’s material mineral properties contained in this MD&A, including but not limited to mineral reserve and mineral resource estimates, has been prepared under the supervision of Mr. John Sims, an officer of the Company, who is a “qualified person” within the meaning of National Instrument 43-101.
3 Refers to all of the currencies in the countries where the Company has mining operations, fluctuating simultaneously by 10% in the same direction, either appreciating or depreciating, taking into consideration the impact of hedging and the weighting of each currency within our consolidated cost structure.
FS1 KINROSS GOLD 2014 ANNUAL REPORT
MANAGEMENT’S RESPONSIBILITY FOR FINANCIAL STATEMENTS The consolidated financial statements, the notes thereto, and other financial information contained in the Management’s Discussion and Analysis have been prepared in accordance with International Financial Reporting Standards as issued by the International Accounting Standards Board and are the responsibility of the management of Kinross Gold Corporation. The financial information presented elsewhere in the Management’s Discussion and Analysis is consistent with the data that is contained in the consolidated financial statements. The consolidated financial statements, where necessary, include amounts which are based on the best estimates and judgment of management. In order to discharge management’s responsibility for the integrity of the financial statements, the Company maintains a system of internal accounting controls. These controls are designed to provide reasonable assurance that the Company’s assets are safeguarded, transactions are executed and recorded in accordance with management’s authorization, proper records are maintained and relevant and reliable financial information is produced. These controls include maintaining quality standards in hiring and training of employees, policies and procedures manuals, a corporate code of conduct and ensuring that there is proper accountability for performance within appropriate and well-defined areas of responsibility. The system of internal controls is further supported by a compliance function, which is designed to ensure that we and our employees comply with securities legislation and conflict of interest rules. The Board of Directors is responsible for overseeing management’s performance of its responsibilities for financial reporting and internal control. The Audit Committee, which is composed of non-executive directors, meets with management as well as the external auditors to ensure that management is properly fulfilling its financial reporting responsibilities to the Directors who approve the consolidated financial statements. The external auditors have full and unrestricted access to the Audit Committee to discuss the scope of their audits, the adequacy of the system of internal controls and review financial reporting issues. The consolidated financial statements have been audited by KPMG LLP, the independent registered public accounting firm, in accordance with Canadian generally accepted auditing standards and the standards of the Public Company Accounting Oversight Board (United States).
J. PAUL ROLLINSON TONY S. GIARDINI
Chief Executive Officer Toronto, Canada February 10, 2015
Executive Vice President and Chief Financial Officer Toronto, Canada February 10, 2015

KINROSS GOLD 2014 ANNUAL REPORT FS2
INDEPENDENT AUDITORS’ REPORT OF REGISTERED PUBLIC ACCOUNTING FIRM To the Shareholders of Kinross Gold Corporation
We have audited the accompanying consolidated financial statements of Kinross Gold Corporation, which comprise the consolidated balance sheets as at December 31, 2014 and December 31, 2013, the consolidated statements of operations, comprehensive loss, cash flows and equity for the years then ended, and notes, comprising a summary of significant accounting policies and other explanatory information.
Management’s Responsibility for the Consolidated Financial Statements
Management is responsible for the preparation and fair presentation of these consolidated financial statements in accordance with International Financial Reporting Standards as issued by the International Accounting Standards Board, and for such internal control as management determines is necessary to enable the preparation of consolidated financial statements that are free from material misstatement, whether due to fraud or error.
Auditors’ Responsibility
Our responsibility is to express an opinion on these consolidated financial statements based on our audits. We conducted our audits in accordance with Canadian generally accepted auditing standards and the standards of the Public Company Accounting Oversight Board (United States). Those standards require that we comply with ethical requirements and plan and perform the audit to obtain reasonable assurance about whether the consolidated financial statements are free from material misstatement.
An audit involves performing procedures to obtain audit evidence about the amounts and disclosures in the consolidated financial statements. The procedures selected depend on our judgment, including the assessment of the risks of material misstatement of the consolidated financial statements, whether due to fraud or error. In making those risk assessments, we consider internal control relevant to the entity’s preparation and fair presentation of the consolidated financial statements in order to design audit procedures that are appropriate in the circumstances. An audit also includes evaluating the appropriateness of accounting policies used and the reasonableness of accounting estimates made by management, as well as evaluating the overall presentation of the consolidated financial statements.
We believe that the audit evidence we have obtained in our audits is sufficient and appropriate to provide a basis for our audit opinion.
Opinion
In our opinion, the consolidated financial statements present fairly, in all material respects, the consolidated financial position of Kinross Gold Corporation as at December 31, 2014 and December 31, 2013, and its consolidated financial performance and its consolidated cash flows for the years then ended in accordance with International Financial Reporting Standards as issued by the International Accounting Standards Board.
Chartered Professional Accountants, Licensed Public Accountants February 10, 2015 Toronto, Canada
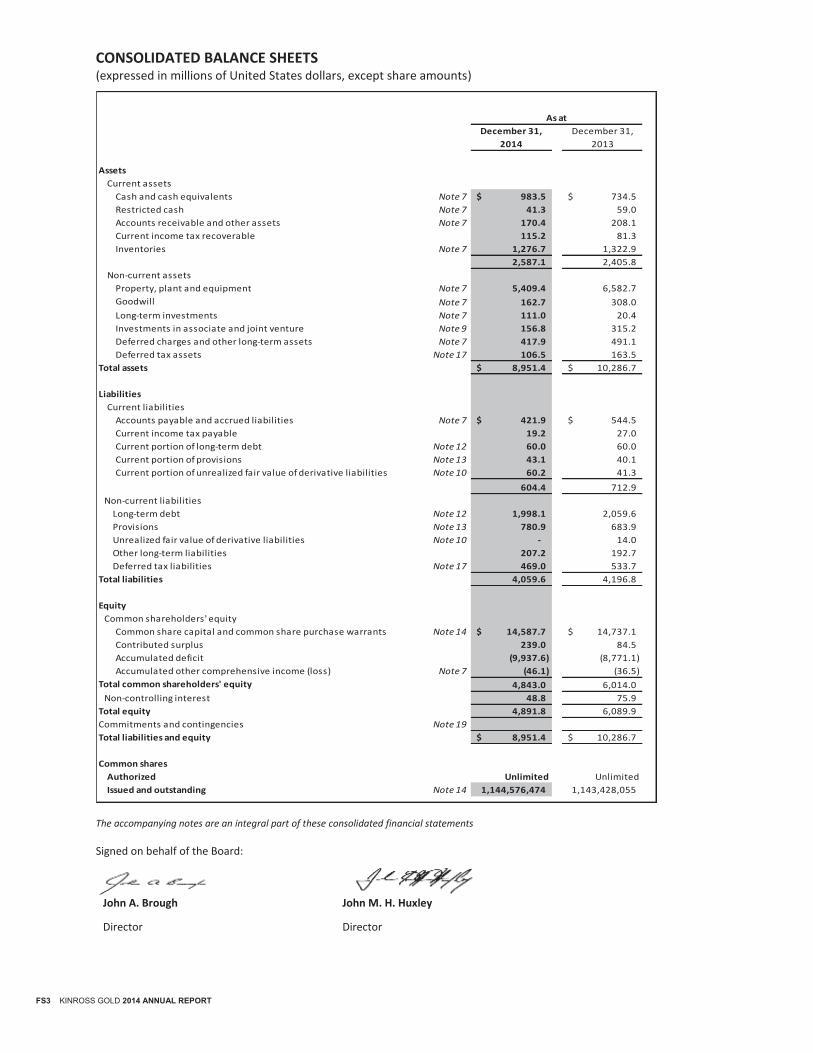
FS3 KINROSS GOLD 2014 ANNUAL REPORT
CONSOLIDATED BALANCE SHEETS (expressed in millions of United States dollars, except share amounts)
The accompanying notes are an integral part of these consolidated financial statements
Signed on behalf of the Board:
John A. Brough John M. H. Huxley
Director Director
December 31, December 31,
2014 2013
Assets
Current assets
Cash and cash equivalents Note 7 983.5$ 734.5$
Restricted cash Note 7 41.3 59.0
Accounts receivable and other assets Note 7 170.4 208.1
Current income tax recoverable 115.2 81.3
Inventories Note 7 1,276.7 1,322.9
2,587.1 2,405.8
Non-current assets
Property, plant and equipment Note 7 5,409.4 6,582.7
Goodwill Note 7 162.7 308.0
Long-term investments Note 7 111.0 20.4
Investments in associate and joint venture Note 9 156.8 315.2
Deferred charges and other long-term assets Note 7 417.9 491.1
Deferred tax assets Note 17 106.5 163.5
Total assets 8,951.4$ 10,286.7$
Liabilities
Current liabilities
Accounts payable and accrued liabilities Note 7 421.9$ 544.5$
Current income tax payable 19.2 27.0
Current portion of long-term debt Note 12 60.0 60.0
Current portion of provisions Note 13 43.1 40.1
Current portion of unrealized fair value of derivative liabilities Note 10 60.2 41.3
604.4 712.9
Non-current liabilities
Long-term debt Note 12 1,998.1 2,059.6
Provisions Note 13 780.9 683.9
Unrealized fair value of derivative liabilities Note 10 - 14.0
Other long-term liabilities 207.2 192.7
Deferred tax liabilities Note 17 469.0 533.7
Total liabilities 4,059.6 4,196.8
Equity
Common shareholders' equity
Common share capital and common share purchase warrants Note 14 14,587.7$ 14,737.1$
Contributed surplus 239.0 84.5
Accumulated deficit (9,937.6) (8,771.1)
Accumulated other comprehensive income (loss) Note 7 (46.1) (36.5)
Total common shareholders' equity 4,843.0 6,014.0
Non-controlling interest 48.8 75.9
Total equity 4,891.8 6,089.9
Commitments and contingencies Note 19
Total liabilities and equity 8,951.4$ 10,286.7$
Common shares
Authorized Unlimited Unlimited
Issued and outstanding Note 14 1,144,576,474 1,143,428,055
As at
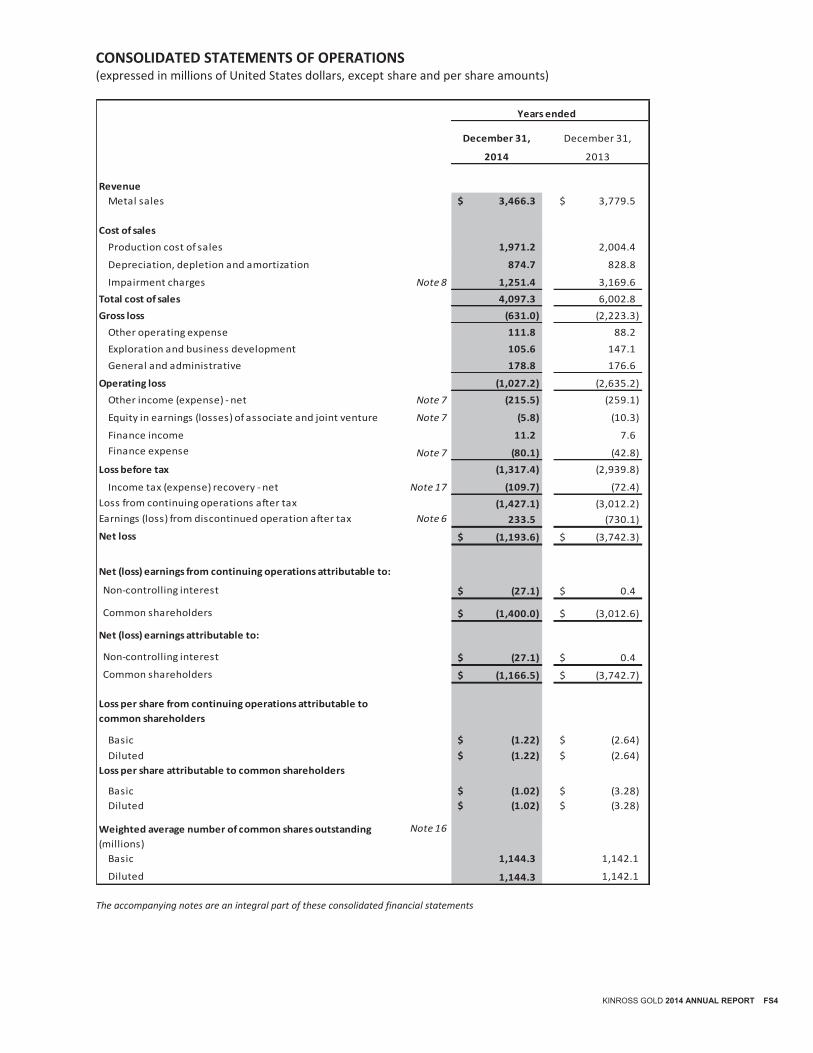
KINROSS GOLD 2014 ANNUAL REPORT FS4
CONSOLIDATED STATEMENTS OF OPERATIONS (expressed in millions of United States dollars, except share and per share amounts)
The accompanying notes are an integral part of these consolidated financial statements
December 31, December 31,
2014 2013
Revenue
Metal sales 3,466.3$ 3,779.5$
Cost of sales
Production cost of sales 1,971.2 2,004.4
Depreciation, depletion and amortization 874.7 828.8
Impairment charges Note 8 1,251.4 3,169.6
Total cost of sales 4,097.3 6,002.8
Gross loss (631.0) (2,223.3)
Other operating expense 111.8 88.2
Exploration and business development 105.6 147.1
General and administrative 178.8 176.6
Operating loss (1,027.2) (2,635.2)
Other income (expense) - net Note 7 (215.5) (259.1)
Equity in earnings (losses) of associate and joint venture Note 7 (5.8) (10.3)
Finance income 11.2 7.6
Finance expense Note 7 (80.1) (42.8)
Loss before tax (1,317.4) (2,939.8)
Income tax (expense) recovery - net Note 17 (109.7) (72.4)
Loss from continuing operations after tax (1,427.1) (3,012.2)
Earnings (loss) from discontinued operation after tax Note 6 233.5 (730.1)
Net loss (1,193.6)$ (3,742.3)$
Net (loss) earnings from continuing operations attributable to:
Non-controlling interest (27.1)$ 0.4$
Common shareholders (1,400.0)$ (3,012.6)$
Net (loss) earnings attributable to:
Non-controlling interest (27.1)$ 0.4$
Common shareholders (1,166.5)$ (3,742.7)$
Loss per share from continuing operations attributable to
common shareholders
Basic (1.22)$ (2.64)$
Diluted (1.22)$ (2.64)$
Loss per share attributable to common shareholders
Basic (1.02)$ (3.28)$
Diluted (1.02)$ (3.28)$
Weighted average number of common shares outstanding
(millions)
Note 16
Basic 1,144.3 1,142.1
Diluted 1,144.3 1,142.1
Years ended
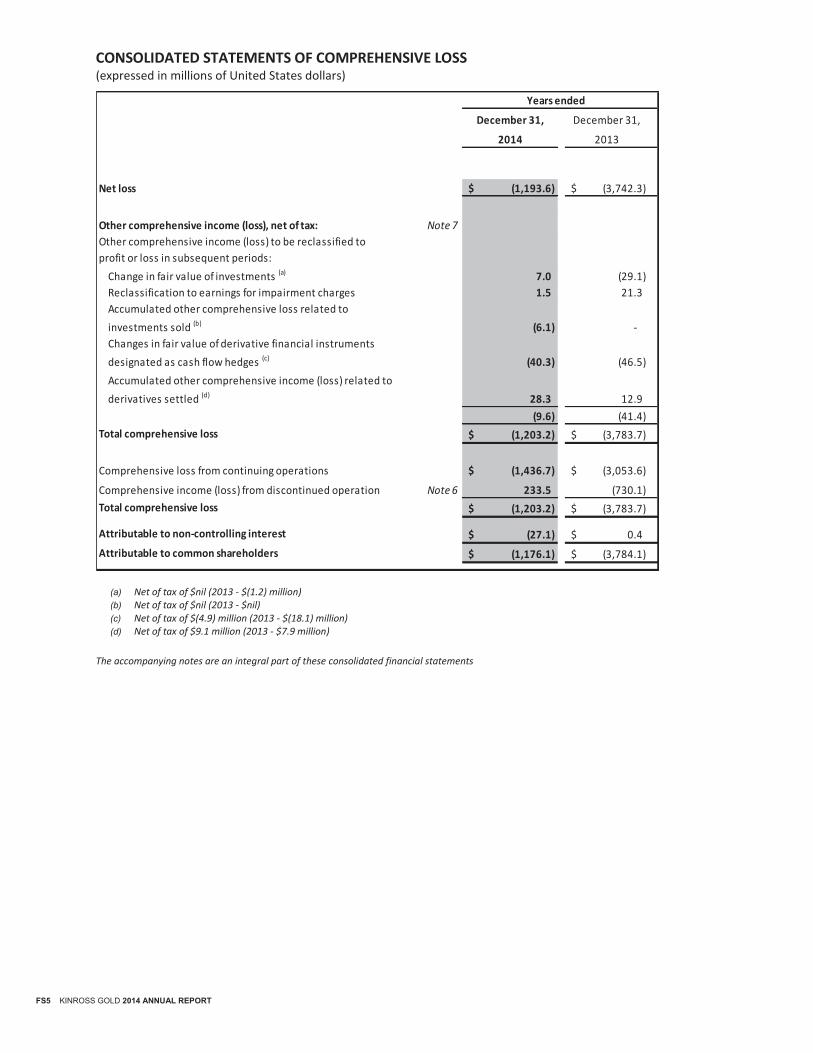
FS5 KINROSS GOLD 2014 ANNUAL REPORT
CONSOLIDATED STATEMENTS OF COMPREHENSIVE LOSS (expressed in millions of United States dollars)
(a) Net of tax of $nil (2013 - $(1.2) million) (b) Net of tax of $nil (2013 - $nil) (c) Net of tax of $(4.9) million (2013 - $(18.1) million) (d) Net of tax of $9.1 million (2013 - $7.9 million)
The accompanying notes are an integral part of these consolidated financial statements
December 31, December 31,
2014 2013
Net loss (1,193.6)$ (3,742.3)$
Other comprehensive income (loss), net of tax: Note 7
Other comprehensive income (loss) to be reclassified to
profit or loss in subsequent periods:
Change in fair value of investments (a) 7.0 (29.1)
Reclassification to earnings for impairment charges 1.5 21.3
Accumulated other comprehensive loss related to
investments sold (b) (6.1) -
Changes in fair value of derivative financial instruments
designated as cash flow hedges (c) (40.3) (46.5)
Accumulated other comprehensive income (loss) related to
derivatives settled (d) 28.3 12.9
(9.6) (41.4)
Total comprehensive loss (1,203.2)$ (3,783.7)$
Comprehensive loss from continuing operations (1,436.7)$ (3,053.6)$
Comprehensive income (loss) from discontinued operation Note 6 233.5 (730.1)
Total comprehensive loss (1,203.2)$ (3,783.7)$
Attributable to non-controlling interest (27.1)$ 0.4$
Attributable to common shareholders (1,176.1)$ (3,784.1)$
Years ended
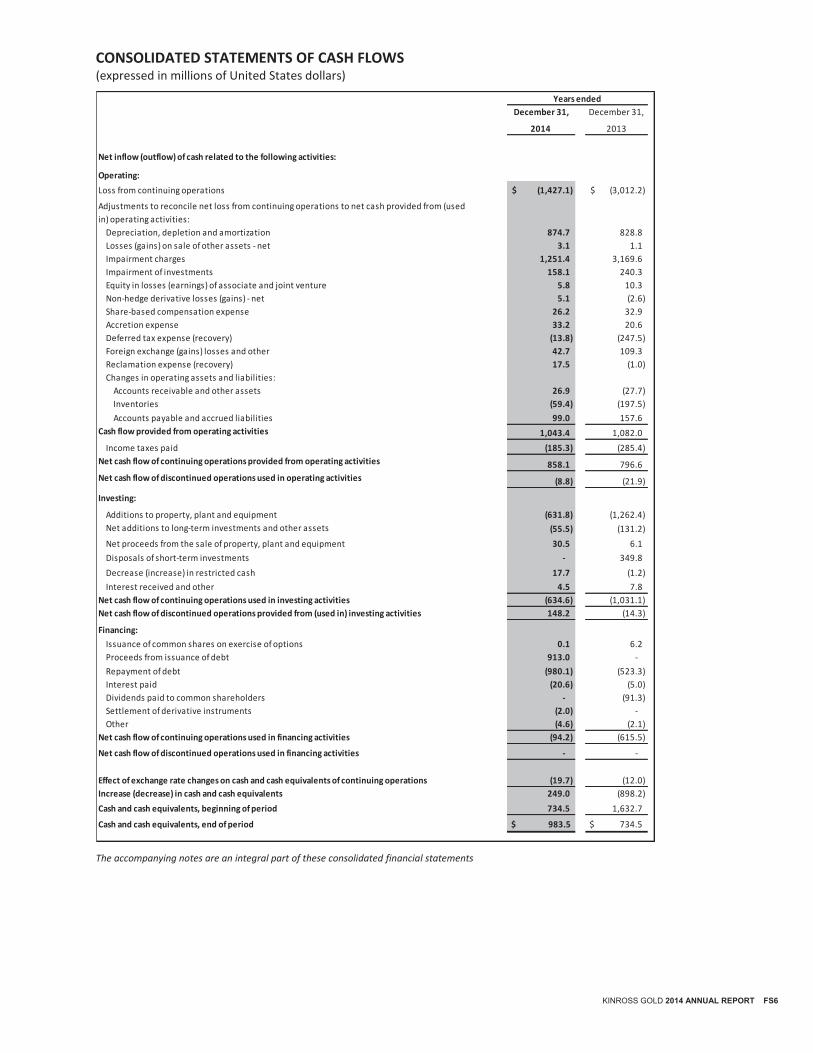
KINROSS GOLD 2014 ANNUAL REPORT FS6
CONSOLIDATED STATEMENTS OF CASH FLOWS (expressed in millions of United States dollars)
The accompanying notes are an integral part of these consolidated financial statements
December 31, December 31,
2014 2013
Net inflow (outflow) of cash related to the following activities:
Operating:
Loss from continuing operations (1,427.1)$ (3,012.2)$
Adjustments to reconcile net loss from continuing operations to net cash provided from (used
in) operating activities:
Depreciation, depletion and amortization 874.7 828.8
Losses (gains) on sale of other assets - net 3.1 1.1
Impairment charges 1,251.4 3,169.6
Impairment of investments 158.1 240.3
Equity in losses (earnings) of associate and joint venture 5.8 10.3
Non-hedge derivative losses (gains) - net 5.1 (2.6)
Share-based compensation expense 26.2 32.9
Accretion expense 33.2 20.6
Deferred tax expense (recovery) (13.8) (247.5)
Foreign exchange (gains) losses and other 42.7 109.3
Reclamation expense (recovery) 17.5 (1.0)
Changes in operating assets and liabilities:
Accounts receivable and other assets 26.9 (27.7)
Inventories (59.4) (197.5)
Accounts payable and accrued liabilities 99.0 157.6
Cash flow provided from operating activities 1,043.4 1,082.0
Income taxes paid (185.3) (285.4)
Net cash flow of continuing operations provided from operating activities 858.1 796.6
Net cash flow of discontinued operations used in operating activities (8.8) (21.9)
Investing:
Additions to property, plant and equipment (631.8) (1,262.4)
Net additions to long-term investments and other assets (55.5) (131.2)
Net proceeds from the sale of property, plant and equipment 30.5 6.1
Disposals of short-term investments - 349.8
Decrease (increase) in restricted cash 17.7 (1.2)
Interest received and other 4.5 7.8
Net cash flow of continuing operations used in investing activities (634.6) (1,031.1)
Net cash flow of discontinued operations provided from (used in) investing activities 148.2 (14.3)
Financing:
Issuance of common shares on exercise of options 0.1 6.2
Proceeds from issuance of debt 913.0 -
Repayment of debt (980.1) (523.3)
Interest paid (20.6) (5.0)
Dividends paid to common shareholders - (91.3)
Settlement of derivative instruments (2.0) -
Other (4.6) (2.1)
Net cash flow of continuing operations used in financing activities (94.2) (615.5)
Net cash flow of discontinued operations used in financing activities - -
Effect of exchange rate changes on cash and cash equivalents of continuing operations (19.7) (12.0)
Increase (decrease) in cash and cash equivalents 249.0 (898.2)
Cash and cash equivalents, beginning of period 734.5 1,632.7
Cash and cash equivalents, end of period $ 983.5 $ 734.5
Years ended
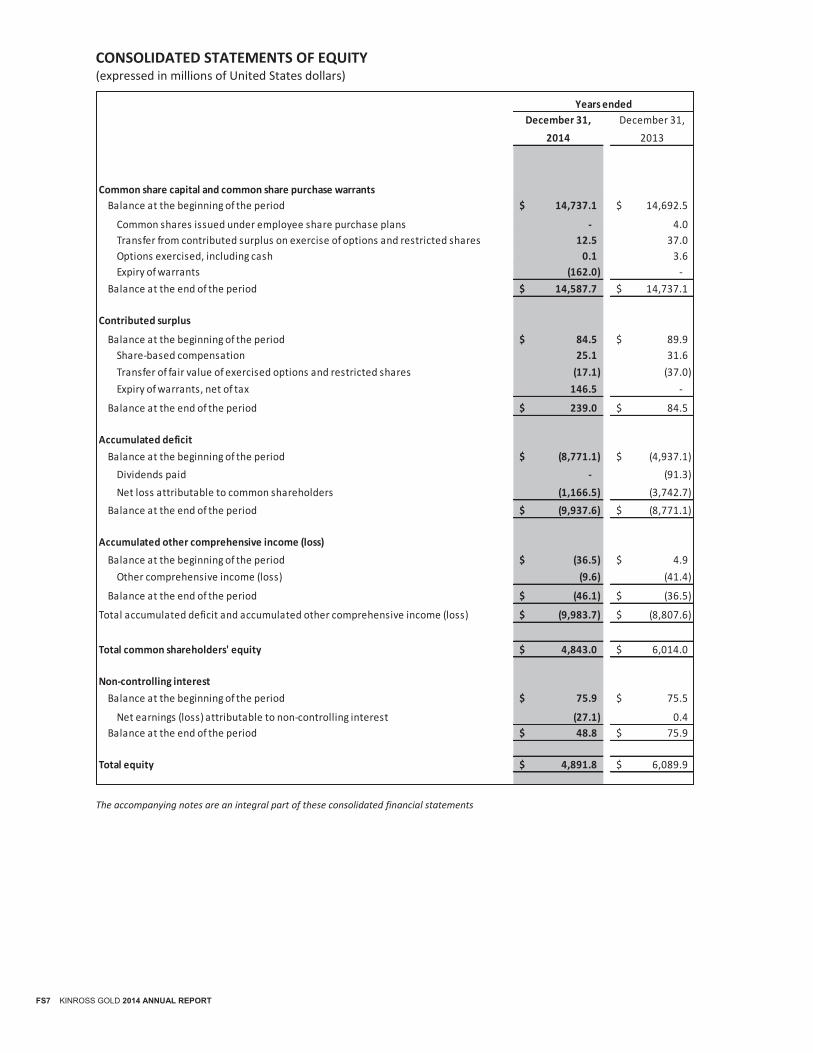
FS7 KINROSS GOLD 2014 ANNUAL REPORT
CONSOLIDATED STATEMENTS OF EQUITY (expressed in millions of United States dollars)
The accompanying notes are an integral part of these consolidated financial statements
December 31, December 31,
2014 2013
Common share capital and common share purchase warrants
Balance at the beginning of the period 14,737.1$ 14,692.5$
Common shares issued under employee share purchase plans - 4.0
Transfer from contributed surplus on exercise of options and restricted shares 12.5 37.0
Options exercised, including cash 0.1 3.6
Expiry of warrants (162.0) -
Balance at the end of the period 14,587.7$ 14,737.1$
Contributed surplus
Balance at the beginning of the period 84.5$ 89.9$
Share-based compensation 25.1 31.6
Transfer of fair value of exercised options and restricted shares (17.1) (37.0)
Expiry of warrants, net of tax 146.5 -
Balance at the end of the period 239.0$ 84.5$
Accumulated deficit
Balance at the beginning of the period (8,771.1)$ (4,937.1)$
Dividends paid - (91.3)
Net loss attributable to common shareholders (1,166.5) (3,742.7)
Balance at the end of the period (9,937.6)$ (8,771.1)$
Accumulated other comprehensive income (loss)
Balance at the beginning of the period (36.5)$ 4.9$
Other comprehensive income (loss) (9.6) (41.4)
Balance at the end of the period (46.1)$ (36.5)$
Total accumulated deficit and accumulated other comprehensive income (loss) (9,983.7)$ (8,807.6)$
Total common shareholders' equity 4,843.0$ 6,014.0$
Non-controlling interest
Balance at the beginning of the period 75.9$ 75.5$
Net earnings (loss) attributable to non-controlling interest (27.1) 0.4
Balance at the end of the period 48.8$ 75.9$
Total equity 4,891.8$ 6,089.9$
Years ended
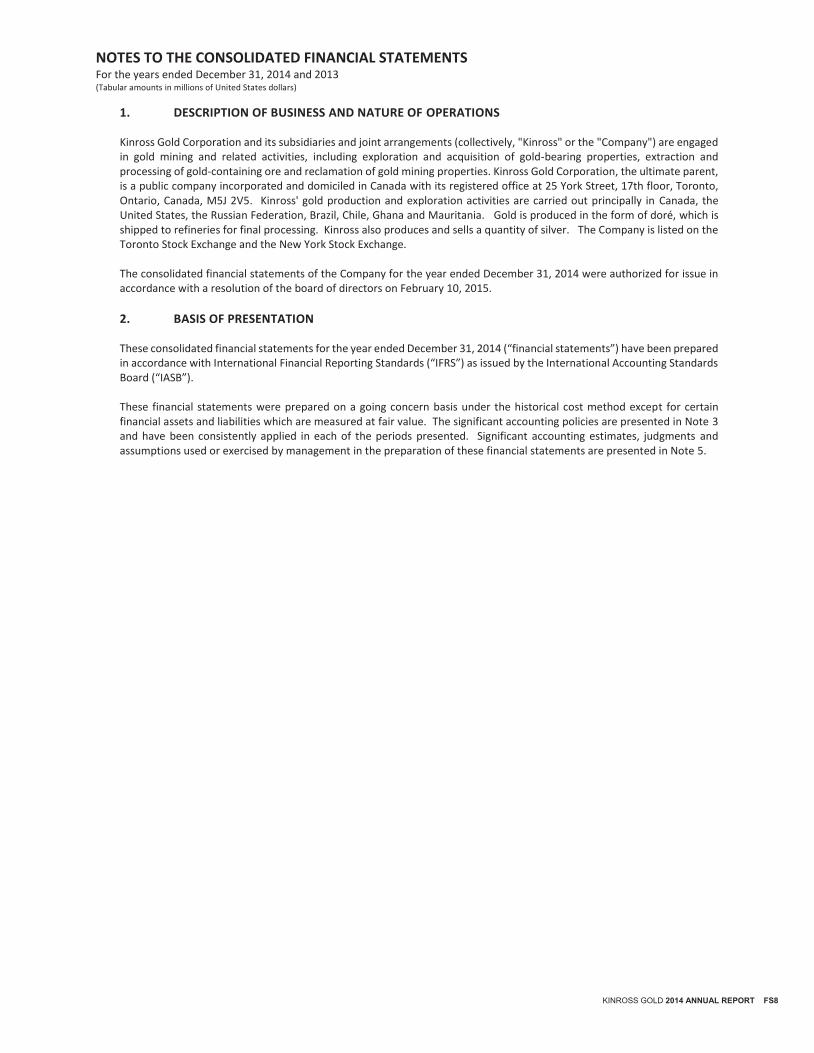
NOTES TO THE CONSOLIDATED FINANCIAL STATEMENTS For the years ended December 31, 2014 and 2013 (Tabular amounts in millions of United States dollars)
KINROSS GOLD 2014 ANNUAL REPORT FS8
1. DESCRIPTION OF BUSINESS AND NATURE OF OPERATIONS Kinross Gold Corporation and its subsidiaries and joint arrangements (collectively, "Kinross" or the "Company") are engaged in gold mining and related activities, including exploration and acquisition of gold-bearing properties, extraction and processing of gold-containing ore and reclamation of gold mining properties. Kinross Gold Corporation, the ultimate parent, is a public company incorporated and domiciled in Canada with its registered office at 25 York Street, 17th floor, Toronto, Ontario, Canada, M5J 2V5. Kinross' gold production and exploration activities are carried out principally in Canada, the United States, the Russian Federation, Brazil, Chile, Ghana and Mauritania. Gold is produced in the form of doré, which is shipped to refineries for final processing. Kinross also produces and sells a quantity of silver. The Company is listed on the Toronto Stock Exchange and the New York Stock Exchange. The consolidated financial statements of the Company for the year ended December 31, 2014 were authorized for issue in accordance with a resolution of the board of directors on February 10, 2015.
2. BASIS OF PRESENTATION These consolidated financial statements for the year ended December 31, 2014 (“financial statements”) have been prepared in accordance with International Financial Reporting Standards (“IFRS”) as issued by the International Accounting Standards Board (“IASB”). These financial statements were prepared on a going concern basis under the historical cost method except for certain financial assets and liabilities which are measured at fair value. The significant accounting policies are presented in Note 3 and have been consistently applied in each of the periods presented. Significant accounting estimates, judgments and assumptions used or exercised by management in the preparation of these financial statements are presented in Note 5.
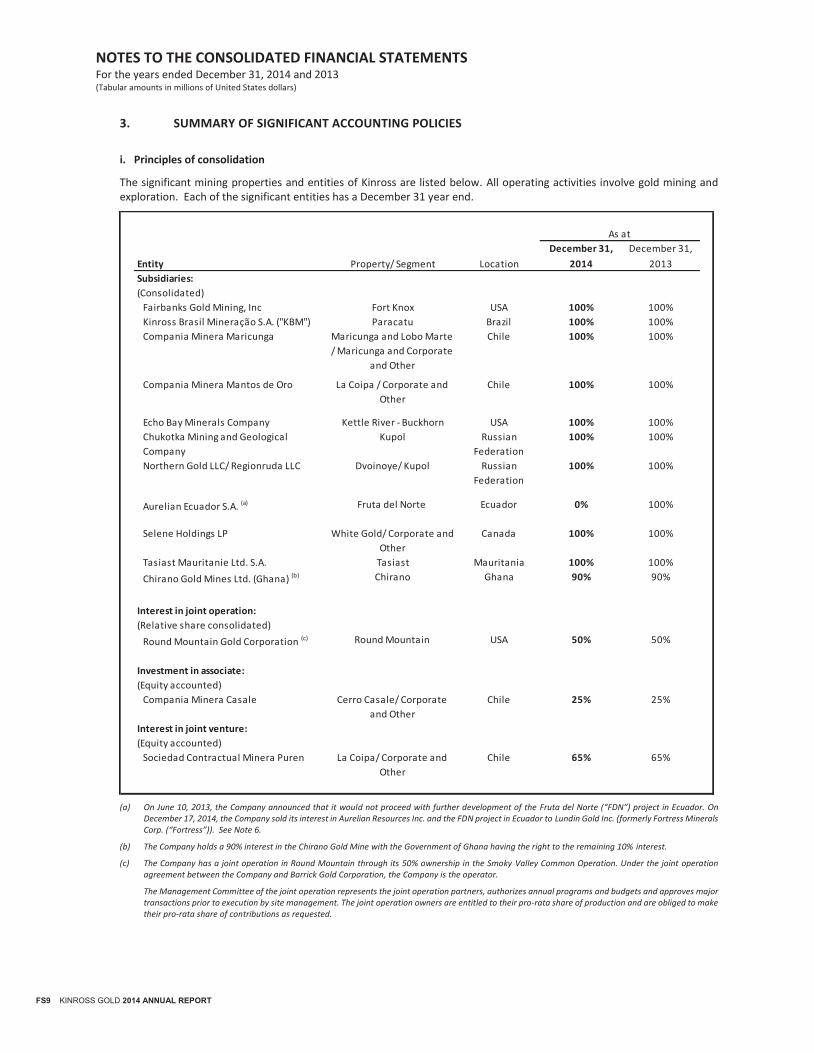
NOTES TO THE CONSOLIDATED FINANCIAL STATEMENTS For the years ended December 31, 2014 and 2013 (Tabular amounts in millions of United States dollars)
FS9 KINROSS GOLD 2014 ANNUAL REPORT
3. SUMMARY OF SIGNIFICANT ACCOUNTING POLICIES
i. Principles of consolidation
The significant mining properties and entities of Kinross are listed below. All operating activities involve gold mining and exploration. Each of the significant entities has a December 31 year end.
(a) On June 10, 2013, the Company announced that it would not proceed with further development of the Fruta del Norte (“FDN”) project in Ecuador. On December 17, 2014, the Company sold its interest in Aurelian Resources Inc. and the FDN project in Ecuador to Lundin Gold Inc. (formerly Fortress Minerals Corp. (“Fortress”)). See Note 6.
(b) The Company holds a 90% interest in the Chirano Gold Mine with the Government of Ghana having the right to the remaining 10% interest.
(c) The Company has a joint operation in Round Mountain through its 50% ownership in the Smoky Valley Common Operation. Under the joint operation agreement between the Company and Barrick Gold Corporation, the Company is the operator.
The Management Committee of the joint operation represents the joint operation partners, authorizes annual programs and budgets and approves major transactions prior to execution by site management. The joint operation owners are entitled to their pro-rata share of production and are obliged to make their pro-rata share of contributions as requested.
December 31, December 31,
Entity Property/ Segment Location 2014 2013
Subsidiaries:
(Consolidated)
Fairbanks Gold Mining, Inc Fort Knox USA 100% 100%
Kinross Brasil Mineração S.A. ("KBM") Paracatu Brazil 100% 100%
Compania Minera Maricunga Maricunga and Lobo Marte
/ Maricunga and Corporate
and Other
Chile 100% 100%
Compania Minera Mantos de Oro La Coipa / Corporate and
Other
Chile 100% 100%
Echo Bay Minerals Company Kettle River - Buckhorn USA 100% 100%
Chukotka Mining and Geological
Company
Kupol Russian
Federation
100% 100%
Northern Gold LLC/ Regionruda LLC Dvoinoye/ Kupol Russian
Federation
100% 100%
Aurelian Ecuador S.A. (a) Fruta del Norte Ecuador 0% 100%
Selene Holdings LP White Gold/ Corporate and
Other
Canada 100% 100%
Tasiast Mauritanie Ltd. S.A. Tasiast Mauritania 100% 100%
Chirano Gold Mines Ltd. (Ghana) (b) Chirano Ghana 90% 90%
Interest in joint operation:
(Relative share consolidated)
Round Mountain Gold Corporation (c) Round Mountain USA 50% 50%
Investment in associate:
(Equity accounted)
Compania Minera Casale Cerro Casale/ Corporate
and Other
Chile 25% 25%
Interest in joint venture:
(Equity accounted)
Sociedad Contractual Minera Puren La Coipa/ Corporate and
Other
Chile 65% 65%
As at

NOTES TO THE CONSOLIDATED FINANCIAL STATEMENTS For the years ended December 31, 2014 and 2013 (Tabular amounts in millions of United States dollars)
KINROSS GOLD 2014 ANNUAL REPORT FS10
(a) Subsidiaries
Subsidiaries are entities controlled by the Company. Control exists when an investor is exposed, or has rights, to variable returns from its involvement with an investee and has the ability to affect those returns through its power over the investee. Subsidiaries are included in the consolidated financial statements from the date control is obtained until the date control ceases. Where the Company’s interest in a subsidiary is less than 100%, the Company recognizes non-controlling interests. All intercompany balances, transactions, income, expenses, profits and losses, including unrealized gains and losses have been eliminated on consolidation.
(b) Joint Arrangements
The Company conducts a portion of its business through joint arrangements where the parties are bound by contractual arrangements establishing joint control over such arrangements and requiring unanimous consent of each of the parties regarding those activities that significantly affect the returns of the arrangement. The Company’s interest in a joint arrangement is classified as either a joint operation or a joint venture depending on its rights and obligations in the arrangement. In a joint operation, the Company has rights to its share of the assets, and obligations for its share of the liabilities, of the joint arrangement, while in a joint venture, the Company has rights to its share of the net assets of the joint arrangement. For a joint operation, the Company recognizes in the consolidated financial statements, its share of the assets, liabilities, revenue, and expenses of the joint arrangement, while for a joint venture, the Company recognizes in the consolidated financial statements its investment in the joint arrangement using the equity method of accounting.
(c) Associates
Associates are entities, including unincorporated entities such as partnerships, over which the Company has significant influence and that are neither subsidiaries nor interests in joint arrangements. Significant influence is the ability to participate in the financial and operating policy decisions of the investee without having control or joint control over those policies. In general, significant influence is presumed to exist when the Company has between 20% and 50% of voting power. Significant influence may also be evidenced by factors such as the Company’s representation on the board of directors, participation in policy-making of the investee, material transactions with the investee, interchange of managerial personnel, or the provision of essential technical information. Associates are equity accounted for from the effective date of commencement of significant influence to the date that the Company ceases to have significant influence.
Results of associates are equity accounted for using the results of their most recent audited annual financial statements or interim financial statements, as applicable. Losses from associates are recognized in the consolidated financial statements until the interest in the associate is written down to nil. Thereafter, losses are recognized only to the extent that the Company is committed to providing financial support to such associates.
The carrying value of the investment in an associate represents the cost of the investment, including goodwill, a share of the post-acquisition retained earnings and losses, accumulated other comprehensive income (“AOCI”) and any impairment losses. At the end of each reporting period, the Company assesses whether there is any objective evidence that its investments in associates are impaired.
ii. Functional and presentation currency
The functional and presentation currency of the Company is the United States dollar.
Transactions denominated in foreign currencies are translated into the United States dollar as follows:
Monetary assets and liabilities are translated at the rates of exchange at the consolidated balance sheet date;
Non-monetary assets and liabilities are translated at historical exchange rates prevailing at each transaction date;
Revenue and expenses are translated at the exchange rate at the date of the transaction, except depreciation, depletion and amortization, which are translated at the rates of exchange applicable to the related assets, and share-based compensation expense, which is translated at the rates of exchange applicable at the date of grant of the share-based compensation; and
Exchange gains and losses on translation are included in earnings.
When the gain or loss on certain non-monetary items, such as long-term investments classified as available-for-sale, is recognized in other comprehensive income (“OCI”), the translation differences are also recognized in OCI.
NOTES TO THE CONSOLIDATED FINANCIAL STATEMENTS For the years ended December 31, 2014 and 2013 (Tabular amounts in millions of United States dollars)
FS11 KINROSS GOLD 2014 ANNUAL REPORT
iii. Cash and cash equivalents
Cash and cash equivalents include cash and highly liquid investments with a maturity of three months or less at the date of acquisition.
Restricted cash is cash held in banks that is not available for general corporate use.
iv. Short-term investments
Short-term investments include short-term money market instruments with terms to maturity at the date of acquisition of between three and twelve months. The carrying value of short-term investments is equal to cost and accrued interest.
v. Long-term investments
Investments in entities that are not subsidiaries, joint operations, joint ventures or investments in associates are designated as available-for-sale investments. These investments are measured at fair value on acquisition and at each reporting date. Any unrealized holding gains and losses related to these investments are excluded from net earnings and are included in OCI until an investment is sold and gains or losses are realized, or there is objective evidence that the investment is impaired. When there is evidence that an investment is impaired, the cumulative loss that was previously recognized in OCI is reclassified from AOCI to the consolidated statement of operations.
vi. Inventories
Inventories consisting of metal in circuit ore, metal in-process and finished metal are valued at the lower of cost or net realizable value (“NRV”). NRV is calculated as the difference between the estimated gold prices based on prevailing and long-term metal prices and estimated costs to complete production into a saleable form.
Metal in circuit is comprised of ore in stockpiles and ore on heap leach pads. Ore in stockpiles is coarse ore that has been extracted from the mine and is available for further processing. Costs are added to stockpiles based on the current mining cost per tonne and removed at the average cost per tonne. Costs are added to ore on the heap leach pads based on current mining costs and removed from the heap leach pads as ounces are recovered, based on the average cost per recoverable ounce of gold on the leach pad. Ore in stockpiles not expected to be processed in the next twelve months is classified as long-term.
The quantities of recoverable gold placed on the leach pads are reconciled by comparing the grades of ore placed on the leach pads to the quantities of gold actually recovered (metallurgical balancing); however, the nature of the leaching process inherently limits the ability to precisely monitor inventory levels. As a result, the metallurgical balancing process is constantly monitored and the engineering estimates are refined based on actual results over time. Variances between actual and estimated quantities resulting from changes in assumptions and estimates that do not result in write downs to NRV are accounted for on a prospective basis. The ultimate actual recovery of gold from a leach pad will not be known until the leaching process has concluded. In the event that the Company determines, based on engineering estimates, that a quantity of gold contained in ore on leach pads is to be recovered over a period exceeding twelve months, that portion is classified as long-term.
In-process inventories represent materials that are in the process of being converted to a saleable product.
Materials and supplies are valued at the lower of average cost and NRV.
Write downs of inventory are recognized in the consolidated statement of operations in the current period. The Company reverses inventory write downs in the event that there is a subsequent increase in NRV.
vii. Borrowing costs
Borrowing costs are generally expensed as incurred except where they relate to the financing of qualifying assets that require a substantial period of time to get ready for their intended use. Qualifying assets include the cost of developing mining properties and constructing new facilities. Borrowing costs related to qualifying assets are capitalized up to the date when the asset is ready for its intended use.
Where funds are borrowed specifically to finance a project, the amount capitalized represents the actual borrowing costs incurred net of any investment income earned on the investment of those borrowings. Where the funds used to finance a project form part of general borrowings, the amount capitalized is calculated using a weighted average of rates applicable to relevant general borrowings of the Company during the period.
NOTES TO THE CONSOLIDATED FINANCIAL STATEMENTS For the years ended December 31, 2014 and 2013 (Tabular amounts in millions of United States dollars)
KINROSS GOLD 2014 ANNUAL REPORT FS12
viii. Business combinations
A business combination is a transaction or other event in which control over one or more businesses is obtained. A business is an integrated set of activities and assets that is capable of being conducted and managed for the purpose of providing a return in the form of dividends, lower costs or other economic benefits. A business consists of inputs and processes applied to those inputs that have the ability to create outputs that provide a return to the Company and its shareholders. A business need not include all of the inputs and processes that were used by the acquiree to produce outputs if the business can be integrated with the inputs and processes of the Company to continue to produce outputs. If the integrated set of activities and assets is in the exploration and development stage, and thus, may not have outputs, the Company considers other factors to determine whether the set of activities and assets is a business. Those factors include, but are not limited to, whether the set of activities and assets:
has begun planned principal activities;
has employees, intellectual property and other inputs and processes that could be applied to those inputs;
is pursuing a plan to produce outputs; and
will be able to obtain access to customers that will purchase the outputs.
Not all of the above factors need to be present for a particular integrated set of activities and assets in the development stage to qualify as a business.
Business acquisitions are accounted for using the acquisition method whereby acquired assets and liabilities are recorded at fair value as of the date of acquisition with the excess of the purchase consideration over such fair value being recorded as goodwill and allocated to cash generating units (“CGUs”). Non-controlling interest in an acquisition may be measured at either fair value or at the non-controlling interest’s proportionate share of the fair value of the acquiree’s net identifiable assets.
If the fair value of the net assets acquired exceeds the purchase consideration, the difference is recognized immediately as a gain in the consolidated statement of operations.
Where a business combination is achieved in stages, previously held equity interests in the acquiree are re-measured at their acquisition-date fair value and any resulting gain or loss is recognized in the consolidated statement of operations.
Acquisition related costs are expensed during the period in which they are incurred, except for the cost of debt or equity instruments issued in relation to the acquisition which is included in the carrying amount of the related instrument.
Certain fair values may be estimated at the acquisition date pending confirmation or completion of the valuation process. Where provisional values are used in accounting for a business combination, they are adjusted retrospectively in subsequent periods. However, the measurement period will not exceed one year from the acquisition date.
If the assets acquired are not a business, the transaction is accounted for as an asset acquisition.
ix. Goodwill
Business acquisitions are accounted for using the acquisition method whereby acquired assets and liabilities are recorded at fair value as of the date of acquisition with the excess of the acquisition amount over such fair value being recorded as goodwill and allocated to CGUs. CGUs are the smallest identifiable group of assets, liabilities and associated goodwill that generate cash inflows that are largely independent of the cash inflows from other assets or groups of assets. Each individual mineral property that is an operating or development stage mine is typically a CGU for goodwill impairment testing purposes.
Goodwill arises principally because of the following factors: (1) the going concern value of the Company’s capacity to sustain and grow by replacing and augmenting mineral reserves through completely new discoveries; (2) the ability to capture buyer-specific synergies arising upon a transaction; (3) the optionality (real option value associated with the portfolio of acquired mines as well as each individual mine) to develop additional higher-cost mineral reserves, to intensify efforts to develop the more promising acquired properties and to reduce efforts at developing the less promising acquired properties in the future (this optionality may result from changes in the overall economics of an individual mine or a portfolio of mines, largely driven by changes in the gold price); and (4) the requirement to record a deferred tax liability for the difference between the assigned values and the tax bases of the assets acquired and liabilities assumed in a business combination.
On an annual basis, as at December 31, and at any other time if events or changes in circumstances indicate that the recoverable amount of a CGU has been reduced below its carrying amount, the carrying amount of the CGU is evaluated for
NOTES TO THE CONSOLIDATED FINANCIAL STATEMENTS For the years ended December 31, 2014 and 2013 (Tabular amounts in millions of United States dollars)
FS13 KINROSS GOLD 2014 ANNUAL REPORT
potential impairment. If the carrying amount of the CGU exceeds its recoverable amount, an impairment is considered to exist and an impairment loss is recognized to reduce the carrying value to its recoverable amount.
When an impairment review is undertaken, the recoverable amount is assessed by reference to the higher of value in use and fair value less costs to sell.
Value in use is determined as the present value of the estimated future cash flows expected to arise from the continued use of the asset in its present form and its eventual disposal. Value in use is determined by applying assumptions specific to the Company’s continued use and cannot take into account future development. These assumptions are different to those used in calculating fair value and consequently the value in use calculation is likely to give a different result (usually lower) than a fair value calculation.
Fair value is determined as the amount that would be obtained from the sale of the asset in an arm’s length transaction between knowledgeable and willing parties. Fair value for mineral assets is generally determined as the present value of the estimated future cash flows expected to arise from the continued use of the asset, including any expansion prospects, and its eventual disposal, using assumptions that an independent market participant may take into account. These cash flows are discounted by an appropriate discount rate to arrive at a net present value or net asset value (“NAV”) of the asset.
Estimates of expected future cash flows reflect estimates of future revenues, cash costs of production and capital expenditures contained in the Company’s long-term life of mine (“LOM”) plans, which are updated for each CGU on an annual basis. The Company’s LOM plans are based on detailed research, analysis and modeling to maximize the NAV of each CGU. As such, these plans consider the optimal level of investment, overall production levels and sequence of extraction taking into account all relevant characteristics of the ore body, including waste to ore ratios, ore grades, haul distances, chemical and metallurgical properties impacting process recoveries, capacities of available extraction, haulage and processing equipment, and other factors. Therefore, the LOM plan is an appropriate basis for forecasting production output in each future year and the related production costs and capital expenditures. The LOM plans have been determined using cash flow projections from financial budgets approved by senior management covering a 2 year to 28 year period.
Projected future revenues reflect the forecast future production levels at each of the Company’s CGUs as detailed in the LOM plans. These forecasts may include the production of mineralized material that does not currently qualify for inclusion in mineral reserve or mineral resource classification. This is consistent with the methodology used to measure value beyond proven and probable reserves when allocating the purchase price of a business combination to acquired mining assets. The fair value arrived at as described above, is the Company’s estimate of fair value for accounting purposes and is not a “preliminary assessment” as defined in Canadian National Instrument 43-101 “Standards of Disclosure for Mineral Projects”.
Projected future revenues also reflect the Company’s estimates of future metals prices, which are determined based on current prices, forward prices and forecasts of future prices prepared by industry analysts. These estimates often differ from current price levels, but the methodology used is consistent with how a market participant would assess future long-term metals prices. For the 2014 annual goodwill impairment analysis, estimated 2015, 2016, and long-term gold prices of $1,200, $1,300 and $1,300 per ounce, respectively, and estimated 2015, 2016, and long-term silver prices of $18.00, $19.25 and $20.30 per ounce, respectively, were used. For the 2013 annual goodwill impairment analysis, estimated 2014, 2015 and long-term gold prices of $1,200, $1,300 and $1,300 per ounce, respectively, and estimated 2014, 2015 and long-term silver prices of $21.00, $22.00 and $22.50 per ounce, respectively, were used. For the June 30, 2013 impairment analysis described in Note 8, which was performed as a result of the identification of certain indicators of potential impairment as of that date, the estimated 2013, 2014 and long-term gold prices used were $1,480, $1,450 and $1,300 per ounce, respectively, and the estimated 2013, 2014 and long-term silver prices used were $26.00, $25.50 and $22.75 per ounce, respectively.
The Company’s estimates of future cash costs of production and capital expenditures are based on the LOM plans for each CGU. Costs incurred in currencies other than the US dollar are translated to US dollar equivalents based on long-term forecasts of foreign exchange rates, on a currency by currency basis, obtained from independent sources of economic data. Oil prices are a significant component of cash costs of production and are estimated based on the current price, forward prices, and forecasts of future prices from third party sources. For the 2014 annual goodwill impairment analysis, an estimated 2015 and long-term oil price of $75 per barrel, was used. For the 2013 annual goodwill impairment analysis, an estimated 2014 and long-term oil price of $100 per barrel was used. For the June 30, 2013 impairment analysis, an estimated 2013 and long-term oil price of $100 per barrel was used.
The discount rate applied to present value the net future cash flows is based on a real weighted average cost of capital by country to account for geopolitical risk. For the 2014 annual goodwill impairment analysis, real discount rates of between 4.75% and 6.16% were used. For the 2013 annual goodwill impairment analysis, real discount rates of between 4.49% and 6.13% were used. For the June 30, 2013 impairment analysis, real discount rates of between 4.66% and 5.99% were used.
NOTES TO THE CONSOLIDATED FINANCIAL STATEMENTS For the years ended December 31, 2014 and 2013 (Tabular amounts in millions of United States dollars)
KINROSS GOLD 2014 ANNUAL REPORT FS14
Since public gold companies typically trade at a market capitalization that is based on a multiple of their underlying NAV, a market participant would generally apply a NAV multiple when estimating the fair value of a gold mining property. Consequently, the Company estimates the fair value of each CGU by applying a market NAV multiple to the NAV of each CGU.
When selecting NAV multiples to arrive at fair value, the Company considered the trading prices and NAV estimates of comparable gold mining companies as at December 31, 2014 in respect of the fair value determinations at that date, which ranged from 0.9 to 1.2. NAV multiples observed at June 30, 2013 and December 31, 2013 were in the range of 0.7 and 1.3. The selected ranges of multiples applied to each CGU, which may be different from the ranges noted above, took into consideration, among other factors: expected production growth in the near term; average cash costs over the life of the mine; potential remaining mine life; and stage of development of the asset.
x. Exploration and evaluation (“E&E”) costs
Exploration and evaluation costs are those costs required to find a mineral property and determine commercial viability. E&E costs include costs to establish an initial mineral resource and determine whether inferred mineral resources can be upgraded to measured and indicated mineral resources and whether measured and indicated mineral resources can be converted to proven and probable reserves.
E&E costs consist of:
gathering exploration data through topographical and geological studies;
exploratory drilling, trenching and sampling;
determining the volume and grade of the resource;
test work on geology, metallurgy, mining, geotechnical and environmental; and
conducting engineering, marketing and financial studies.
Project costs in relation to these activities are expensed as incurred until such time as the Company expects that mineral resources will be converted to mineral reserves within a reasonable period. Thereafter, costs for the project are capitalized prospectively as capitalized exploration and evaluation costs in property, plant and equipment.
The Company also recognizes E&E costs as assets when acquired as part of a business combination, or asset purchase. These assets are recognized at fair value. Acquired E&E costs consist of:
fair value of the estimated potential ounces, and
exploration properties.
Acquired or capitalized E&E costs for a project are classified as such until the project demonstrates technical feasibility and commercial viability. Upon demonstrating technical feasibility and commercial viability, and subject to an impairment analysis, capitalized E&E costs are transferred to capitalized development costs within property, plant and equipment. Technical feasibility and commercial viability generally coincides with the establishment of proven and probable mineral reserves; however, this determination may be impacted by management’s assessment of certain modifying factors including: legal, environmental, social and governmental factors.
xi. Property, plant and equipment
Property, plant and equipment are recorded at cost and carried net of accumulated depreciation, depletion and amortization and accumulated impairment losses. The initial cost of an asset comprises its purchase price or construction cost, any costs directly attributable to bringing the asset into operation, the estimate of reclamation and remediation and, for qualifying assets, capitalized borrowing costs.
Costs to acquire mineral properties are capitalized and represent the property’s fair value at the time it was acquired, either as an individual asset purchase or as part of a business combination.
Interest expense attributable to the cost of developing mining properties and to constructing new facilities is capitalized until assets are ready for their intended use.
Acquired or capitalized exploration and evaluation costs may be included within mineral interests in development and operating properties or pre-development properties depending upon the nature of the property to which the costs relate. Repairs and maintenance costs are expensed as incurred. However, expenditures on major maintenance rebuilds or
NOTES TO THE CONSOLIDATED FINANCIAL STATEMENTS For the years ended December 31, 2014 and 2013 (Tabular amounts in millions of United States dollars)
FS15 KINROSS GOLD 2014 ANNUAL REPORT
overhauls are capitalized when it is probable that the expenditures will extend the productive capacity or useful life of an asset.
(a) Asset categories
The Company categorizes property, plant and equipment based on the type of asset and/or the stage of operation or development of the property.
Land, plant and equipment includes land, mobile and stationary equipment, and refining and processing facilities for all properties regardless of their stage of development or operation.
Mineral interests consist of:
Development and operating properties which include capitalized development and stripping costs, cost of assets under construction, exploration and evaluation costs and mineral interests for those properties currently in operation, for which development has commenced, or for which proven and probable reserves have been declared; and
Pre-development properties which include exploration and evaluation costs and mineral interests for those properties for which development has not commenced.
(b) Depreciation, depletion and amortization
For plant and other facilities, stripping costs, reclamation and remediation costs, production stage mineral interests and plant expansion costs, the Company uses the units-of-production (“UOP”) method for determining depreciation, depletion and amortization. The expected useful lives used in the UOP calculations are determined based on the facts and circumstances associated with the mineral interest. The Company evaluates the proven and probable reserves at least on an annual basis and adjusts the UOP calculation to correspond with the changes in reserves. The expected useful life used in determining UOP does not exceed the estimated life of the ore body based on recoverable ounces to be mined from estimated proven and probable reserves. Any changes in estimates of useful lives are accounted for prospectively from the date of the change.
Stripping and other costs incurred in a pit expansion are capitalized and amortized using the UOP method based on recoverable ounces to be mined from estimated proven and probable reserves contained in the pit expansion.
Land is not depreciated.
Mobile and other equipment are depreciated, net of residual value, using the straight-line method, over the estimated useful life of the asset. Useful lives for mobile and other equipment range from 2 to 10 years, but do not exceed the related estimated mine life based on proven and probable reserves.
The Company reviews useful lives and estimated residual values of its property, plant and equipment annually.
Acquired or capitalized exploration and evaluation costs and assets under construction are not depreciated. These assets are depreciated when they are put into production in their intended use.
(c) Impairment
The carrying amounts of the Company’s property, plant and equipment are reviewed at each reporting date to determine whether there is any indication of impairment. If any such indication exists, then the asset’s recoverable amount is estimated. In addition, capitalized exploration and evaluation costs are assessed for impairment upon demonstrating the technical feasibility and commercial viability of a project.
Impairment is determined for an individual asset unless the asset does not generate cash inflows that are independent of those generated from other assets or groups of assets, in which case, the individual assets are grouped together into CGUs for impairment purposes.
An impairment exists when the carrying amount of the asset, or group of assets, exceeds its recoverable amount. The impairment loss is the amount by which the carrying value exceeds the recoverable amount and such loss is recognized in the consolidated statement of operations. The recoverable amount of an asset is the higher of its fair value less costs to sell and its value in use.
NOTES TO THE CONSOLIDATED FINANCIAL STATEMENTS For the years ended December 31, 2014 and 2013 (Tabular amounts in millions of United States dollars)
KINROSS GOLD 2014 ANNUAL REPORT FS16
A previously recognized impairment loss is reversed if there has been a change in the estimates used to determine the asset’s recoverable amount since the last impairment loss was recognized such that the recoverable amount has increased.
(d) Derecognition
The carrying amount of an item of property, plant and equipment is derecognized on disposal of the asset or when no future economic benefits are expected to accrue to the Company from its continued use. Any gain or loss arising on derecognition is included in the consolidated statement of operations in the period in which the asset is derecognized. The gain or loss is determined as the difference between the carrying value and the net proceeds on the sale of the assets, if any, at the time of disposal.
xii. Financial instruments and hedging activity
(a) Financial instrument classification and measurement Financial instruments are measured on initial recognition at fair value, plus, in the case of financial instruments other than those classified as “fair value through profit and loss”, directly attributable transaction costs. Measurement of financial assets in subsequent periods depends on whether the financial instrument has been classified as “fair value through profit and loss”, “available-for-sale”, “held-to-maturity”, or “loans and receivables”. Measurement of financial liabilities subsequent to initial recognition depends on whether they are classified as fair value through profit and loss or “other financial liabilities”.
Financial assets and financial liabilities at fair value through profit and loss include financial assets and financial liabilities that are held for trading or designated upon initial recognition as at fair value through profit and loss. These financial instruments are measured at fair value with changes in fair values recognized in the consolidated statement of operations. Financial assets classified as available-for-sale are measured at fair value, with changes in fair values recognized in OCI, except when there is objective evidence that the asset is impaired, at which point the cumulative loss that had been previously recognized in OCI is recognized within the consolidated statement of operations. Financial assets classified as held-to-maturity and loans and receivables are measured subsequent to initial recognition at amortized cost using the effective interest method. Financial liabilities, other than financial liabilities classified as fair value through profit and loss, are measured in subsequent periods at amortized cost using the effective interest method.
Cash and cash equivalents, restricted cash and short-term investments are designated as fair value through profit and loss and are measured at cost, which approximates fair value. Trade receivables and certain other assets are designated as loans and receivables. Long-term investments in equity securities, where the Company cannot exert significant influence, are designated as available-for sale. Accounts payable and accrued liabilities and long-term debt are classified as other financial liabilities.
Derivative assets and liabilities include derivative financial instruments that do not qualify as hedges, or are not designated as hedges and are classified as fair value through profit and loss.
(b) Hedges
The Company formally documents all relationships between hedging instruments and hedged items, as well as its risk management objectives and strategies for undertaking hedge transactions. This process includes linking all derivatives to specific assets and liabilities on the balance sheet or to specific firm commitments or forecasted transactions. Hedge effectiveness is assessed based on the degree to which the cash flows from the derivative contracts are expected to offset the cash flows of the underlying position or transaction being hedged. At the time of inception of the hedge and on an ongoing basis, the Company assesses whether the derivatives that are used in hedging transactions are highly effective in offsetting changes in fair values or cash flows of hedged items.
Derivative contracts that have been designated as cash flow hedges have been entered into in order to effectively establish prices for future production of metals, to hedge exposure to exchange rate fluctuations of foreign currency denominated settlement of capital and operating expenditures, to establish prices for future purchases of energy or to hedge exposure to interest rate fluctuations. Unrealized gains or losses arising from changes in the fair value of these contracts are recorded in OCI, net of tax, and are only included in earnings when the underlying hedged transaction, identified at the contract inception, is completed. Any ineffective portion of a hedge relationship is recognized immediately in the consolidated statement of operations. The Company matches the realized gains or losses on contracts designated as cash flow hedges with the hedged expenditures at the maturity of the contracts.
When derivative contracts designated as cash flow hedges have been terminated or cease to be effective prior to maturity and no longer qualify for hedge accounting, any gains or losses recorded in OCI up until the time the contracts do not qualify
NOTES TO THE CONSOLIDATED FINANCIAL STATEMENTS For the years ended December 31, 2014 and 2013 (Tabular amounts in millions of United States dollars)
FS17 KINROSS GOLD 2014 ANNUAL REPORT
for hedge accounting, remain in OCI. Amounts recorded in OCI are recognized in the consolidated statement of operations in the period in which the underlying hedged transaction is completed. Gains or losses arising subsequent to the derivative contracts not qualifying for hedge accounting are recognized in the consolidated statement of operations in the period in which they occur.
For hedges that do not qualify for hedge accounting, gains or losses are recognized in the consolidated statement of operations in the current period.
xiii. Impairment of financial assets
The Company assesses at each reporting date whether there is objective evidence that a financial asset or a group of financial assets is impaired. In the case of investments classified as available-for-sale, an evaluation is made as to whether a decline in fair value is significant or prolonged based on an analysis of indicators such as market price of the investment and significant adverse changes in the technological, market, economic or legal environment in which the investee operates.
If an available-for-sale financial asset is impaired, an amount equal to the difference between its carrying value and its current fair value is transferred from AOCI and recognized in the consolidated statement of operations. Reversals of impairment charges in respect of equity instruments classified as available-for-sale are not recognized in the consolidated statement of operations.
xiv. Share-based payments
The Company has a number of equity-settled and cash-settled share-based compensation plans under which the Company issues either equity instruments or makes cash payments based on the value of the underlying equity instrument of the Company. The Company’s share-based compensation plans are comprised of the following:
Share Option Plan: Stock options are generally equity-settled. The fair value of stock options at the grant date is estimated using the Black-Scholes option pricing model. Compensation expense is recognized over the stock option vesting period based on the number of options estimated to vest. Management estimates the number of awards likely to vest at the time of a grant and at each reporting date up to the vesting date. Annually, the estimated forfeiture rate is adjusted for actual forfeitures in the period. On exercise of the vested options, the shares are issued from treasury.
Restricted Share Plan: Restricted share units (“RSUs”) and Restricted performance share units (“RPSUs”) are granted under the Restricted Share Plan. Both RSUs and RPSUs are generally equity-settled and awarded to certain employees as a percentage of long-term incentive awards.
(a) RSUs are fair valued based on the market value of the shares at the grant date. The Company’s compensation expense is recognized over the vesting period based on the number of units estimated to vest. Management estimates the number of awards likely to vest on grant and at each reporting date up to the vesting date. Annually, the estimated forfeiture rate is adjusted for actual forfeitures in the period. On vesting of RSUs, shares are generally issued from treasury.
(b) RPSUs are subject to certain vesting requirements based on performance criteria over the vesting period established by the Company. RPSUs are fair valued as follows: The portion of the RPSUs related to market conditions is fair valued based on the application of a Monte Carlo pricing model at the date of grant and the portion related to non-market conditions is fair valued based on the market value of the shares at the date of grant. The Company’s compensation expense is recognized over the vesting period based on the number of units estimated to vest. Management estimates the number of awards likely to vest on grant and at each reporting date up to the vesting date. Annually, the estimated forfeiture rate is adjusted for actual forfeitures in the period. On vesting of RPSUs, shares are generally issued from treasury.
Deferred Share Unit Plan: Deferred share units (“DSUs”) are cash-settled and accounted for as a liability at fair value which is based on the market value of the shares at the grant date. The fair value of the liability is re-measured each period based on the current market value of the underlying stock at period end and any changes in the liability are recorded as compensation expense each period.
Employee Share Purchase Plan: The Company’s contribution to the employee Share Purchase Plan (“SPP”) is recorded as compensation expense on a payroll cycle basis as the employer’s obligation to contribute is incurred. The cost of the common shares purchased under the SPP are either based on the weighted average closing price of the last twenty trading sessions prior to the end of the period for shares issued from treasury, or are based on the price paid for common shares purchased in the open market.
NOTES TO THE CONSOLIDATED FINANCIAL STATEMENTS For the years ended December 31, 2014 and 2013 (Tabular amounts in millions of United States dollars)
KINROSS GOLD 2014 ANNUAL REPORT FS18
xv. Metal sales
Metal sales includes sales of refined gold and silver and doré, which are generally physically delivered to customers in the period in which they are produced, with their sales price based on prevailing spot market metal prices. Revenue from metal sales is recognized when all the following conditions have been satisfied:
• The significant risks and rewards of ownership have been transferred;
• Neither continuing managerial involvement to the degree usually associated with ownership, nor effective control over the goods sold, has been retained;
• The amount of revenue can be measured reliably;
• It is probable that the economic benefits associated with the transaction will flow to the Company; and
• The costs incurred or to be incurred in respect of the transaction can be measured reliably.
These conditions are generally met when the sales price is fixed and title has passed to the customer.
xvi. Provision for reclamation and remediation
The Company records a liability and corresponding asset for the present value of the estimated costs of legal and constructive obligations for future site reclamation and closure where the liability is probable and a reasonable estimate can be made of the obligation. The estimated present value of the obligation is reassessed on an annual basis or when new material information becomes available. Increases or decreases to the obligation usually arise due to changes in legal or regulatory requirements, the extent of environmental remediation required, methods of reclamation, cost estimates, or discount rates. Changes to the provision for reclamation and remediation obligations related to operating mines, which are not the result of current production of inventory, are recorded with an offsetting change to the related asset. For properties where mining activities have ceased or are in reclamation, changes are charged directly to earnings. The present value is determined based on current market assessments of the time value of money using discount rates specific to the country in which the reclamation site is located and is determined as the risk-free rate of borrowing approximated by the yield on sovereign debt for that country, with a maturity approximating the end of mine life. The periodic unwinding of the discount is recognized in the consolidated statement of operations as a finance expense.
NOTES TO THE CONSOLIDATED FINANCIAL STATEMENTS For the years ended December 31, 2014 and 2013 (Tabular amounts in millions of United States dollars)
FS19 KINROSS GOLD 2014 ANNUAL REPORT
xvii. Income tax
The income tax expense or benefit for the period consists of two components: current and deferred. Income tax expense is recognized in the consolidated statement of operations except to the extent it relates to a business combination or items recognized directly in equity.
Current tax is the expected tax payable or receivable on the taxable profit or loss for the year. Current tax is calculated using tax rates and laws that were enacted or substantively enacted at the balance sheet date in each of the jurisdictions and includes any adjustments for taxes payable or recovery in respect of prior periods.
Deferred tax is recognized in respect of temporary differences between the carrying amount of assets and liabilities in the consolidated balance sheet and the corresponding tax bases used in the computation of taxable profit. Deferred tax is calculated based on the expected manner of realization or settlement of the carrying amount of assets and liabilities, using tax rates that are expected to apply in the year of realization or settlement based on tax rates and laws enacted or substantively enacted at the balance sheet date.
Deferred tax liabilities are generally recognized for all taxable temporary differences. Deferred tax liabilities are recognized for taxable temporary differences arising on investments in subsidiaries, associates and joint ventures except where the reversal of the temporary difference can be controlled and it is probable that the difference will not reverse in the foreseeable future.
Deferred tax assets are recognized for all deductible temporary differences, carryforward of unused tax credits and unused tax losses to the extent it is probable future taxable profits will be available against which they can be utilized. The carrying amount of deferred tax assets is reviewed at each balance sheet date and reduced to the extent that it is no longer probable that sufficient taxable profits will be available to allow all or part of the asset to be recovered.
Deferred tax liabilities are not recognized on temporary differences that arise from goodwill which is not deductible for tax purposes. Deferred tax assets and liabilities are not recognized in respect of temporary differences that arise on initial recognition of assets and liabilities acquired other than in a business combination.
Deferred tax assets and liabilities are offset where they relate to income taxes levied by the same taxation authority and the Corporation has the legal right and intent to offset.
xviii. Earnings (loss) per share
Earnings (loss) per share calculations are based on the weighted average number of common shares and common share equivalents issued and outstanding during the period. Basic earnings (loss) per share amounts are calculated by dividing net earnings (loss) attributable to common shareholders for the period by the weighted average number of common shares outstanding during the period. Diluted earnings (loss) per share amounts are calculated by dividing net earnings (loss) attributable to common shareholders for the period by the diluted weighted average shares outstanding during the period.
Diluted earnings per share is calculated using the treasury method, except the if-converted method is used in assessing the dilution impact of convertible senior notes, outstanding stock options, warrants, RSUs and RPSUs. The treasury method, which assumes that outstanding stock options, warrants, RSUs and RPSUs with an average exercise price below the market price of the underlying shares, are exercised and the assumed proceeds are used to repurchase common shares of the Company at the average market price of the common shares for the period. The if-converted method assumes that all convertible senior notes, RSUs and RPSUs have been converted in determining fully diluted earnings per share if they are in-the-money except where such conversion would be anti-dilutive.
4. RECENT ACCOUNTING PRONOUNCEMENTS
Revenue recognition In May 2014, the IASB issued IFRS 15 “Revenue from Contracts with Customers” (“IFRS 15”). The standard replaces IAS 11 “Construction Contracts”, IAS 18 “Revenue”, IFRIC 13 “Customer Loyalty Programmes”, IFRIC 15 “Agreements for the Construction of Real Estate”, IFRIC 18 “Transfer of Assets From Customers” and SIC 31 “Revenue – Barter Transactions Involving Advertising Services”. IFRS 15 establishes principles for reporting the nature, amount, timing, and uncertainty of revenue and cash flows arising from an entity’s contract with customers. This standard is effective for annual periods beginning on or after January 1, 2017, and permits early adoption. The Company is in the process of determining the impact of IFRS 15 on its consolidated financial statements.
NOTES TO THE CONSOLIDATED FINANCIAL STATEMENTS For the years ended December 31, 2014 and 2013 (Tabular amounts in millions of United States dollars)
KINROSS GOLD 2014 ANNUAL REPORT FS20
Financial instruments In July 2014, the IASB issued the final version of IFRS 9 “Financial Instruments”. This standard is effective for annual periods beginning on or after January 1, 2018, and permits early adoption. IFRS 9 provides a revised model for recognition, measurement and impairment of financial instruments. IFRS 9 also includes a substantially reformed approach to hedge accounting. The Company is in the process of determining the impact of IFRS 9 on its consolidated financial statements.
5. SIGNIFICANT JUDGMENTS, ESTIMATES AND ASSUMPTIONS The preparation of the Company’s financial statements in conformity with IFRS requires management to make judgments, estimates and assumptions that affect the reported amounts of assets and liabilities and disclosures of contingent assets and liabilities at the date of the financial statements and the reported amounts of revenues and expenses during the reporting period. Estimates and assumptions are continually evaluated and are based on management’s experience and other factors, including expectations of future events that are believed to be reasonable under the circumstances. Actual results could differ from these estimates.
i. Significant Judgments in Applying Accounting Policies
The areas which require management to make significant judgments in applying the Company’s accounting policies in determining carrying values include, but are not limited to:
(a) Mineral reserves
The information relating to the geological data on the size, depth and shape of the ore body requires complex geological judgments to interpret the data. Changes in the proven and probable mineral reserves or measured and indicated and inferred mineral resources estimates may impact the carrying value of property, plant and equipment, goodwill, reclamation and remediation obligations, recognition of deferred tax amounts and depreciation, depletion and amortization.
(b) Depreciation, depletion and amortization
Significant judgment is involved in the determination of useful life and residual values for the computation of depreciation, depletion and amortization and no assurance can be given that actual useful lives and residual values will not differ significantly from current assumptions.
(c) Taxes
The Company is subject to income taxes in numerous jurisdictions. Significant judgment is required in determining the provision for income taxes, due to the complexity of legislation. There are many transactions and calculations for which the ultimate tax determination is uncertain during the ordinary course of business.
ii. Significant Accounting Estimates and Assumptions
The areas which require management to make significant estimates and assumptions in determining carrying values include, but are not limited to:
(a) Mineral reserves
Proven and probable mineral reserves are the economically mineable parts of the Company’s measured and indicated mineral resources demonstrated by at least a preliminary feasibility study. The Company estimates its proven and probable mineral reserves and measured and indicated and inferred mineral resources based on information compiled by appropriately qualified persons. The estimation of future cash flows related to proven and probable mineral reserves is based upon factors such as estimates of foreign exchange rates, commodity prices, future capital requirements and production costs along with geological assumptions and judgments made in estimating the size and grade of the ore body. Changes in the proven and probable mineral reserves or measured and indicated and inferred mineral resources estimates may impact the carrying value of property, plant and equipment, goodwill, reclamation and remediation obligations, recognition of deferred tax amounts and depreciation, depletion and amortization.
NOTES TO THE CONSOLIDATED FINANCIAL STATEMENTS For the years ended December 31, 2014 and 2013 (Tabular amounts in millions of United States dollars)
FS21 KINROSS GOLD 2014 ANNUAL REPORT
(b) Depreciation, depletion and amortization
Plants and other facilities used directly in mining activities are depreciated using the UOP method over a period not to exceed the estimated life of the ore body based on recoverable ounces to be mined from proven and probable reserves. Mobile and other equipment is depreciated, net of residual value, on a straight-line basis, over the useful life of the equipment but does not exceed the related estimated life of the mine based on proven and probable reserves.
The calculation of the UOP rate, and therefore the annual depreciation, depletion and amortization expense, could be materially affected by changes in the underlying estimates. Changes in estimates can be the result of actual future production differing from current forecasts of future production, expansion of mineral reserves through exploration activities, differences between estimated and actual costs of mining and differences in gold price used in the estimation of mineral reserves.
(c) Impairment of goodwill and other assets
Goodwill is tested for impairment annually or more frequently if there is an indication of impairment. The carrying value of property, plant and equipment is reviewed each reporting period to determine whether there is any indication of impairment. If the carrying amount of an asset exceeds its recoverable amount, the asset is impaired and an impairment loss is recognized in the consolidated statement of operations. The assessment of fair values, including those of the CGUs for purposes of testing goodwill, require the use of estimates and assumptions for recoverable production, future and long-term commodity prices, discount rates, NAV multiples, foreign exchange rates, future capital requirements and operating performance. Changes in any of the assumptions or estimates used in determining the fair value of goodwill or other assets could impact the impairment analysis. Impairment charges recognized against property, plant and equipment may be reversed if there are changes in the assumptions or estimates used in determining the recoverable amounts of the CGUs which indicate that a previously recognized impairment loss may no longer exist or may have decreased.
(d) Inventories
Expenditures incurred, and depreciation, depletion and amortization of assets used in mining and processing activities are deferred and accumulated as the cost of ore in stockpiles, ore on leach pads, in-process and finished metal inventories. These deferred amounts are carried at the lower of average cost or NRV. Write-downs of ore in stockpiles, ore on leach pads, in-process and finished metal inventories resulting from NRV impairments are reported as a component of current period costs. The primary factors that influence the need to record write-downs include prevailing and long-term metal prices and prevailing costs for production inputs such as labour, fuel and energy, materials and supplies, as well as realized ore grades and actual production levels.
Costs are attributed to the leach pads based on current mining costs, including applicable depreciation, depletion and amortization relating to mining operations incurred up to the point of placing the ore on the pad. Costs are removed from the leach pad based on the average cost per recoverable ounce of gold on the leach pad as the gold is recovered. Estimates of recoverable gold on the leach pads are calculated from the quantities of ore placed on the pads, the grade of ore placed on the leach pads and an estimated percentage of recovery. Timing and ultimate actual recovery of gold contained on leach pads can vary significantly from the estimates. The quantities of recoverable gold placed on the leach pads are reconciled to the quantities of gold actually recovered (metallurgical balancing), by comparing the grades of ore placed on the leach pads to actual ounces recovered. The nature of the leaching process inherently limits the ability to precisely monitor inventory levels. As a result, the metallurgical balancing process is constantly monitored and the engineering estimates are refined based on actual results over time. The ultimate actual recovery of gold from a pad will not be known until the leaching process is completed.
The allocation of costs to ore in stockpiles, ore on leach pads and in-process inventories and the determination of NRV involve the use of estimates. There is a high degree of judgment in estimating future costs, future production levels, proven and probable reserves estimates, gold and silver prices, and the ultimate estimated recovery for ore on leach pads. There can be no assurance that actual results will not differ significantly from estimates used in the determination of the carrying value of inventories.
NOTES TO THE CONSOLIDATED FINANCIAL STATEMENTS For the years ended December 31, 2014 and 2013 (Tabular amounts in millions of United States dollars)
KINROSS GOLD 2014 ANNUAL REPORT FS22
(e) Provision for reclamation and remediation
The Company assesses its provision for reclamation and remediation on an annual basis or when new material information becomes available. Mining and exploration activities are subject to various laws and regulations governing the protection of the environment. In general, these laws and regulations are continually changing and the Company has made, and intends to make in the future, expenditures to comply with such laws and regulations. Accounting for reclamation and remediation obligations requires management to make estimates of the future costs the Company will incur to complete the reclamation and remediation work required to comply with existing laws and regulations at each mining operation. Actual costs incurred may differ from those amounts estimated. Also, future changes to environmental laws and regulations could increase the extent of reclamation and remediation work required to be performed by the Company. Increases in future costs could materially impact the amounts charged to operations for reclamation and remediation. The provision represents management’s best estimate of the present value of the future reclamation and remediation obligation. The actual future expenditures may differ from the amounts currently provided.
(f) Deferred taxes
The Company recognizes the deferred tax benefit related to deferred income and resource tax assets to the extent recovery is probable. Assessing the recoverability of deferred income tax assets requires management to make significant estimates of future taxable profit. To the extent that future cash flows and taxable profit differ significantly from estimates, the ability of the Company to realize the net deferred tax assets recorded at the balance sheet date could be impacted. In addition, future changes in tax laws could limit the ability of the Company to obtain tax deductions in future periods from deferred income and resource tax assets.
(g) Contingencies
Due to the size, complexity and nature of the Company’s operations, various legal and tax matters are outstanding from time to time. Contingencies can be possible assets or liabilities arising from past events which, by their nature, will only be resolved when one or more future events not wholly within our control occur or fail to occur. The assessment of such contingencies involves the use of significant judgment and estimates. In the event that management’s estimate of the future resolution of these matters changes, the Company will recognize the effects of the changes in its consolidated financial statements on the date such changes occur.
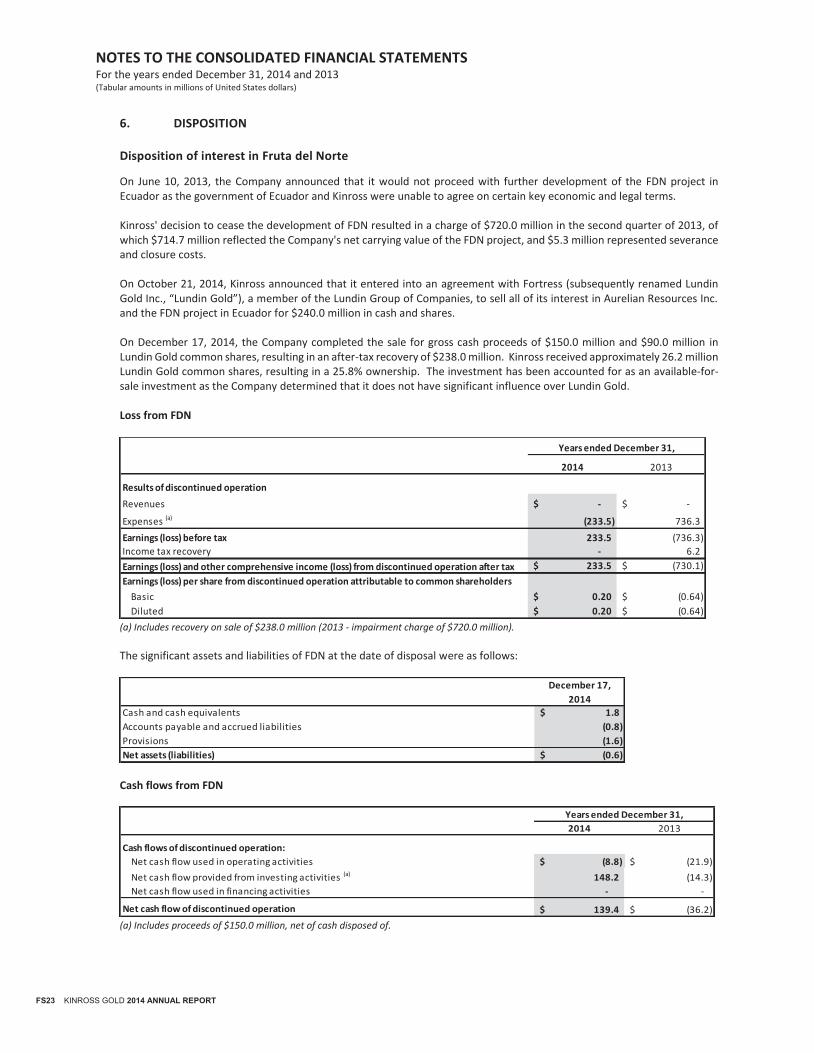
NOTES TO THE CONSOLIDATED FINANCIAL STATEMENTS For the years ended December 31, 2014 and 2013 (Tabular amounts in millions of United States dollars)
FS23 KINROSS GOLD 2014 ANNUAL REPORT
6. DISPOSITION
Disposition of interest in Fruta del Norte On June 10, 2013, the Company announced that it would not proceed with further development of the FDN project in Ecuador as the government of Ecuador and Kinross were unable to agree on certain key economic and legal terms. Kinross' decision to cease the development of FDN resulted in a charge of $720.0 million in the second quarter of 2013, of which $714.7 million reflected the Company's net carrying value of the FDN project, and $5.3 million represented severance and closure costs. On October 21, 2014, Kinross announced that it entered into an agreement with Fortress (subsequently renamed Lundin Gold Inc., “Lundin Gold”), a member of the Lundin Group of Companies, to sell all of its interest in Aurelian Resources Inc. and the FDN project in Ecuador for $240.0 million in cash and shares. On December 17, 2014, the Company completed the sale for gross cash proceeds of $150.0 million and $90.0 million in Lundin Gold common shares, resulting in an after-tax recovery of $238.0 million. Kinross received approximately 26.2 million Lundin Gold common shares, resulting in a 25.8% ownership. The investment has been accounted for as an available-for-sale investment as the Company determined that it does not have significant influence over Lundin Gold. Loss from FDN
(a) Includes recovery on sale of $238.0 million (2013 - impairment charge of $720.0 million).
The significant assets and liabilities of FDN at the date of disposal were as follows:
Cash flows from FDN
(a) Includes proceeds of $150.0 million, net of cash disposed of.
2014 2013
Results of discontinued operation
Revenues -$ -$
Expenses (a) (233.5) 736.3
Earnings (loss) before tax 233.5 (736.3)
Income tax recovery - 6.2
Earnings (loss) and other comprehensive income (loss) from discontinued operation after tax 233.5$ (730.1)$
Earnings (loss) per share from discontinued operation attributable to common shareholders
Basic 0.20$ (0.64)$
Diluted 0.20$ (0.64)$
Years ended December 31,
December 17,
2014
Cash and cash equivalents 1.8$
Accounts payable and accrued liabilities (0.8)
Provisions (1.6)
Net assets (liabilities) (0.6)$
2014 2013
Cash flows of discontinued operation:
Net cash flow used in operating activities (8.8)$ (21.9)$
Net cash flow provided from investing activities (a) 148.2 (14.3)
Net cash flow used in financing activities - -
Net cash flow of discontinued operation 139.4$ (36.2)$
Years ended December 31,
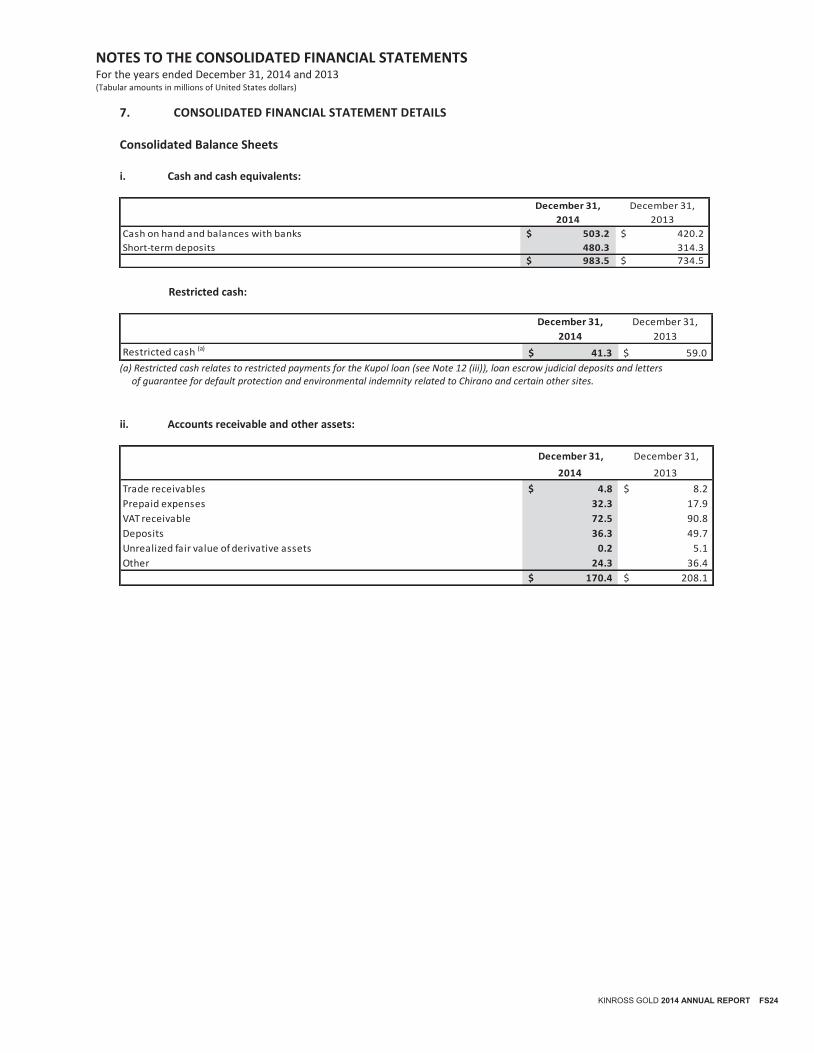
NOTES TO THE CONSOLIDATED FINANCIAL STATEMENTS For the years ended December 31, 2014 and 2013 (Tabular amounts in millions of United States dollars)
KINROSS GOLD 2014 ANNUAL REPORT FS24
7. CONSOLIDATED FINANCIAL STATEMENT DETAILS Consolidated Balance Sheets i. Cash and cash equivalents:
Restricted cash:
(a) Restricted cash relates to restricted payments for the Kupol loan (see Note 12 (iii)), loan escrow judicial deposits and letters of guarantee for default protection and environmental indemnity related to Chirano and certain other sites.
ii. Accounts receivable and other assets:
December 31, December 31,
2014 2013
Cash on hand and balances with banks 503.2$ 420.2$
Short-term deposits 480.3 314.3
983.5$ 734.5$
December 31, December 31,
2014 2013
Restricted cash (a)41.3$ 59.0$
December 31, December 31,
2014 2013
Trade receivables 4.8$ 8.2$
Prepaid expenses 32.3 17.9
VAT receivable 72.5 90.8
Deposits 36.3 49.7
Unrealized fair value of derivative assets 0.2 5.1
Other 24.3 36.4
170.4$ 208.1$
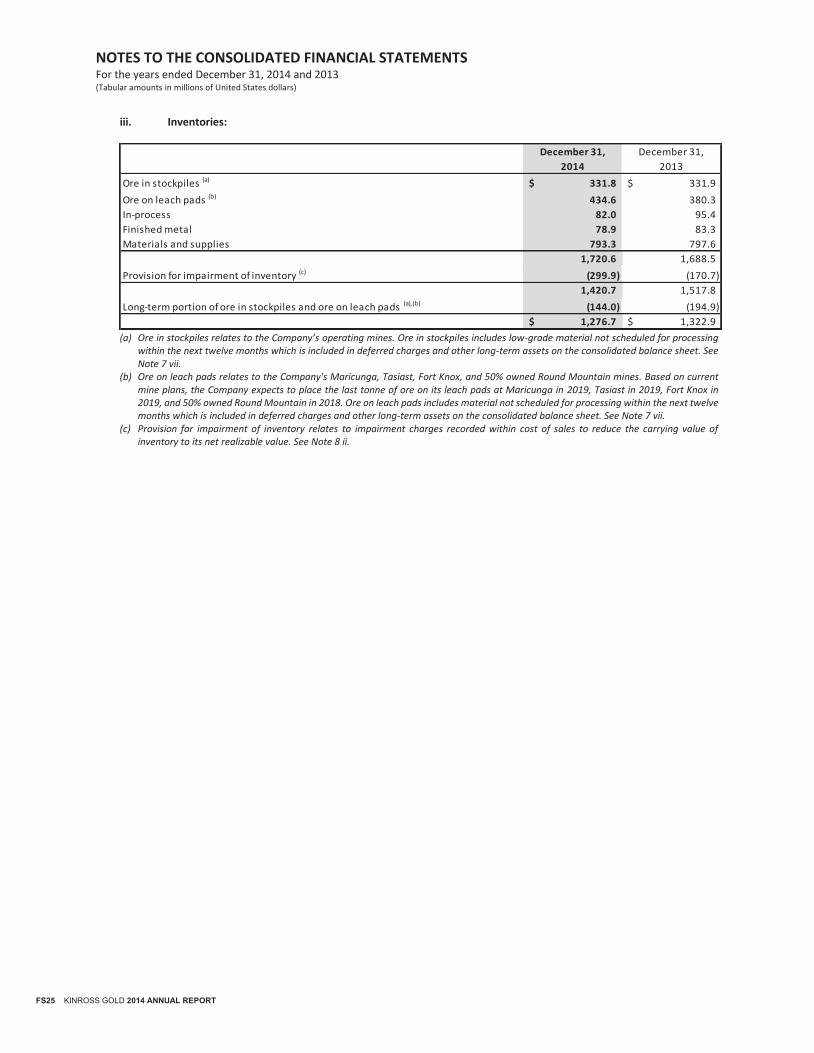
NOTES TO THE CONSOLIDATED FINANCIAL STATEMENTS For the years ended December 31, 2014 and 2013 (Tabular amounts in millions of United States dollars)
FS25 KINROSS GOLD 2014 ANNUAL REPORT
iii. Inventories:
(a) Ore in stockpiles relates to the Company’s operating mines. Ore in stockpiles includes low-grade material not scheduled for processing
within the next twelve months which is included in deferred charges and other long-term assets on the consolidated balance sheet. See Note 7 vii.
(b) Ore on leach pads relates to the Company's Maricunga, Tasiast, Fort Knox, and 50% owned Round Mountain mines. Based on current mine plans, the Company expects to place the last tonne of ore on its leach pads at Maricunga in 2019, Tasiast in 2019, Fort Knox in 2019, and 50% owned Round Mountain in 2018. Ore on leach pads includes material not scheduled for processing within the next twelve months which is included in deferred charges and other long-term assets on the consolidated balance sheet. See Note 7 vii.
(c) Provision for impairment of inventory relates to impairment charges recorded within cost of sales to reduce the carrying value of inventory to its net realizable value. See Note 8 ii.
December 31, December 31,
2014 2013
Ore in stockpiles (a) 331.8$ 331.9$
Ore on leach pads (b) 434.6 380.3
In-process 82.0 95.4
Finished metal 78.9 83.3
Materials and supplies 793.3 797.6
1,720.6 1,688.5
Provision for impairment of inventory (c) (299.9) (170.7)
1,420.7 1,517.8
Long-term portion of ore in stockpiles and ore on leach pads (a),(b) (144.0) (194.9)
1,276.7$ 1,322.9$
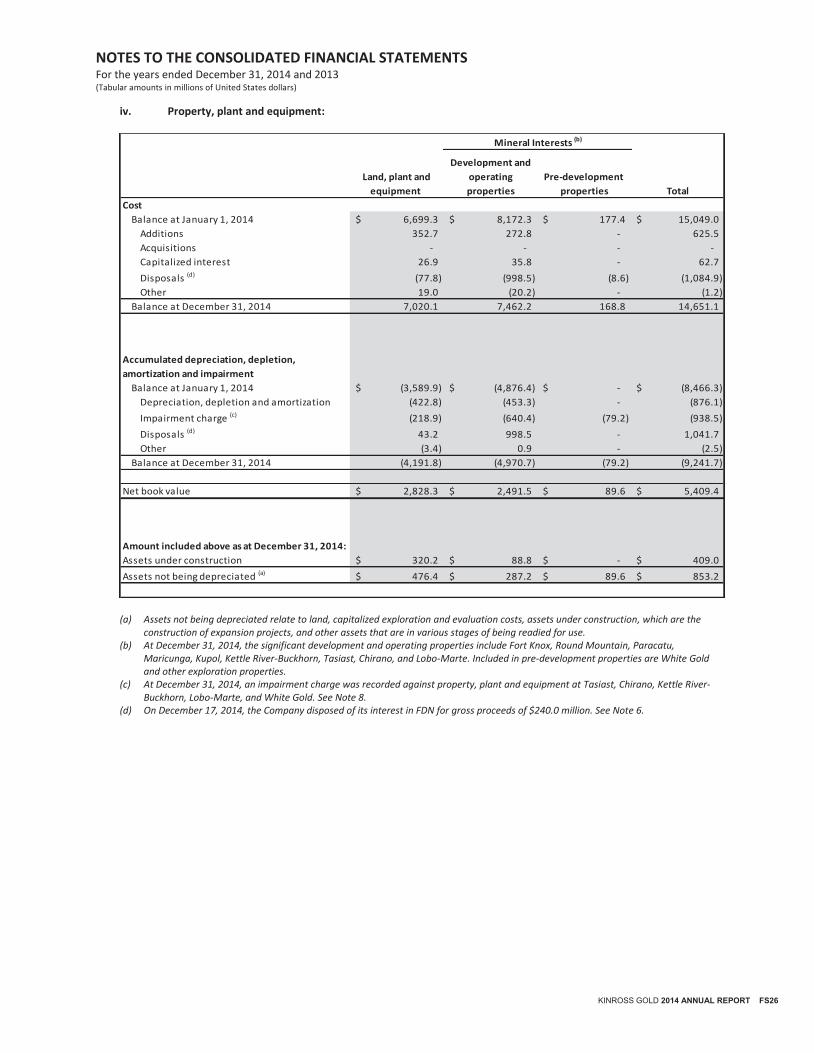
NOTES TO THE CONSOLIDATED FINANCIAL STATEMENTS For the years ended December 31, 2014 and 2013 (Tabular amounts in millions of United States dollars)
KINROSS GOLD 2014 ANNUAL REPORT FS26
iv. Property, plant and equipment:
(a) Assets not being depreciated relate to land, capitalized exploration and evaluation costs, assets under construction, which are the construction of expansion projects, and other assets that are in various stages of being readied for use.
(b) At December 31, 2014, the significant development and operating properties include Fort Knox, Round Mountain, Paracatu, Maricunga, Kupol, Kettle River-Buckhorn, Tasiast, Chirano, and Lobo-Marte. Included in pre-development properties are White Gold and other exploration properties.
(c) At December 31, 2014, an impairment charge was recorded against property, plant and equipment at Tasiast, Chirano, Kettle River-Buckhorn, Lobo-Marte, and White Gold. See Note 8.
(d) On December 17, 2014, the Company disposed of its interest in FDN for gross proceeds of $240.0 million. See Note 6.
Land, plant and
equipment
Development and
operating
properties
Pre-development
properties Total
Cost
Balance at January 1, 2014 6,699.3$ 8,172.3$ 177.4$ 15,049.0$
Additions 352.7 272.8 - 625.5
Acquisitions - - - -
Capitalized interest 26.9 35.8 - 62.7
Disposals (d) (77.8) (998.5) (8.6) (1,084.9)
Other 19.0 (20.2) - (1.2)
Balance at December 31, 2014 7,020.1 7,462.2 168.8 14,651.1
Accumulated depreciation, depletion,
amortization and impairment
Balance at January 1, 2014 (3,589.9)$ (4,876.4)$ -$ (8,466.3)$
Depreciation, depletion and amortization (422.8) (453.3) - (876.1)
Impairment charge (c) (218.9) (640.4) (79.2) (938.5)
Disposals (d) 43.2 998.5 - 1,041.7
Other (3.4) 0.9 - (2.5)
Balance at December 31, 2014 (4,191.8) (4,970.7) (79.2) (9,241.7)
Net book value 2,828.3$ 2,491.5$ 89.6$ 5,409.4$
Amount included above as at December 31, 2014:
Assets under construction 320.2$ 88.8$ -$ 409.0$
Assets not being depreciated (a) 476.4$ 287.2$ 89.6$ 853.2$
Mineral Interests (b)
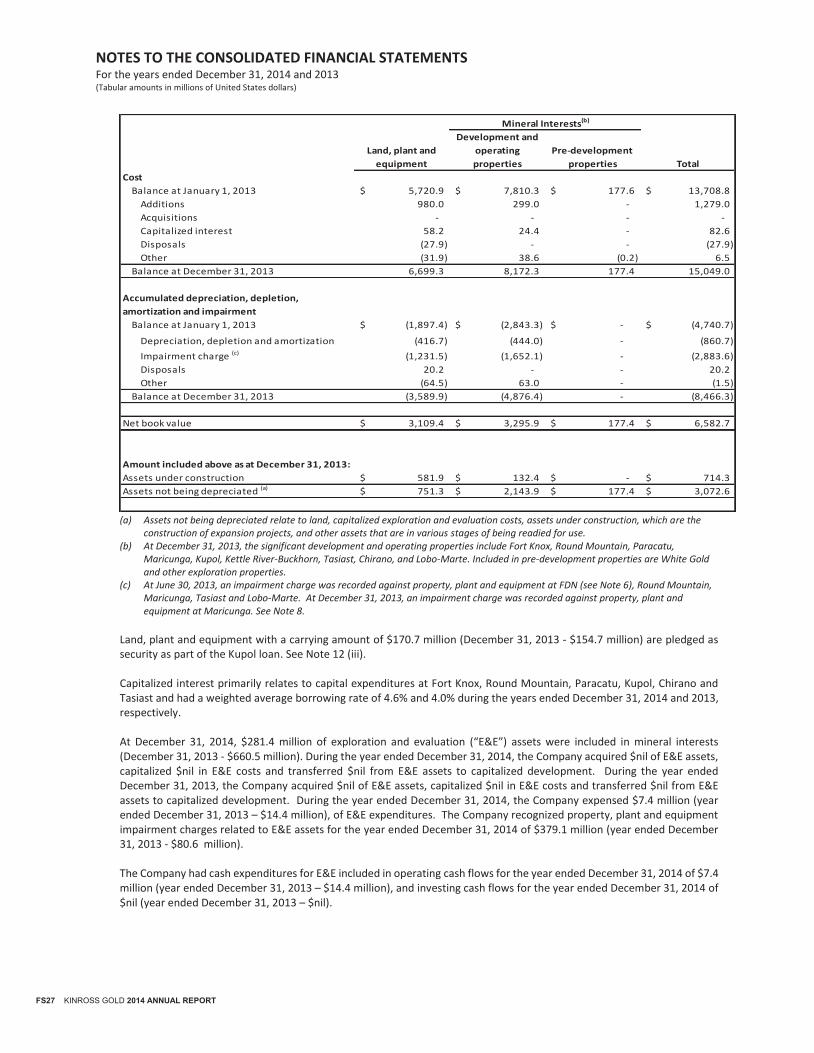
NOTES TO THE CONSOLIDATED FINANCIAL STATEMENTS For the years ended December 31, 2014 and 2013 (Tabular amounts in millions of United States dollars)
FS27 KINROSS GOLD 2014 ANNUAL REPORT
(a) Assets not being depreciated relate to land, capitalized exploration and evaluation costs, assets under construction, which are the
construction of expansion projects, and other assets that are in various stages of being readied for use. (b) At December 31, 2013, the significant development and operating properties include Fort Knox, Round Mountain, Paracatu,
Maricunga, Kupol, Kettle River-Buckhorn, Tasiast, Chirano, and Lobo-Marte. Included in pre-development properties are White Gold and other exploration properties.
(c) At June 30, 2013, an impairment charge was recorded against property, plant and equipment at FDN (see Note 6), Round Mountain, Maricunga, Tasiast and Lobo-Marte. At December 31, 2013, an impairment charge was recorded against property, plant and equipment at Maricunga. See Note 8.
Land, plant and equipment with a carrying amount of $170.7 million (December 31, 2013 - $154.7 million) are pledged as security as part of the Kupol loan. See Note 12 (iii). Capitalized interest primarily relates to capital expenditures at Fort Knox, Round Mountain, Paracatu, Kupol, Chirano and Tasiast and had a weighted average borrowing rate of 4.6% and 4.0% during the years ended December 31, 2014 and 2013, respectively. At December 31, 2014, $281.4 million of exploration and evaluation (“E&E”) assets were included in mineral interests (December 31, 2013 - $660.5 million). During the year ended December 31, 2014, the Company acquired $nil of E&E assets, capitalized $nil in E&E costs and transferred $nil from E&E assets to capitalized development. During the year ended December 31, 2013, the Company acquired $nil of E&E assets, capitalized $nil in E&E costs and transferred $nil from E&E assets to capitalized development. During the year ended December 31, 2014, the Company expensed $7.4 million (year ended December 31, 2013 – $14.4 million), of E&E expenditures. The Company recognized property, plant and equipment impairment charges related to E&E assets for the year ended December 31, 2014 of $379.1 million (year ended December 31, 2013 - $80.6 million). The Company had cash expenditures for E&E included in operating cash flows for the year ended December 31, 2014 of $7.4 million (year ended December 31, 2013 – $14.4 million), and investing cash flows for the year ended December 31, 2014 of $nil (year ended December 31, 2013 – $nil).
Land, plant and
equipment
Development and
operating
properties
Pre-development
properties Total
Cost
Balance at January 1, 2013 5,720.9$ 7,810.3$ 177.6$ 13,708.8$
Additions 980.0 299.0 - 1,279.0
Acquisitions - - - -
Capitalized interest 58.2 24.4 - 82.6
Disposals (27.9) - - (27.9)
Other (31.9) 38.6 (0.2) 6.5
Balance at December 31, 2013 6,699.3 8,172.3 177.4 15,049.0
Accumulated depreciation, depletion,
amortization and impairment
Balance at January 1, 2013 (1,897.4)$ (2,843.3)$ -$ (4,740.7)$
Depreciation, depletion and amortization (416.7) (444.0) - (860.7)
Impairment charge (c) (1,231.5) (1,652.1) - (2,883.6)
Disposals 20.2 - - 20.2
Other (64.5) 63.0 - (1.5)
Balance at December 31, 2013 (3,589.9) (4,876.4) - (8,466.3)
Net book value 3,109.4$ 3,295.9$ 177.4$ 6,582.7$
Amount included above as at December 31, 2013:
Assets under construction 581.9$ 132.4$ -$ 714.3$
Assets not being depreciated (a) 751.3$ 2,143.9$ 177.4$ 3,072.6$
Mineral Interests(b)
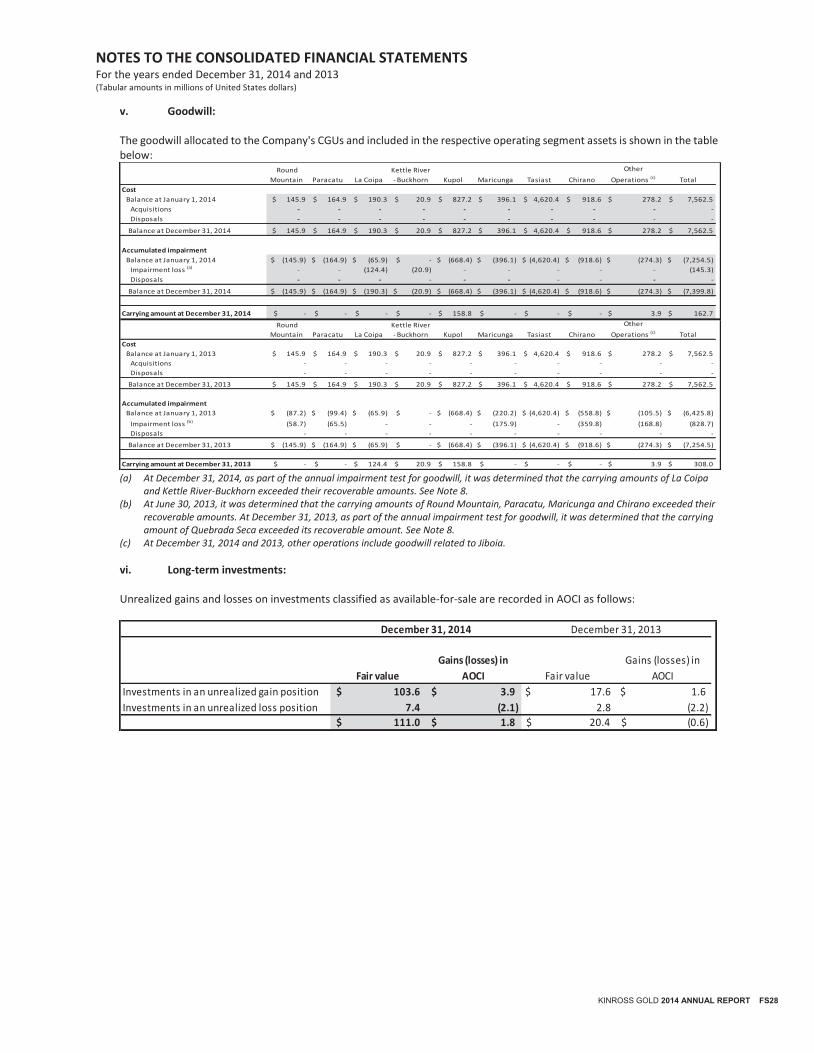
NOTES TO THE CONSOLIDATED FINANCIAL STATEMENTS For the years ended December 31, 2014 and 2013 (Tabular amounts in millions of United States dollars)
KINROSS GOLD 2014 ANNUAL REPORT FS28
v. Goodwill: The goodwill allocated to the Company's CGUs and included in the respective operating segment assets is shown in the table below:
(a) At December 31, 2014, as part of the annual impairment test for goodwill, it was determined that the carrying amounts of La Coipa
and Kettle River-Buckhorn exceeded their recoverable amounts. See Note 8. (b) At June 30, 2013, it was determined that the carrying amounts of Round Mountain, Paracatu, Maricunga and Chirano exceeded their
recoverable amounts. At December 31, 2013, as part of the annual impairment test for goodwill, it was determined that the carrying amount of Quebrada Seca exceeded its recoverable amount. See Note 8.
(c) At December 31, 2014 and 2013, other operations include goodwill related to Jiboia.
vi. Long-term investments: Unrealized gains and losses on investments classified as available-for-sale are recorded in AOCI as follows:
Tasiast Chirano
Cost
Balance at January 1, 2014 $ 145.9 $ 164.9 $ 190.3 $ 20.9 $ 827.2 $ 396.1 $ 4,620.4 $ 918.6 $ 278.2 $ 7,562.5
Acquisitions - - - - - - - - - -
Disposals - - - - - - - - - -
Balance at December 31, 2014 $ 145.9 $ 164.9 $ 190.3 $ 20.9 $ 827.2 $ 396.1 $ 4,620.4 $ 918.6 $ 278.2 $ 7,562.5
Accumulated impairment
Balance at January 1, 2014 $ (145.9) $ (164.9) $ (65.9) $ - $ (668.4) $ (396.1) $ (4,620.4) $ (918.6) $ (274.3) $ (7,254.5)
Impairment loss (a) - - (124.4) (20.9) - - - - - (145.3)
Disposals - - - - - - - - - -
Balance at December 31, 2014 $ (145.9) $ (164.9) $ (190.3) $ (20.9) $ (668.4) $ (396.1) $ (4,620.4) $ (918.6) $ (274.3) $ (7,399.8)
Carrying amount at December 31, 2014 $ - $ - $ - $ - $ 158.8 $ - $ - $ - $ 3.9 $ 162.7
Total
Round
Mountain Paracatu La Coipa
Kettle River
- Buckhorn Kupol Maricunga
Other
Operations (c)
Tasiast Chirano
Cost
Balance at January 1, 2013 $ 145.9 $ 164.9 $ 190.3 $ 20.9 $ 827.2 $ 396.1 $ 4,620.4 $ 918.6 $ 278.2 $ 7,562.5
Acquisitions - - - - - - - - - -
Disposals - - - - - - - - - -
Balance at December 31, 2013 $ 145.9 $ 164.9 $ 190.3 $ 20.9 $ 827.2 $ 396.1 $ 4,620.4 $ 918.6 $ 278.2 $ 7,562.5
Accumulated impairment
Balance at January 1, 2013 $ (87.2) $ (99.4) $ (65.9) $ - $ (668.4) $ (220.2) $ (4,620.4) $ (558.8) $ (105.5) $ (6,425.8)
Impairment loss (b) (58.7) (65.5) - - - (175.9) - (359.8) (168.8) (828.7)
Disposals - - - - - - - - - -
Balance at December 31, 2013 $ (145.9) $ (164.9) $ (65.9) $ - $ (668.4) $ (396.1) $ (4,620.4) $ (918.6) $ (274.3) $ (7,254.5)
Carrying amount at December 31, 2013 $ - $ - $ 124.4 $ 20.9 $ 158.8 $ - $ - $ - $ 3.9 $ 308.0
Total
Kettle River
- Buckhorn Kupol Maricunga
Other
Operations (c)
Round
Mountain Paracatu La Coipa
Fair value
Gains (losses) in
AOCI Fair value
Gains (losses) in
AOCI
Investments in an unrealized gain position 103.6$ 3.9$ $ 17.6 $ 1.6
Investments in an unrealized loss position 7.4 (2.1) 2.8 (2.2)
111.0$ 1.8$ 20.4$ (0.6)$
December 31, 2014 December 31, 2013
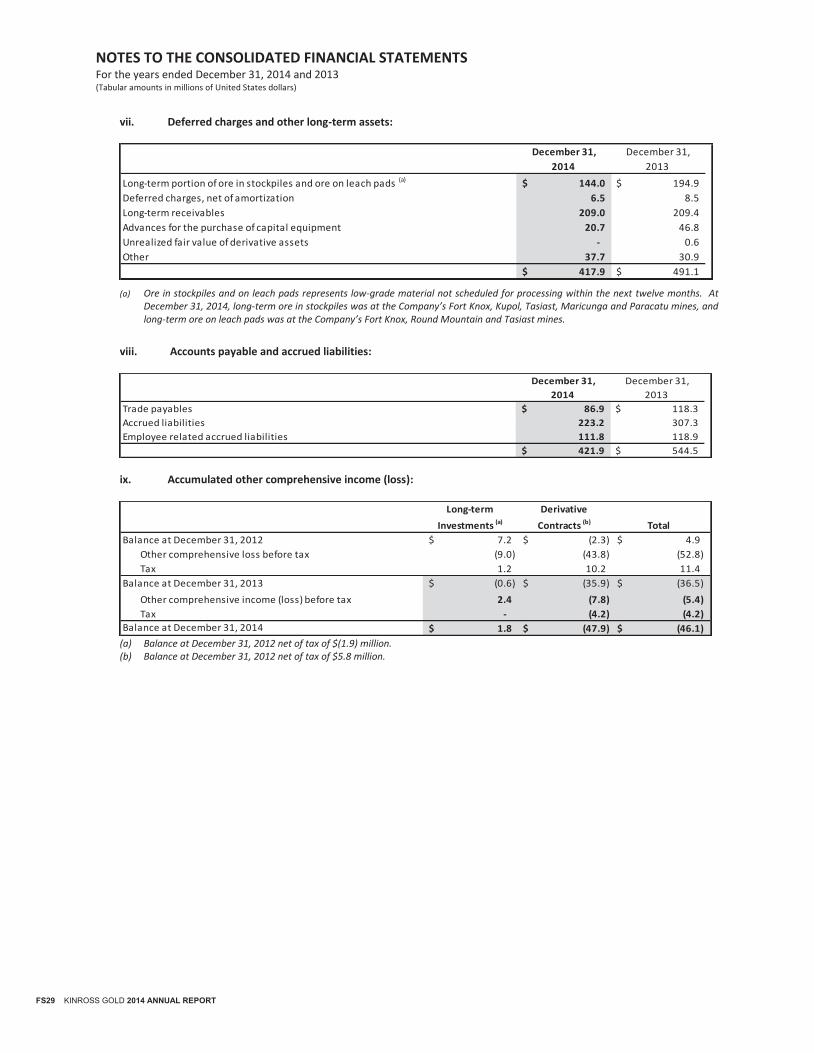
NOTES TO THE CONSOLIDATED FINANCIAL STATEMENTS For the years ended December 31, 2014 and 2013 (Tabular amounts in millions of United States dollars)
FS29 KINROSS GOLD 2014 ANNUAL REPORT
vii. Deferred charges and other long-term assets:
(a) Ore in stockpiles and on leach pads represents low-grade material not scheduled for processing within the next twelve months. At December 31, 2014, long-term ore in stockpiles was at the Company’s Fort Knox, Kupol, Tasiast, Maricunga and Paracatu mines, and long-term ore on leach pads was at the Company’s Fort Knox, Round Mountain and Tasiast mines.
viii. Accounts payable and accrued liabilities:
ix. Accumulated other comprehensive income (loss):
(a) Balance at December 31, 2012 net of tax of $(1.9) million. (b) Balance at December 31, 2012 net of tax of $5.8 million.
December 31, December 31,
2014 2013
Long-term portion of ore in stockpiles and ore on leach pads (a) 144.0$ 194.9$
Deferred charges, net of amortization 6.5 8.5
Long-term receivables 209.0 209.4
Advances for the purchase of capital equipment 20.7 46.8
Unrealized fair value of derivative assets - 0.6
Other 37.7 30.9
417.9$ 491.1$
December 31, December 31,
2014 2013
Trade payables 86.9$ 118.3$
Accrued liabilities 223.2 307.3
Employee related accrued liabilities 111.8 118.9
421.9$ 544.5$
Long-term
Investments (a)
Derivative
Contracts (b) Total
Balance at December 31, 2012 7.2$ (2.3)$ 4.9$
Other comprehensive loss before tax (9.0) (43.8) (52.8)
Tax 1.2 10.2 11.4
Balance at December 31, 2013 (0.6)$ (35.9)$ (36.5)$
Other comprehensive income (loss) before tax 2.4 (7.8) (5.4)
Tax - (4.2) (4.2)
Balance at December 31, 2014 1.8$ (47.9)$ (46.1)$
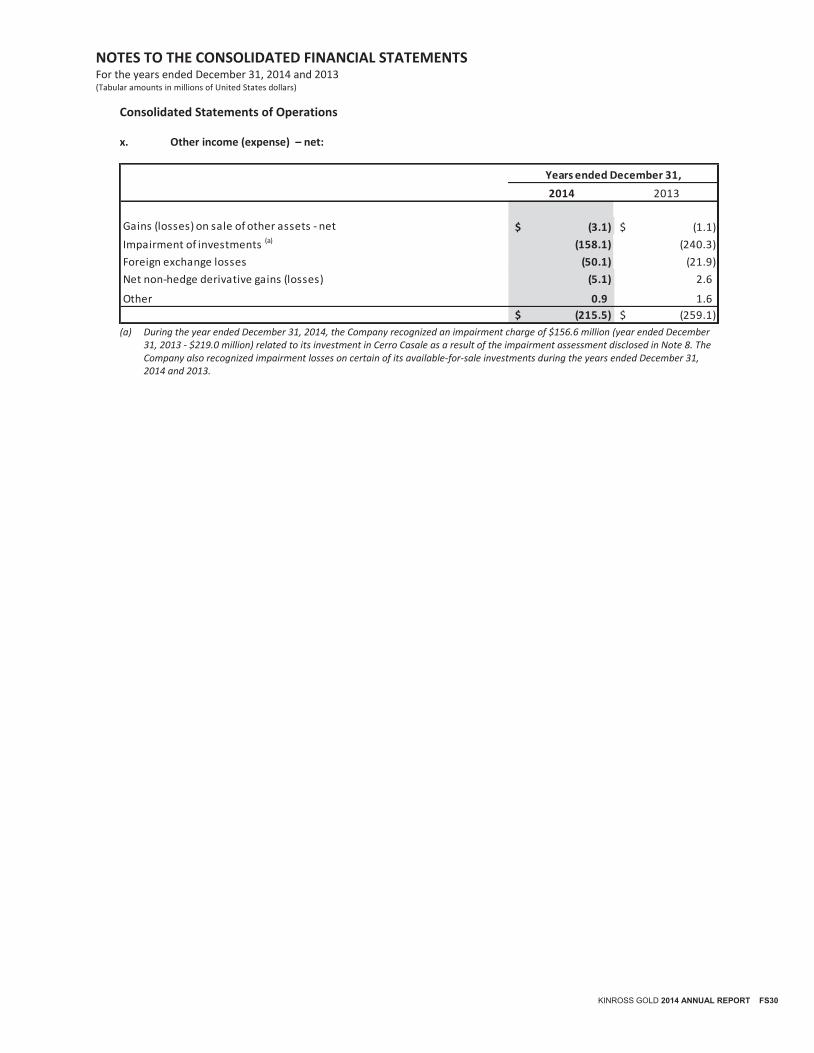
NOTES TO THE CONSOLIDATED FINANCIAL STATEMENTS For the years ended December 31, 2014 and 2013 (Tabular amounts in millions of United States dollars)
KINROSS GOLD 2014 ANNUAL REPORT FS30
Consolidated Statements of Operations x. Other income (expense) – net:
(a) During the year ended December 31, 2014, the Company recognized an impairment charge of $156.6 million (year ended December
31, 2013 - $219.0 million) related to its investment in Cerro Casale as a result of the impairment assessment disclosed in Note 8. The Company also recognized impairment losses on certain of its available-for-sale investments during the years ended December 31, 2014 and 2013.
2014 2013
Gains (losses) on sale of other assets - net (3.1)$ (1.1)$
Impairment of investments (a) (158.1) (240.3)
Foreign exchange losses (50.1) (21.9)
Net non-hedge derivative gains (losses) (5.1) 2.6
Other 0.9 1.6
(215.5)$ (259.1)$
Years ended December 31,

NOTES TO THE CONSOLIDATED FINANCIAL STATEMENTS For the years ended December 31, 2014 and 2013 (Tabular amounts in millions of United States dollars)
FS31 KINROSS GOLD 2014 ANNUAL REPORT
xi. Equity in earnings (losses) of associate and joint venture:
(a) The Company holds a 25% interest in Cerro Casale which is classified as an investment in associate and accounted for under the
equity method. See Note 9. (b) Puren is classified as a joint venture and is accounted for under the equity method. (c) Represents Kinross’ share of the net earnings (loss) and other comprehensive income (loss).
xii. Finance expense:
(a) During the years ended December 31, 2014 and 2013, $62.7 million and $82.6 million, respectively, of interest was capitalized to
property, plant and equipment. See Note 7 iv.
Total interest paid, including interest capitalized, during the year ended December 31, 2014 was $82.4 million (year ended December 31, 2013 - $80.1 million). xiii. Employee benefits expenses: The following employee benefits expenses are included in production cost of sales, general and administrative, and exploration and business development expenses:
2014 2013
Cerro Casale (a)(c) (5.4)$ (7.5)$
Puren (b)(c) (0.4) (2.8)
(5.8)$ (10.3)$
Years ended December 31,
2014 2013
Accretion on reclamation and remediation obligation (28.1)$ (17.7)$
Interest expense, including accretion on debt (a) (52.0) (25.1)
(80.1)$ (42.8)$
Years ended December 31,
2014 2013
Salaries, short term incentives, and other benefits 659.5$ 653.7$
Share-based payments 32.3 32.9
Other 30.2 75.3
722.0$ 761.9$
Years ended December 31,
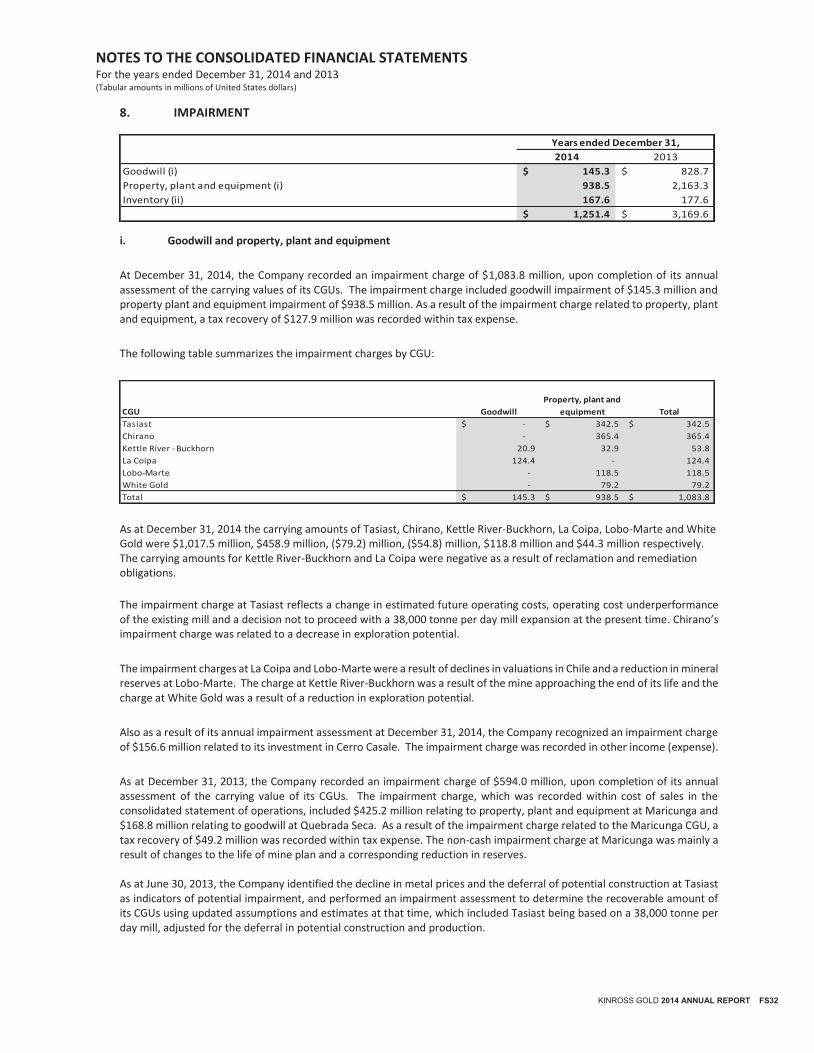
NOTES TO THE CONSOLIDATED FINANCIAL STATEMENTS For the years ended December 31, 2014 and 2013 (Tabular amounts in millions of United States dollars)
KINROSS GOLD 2014 ANNUAL REPORT FS32
8. IMPAIRMENT
i. Goodwill and property, plant and equipment
At December 31, 2014, the Company recorded an impairment charge of $1,083.8 million, upon completion of its annual assessment of the carrying values of its CGUs. The impairment charge included goodwill impairment of $145.3 million and property plant and equipment impairment of $938.5 million. As a result of the impairment charge related to property, plant and equipment, a tax recovery of $127.9 million was recorded within tax expense.
The following table summarizes the impairment charges by CGU:
As at December 31, 2014 the carrying amounts of Tasiast, Chirano, Kettle River-Buckhorn, La Coipa, Lobo-Marte and White Gold were $1,017.5 million, $458.9 million, ($79.2) million, ($54.8) million, $118.8 million and $44.3 million respectively. The carrying amounts for Kettle River-Buckhorn and La Coipa were negative as a result of reclamation and remediation obligations.
The impairment charge at Tasiast reflects a change in estimated future operating costs, operating cost underperformance of the existing mill and a decision not to proceed with a 38,000 tonne per day mill expansion at the present time. Chirano’s impairment charge was related to a decrease in exploration potential.
The impairment charges at La Coipa and Lobo-Marte were a result of declines in valuations in Chile and a reduction in mineral reserves at Lobo-Marte. The charge at Kettle River-Buckhorn was a result of the mine approaching the end of its life and the charge at White Gold was a result of a reduction in exploration potential.
Also as a result of its annual impairment assessment at December 31, 2014, the Company recognized an impairment charge of $156.6 million related to its investment in Cerro Casale. The impairment charge was recorded in other income (expense).
As at December 31, 2013, the Company recorded an impairment charge of $594.0 million, upon completion of its annual assessment of the carrying value of its CGUs. The impairment charge, which was recorded within cost of sales in the consolidated statement of operations, included $425.2 million relating to property, plant and equipment at Maricunga and $168.8 million relating to goodwill at Quebrada Seca. As a result of the impairment charge related to the Maricunga CGU, a tax recovery of $49.2 million was recorded within tax expense. The non-cash impairment charge at Maricunga was mainly a result of changes to the life of mine plan and a corresponding reduction in reserves. As at June 30, 2013, the Company identified the decline in metal prices and the deferral of potential construction at Tasiast as indicators of potential impairment, and performed an impairment assessment to determine the recoverable amount of its CGUs using updated assumptions and estimates at that time, which included Tasiast being based on a 38,000 tonne per day mill, adjusted for the deferral in potential construction and production.
2014 2013
Goodwill (i) 145.3$ 828.7$
Property, plant and equipment (i) 938.5 2,163.3
Inventory (ii) 167.6 177.6
1,251.4$ 3,169.6$
Years ended December 31,
CGU Goodwill
Property, plant and
equipment Total
Tasiast -$ 342.5$ 342.5$
Chirano - 365.4 365.4
Kettle River - Buckhorn 20.9 32.9 53.8
La Coipa 124.4 - 124.4
Lobo-Marte - 118.5 118.5
White Gold - 79.2 79.2
Total 145.3$ 938.5$ 1,083.8$
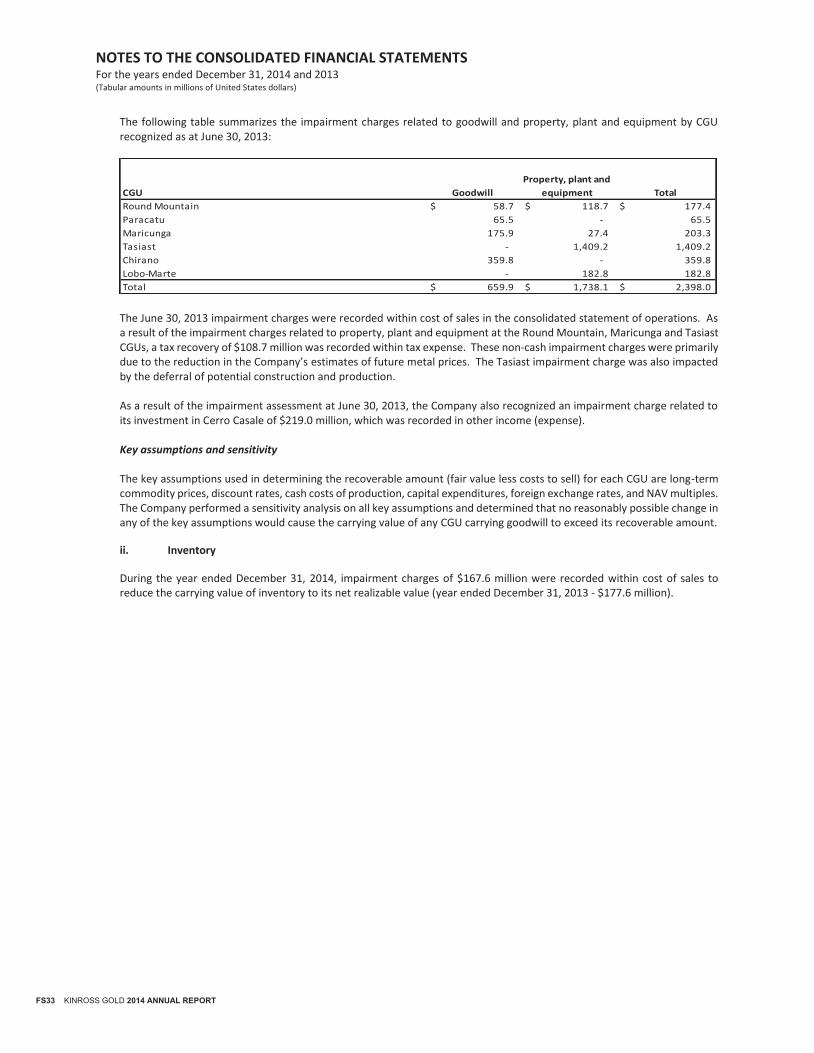
NOTES TO THE CONSOLIDATED FINANCIAL STATEMENTS For the years ended December 31, 2014 and 2013 (Tabular amounts in millions of United States dollars)
FS33 KINROSS GOLD 2014 ANNUAL REPORT
The following table summarizes the impairment charges related to goodwill and property, plant and equipment by CGU recognized as at June 30, 2013:
The June 30, 2013 impairment charges were recorded within cost of sales in the consolidated statement of operations. As a result of the impairment charges related to property, plant and equipment at the Round Mountain, Maricunga and Tasiast CGUs, a tax recovery of $108.7 million was recorded within tax expense. These non-cash impairment charges were primarily due to the reduction in the Company’s estimates of future metal prices. The Tasiast impairment charge was also impacted by the deferral of potential construction and production. As a result of the impairment assessment at June 30, 2013, the Company also recognized an impairment charge related to its investment in Cerro Casale of $219.0 million, which was recorded in other income (expense). Key assumptions and sensitivity The key assumptions used in determining the recoverable amount (fair value less costs to sell) for each CGU are long-term commodity prices, discount rates, cash costs of production, capital expenditures, foreign exchange rates, and NAV multiples. The Company performed a sensitivity analysis on all key assumptions and determined that no reasonably possible change in any of the key assumptions would cause the carrying value of any CGU carrying goodwill to exceed its recoverable amount.
ii. Inventory
During the year ended December 31, 2014, impairment charges of $167.6 million were recorded within cost of sales to reduce the carrying value of inventory to its net realizable value (year ended December 31, 2013 - $177.6 million).
CGU Goodwill
Property, plant and
equipment Total
Round Mountain 58.7$ 118.7$ 177.4$
Paracatu 65.5 - 65.5
Maricunga 175.9 27.4 203.3
Tasiast - 1,409.2 1,409.2
Chirano 359.8 - 359.8
Lobo-Marte - 182.8 182.8
Total 659.9$ 1,738.1$ 2,398.0$
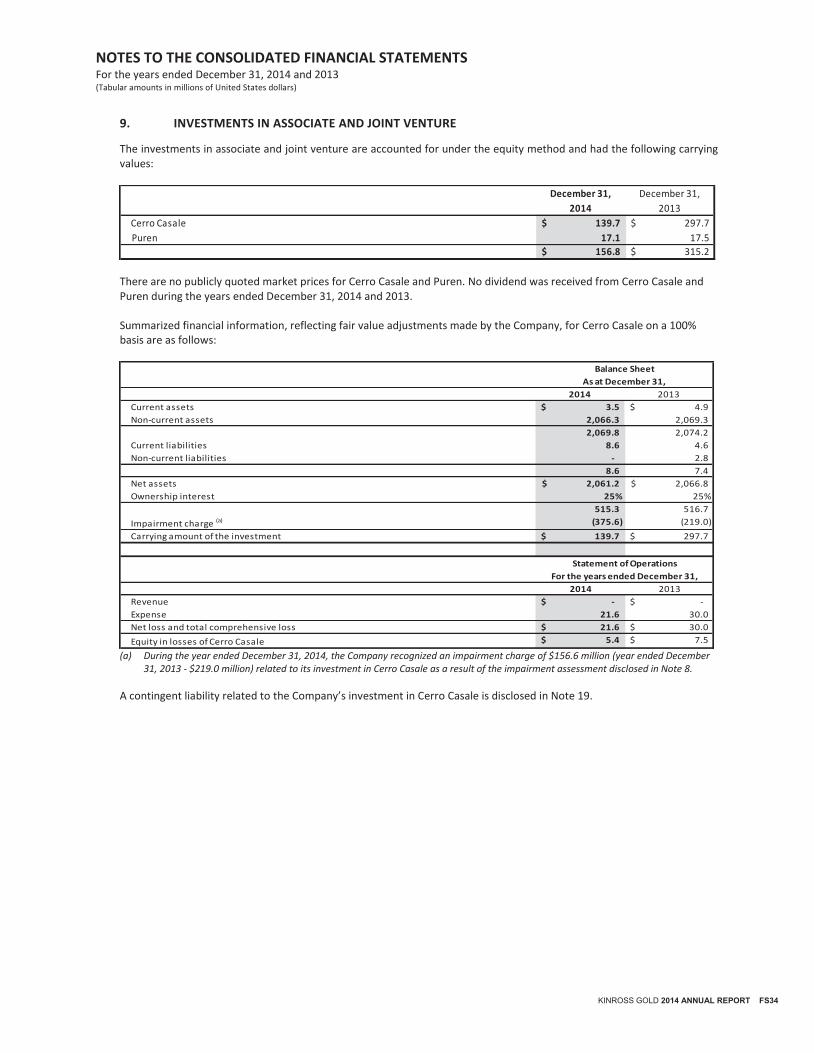
NOTES TO THE CONSOLIDATED FINANCIAL STATEMENTS For the years ended December 31, 2014 and 2013 (Tabular amounts in millions of United States dollars)
KINROSS GOLD 2014 ANNUAL REPORT FS34
9. INVESTMENTS IN ASSOCIATE AND JOINT VENTURE
The investments in associate and joint venture are accounted for under the equity method and had the following carrying values:
There are no publicly quoted market prices for Cerro Casale and Puren. No dividend was received from Cerro Casale and Puren during the years ended December 31, 2014 and 2013.
Summarized financial information, reflecting fair value adjustments made by the Company, for Cerro Casale on a 100% basis are as follows:
(a) During the year ended December 31, 2014, the Company recognized an impairment charge of $156.6 million (year ended December
31, 2013 - $219.0 million) related to its investment in Cerro Casale as a result of the impairment assessment disclosed in Note 8.
A contingent liability related to the Company’s investment in Cerro Casale is disclosed in Note 19.
December 31, December 31,
2014 2013
Cerro Casale 139.7$ 297.7$
Puren 17.1 17.5
156.8$ 315.2$
2014 2013
Current assets 3.5$ 4.9$
Non-current assets 2,066.3 2,069.3
2,069.8 2,074.2
Current liabilities 8.6 4.6
Non-current liabilities - 2.8
8.6 7.4
Net assets 2,061.2$ 2,066.8$
Ownership interest 25% 25%
515.3 516.7
Impairment charge (a) (375.6) (219.0)
Carrying amount of the investment 139.7$ 297.7$
2014 2013
Revenue -$ -$
Expense 21.6 30.0
21.6$ 30.0$
Equity in losses of Cerro Casale 5.4$ 7.5$
For the years ended December 31,
As at December 31,
Statement of Operations
Balance Sheet
Net loss and total comprehensive loss
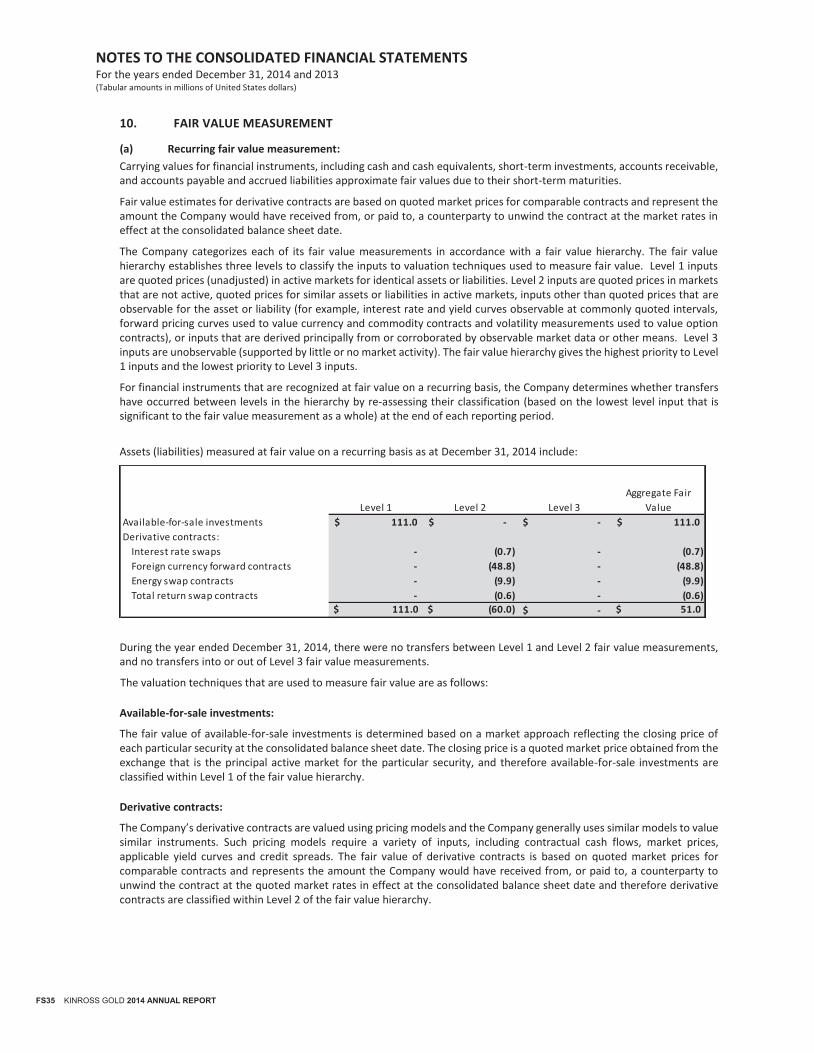
NOTES TO THE CONSOLIDATED FINANCIAL STATEMENTS For the years ended December 31, 2014 and 2013 (Tabular amounts in millions of United States dollars)
FS35 KINROSS GOLD 2014 ANNUAL REPORT
10. FAIR VALUE MEASUREMENT
(a) Recurring fair value measurement:
Carrying values for financial instruments, including cash and cash equivalents, short-term investments, accounts receivable, and accounts payable and accrued liabilities approximate fair values due to their short-term maturities.
Fair value estimates for derivative contracts are based on quoted market prices for comparable contracts and represent the amount the Company would have received from, or paid to, a counterparty to unwind the contract at the market rates in effect at the consolidated balance sheet date.
The Company categorizes each of its fair value measurements in accordance with a fair value hierarchy. The fair value hierarchy establishes three levels to classify the inputs to valuation techniques used to measure fair value. Level 1 inputs are quoted prices (unadjusted) in active markets for identical assets or liabilities. Level 2 inputs are quoted prices in markets that are not active, quoted prices for similar assets or liabilities in active markets, inputs other than quoted prices that are observable for the asset or liability (for example, interest rate and yield curves observable at commonly quoted intervals, forward pricing curves used to value currency and commodity contracts and volatility measurements used to value option contracts), or inputs that are derived principally from or corroborated by observable market data or other means. Level 3 inputs are unobservable (supported by little or no market activity). The fair value hierarchy gives the highest priority to Level 1 inputs and the lowest priority to Level 3 inputs.
For financial instruments that are recognized at fair value on a recurring basis, the Company determines whether transfers have occurred between levels in the hierarchy by re-assessing their classification (based on the lowest level input that is significant to the fair value measurement as a whole) at the end of each reporting period.
Assets (liabilities) measured at fair value on a recurring basis as at December 31, 2014 include:
During the year ended December 31, 2014, there were no transfers between Level 1 and Level 2 fair value measurements, and no transfers into or out of Level 3 fair value measurements.
The valuation techniques that are used to measure fair value are as follows:
Available-for-sale investments:
The fair value of available-for-sale investments is determined based on a market approach reflecting the closing price of each particular security at the consolidated balance sheet date. The closing price is a quoted market price obtained from the exchange that is the principal active market for the particular security, and therefore available-for-sale investments are classified within Level 1 of the fair value hierarchy.
Derivative contracts:
The Company’s derivative contracts are valued using pricing models and the Company generally uses similar models to value similar instruments. Such pricing models require a variety of inputs, including contractual cash flows, market prices, applicable yield curves and credit spreads. The fair value of derivative contracts is based on quoted market prices for comparable contracts and represents the amount the Company would have received from, or paid to, a counterparty to unwind the contract at the quoted market rates in effect at the consolidated balance sheet date and therefore derivative contracts are classified within Level 2 of the fair value hierarchy.
Level 1 Level 2 Level 3
Aggregate Fair
Value
Available-for-sale investments 111.0$ -$ -$ 111.0$
Derivative contracts:
Interest rate swaps - (0.7) - (0.7)
Foreign currency forward contracts - (48.8) - (48.8)
Energy swap contracts - (9.9) - (9.9)
Total return swap contracts - (0.6) - (0.6)
$ 111.0 $ (60.0) -$ $ 51.0
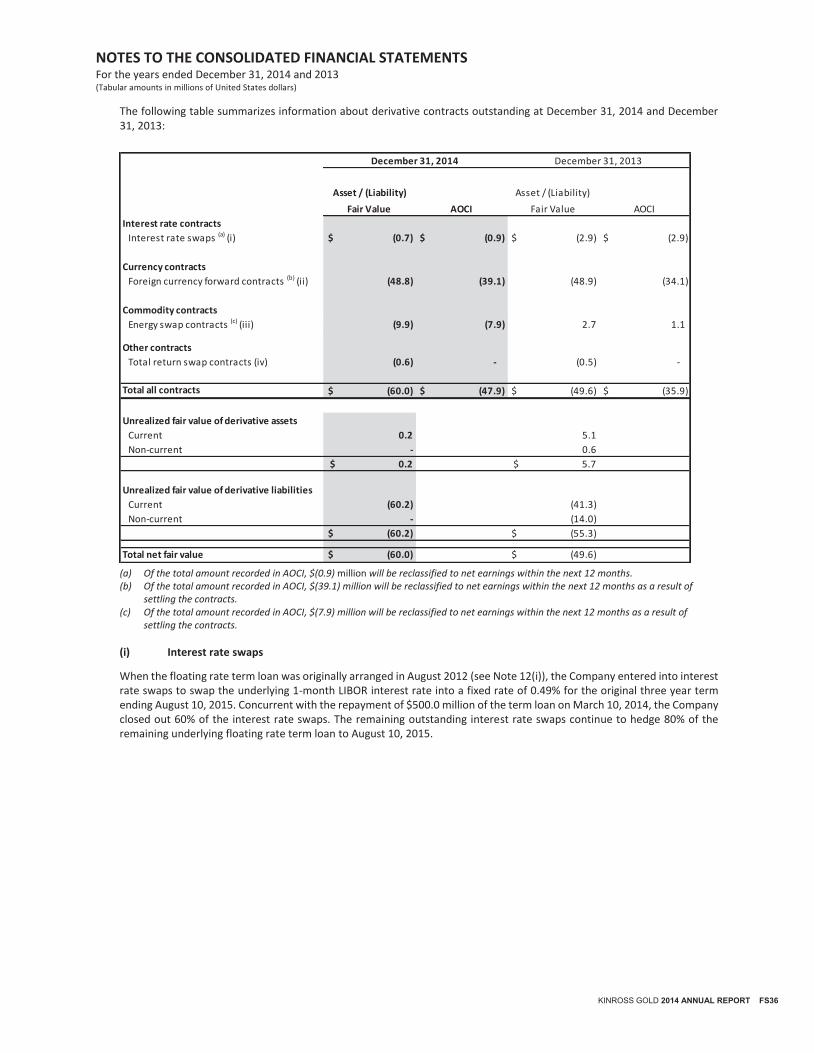
NOTES TO THE CONSOLIDATED FINANCIAL STATEMENTS For the years ended December 31, 2014 and 2013 (Tabular amounts in millions of United States dollars)
KINROSS GOLD 2014 ANNUAL REPORT FS36
The following table summarizes information about derivative contracts outstanding at December 31, 2014 and December 31, 2013:
(a) Of the total amount recorded in AOCI, $(0.9) million will be reclassified to net earnings within the next 12 months. (b) Of the total amount recorded in AOCI, $(39.1) million will be reclassified to net earnings within the next 12 months as a result of
settling the contracts. (c) Of the total amount recorded in AOCI, $(7.9) million will be reclassified to net earnings within the next 12 months as a result of
settling the contracts.
(i) Interest rate swaps
When the floating rate term loan was originally arranged in August 2012 (see Note 12(i)), the Company entered into interest rate swaps to swap the underlying 1-month LIBOR interest rate into a fixed rate of 0.49% for the original three year term ending August 10, 2015. Concurrent with the repayment of $500.0 million of the term loan on March 10, 2014, the Company closed out 60% of the interest rate swaps. The remaining outstanding interest rate swaps continue to hedge 80% of the remaining underlying floating rate term loan to August 10, 2015.
Asset / (Liability) Asset / (Liability)
Fair Value Fair Value
Interest rate contracts
Interest rate swaps (a) (i) $ (0.7) $ (0.9) $ (2.9) $ (2.9)
Currency contracts
Foreign currency forward contracts (b) (ii) (48.8) (39.1) (48.9) (34.1)
Commodity contracts
Energy swap contracts (c) (iii) (9.9) (7.9) 2.7 1.1
Other contracts
Total return swap contracts (iv) (0.6) - (0.5) -
Total all contracts $ (60.0) $ (47.9) $ (49.6) $ (35.9)
Unrealized fair value of derivative assets
Current 0.2 5.1
Non-current - 0.6
$ 0.2 $ 5.7
Unrealized fair value of derivative liabilities
Current (60.2) (41.3)
Non-current - (14.0)
$ (60.2) $ (55.3)
Total net fair value $ (60.0) $ (49.6)
AOCI
December 31, 2014 December 31, 2013
AOCI
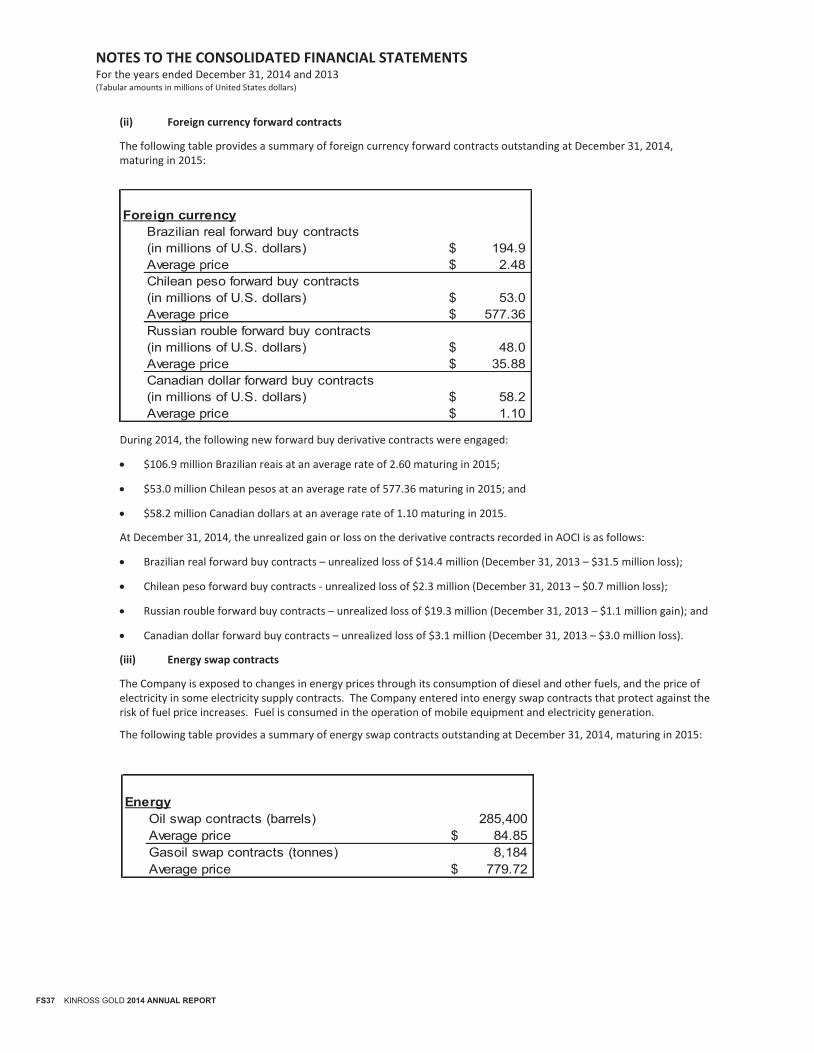
NOTES TO THE CONSOLIDATED FINANCIAL STATEMENTS For the years ended December 31, 2014 and 2013 (Tabular amounts in millions of United States dollars)
FS37 KINROSS GOLD 2014 ANNUAL REPORT
(ii) Foreign currency forward contracts
The following table provides a summary of foreign currency forward contracts outstanding at December 31, 2014, maturing in 2015:
During 2014, the following new forward buy derivative contracts were engaged:
$106.9 million Brazilian reais at an average rate of 2.60 maturing in 2015;
$53.0 million Chilean pesos at an average rate of 577.36 maturing in 2015; and
$58.2 million Canadian dollars at an average rate of 1.10 maturing in 2015.
At December 31, 2014, the unrealized gain or loss on the derivative contracts recorded in AOCI is as follows:
Brazilian real forward buy contracts – unrealized loss of $14.4 million (December 31, 2013 – $31.5 million loss);
Chilean peso forward buy contracts - unrealized loss of $2.3 million (December 31, 2013 – $0.7 million loss);
Russian rouble forward buy contracts – unrealized loss of $19.3 million (December 31, 2013 – $1.1 million gain); and
Canadian dollar forward buy contracts – unrealized loss of $3.1 million (December 31, 2013 – $3.0 million loss).
(iii) Energy swap contracts
The Company is exposed to changes in energy prices through its consumption of diesel and other fuels, and the price of electricity in some electricity supply contracts. The Company entered into energy swap contracts that protect against the risk of fuel price increases. Fuel is consumed in the operation of mobile equipment and electricity generation.
The following table provides a summary of energy swap contracts outstanding at December 31, 2014, maturing in 2015:
Foreign currencyBrazilian real forward buy contracts(in millions of U.S. dollars) 194.9$ Average price 2.48$ Chilean peso forward buy contracts(in millions of U.S. dollars) 53.0$ Average price 577.36$ Russian rouble forward buy contracts(in millions of U.S. dollars) 48.0$ Average price 35.88$ Canadian dollar forward buy contracts(in millions of U.S. dollars) 58.2$ Average price 1.10$
EnergyOil swap contracts (barrels) 285,400 Average price 84.85$ Gasoil swap contracts (tonnes) 8,184 Average price 779.72$
NOTES TO THE CONSOLIDATED FINANCIAL STATEMENTS For the years ended December 31, 2014 and 2013 (Tabular amounts in millions of United States dollars)
KINROSS GOLD 2014 ANNUAL REPORT FS38
During 2014, the following new commodity derivative contracts were engaged:
185,400 barrels of crude oil at an average rate of $83.89 per barrel maturing in 2015; and
8,184 tonnes of gasoil at an average rate of $779.72 per tonne maturing in 2015.
At December 31, 2014, the unrealized gain or loss on these derivative contracts recorded in AOCI is as follows:
Oil swap contracts – unrealized loss of $6.1 million (December 31, 2013 – $0.3 million gain);
Diesel swap contracts - unrealized loss of $nil (December 31, 2013 – $0.1 million gain); and
Gasoil swap contracts – unrealized loss of $1.8 million (December 31, 2013 – $0.7 million gain).
(iv) Total return swap contracts
The Company engages into total return swaps (“TRS”) as economic hedges of the Company’s DSUs and cash-settled RSUs. Under the terms of the TRS, a bank has the right to purchase Kinross shares in the marketplace as a hedge against the returns in the TRS. At December 31, 2014, 2,616,000 TRS units were outstanding. The following TRS contracts were entered into during the year ended December 31, 2014:
435,912 units at an average price of CDN$3.08 to hedge DSUs.
1,500,000 units at an average price of CDN$3.79 to hedge cash-settled RSUs.
At December 31, 2014, 88% of the DSUs were economically hedged (December 31, 2013 – 86%) and 61% of cash-settled RSUs were economically hedged (December 31, 2013 – nil), although hedge accounting was not applied.
(b) Non-recurring fair value measurement:
During the year ended December 31, 2014, property, plant and equipment and goodwill related to certain CGUs were written down to their recoverable amounts. Certain assumptions used in the calculation of these recoverable amounts are categorized as Level 3 in the fair value hierarchy. See Note 3 (ix) and Note 8.
(c) Fair value of financial assets and liabilities not measured and recognized at fair value:
Long-term debt is measured at amortized cost. The fair value of long-term debt is primarily measured using market determined variables, and therefore was classified within Level 2 of the fair value hierarchy. See Note 12.
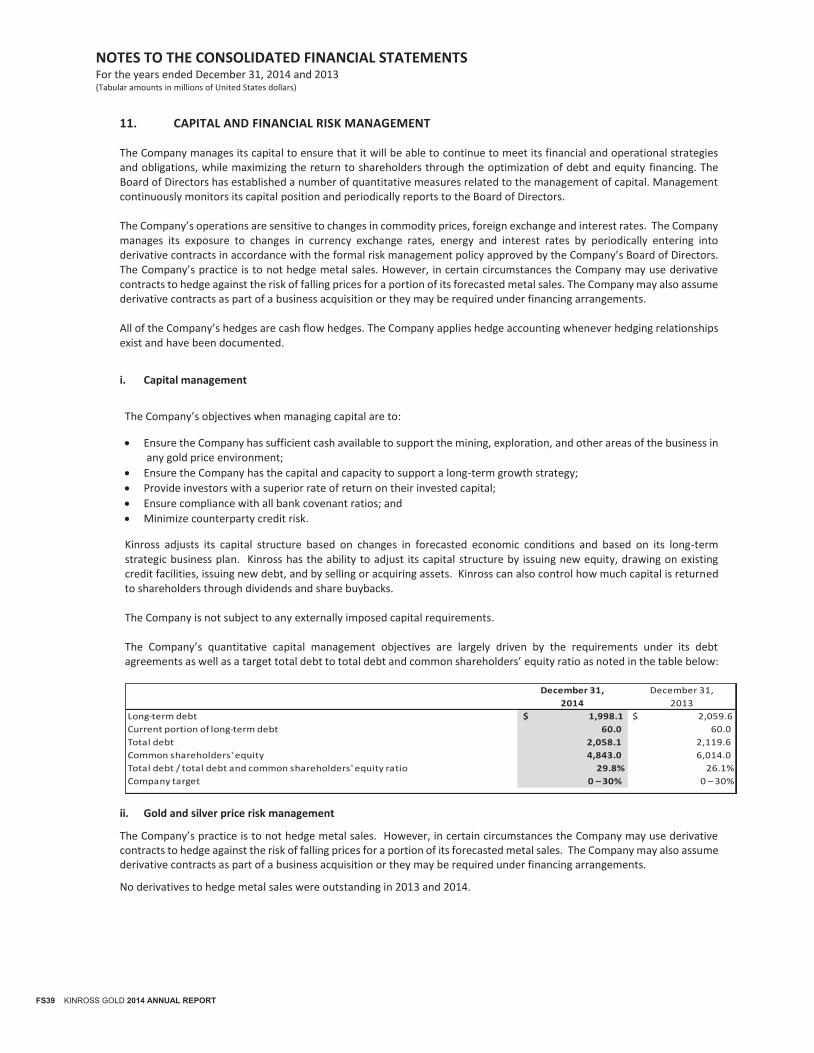
NOTES TO THE CONSOLIDATED FINANCIAL STATEMENTS For the years ended December 31, 2014 and 2013 (Tabular amounts in millions of United States dollars)
FS39 KINROSS GOLD 2014 ANNUAL REPORT
11. CAPITAL AND FINANCIAL RISK MANAGEMENT The Company manages its capital to ensure that it will be able to continue to meet its financial and operational strategies and obligations, while maximizing the return to shareholders through the optimization of debt and equity financing. The Board of Directors has established a number of quantitative measures related to the management of capital. Management continuously monitors its capital position and periodically reports to the Board of Directors. The Company’s operations are sensitive to changes in commodity prices, foreign exchange and interest rates. The Company manages its exposure to changes in currency exchange rates, energy and interest rates by periodically entering into derivative contracts in accordance with the formal risk management policy approved by the Company’s Board of Directors. The Company’s practice is to not hedge metal sales. However, in certain circumstances the Company may use derivative contracts to hedge against the risk of falling prices for a portion of its forecasted metal sales. The Company may also assume derivative contracts as part of a business acquisition or they may be required under financing arrangements. All of the Company’s hedges are cash flow hedges. The Company applies hedge accounting whenever hedging relationships exist and have been documented.
i. Capital management
The Company’s objectives when managing capital are to:
Ensure the Company has sufficient cash available to support the mining, exploration, and other areas of the business in any gold price environment;
Ensure the Company has the capital and capacity to support a long-term growth strategy;
Provide investors with a superior rate of return on their invested capital;
Ensure compliance with all bank covenant ratios; and
Minimize counterparty credit risk.
Kinross adjusts its capital structure based on changes in forecasted economic conditions and based on its long-term strategic business plan. Kinross has the ability to adjust its capital structure by issuing new equity, drawing on existing credit facilities, issuing new debt, and by selling or acquiring assets. Kinross can also control how much capital is returned to shareholders through dividends and share buybacks. The Company is not subject to any externally imposed capital requirements. The Company’s quantitative capital management objectives are largely driven by the requirements under its debt agreements as well as a target total debt to total debt and common shareholders’ equity ratio as noted in the table below:
ii. Gold and silver price risk management
The Company’s practice is to not hedge metal sales. However, in certain circumstances the Company may use derivative contracts to hedge against the risk of falling prices for a portion of its forecasted metal sales. The Company may also assume derivative contracts as part of a business acquisition or they may be required under financing arrangements.
No derivatives to hedge metal sales were outstanding in 2013 and 2014.
December 31, December 31,
2014 2013
Long-term debt $ 1,998.1 $ 2,059.6
Current portion of long-term debt 60.0 60.0
Total debt 2,058.1 2,119.6
Common shareholders' equity 4,843.0 6,014.0
Total debt / total debt and common shareholders' equity ratio 29.8% 26.1%
Company target 0 – 30% 0 – 30%
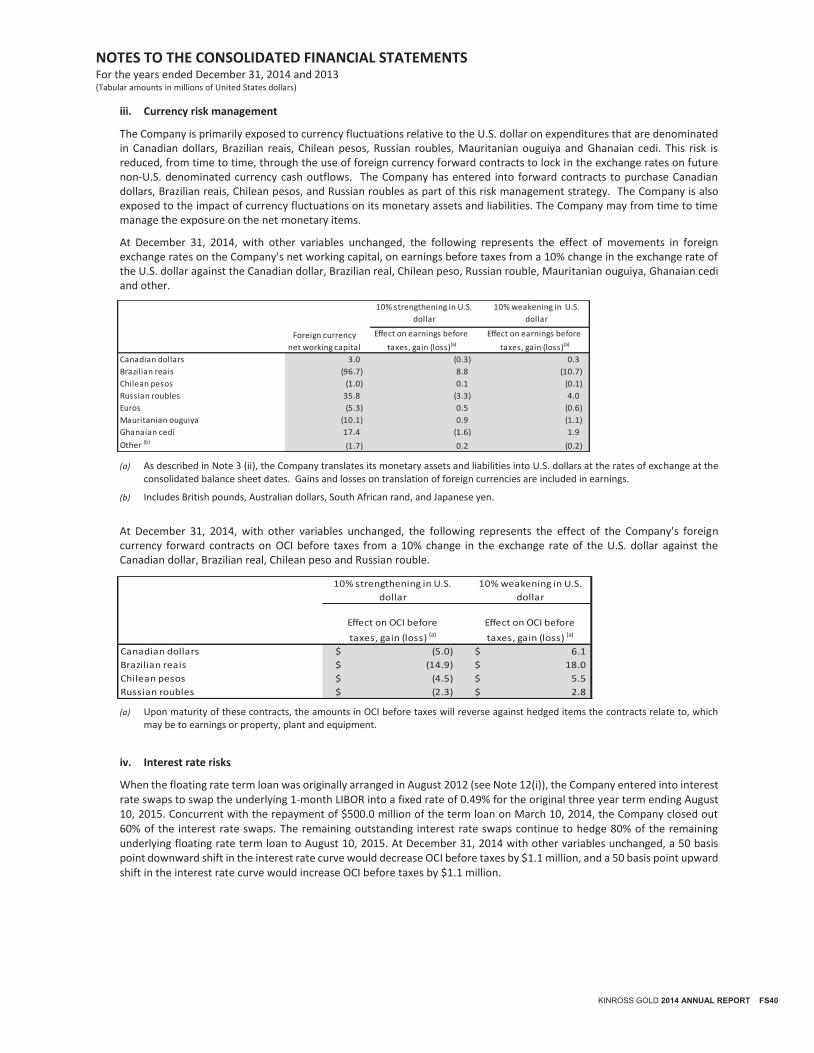
NOTES TO THE CONSOLIDATED FINANCIAL STATEMENTS For the years ended December 31, 2014 and 2013 (Tabular amounts in millions of United States dollars)
KINROSS GOLD 2014 ANNUAL REPORT FS40
iii. Currency risk management
The Company is primarily exposed to currency fluctuations relative to the U.S. dollar on expenditures that are denominated in Canadian dollars, Brazilian reais, Chilean pesos, Russian roubles, Mauritanian ouguiya and Ghanaian cedi. This risk is reduced, from time to time, through the use of foreign currency forward contracts to lock in the exchange rates on future non-U.S. denominated currency cash outflows. The Company has entered into forward contracts to purchase Canadian dollars, Brazilian reais, Chilean pesos, and Russian roubles as part of this risk management strategy. The Company is also exposed to the impact of currency fluctuations on its monetary assets and liabilities. The Company may from time to time manage the exposure on the net monetary items.
At December 31, 2014, with other variables unchanged, the following represents the effect of movements in foreign exchange rates on the Company's net working capital, on earnings before taxes from a 10% change in the exchange rate of the U.S. dollar against the Canadian dollar, Brazilian real, Chilean peso, Russian rouble, Mauritanian ouguiya, Ghanaian cedi and other.
(a) As described in Note 3 (ii), the Company translates its monetary assets and liabilities into U.S. dollars at the rates of exchange at the consolidated balance sheet dates. Gains and losses on translation of foreign currencies are included in earnings.
(b) Includes British pounds, Australian dollars, South African rand, and Japanese yen.
At December 31, 2014, with other variables unchanged, the following represents the effect of the Company's foreign currency forward contracts on OCI before taxes from a 10% change in the exchange rate of the U.S. dollar against the Canadian dollar, Brazilian real, Chilean peso and Russian rouble.
(a) Upon maturity of these contracts, the amounts in OCI before taxes will reverse against hedged items the contracts relate to, which may be to earnings or property, plant and equipment.
iv. Interest rate risks
When the floating rate term loan was originally arranged in August 2012 (see Note 12(i)), the Company entered into interest rate swaps to swap the underlying 1-month LIBOR into a fixed rate of 0.49% for the original three year term ending August 10, 2015. Concurrent with the repayment of $500.0 million of the term loan on March 10, 2014, the Company closed out 60% of the interest rate swaps. The remaining outstanding interest rate swaps continue to hedge 80% of the remaining underlying floating rate term loan to August 10, 2015. At December 31, 2014 with other variables unchanged, a 50 basis point downward shift in the interest rate curve would decrease OCI before taxes by $1.1 million, and a 50 basis point upward shift in the interest rate curve would increase OCI before taxes by $1.1 million.
Foreign currency
net working capital
Effect on earnings before
taxes, gain (loss)(a)
Effect on earnings before
taxes, gain (loss)(a)
Canadian dollars 3.0 (0.3) 0.3
Brazilian reais (96.7) 8.8 (10.7)
Chilean pesos (1.0) 0.1 (0.1)
Russian roubles 35.8 (3.3) 4.0
Euros (5.3) 0.5 (0.6)
Mauritanian ouguiya (10.1) 0.9 (1.1)
Ghanaian cedi 17.4 (1.6) 1.9
Other (b)(1.7) 0.2 (0.2)
10% weakening in U.S.
dollar
10% strengthening in U.S.
dollar
10% strengthening in U.S.
dollar
10% weakening in U.S.
dollar
Effect on OCI before
taxes, gain (loss) (a)
Effect on OCI before
taxes, gain (loss) (a)
Canadian dollars (5.0)$ 6.1$
Brazilian reais (14.9)$ 18.0$
Chilean pesos (4.5)$ 5.5$
Russian roubles (2.3)$ 2.8$
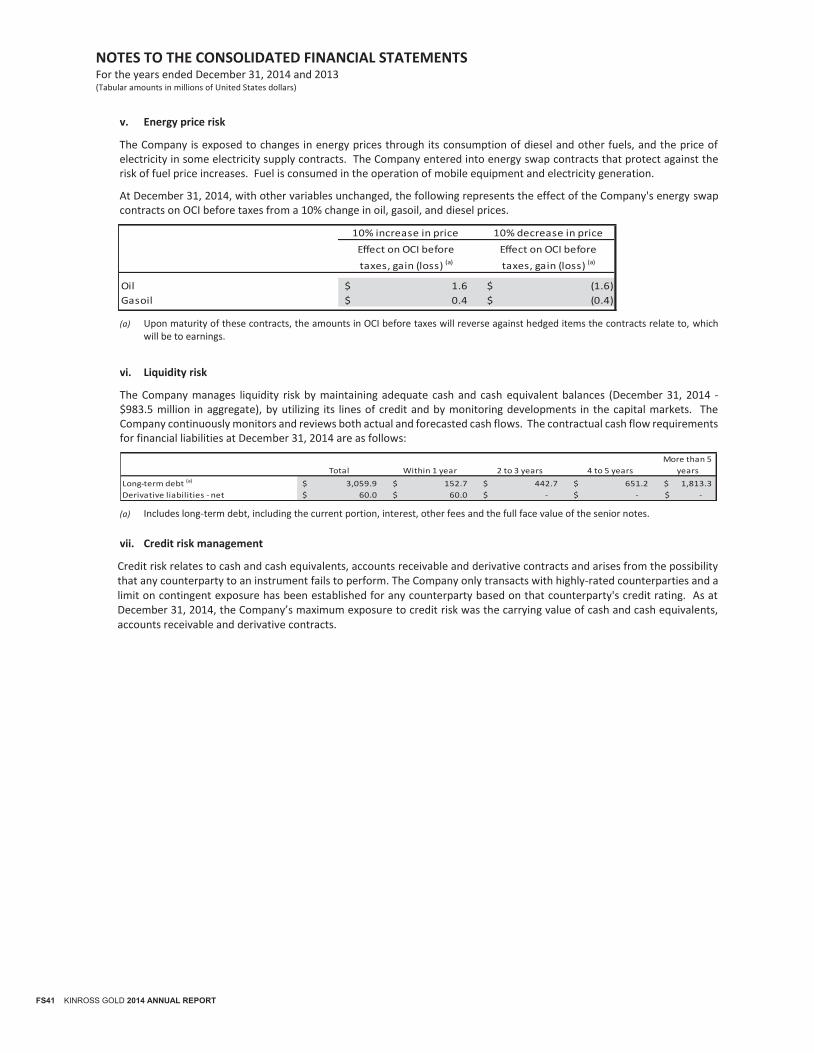
NOTES TO THE CONSOLIDATED FINANCIAL STATEMENTS For the years ended December 31, 2014 and 2013 (Tabular amounts in millions of United States dollars)
FS41 KINROSS GOLD 2014 ANNUAL REPORT
v. Energy price risk
The Company is exposed to changes in energy prices through its consumption of diesel and other fuels, and the price of electricity in some electricity supply contracts. The Company entered into energy swap contracts that protect against the risk of fuel price increases. Fuel is consumed in the operation of mobile equipment and electricity generation.
At December 31, 2014, with other variables unchanged, the following represents the effect of the Company's energy swap contracts on OCI before taxes from a 10% change in oil, gasoil, and diesel prices.
10% increase in price 10% decrease in price
Effect on OCI before
taxes, gain (loss) (a)
Effect on OCI before
taxes, gain (loss) (a)
Oil 1.6$ (1.6)$
Gasoil 0.4$ (0.4)$
(a) Upon maturity of these contracts, the amounts in OCI before taxes will reverse against hedged items the contracts relate to, which will be to earnings.
vi. Liquidity risk
The Company manages liquidity risk by maintaining adequate cash and cash equivalent balances (December 31, 2014 - $983.5 million in aggregate), by utilizing its lines of credit and by monitoring developments in the capital markets. The Company continuously monitors and reviews both actual and forecasted cash flows. The contractual cash flow requirements for financial liabilities at December 31, 2014 are as follows:
Total Within 1 year 2 to 3 years 4 to 5 years
More than 5
years
Long-term debt (a) 3,059.9$ 152.7$ 442.7$ 651.2$ 1,813.3$
Derivative liabilities - net 60.0$ 60.0$ -$ -$ -$
(a) Includes long-term debt, including the current portion, interest, other fees and the full face value of the senior notes.
vii. Credit risk management
Credit risk relates to cash and cash equivalents, accounts receivable and derivative contracts and arises from the possibility that any counterparty to an instrument fails to perform. The Company only transacts with highly-rated counterparties and a limit on contingent exposure has been established for any counterparty based on that counterparty's credit rating. As at December 31, 2014, the Company’s maximum exposure to credit risk was the carrying value of cash and cash equivalents, accounts receivable and derivative contracts.
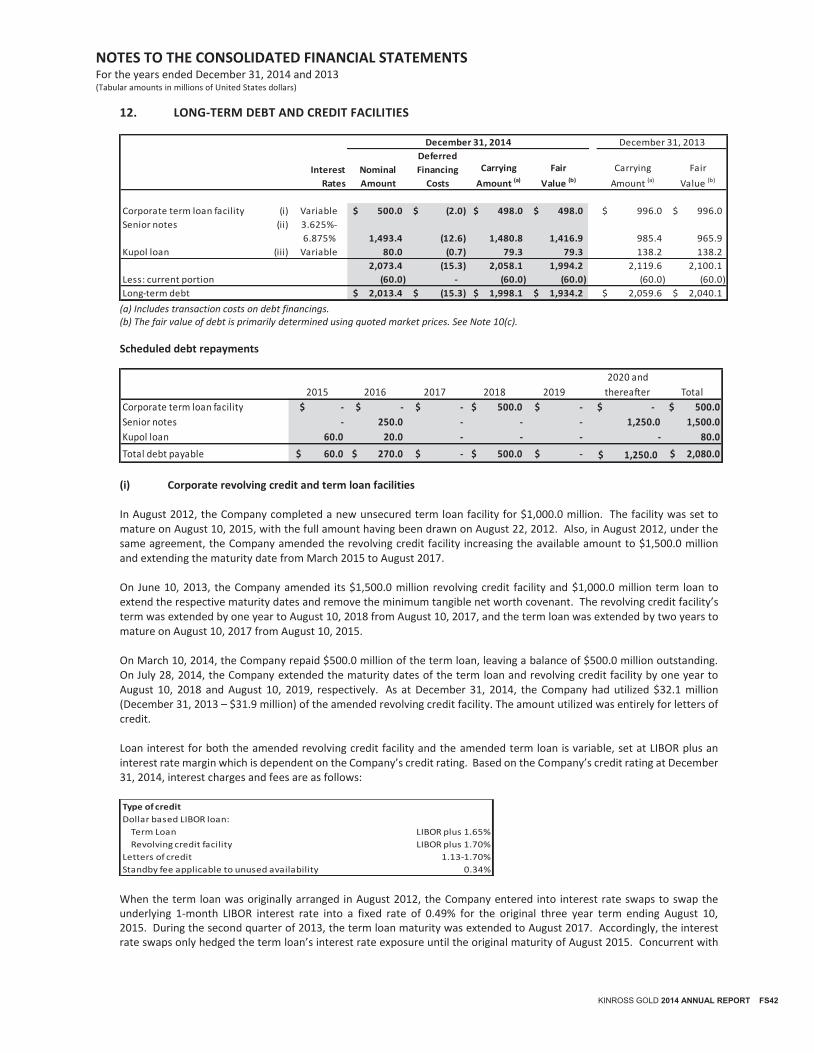
NOTES TO THE CONSOLIDATED FINANCIAL STATEMENTS For the years ended December 31, 2014 and 2013 (Tabular amounts in millions of United States dollars)
KINROSS GOLD 2014 ANNUAL REPORT FS42
12. LONG-TERM DEBT AND CREDIT FACILITIES
(a) Includes transaction costs on debt financings. (b) The fair value of debt is primarily determined using quoted market prices. See Note 10(c).
Scheduled debt repayments
(i) Corporate revolving credit and term loan facilities In August 2012, the Company completed a new unsecured term loan facility for $1,000.0 million. The facility was set to mature on August 10, 2015, with the full amount having been drawn on August 22, 2012. Also, in August 2012, under the same agreement, the Company amended the revolving credit facility increasing the available amount to $1,500.0 million and extending the maturity date from March 2015 to August 2017. On June 10, 2013, the Company amended its $1,500.0 million revolving credit facility and $1,000.0 million term loan to extend the respective maturity dates and remove the minimum tangible net worth covenant. The revolving credit facility’s term was extended by one year to August 10, 2018 from August 10, 2017, and the term loan was extended by two years to mature on August 10, 2017 from August 10, 2015. On March 10, 2014, the Company repaid $500.0 million of the term loan, leaving a balance of $500.0 million outstanding. On July 28, 2014, the Company extended the maturity dates of the term loan and revolving credit facility by one year to August 10, 2018 and August 10, 2019, respectively. As at December 31, 2014, the Company had utilized $32.1 million (December 31, 2013 – $31.9 million) of the amended revolving credit facility. The amount utilized was entirely for letters of credit. Loan interest for both the amended revolving credit facility and the amended term loan is variable, set at LIBOR plus an interest rate margin which is dependent on the Company’s credit rating. Based on the Company’s credit rating at December 31, 2014, interest charges and fees are as follows:
When the term loan was originally arranged in August 2012, the Company entered into interest rate swaps to swap the underlying 1-month LIBOR interest rate into a fixed rate of 0.49% for the original three year term ending August 10, 2015. During the second quarter of 2013, the term loan maturity was extended to August 2017. Accordingly, the interest rate swaps only hedged the term loan’s interest rate exposure until the original maturity of August 2015. Concurrent with
Interest
Rates
Nominal
Amount
Deferred
Financing
Costs
Carrying
Amount (a)
Fair
Value (b)
Carrying
Amount (a)
Fair
Value (b)
Corporate term loan facility (i) Variable 500.0$ (2.0)$ 498.0$ 498.0$ 996.0$ 996.0$
Senior notes (ii) 3.625%-
6.875% 1,493.4 (12.6) 1,480.8 1,416.9 985.4 965.9
Kupol loan (iii) Variable 80.0 (0.7) 79.3 79.3 138.2 138.2
2,073.4 (15.3) 2,058.1 1,994.2 2,119.6 2,100.1
Less: current portion (60.0) - (60.0) (60.0) (60.0) (60.0)
Long-term debt 2,013.4$ (15.3)$ 1,998.1$ 1,934.2$ 2,059.6$ 2,040.1$
December 31, 2014 December 31, 2013
2015 2016 2017 2018 2019
2020 and
thereafter Total
Corporate term loan facility $ - $ - $ - $ 500.0 $ - $ - $ 500.0
Senior notes - 250.0 - - - 1,250.0 1,500.0
Kupol loan 60.0 20.0 - - - - 80.0
Total debt payable $ 60.0 $ 270.0 $ - $ 500.0 $ - 1,250.0$ $ 2,080.0
Type of credit
Dollar based LIBOR loan:
Term Loan LIBOR plus 1.65%
Revolving credit facility LIBOR plus 1.70%
Letters of credit 1.13-1.70%
Standby fee applicable to unused availability 0.34%
NOTES TO THE CONSOLIDATED FINANCIAL STATEMENTS For the years ended December 31, 2014 and 2013 (Tabular amounts in millions of United States dollars)
FS43 KINROSS GOLD 2014 ANNUAL REPORT
the repayment of $500.0 million of the term loan on March 10, 2014, the Company closed out 60% of the interest rate swaps. The remaining outstanding interest rate swaps continue to hedge 80% of the remaining underlying floating rate term loan to August 10, 2015.
Based on the Company’s credit rating at December 31, 2014, the fixed rate on the hedged portion of the term loan is 2.14%. The amended revolving credit facility and amended unsecured term loan were arranged under one credit agreement, which contains various covenants including limits on indebtedness, asset sales and liens. The significant financial covenant is a ratio of net debt to EBITDA, as defined in the agreement, of no more than 3.5:1. The Company is in compliance with this covenant at December 31, 2014.
(ii) Senior notes On August 22, 2011, the Company completed a $1.0 billion offering of debt securities consisting of $250.0 million principal amount of 3.625% senior notes due 2016, $500.0 million principal amount of 5.125% senior notes due 2021 and $250.0 million principal amount of 6.875% senior notes due 2041. Kinross received net proceeds of $980.9 million from the offering, after discount and payment of fees and expenses related to the offering.
On March 6, 2014, the Company completed a $500.0 million offering of debt securities consisting of 5.950% senior notes due 2024. Kinross received net proceeds of $492.9 million from the offering, after discount and payment of fees and expenses related to the offering.
The senior notes referred to above (collectively, the “notes”) pay interest semi-annually. Except as noted below, the notes are redeemable by the Company, in whole or part, for cash at any time prior to maturity, at a redemption price equal to the greater of 100% of the principal amount or the sum of the present value of the remaining scheduled principal and interest payments on the notes discounted at the applicable treasury rate, as defined in the indentures, plus a premium of between 40 and 50 basis points, plus accrued interest, if any. Within three months of maturity of the notes due in 2021 and 2024 and within six months of maturity of the notes due in 2041, the Company can only redeem the notes in whole at 100% of the principal amount plus accrued interest, if any. In addition, the Company is required to make an offer to repurchase the notes prior to maturity upon certain fundamental changes at a repurchase price equal to 101% of the principal amount of the notes plus accrued and unpaid interest to the repurchase date, if any.
(iii) Kupol loan On December 21, 2011, the Company completed a $200.0 million non-recourse loan from a group of international financial institutions. The non-recourse loan carries a term of five years, maturing on September 30, 2016 and bears annual interest of LIBOR plus 2.5%. Semi-annual principal repayments of $30.0 million commenced in March 2013 and will continue through September 30, 2015. Principal repayments due on March 31, 2016 and September 30, 2016 are reduced to $13.0 million and $7.0 million, respectively. The Company may prepay the loan in whole or in part, without penalty, but subject to customary break costs, if any. The agreement contains various requirements that include limits on distributions if certain minimum debt service coverage levels are not achieved. Property, plant and equipment with a carrying amount of $170.7 million (December 31, 2013 - $154.7 million) are pledged as security as part of the Kupol loan.
As at December 31, 2014, cash of $34.0 million (December 31, 2013 - $34.0 million) was restricted for payments related to this loan.
(iv) Other On June 15, 2012, the Company entered into an amendment to increase the amount of its Letter of Credit guarantee facility with Export Development Canada (“EDC”) from $136.0 million to $200.0 million and to extend the maturity date to March 31, 2015. On July 17, 2014, the Company further amended this facility to increase the amount from $200.0 million to $250.0 million. Letters of credit guaranteed by this facility are solely for reclamation liabilities at Fort Knox, Round Mountain, and Kettle River–Buckhorn. Fees related to letters of credit under this facility are 1.00% to 1.25%. As at December 31, 2014, $207.2 million (December 31, 2013 - $164.1 million) was utilized under this facility.
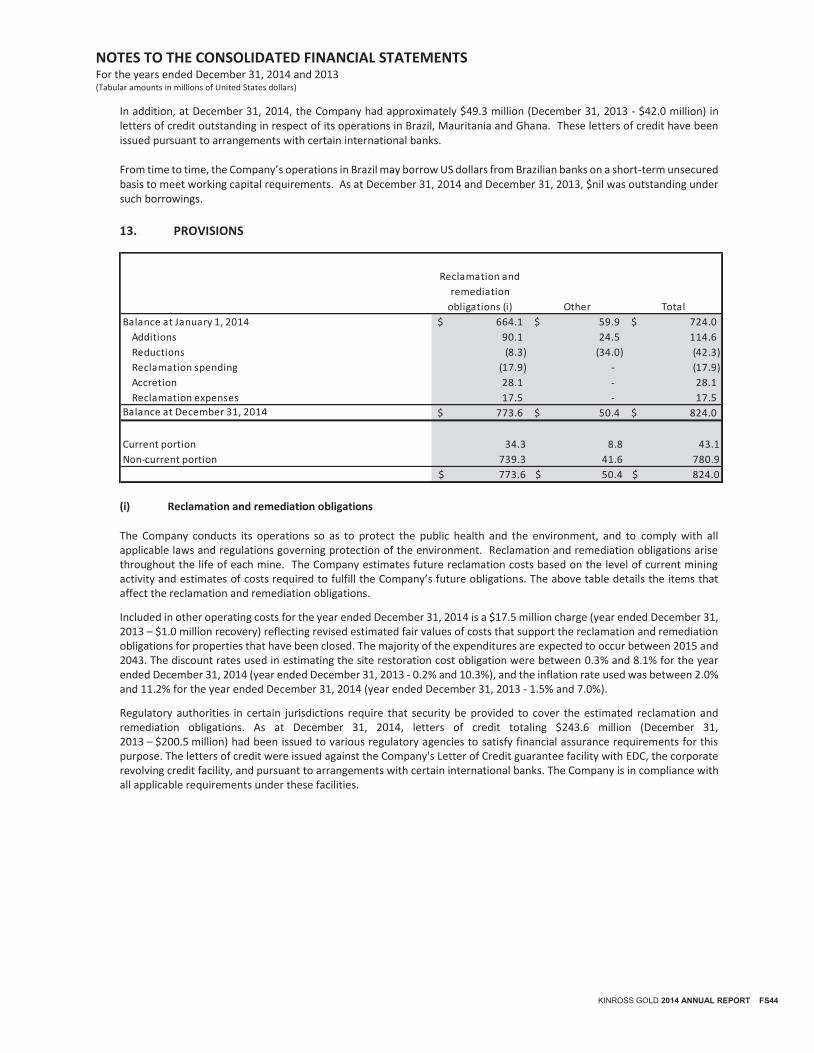
NOTES TO THE CONSOLIDATED FINANCIAL STATEMENTS For the years ended December 31, 2014 and 2013 (Tabular amounts in millions of United States dollars)
KINROSS GOLD 2014 ANNUAL REPORT FS44
In addition, at December 31, 2014, the Company had approximately $49.3 million (December 31, 2013 - $42.0 million) in letters of credit outstanding in respect of its operations in Brazil, Mauritania and Ghana. These letters of credit have been issued pursuant to arrangements with certain international banks. From time to time, the Company’s operations in Brazil may borrow US dollars from Brazilian banks on a short-term unsecured basis to meet working capital requirements. As at December 31, 2014 and December 31, 2013, $nil was outstanding under such borrowings.
13. PROVISIONS
(i) Reclamation and remediation obligations
The Company conducts its operations so as to protect the public health and the environment, and to comply with all applicable laws and regulations governing protection of the environment. Reclamation and remediation obligations arise throughout the life of each mine. The Company estimates future reclamation costs based on the level of current mining activity and estimates of costs required to fulfill the Company’s future obligations. The above table details the items that affect the reclamation and remediation obligations.
Included in other operating costs for the year ended December 31, 2014 is a $17.5 million charge (year ended December 31, 2013 – $1.0 million recovery) reflecting revised estimated fair values of costs that support the reclamation and remediation obligations for properties that have been closed. The majority of the expenditures are expected to occur between 2015 and 2043. The discount rates used in estimating the site restoration cost obligation were between 0.3% and 8.1% for the year ended December 31, 2014 (year ended December 31, 2013 - 0.2% and 10.3%), and the inflation rate used was between 2.0% and 11.2% for the year ended December 31, 2014 (year ended December 31, 2013 - 1.5% and 7.0%).
Regulatory authorities in certain jurisdictions require that security be provided to cover the estimated reclamation and remediation obligations. As at December 31, 2014, letters of credit totaling $243.6 million (December 31, 2013 – $200.5 million) had been issued to various regulatory agencies to satisfy financial assurance requirements for this purpose. The letters of credit were issued against the Company's Letter of Credit guarantee facility with EDC, the corporate revolving credit facility, and pursuant to arrangements with certain international banks. The Company is in compliance with all applicable requirements under these facilities.
Reclamation and
remediation
obligations (i) Other Total
Balance at January 1, 2014 664.1$ 59.9$ 724.0$
Additions 90.1 24.5 114.6
Reductions (8.3) (34.0) (42.3)
Reclamation spending (17.9) - (17.9)
Accretion 28.1 - 28.1
Reclamation expenses 17.5 - 17.5
Balance at December 31, 2014 773.6$ 50.4$ 824.0$
Current portion 34.3 8.8 43.1
Non-current portion 739.3 41.6 780.9
$ 773.6 $ 50.4 $ 824.0
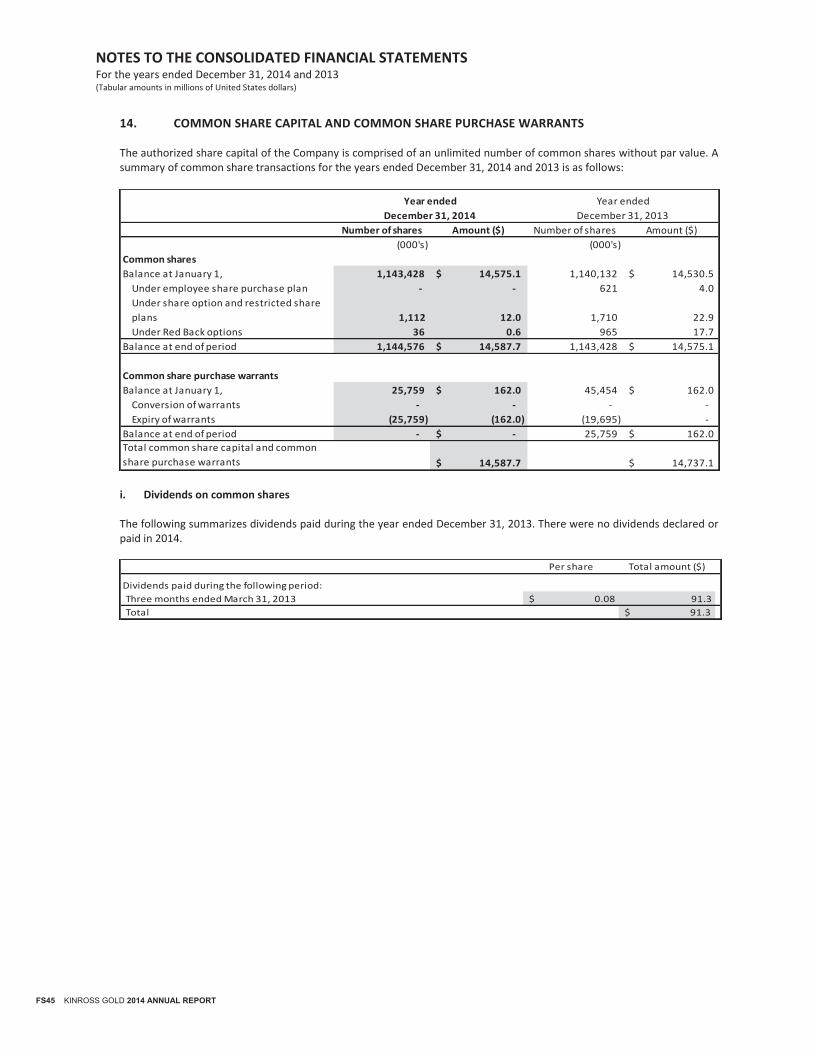
NOTES TO THE CONSOLIDATED FINANCIAL STATEMENTS For the years ended December 31, 2014 and 2013 (Tabular amounts in millions of United States dollars)
FS45 KINROSS GOLD 2014 ANNUAL REPORT
14. COMMON SHARE CAPITAL AND COMMON SHARE PURCHASE WARRANTS The authorized share capital of the Company is comprised of an unlimited number of common shares without par value. A summary of common share transactions for the years ended December 31, 2014 and 2013 is as follows:
i. Dividends on common shares The following summarizes dividends paid during the year ended December 31, 2013. There were no dividends declared or paid in 2014.
Number of shares Amount ($) Number of shares Amount ($)
(000's) (000's)
Common shares
Balance at January 1, 1,143,428 14,575.1$ 1,140,132 14,530.5$
Under employee share purchase plan - - 621 4.0
Under share option and restricted share
plans 1,112 12.0 1,710 22.9
Under Red Back options 36 0.6 965 17.7
Balance at end of period 1,144,576 14,587.7$ 1,143,428 14,575.1$
Common share purchase warrants
Balance at January 1, 25,759 162.0$ 45,454 162.0$
Conversion of warrants - - - -
Expiry of warrants (25,759) (162.0) (19,695) -
Balance at end of period - -$ 25,759 162.0$
Total common share capital and common
share purchase warrants 14,587.7$ 14,737.1$
Year ended
December 31, 2013
Year ended
December 31, 2014
Per share Total amount ($)
Dividends paid during the following period:
Three months ended March 31, 2013 $ 0.08 91.3
Total $ 91.3

NOTES TO THE CONSOLIDATED FINANCIAL STATEMENTS For the years ended December 31, 2014 and 2013 (Tabular amounts in millions of United States dollars)
KINROSS GOLD 2014 ANNUAL REPORT FS46
ii. Common share purchase warrants The Company has issued U.S. dollar denominated common share purchase warrants.
The following table summarizes information about the common share purchase warrants outstanding at December 31, 2014:
These U.S. dollar denominated common share purchase warrants expired on September 17, 2014.
Share equivalents
of warrants (000's)
Weighted average
exercise price
($/warrant)
Balance at January 1, 2014 25,759 21.30$
Issued - -
Exercised - -
Expired (25,759) 21.30
Balance at December 31, 2014 - -$
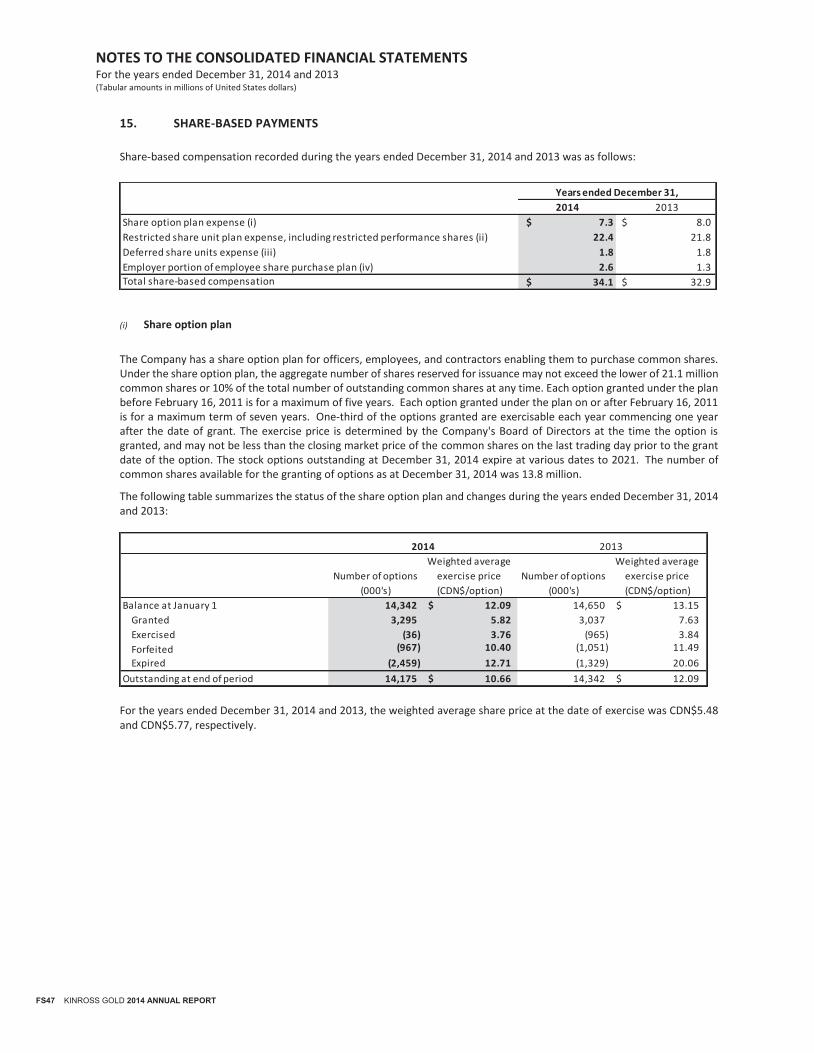
NOTES TO THE CONSOLIDATED FINANCIAL STATEMENTS For the years ended December 31, 2014 and 2013 (Tabular amounts in millions of United States dollars)
FS47 KINROSS GOLD 2014 ANNUAL REPORT
15. SHARE-BASED PAYMENTS
Share-based compensation recorded during the years ended December 31, 2014 and 2013 was as follows:
(i) Share option plan
The Company has a share option plan for officers, employees, and contractors enabling them to purchase common shares. Under the share option plan, the aggregate number of shares reserved for issuance may not exceed the lower of 21.1 million common shares or 10% of the total number of outstanding common shares at any time. Each option granted under the plan before February 16, 2011 is for a maximum of five years. Each option granted under the plan on or after February 16, 2011 is for a maximum term of seven years. One-third of the options granted are exercisable each year commencing one year after the date of grant. The exercise price is determined by the Company's Board of Directors at the time the option is granted, and may not be less than the closing market price of the common shares on the last trading day prior to the grant date of the option. The stock options outstanding at December 31, 2014 expire at various dates to 2021. The number of common shares available for the granting of options as at December 31, 2014 was 13.8 million.
The following table summarizes the status of the share option plan and changes during the years ended December 31, 2014 and 2013:
For the years ended December 31, 2014 and 2013, the weighted average share price at the date of exercise was CDN$5.48 and CDN$5.77, respectively.
2014 2013
Share option plan expense (i) $ 7.3 8.0$
22.4 21.8
Deferred share units expense (iii) 1.8 1.8
2.6 1.3
Total share-based compensation $ 34.1 32.9$
Years ended December 31,
Restricted share unit plan expense, including restricted performance shares (ii)
Employer portion of employee share purchase plan (iv)
Number of options
(000's)
Weighted average
exercise price
(CDN$/option)
Number of options
(000's)
Weighted average
exercise price
(CDN$/option)
Balance at January 1 14,342 12.09$ 14,650 13.15$
Granted 3,295 5.82 3,037 7.63
Exercised (36) 3.76 (965) 3.84
Forfeited (967) 10.40 (1,051) 11.49
Expired (2,459) 12.71 (1,329) 20.06
Outstanding at end of period 14,175 10.66$ 14,342 12.09$
20132014
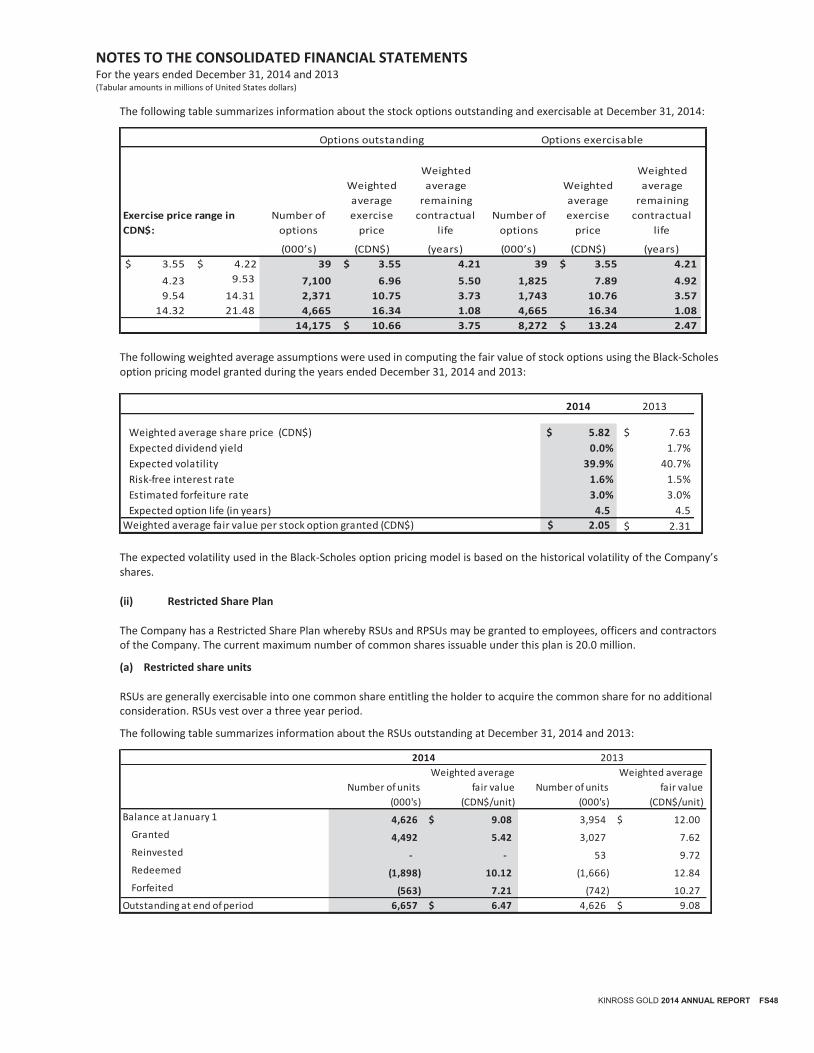
NOTES TO THE CONSOLIDATED FINANCIAL STATEMENTS For the years ended December 31, 2014 and 2013 (Tabular amounts in millions of United States dollars)
KINROSS GOLD 2014 ANNUAL REPORT FS48
The following table summarizes information about the stock options outstanding and exercisable at December 31, 2014:
The following weighted average assumptions were used in computing the fair value of stock options using the Black-Scholes option pricing model granted during the years ended December 31, 2014 and 2013:
The expected volatility used in the Black-Scholes option pricing model is based on the historical volatility of the Company’s shares. (ii) Restricted Share Plan The Company has a Restricted Share Plan whereby RSUs and RPSUs may be granted to employees, officers and contractors of the Company. The current maximum number of common shares issuable under this plan is 20.0 million.
(a) Restricted share units
RSUs are generally exercisable into one common share entitling the holder to acquire the common share for no additional consideration. RSUs vest over a three year period.
The following table summarizes information about the RSUs outstanding at December 31, 2014 and 2013:
Number of
options
Weighted
average
exercise
price
Weighted
average
remaining
contractual
life
Number of
options
Weighted
average
exercise
price
Weighted
average
remaining
contractual
life
(000’s) (CDN$) (years) (000’s) (CDN$) (years)
$ 3.55 $ 4.22 39 3.55$ 4.21 39 3.55$ 4.21
4.23 9.53 7,100 6.96 5.50 1,825 7.89 4.92
9.54 14.31 2,371 10.75 3.73 1,743 10.76 3.57
14.32 21.48 4,665 16.34 1.08 4,665 16.34 1.08
14,175 10.66$ 3.75 8,272 13.24$ 2.47
Options exercisable
Exercise price range in
CDN$:
Options outstanding
2014 2013
Weighted average share price (CDN$) 5.82$ $ 7.63
Expected dividend yield 0.0% 1.7%
Expected volatility 39.9% 40.7%
Risk-free interest rate 1.6% 1.5%
Estimated forfeiture rate 3.0% 3.0%
Expected option life (in years) 4.5 4.5
Weighted average fair value per stock option granted (CDN$) 2.05$ $ 2.31
Number of units
(000's)
Weighted average
fair value
(CDN$/unit)
Number of units
(000's)
Weighted average
fair value
(CDN$/unit)
Balance at January 1 4,626 9.08$ 3,954 12.00$
Granted 4,492 5.42 3,027 7.62
Reinvested - - 53 9.72
Redeemed (1,898) 10.12 (1,666) 12.84
Forfeited (563) 7.21 (742) 10.27
Outstanding at end of period 6,657 6.47$ 4,626 9.08$
2014 2013
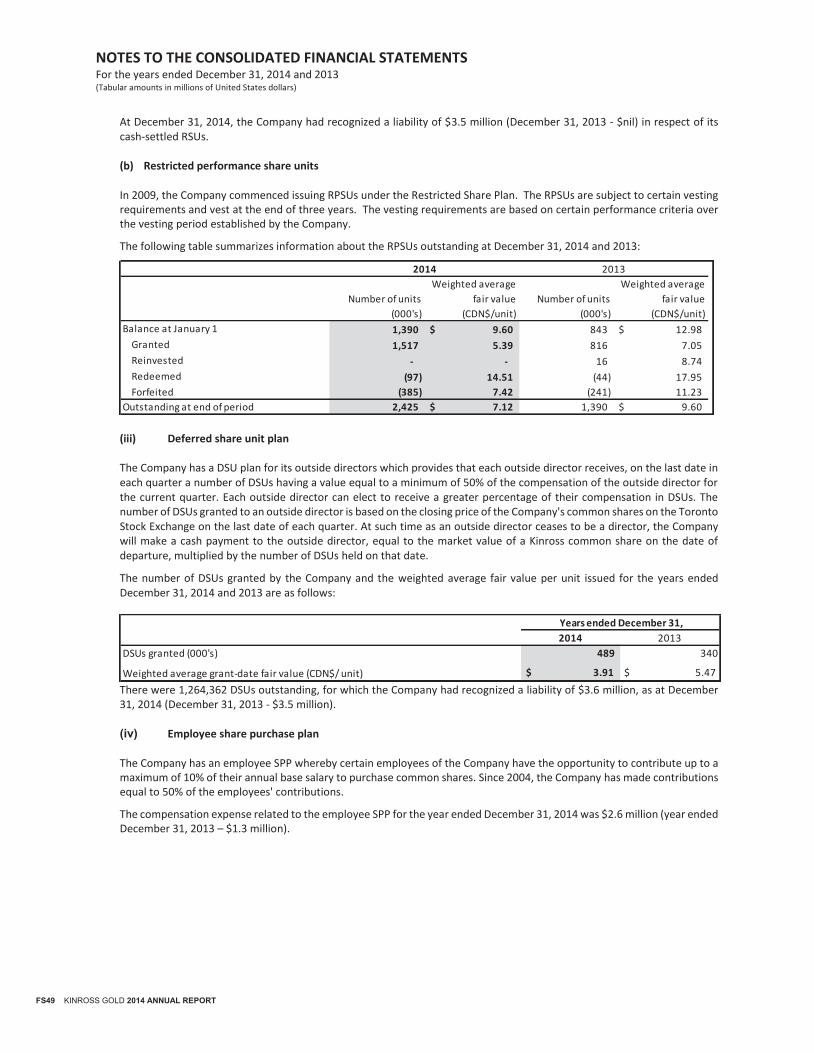
NOTES TO THE CONSOLIDATED FINANCIAL STATEMENTS For the years ended December 31, 2014 and 2013 (Tabular amounts in millions of United States dollars)
FS49 KINROSS GOLD 2014 ANNUAL REPORT
At December 31, 2014, the Company had recognized a liability of $3.5 million (December 31, 2013 - $nil) in respect of its cash-settled RSUs. (b) Restricted performance share units
In 2009, the Company commenced issuing RPSUs under the Restricted Share Plan. The RPSUs are subject to certain vesting requirements and vest at the end of three years. The vesting requirements are based on certain performance criteria over the vesting period established by the Company.
The following table summarizes information about the RPSUs outstanding at December 31, 2014 and 2013:
(iii) Deferred share unit plan The Company has a DSU plan for its outside directors which provides that each outside director receives, on the last date in each quarter a number of DSUs having a value equal to a minimum of 50% of the compensation of the outside director for the current quarter. Each outside director can elect to receive a greater percentage of their compensation in DSUs. The number of DSUs granted to an outside director is based on the closing price of the Company's common shares on the Toronto Stock Exchange on the last date of each quarter. At such time as an outside director ceases to be a director, the Company will make a cash payment to the outside director, equal to the market value of a Kinross common share on the date of departure, multiplied by the number of DSUs held on that date.
The number of DSUs granted by the Company and the weighted average fair value per unit issued for the years ended December 31, 2014 and 2013 are as follows:
There were 1,264,362 DSUs outstanding, for which the Company had recognized a liability of $3.6 million, as at December 31, 2014 (December 31, 2013 - $3.5 million). (iv) Employee share purchase plan The Company has an employee SPP whereby certain employees of the Company have the opportunity to contribute up to a maximum of 10% of their annual base salary to purchase common shares. Since 2004, the Company has made contributions equal to 50% of the employees' contributions.
The compensation expense related to the employee SPP for the year ended December 31, 2014 was $2.6 million (year ended December 31, 2013 – $1.3 million).
Number of units
(000's)
Weighted average
fair value
(CDN$/unit)
Number of units
(000's)
Weighted average
fair value
(CDN$/unit)
Balance at January 1 1,390 9.60$ 843 12.98$
Granted 1,517 5.39 816 7.05
Reinvested - - 16 8.74
Redeemed (97) 14.51 (44) 17.95
Forfeited (385) 7.42 (241) 11.23
Outstanding at end of period 2,425 7.12$ 1,390 9.60$
2014 2013
2014 2013
DSUs granted (000's) 489 340
Weighted average grant-date fair value (CDN$/ unit) $ 3.91 $ 5.47
Years ended December 31,
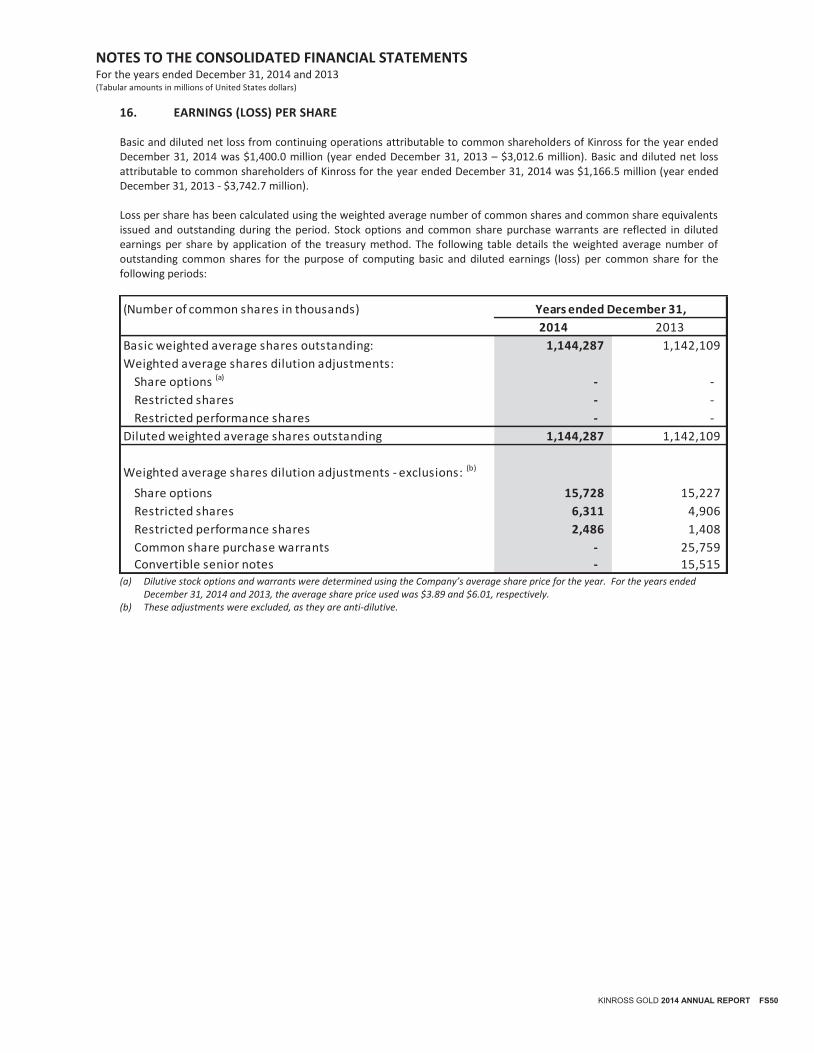
NOTES TO THE CONSOLIDATED FINANCIAL STATEMENTS For the years ended December 31, 2014 and 2013 (Tabular amounts in millions of United States dollars)
KINROSS GOLD 2014 ANNUAL REPORT FS50
16. EARNINGS (LOSS) PER SHARE Basic and diluted net loss from continuing operations attributable to common shareholders of Kinross for the year ended December 31, 2014 was $1,400.0 million (year ended December 31, 2013 – $3,012.6 million). Basic and diluted net loss attributable to common shareholders of Kinross for the year ended December 31, 2014 was $1,166.5 million (year ended December 31, 2013 - $3,742.7 million). Loss per share has been calculated using the weighted average number of common shares and common share equivalents issued and outstanding during the period. Stock options and common share purchase warrants are reflected in diluted earnings per share by application of the treasury method. The following table details the weighted average number of outstanding common shares for the purpose of computing basic and diluted earnings (loss) per common share for the following periods:
(a) Dilutive stock options and warrants were determined using the Company’s average share price for the year. For the years ended
December 31, 2014 and 2013, the average share price used was $3.89 and $6.01, respectively. (b) These adjustments were excluded, as they are anti-dilutive.
(Number of common shares in thousands)
2014 2013
Basic weighted average shares outstanding: 1,144,287 1,142,109
Weighted average shares dilution adjustments:
Share options (a) - -
Restricted shares - -
Restricted performance shares - -
Diluted weighted average shares outstanding 1,144,287 1,142,109
Weighted average shares dilution adjustments - exclusions: (b)
Share options 15,728 15,227
Restricted shares 6,311 4,906
Restricted performance shares 2,486 1,408
Common share purchase warrants - 25,759
Convertible senior notes - 15,515
Years ended December 31,
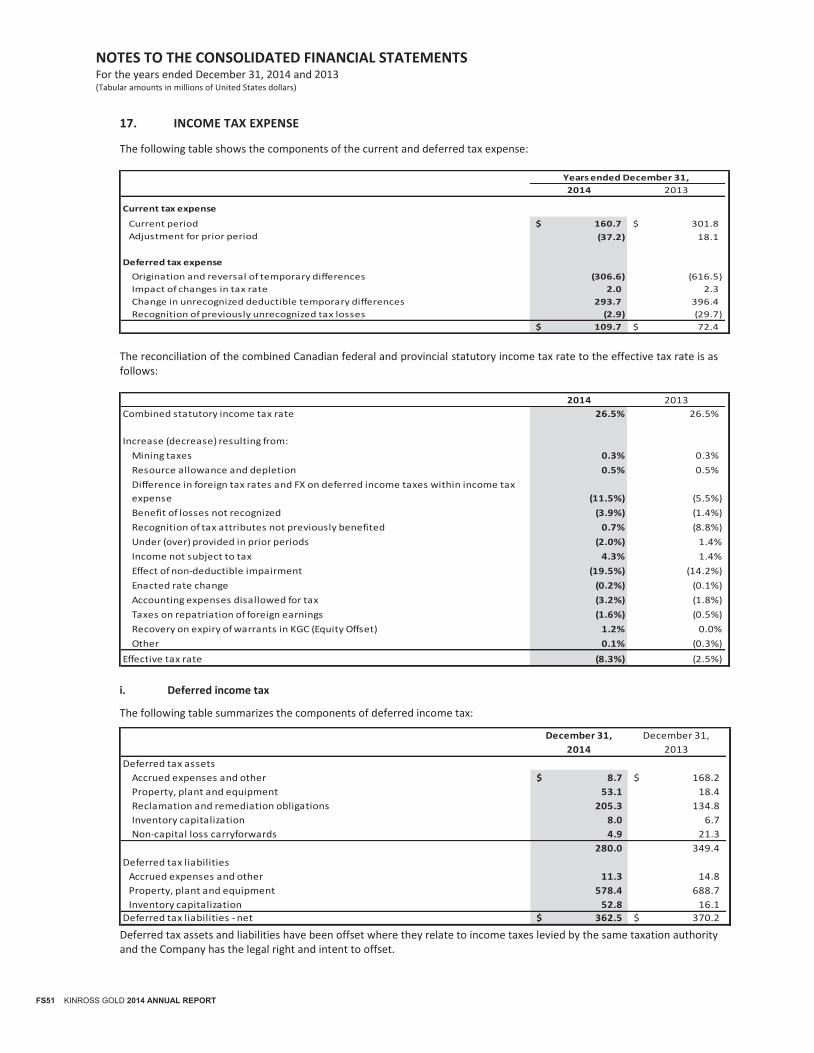
NOTES TO THE CONSOLIDATED FINANCIAL STATEMENTS For the years ended December 31, 2014 and 2013 (Tabular amounts in millions of United States dollars)
FS51 KINROSS GOLD 2014 ANNUAL REPORT
17. INCOME TAX EXPENSE
The following table shows the components of the current and deferred tax expense:
The reconciliation of the combined Canadian federal and provincial statutory income tax rate to the effective tax rate is as follows:
i. Deferred income tax
The following table summarizes the components of deferred income tax:
Deferred tax assets and liabilities have been offset where they relate to income taxes levied by the same taxation authority and the Company has the legal right and intent to offset.
2014 2013
Current tax expense
Current period 160.7$ 301.8$
Adjustment for prior period (37.2) 18.1
Deferred tax expense
Origination and reversal of temporary differences (306.6) (616.5)
Impact of changes in tax rate 2.0 2.3
Change in unrecognized deductible temporary differences 293.7 396.4
Recognition of previously unrecognized tax losses (2.9) (29.7)
109.7$ 72.4$
Years ended December 31,
2014 2013
Combined statutory income tax rate 26.5% 26.5%
Increase (decrease) resulting from:
Mining taxes 0.3% 0.3%
Resource allowance and depletion 0.5% 0.5%
(11.5%) (5.5%)
Benefit of losses not recognized (3.9%) (1.4%)
0.7% (8.8%)
Under (over) provided in prior periods (2.0%) 1.4%
Income not subject to tax 4.3% 1.4%
Effect of non-deductible impairment (19.5%) (14.2%)
Enacted rate change (0.2%) (0.1%)
Accounting expenses disallowed for tax (3.2%) (1.8%)
Taxes on repatriation of foreign earnings (1.6%) (0.5%)
Recovery on expiry of warrants in KGC (Equity Offset) 1.2% 0.0%
Other 0.1% (0.3%)
Effective tax rate (8.3%) (2.5%)
Difference in foreign tax rates and FX on deferred income taxes within income tax
expense
Recognition of tax attributes not previously benefited
December 31,
2014
December 31,
2013
Deferred tax assets
Accrued expenses and other 8.7$ 168.2$
Property, plant and equipment 53.1 18.4
Reclamation and remediation obligations 205.3 134.8
Inventory capitalization 8.0 6.7
Non-capital loss carryforwards 4.9 21.3
280.0 349.4
Deferred tax liabilities
Accrued expenses and other 11.3 14.8
Property, plant and equipment 578.4 688.7
Inventory capitalization 52.8 16.1
Deferred tax liabilities - net 362.5$ 370.2$
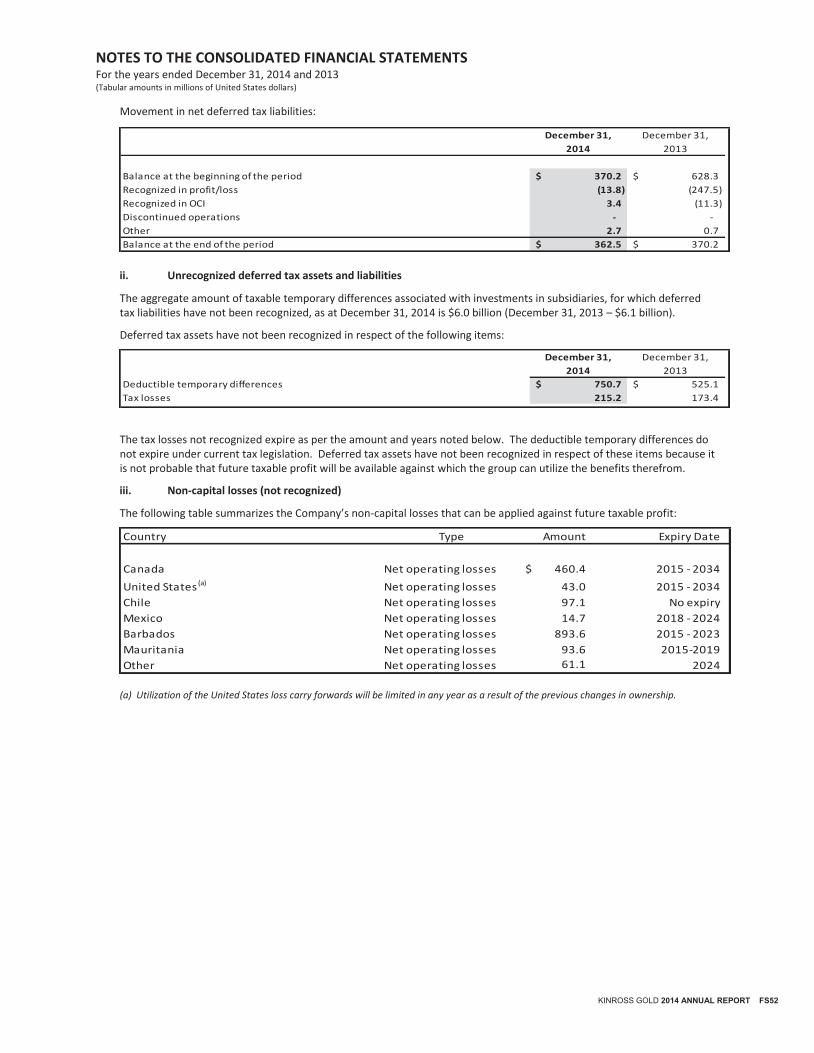
NOTES TO THE CONSOLIDATED FINANCIAL STATEMENTS For the years ended December 31, 2014 and 2013 (Tabular amounts in millions of United States dollars)
KINROSS GOLD 2014 ANNUAL REPORT FS52
Movement in net deferred tax liabilities:
ii. Unrecognized deferred tax assets and liabilities
The aggregate amount of taxable temporary differences associated with investments in subsidiaries, for which deferred tax liabilities have not been recognized, as at December 31, 2014 is $6.0 billion (December 31, 2013 – $6.1 billion).
Deferred tax assets have not been recognized in respect of the following items:
The tax losses not recognized expire as per the amount and years noted below. The deductible temporary differences do not expire under current tax legislation. Deferred tax assets have not been recognized in respect of these items because it is not probable that future taxable profit will be available against which the group can utilize the benefits therefrom.
iii. Non-capital losses (not recognized)
The following table summarizes the Company’s non-capital losses that can be applied against future taxable profit:
(a) Utilization of the United States loss carry forwards will be limited in any year as a result of the previous changes in ownership.
December 31,
2014
December 31,
2013
Balance at the beginning of the period 370.2$ 628.3$
Recognized in profit/loss (13.8) (247.5)
Recognized in OCI 3.4 (11.3)
Discontinued operations - -
Other 2.7 0.7
Balance at the end of the period 362.5$ 370.2$
December 31,
2014
December 31,
2013
Deductible temporary differences 750.7$ 525.1$
Tax losses 215.2 173.4
Country Type Amount Expiry Date
Canada Net operating losses $ 460.4 2015 - 2034
United States (a) Net operating losses 43.0 2015 - 2034
Chile Net operating losses 97.1 No expiry
Mexico Net operating losses 14.7 2018 - 2024
Barbados Net operating losses 893.6 2015 - 2023
Mauritania Net operating losses 93.6 2015-2019
Other Net operating losses 61.1 2024

NOTES TO THE CONSOLIDATED FINANCIAL STATEMENTS For the years ended December 31, 2014 and 2013 (Tabular amounts in millions of United States dollars)
FS53 KINROSS GOLD 2014 ANNUAL REPORT
18. SEGMENTED INFORMATION
The Company operates primarily in the gold mining industry and its major product is gold. Its activities include gold production, acquisition, exploration and development of gold properties. The Company’s primary mining operations are in the United States, the Russian Federation, Brazil, Chile, Ghana and Mauritania. The reportable segments are those operations whose operating results are reviewed by the Chief Executive Officer to make decisions about resources to be allocated to the segment and assess its performance provided those operations pass certain quantitative thresholds. Operations whose revenues, earnings or losses or assets exceed 10% of the total consolidated revenue, earnings or losses or assets are reportable segments. In order to determine reportable operating segments, management reviewed various factors, including geographical location and managerial structure. It was determined by management that a reportable operating segment consists of an individual mining property managed by a single general manager and management team. Certain properties that are in development or have not reached commercial production levels are considered reportable segments because they have reached quantitative thresholds. These have been identified as non-operating segments. Finance income, finance expense, other income (expense) – net, and equity in earnings (losses) of associate and joint venture are managed on a consolidated basis and are not allocated to operating segments. Non-mining and other operations are reported in Corporate and other. On June 10, 2013, the Company announced that it would not proceed with further development of the FDN project in Ecuador. Kinross' decision to cease the development of FDN resulted in an impairment charge of $720.0 million in the second quarter of 2013. As a result, FDN was no longer a reportable segment, and was considered a discontinued operation from that date. On December 17, 2014, the Company sold its interest in FDN. See Note 6.
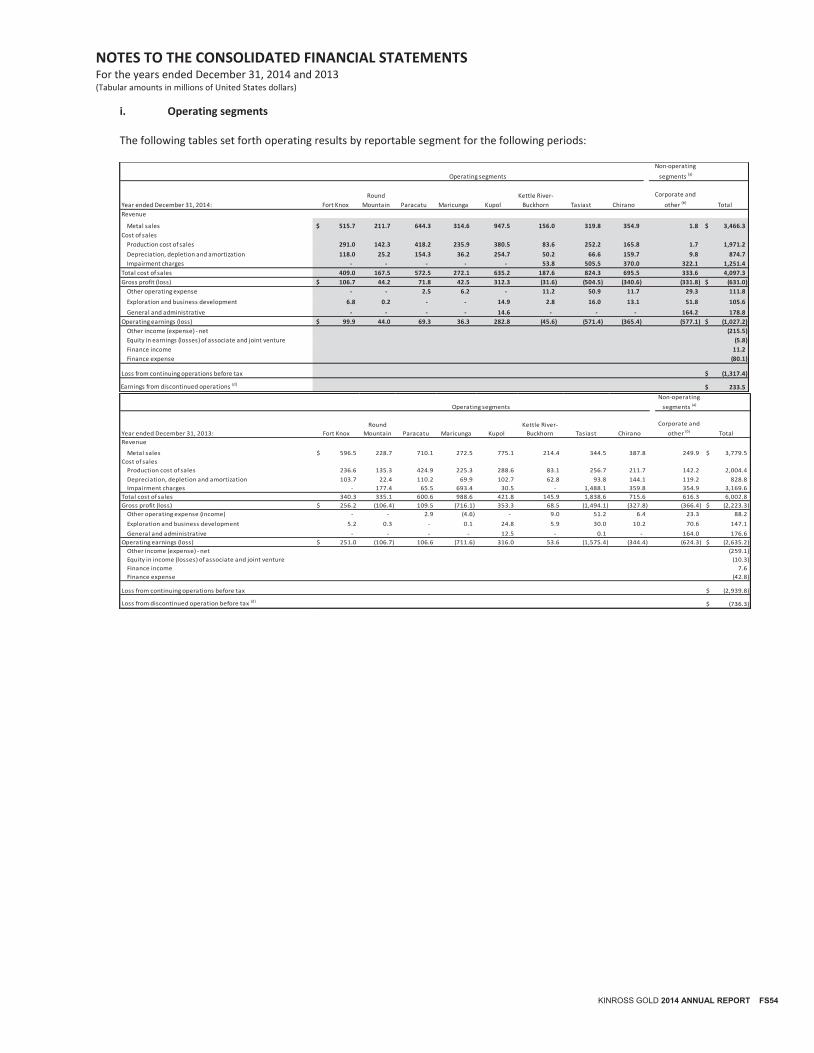
NOTES TO THE CONSOLIDATED FINANCIAL STATEMENTS For the years ended December 31, 2014 and 2013 (Tabular amounts in millions of United States dollars)
KINROSS GOLD 2014 ANNUAL REPORT FS54
i. Operating segments The following tables set forth operating results by reportable segment for the following periods:
Non-operating
segments (a)
Year ended December 31, 2014: Fort Knox
Round
Mountain Paracatu Maricunga Kupol
Kettle River-
Buckhorn Tasiast Chirano
Corporate and
other (b) Total
Revenue
Metal sales 515.7$ 211.7 644.3 314.6 947.5 156.0 319.8 354.9 1.8 3,466.3$
Cost of sales
Production cost of sales 291.0 142.3 418.2 235.9 380.5 83.6 252.2 165.8 1.7 1,971.2
Depreciation, depletion and amortization 118.0 25.2 154.3 36.2 254.7 50.2 66.6 159.7 9.8 874.7
Impairment charges - - - - - 53.8 505.5 370.0 322.1 1,251.4
Total cost of sales 409.0 167.5 572.5 272.1 635.2 187.6 824.3 695.5 333.6 4,097.3
Gross profit (loss) 106.7$ 44.2 71.8 42.5 312.3 (31.6) (504.5) (340.6) (331.8) (631.0)$
Other operating expense - - 2.5 6.2 - 11.2 50.9 11.7 29.3 111.8
Exploration and business development 6.8 0.2 - - 14.9 2.8 16.0 13.1 51.8 105.6
General and administrative - - - - 14.6 - - - 164.2 178.8
Operating earnings (loss) 99.9$ 44.0 69.3 36.3 282.8 (45.6) (571.4) (365.4) (577.1) (1,027.2)$
Other income (expense) - net (215.5)
Equity in earnings (losses) of associate and joint venture (5.8)
Finance income 11.2
Finance expense (80.1)
Loss from continuing operations before tax (1,317.4)$
Earnings from discontinued operations (d)233.5$
Operating segments
Non-operating
segments (a)
Year ended December 31, 2013: Fort Knox
Round
Mountain Paracatu Maricunga Kupol
Kettle River-
Buckhorn Tasiast Chirano
Corporate and
other (b) Total
Revenue
Metal sales 596.5$ 228.7 710.1 272.5 775.1 214.4 344.5 387.8 249.9 3,779.5$
Cost of sales
Production cost of sales 236.6 135.3 424.9 225.3 288.6 83.1 256.7 211.7 142.2 2,004.4
Depreciation, depletion and amortization 103.7 22.4 110.2 69.9 102.7 62.8 93.8 144.1 119.2 828.8
Impairment charges - 177.4 65.5 693.4 30.5 - 1,488.1 359.8 354.9 3,169.6
Total cost of sales 340.3 335.1 600.6 988.6 421.8 145.9 1,838.6 715.6 616.3 6,002.8
Gross profit (loss) 256.2$ (106.4) 109.5 (716.1) 353.3 68.5 (1,494.1) (327.8) (366.4) (2,223.3)$
Other operating expense (income) - - 2.9 (4.6) - 9.0 51.2 6.4 23.3 88.2
Exploration and business development 5.2 0.3 - 0.1 24.8 5.9 30.0 10.2 70.6 147.1
General and administrative - - - - 12.5 - 0.1 - 164.0 176.6
Operating earnings (loss) 251.0$ (106.7) 106.6 (711.6) 316.0 53.6 (1,575.4) (344.4) (624.3) (2,635.2)$
Other income (expense) - net (259.1)
Equity in income (losses) of associate and joint venture (10.3)
Finance income 7.6
Finance expense (42.8)
Loss from continuing operations before tax (2,939.8)$
Loss from discontinued operation before tax (d)(736.3)$
Operating segments

NOTES TO THE CONSOLIDATED FINANCIAL STATEMENTS For the years ended December 31, 2014 and 2013 (Tabular amounts in millions of United States dollars)
FS55 KINROSS GOLD 2014 ANNUAL REPORT
(a) Non-operating segments include development properties. (b) Corporate and other includes corporate, Cerro Casale, shutdown and other non-operating assets (including La Coipa (as of January 1, 2014), Lobo-Marte and White Gold). The comparative figures have been reclassified to conform to the December 31, 2014 segment presentation. (c) Segmented capital expenditures are presented on an accrual basis. Additions to property, plant and equipment in the consolidated statements of cash flows are presented on a cash basis. (d) On June 10, 2013, the Company announced that it would not proceed with further development of the FDN project in Ecuador. On December 17, 2014, the Company sold its interest in Aurelian Resources Inc. and the FDN Project. See Note 6.
ii. Geographic segments
The following table shows metal sales and property, plant and equipment by geographic region:
(a) Geographic location is determined based on location of the mining assets.
Fort Knox
Round
Mountain Paracatu Maricunga Kupol
Kettle River-
Buckhorn Tasiast Chirano
Corporate and
other (b)
Discontinued
Operation (d) Total
Property, plant and equipment at:
December 31, 2014 467.0$ 189.1 1,806.2 138.0 990.2 11.7 809.5 634.4 363.3 - 5,409.4$
Total assets at:
December 31, 2014 703.3$ 262.0 2,058.7 416.4 1,956.6 38.9 1,465.4 796.9 1,253.2 - 8,951.4$
Capital expenditures for year ended December 31, 2014 (c)85.2$ 44.3 105.0 29.7 87.9 6.4 147.7 61.1 38.4 - 605.7$
Operating segments Non-operating segments (a)
Fort Knox
Round
Mountain Paracatu Maricunga Kupol
Kettle River-
Buckhorn Tasiast Chirano
Corporate and
other (b)
Discontinued
Operation (d) Total
Property, plant and equipment at:
December 31, 2013 486.0$ 164.8 1,863.3 135.8 1,163.0 54.4 1,082.1 1,085.0 548.3 - 6,582.7$
Total assets at:
December 31, 2013 721.9$ 230.2 2,113.6 342.0 2,262.1 102.8 1,669.2 1,251.6 1,591.4 1.9 10,286.7$
Capital expenditures for year ended December 31, 2013 (c)137.6$ 63.2 152.8 57.8 117.1 8.4 729.7 96.0 33.1 14.3 1,410.0$
Operating segments Non-operating segments (a)
2014 2013 2014 2013
Geographic information (a)
United States 883.4$ 1,039.6$ 672.2$ 710.1$
Russian Federation 947.5 775.1 990.2 1,163.0
Brazil 644.3 710.1 1,810.2 1,867.3
Chile 316.4 522.4 391.3 477.3
Mauritania 319.8 344.5 814.8 1,091.7
Ghana 354.9 387.8 643.6 1,104.9
Canada - - 87.1 168.4
Total 3,466.3$ 3,779.5$ 5,409.4$ 6,582.7$
Metal sales Property, plant and equipment
Years ended December 31, As at December 31,
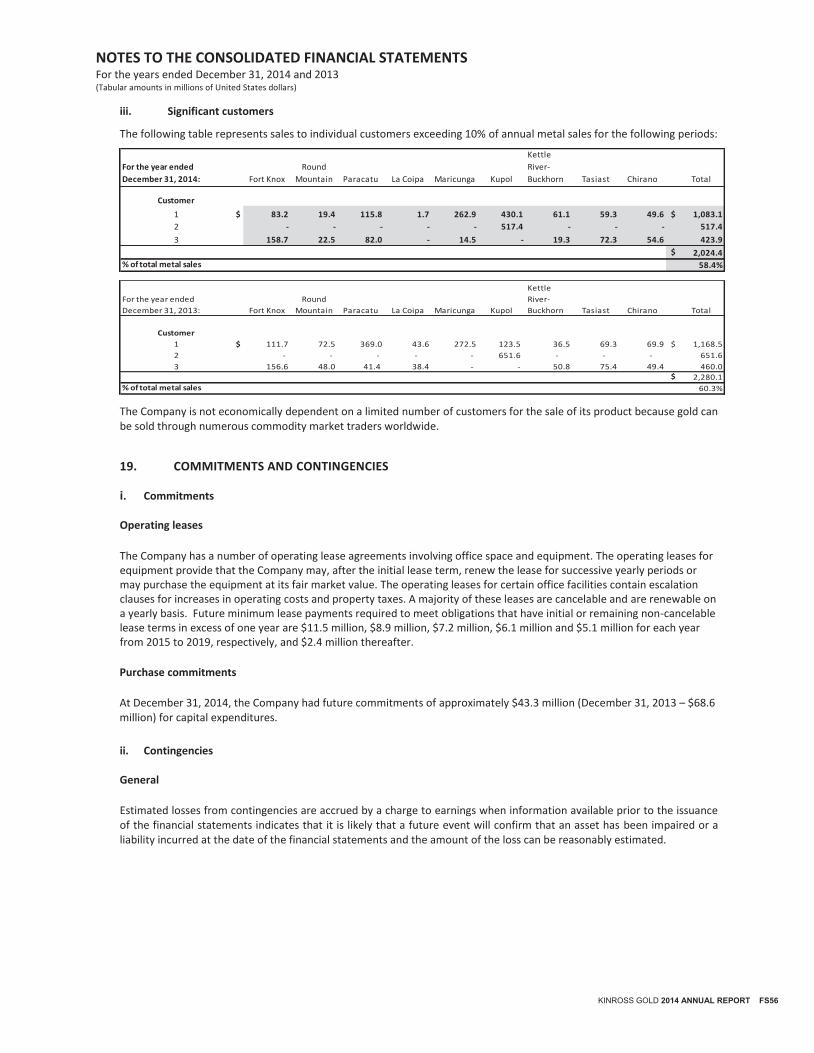
NOTES TO THE CONSOLIDATED FINANCIAL STATEMENTS For the years ended December 31, 2014 and 2013 (Tabular amounts in millions of United States dollars)
KINROSS GOLD 2014 ANNUAL REPORT FS56
iii. Significant customers
The following table represents sales to individual customers exceeding 10% of annual metal sales for the following periods:
The Company is not economically dependent on a limited number of customers for the sale of its product because gold can be sold through numerous commodity market traders worldwide.
19. COMMITMENTS AND CONTINGENCIES i. Commitments Operating leases
The Company has a number of operating lease agreements involving office space and equipment. The operating leases for equipment provide that the Company may, after the initial lease term, renew the lease for successive yearly periods or may purchase the equipment at its fair market value. The operating leases for certain office facilities contain escalation clauses for increases in operating costs and property taxes. A majority of these leases are cancelable and are renewable on a yearly basis. Future minimum lease payments required to meet obligations that have initial or remaining non-cancelable lease terms in excess of one year are $11.5 million, $8.9 million, $7.2 million, $6.1 million and $5.1 million for each year from 2015 to 2019, respectively, and $2.4 million thereafter.
Purchase commitments
At December 31, 2014, the Company had future commitments of approximately $43.3 million (December 31, 2013 – $68.6 million) for capital expenditures.
ii. Contingencies General
Estimated losses from contingencies are accrued by a charge to earnings when information available prior to the issuance of the financial statements indicates that it is likely that a future event will confirm that an asset has been impaired or a liability incurred at the date of the financial statements and the amount of the loss can be reasonably estimated.
For the year ended
December 31, 2014: Fort Knox
Round
Mountain Paracatu La Coipa Maricunga Kupol
Kettle
River-
Buckhorn Tasiast Chirano Total
Customer
1 $ 83.2 19.4 115.8 1.7 262.9 430.1 61.1 59.3 49.6 $ 1,083.1
2 - - - - - 517.4 - - - 517.4
3 158.7 22.5 82.0 - 14.5 - 19.3 72.3 54.6 423.9
$ 2,024.4
% of total metal sales 58.4%
For the year ended
December 31, 2013: Fort Knox
Round
Mountain Paracatu La Coipa Maricunga Kupol
Kettle
River-
Buckhorn Tasiast Chirano Total
Customer
1 $ 111.7 72.5 369.0 43.6 272.5 123.5 36.5 69.3 69.9 $ 1,168.5
2 - - - - - 651.6 - - - 651.6
3 156.6 48.0 41.4 38.4 - - 50.8 75.4 49.4 460.0$ 2,280.1
% of total metal sales 60.3%
NOTES TO THE CONSOLIDATED FINANCIAL STATEMENTS For the years ended December 31, 2014 and 2013 (Tabular amounts in millions of United States dollars)
FS57 KINROSS GOLD 2014 ANNUAL REPORT
Cerro Casale contingency
The Company is obligated to pay $20 million to Barrick if a positive production decision is made relating to the Cerro Casale project. Other legal matters
The Company is from time to time involved in legal proceedings, arising in the ordinary course of its business. Typically, and currently, except in the case of the actions described below, the amount of ultimate liability with respect to these actions will not, in the opinion of management, materially affect Kinross' financial position, results of operations or cash flows. A putative securities class action complaint was filed on February 16, 2012 (the “U.S. Complaint”), entitled Bo Young Cha v. Kinross Gold Corporation et al., in the United States District Court for the Southern District of New York (the “Court”). The U.S. Complaint named as defendants the Company, Tye Burt, former President and CEO, Paul Barry, former Executive Vice President and Chief Financial Officer, Glen Masterman, former Senior Vice President, Exploration and Kenneth Thomas, former Senior Vice President, Projects. On May 31, 2012, the Court selected the City of Austin Police Retirement System (“City of Austin”) to be lead plaintiff. Pursuant to an order of the Court, City of Austin filed an amended Complaint on July 23, 2012 (the “Amended U.S. Complaint”). The Amended U.S. Complaint alleges among other things, that, between August 2, 2010 and January 17, 2012, the defendants inflated Kinross’ share price by knowingly or recklessly making material misrepresentations concerning (i) the extent and quality of the due diligence Kinross performed prior to its acquisition of Red Back and (ii) Kinross’ schedule for developing the Tasiast mine. The defendants filed a motion to dismiss the Amended U.S. Complaint on September 7, 2012 and oral argument on the motion to dismiss took place on November 30, 2012. On March 22, 2013, the Court issued an order (the “Order”) granting in part and denying in part the defendants’ motion to dismiss the Amended U.S. Complaint. The Order granted the defendants’ motion to dismiss with respect to all claims based on (a) Kinross’ disclosures about its due diligence for the Red Back acquisition, and (b) Kinross’ disclosures before August 10, 2011 about the Tasiast development schedule. The Order denied the defendants’ motion to dismiss City of Austin’s allegations that the defendants made misleading statements about the Tasiast development schedule between August 10, 2011 and January 17, 2012. On April 5, 2013, the defendants filed a motion asking the Court to reconsider the portions of the Order allowing the City of Austin’s claims to proceed. On April 8, 2013, the Court (i) directed the City of Austin to respond to the defendants’ motion for reconsideration by April 19, 2013, and (ii) stated that it will wait until after its ruling on defendants’ motion for reconsideration before entering a case management schedule governing any future proceedings in the lawsuit. The City of Austin filed a response on April 19, 2013 and the defendants filed a reply on May 1, 2013. On June 6, 2013 the Court issued an opinion and order denying the defendants’ motion for reconsideration. On July 8, 2013 the defendants filed their answer to the Amended U.S. Complaint. The parties have completed the initial fact discovery phase of litigation, which included the production of information and documents and the oral depositions of witnesses. The parties have completed the submission of written arguments and supporting expert reports in respect of the plaintiffs’ Application for Class Certification, which is expected to be heard and decided in the first quarter of 2015. Should the plaintiffs’ application be successful, submissions in respect of the defendants’ Motion on Summary Judgment are expected to be made in the first half of 2015, with a hearing and decision expected in the second half of 2015. The defendants intend to vigorously defend against the surviving claims of the Amended U.S. Complaint and believe they are without merit. A notice of action in a proposed class proceeding under Ontario’s Class Proceedings Act, 1992, was filed in the Ontario Superior Court of Justice (the “Ontario Court”) on March 12, 2012, entitled Trustees of the Musicians’ Pension Fund of Canada v. Kinross Gold Corporation et al. (the “Ontario Action”). A statement of claim in the Ontario Action was subsequently served on April 11, 2012. The Ontario Action named as defendants the Company, Tye Burt, former President and CEO, Paul Barry, former Executive Vice President and Chief Financial Officer, Glen Masterman, former Senior Vice President, Exploration, and Kenneth Thomas, former Senior Vice President, Projects. The Ontario Action alleges, among other things, that Kinross made a number of misrepresentations relating to the quantity and quality of gold ore at the Tasiast mine and the costs of operating the mine, and that Kinross and the individual defendants knew that such misrepresentations were false or misleading when made. In a motion to the Ontario Court, the plaintiffs sought certification of the action as a class proceeding and leave to proceed under the statutory civil liability provisions of Ontario’s Securities Act. In their written argument on the motion, the plaintiffs also sought leave and certification of a claim based on allegations that Kinross made a number of misrepresentations relating to the schedule for the Tasiast expansion project, and that Kinross and the individual defendants knew that such misrepresentations were false or misleading when made. These claims were added to the plaintiffs’ statement of claim in January 2014. A hearing on the plaintiffs’ leave and certification motions was held from October 22–24, 2013. On November 5, 2013, the Ontario Court issued Reasons For Decision dismissing the leave motion in respect of the statutory claims and dismissing the certification motion in respect of both the statutory claims and the
NOTES TO THE CONSOLIDATED FINANCIAL STATEMENTS For the years ended December 31, 2014 and 2013 (Tabular amounts in millions of United States dollars)
KINROSS GOLD 2014 ANNUAL REPORT FS58
common law negligent misrepresentation claims. The plaintiffs appealed the Order of the Ontario Court to the Ontario Court of Appeal. The plaintiffs’ appeal was dismissed in its entirety by the Ontario Court of Appeal on December 17, 2014. The plaintiffs are entitled to seek leave to appeal the Court of Appeal’s decision to the Supreme Court of Canada. To date, the plaintiffs have not delivered an application for leave to appeal to the Supreme Court of Canada, although Kinross believes that the plaintiffs will do so. Kinross believes that the claims are without merit and intends to continue to vigorously defend against them. Income taxes
The Company operates in numerous countries around the world and accordingly is subject to, and pays, annual income taxes under the various regimes in countries in which it operates. These tax regimes are determined under general corporate income tax laws of the country. The Company has historically filed, and continues to file, all required income tax returns and to pay the taxes reasonably determined to be due. The tax rules and regulations in many countries are complex and subject to interpretation. Changes in tax law or changes in the way that tax law is interpreted may also impact the Company’s effective tax rate as well as its business and operations. From time to time the Company will undergo a review of its historic tax returns and in connection with such reviews disputes can arise with the taxing authorities over the Company’s interpretation of the country’s income tax rules.
20. RELATED PARTY TRANSACTIONS
There were no material related party transactions in 2014 and 2013 other than compensation of key management personnel.
Key management personnel
Compensation of key management personnel of the Company is as follows:
Key management personnel are defined as the Senior Leadership Team and members of the Board of Directors.
21. CONSOLIDATING FINANCIAL STATEMENTS The obligations of the Company under the notes are guaranteed by the following 100% owned subsidiaries of the Company (the “guarantor subsidiaries”): Round Mountain Gold Corporation, Kinross Brasil Mineração S.A., BGO (Bermuda) Ltd., Crown Resources Corporation, Fairbanks Gold Mining, Inc., Melba Creek Mining, Inc., Compania Minera Mantos de Oro, Compania Minera Maricunga, Red Back Mining Inc., and Red Back Mining Mauritania No. 2 Ltd. All guarantees by the guarantor subsidiaries are joint and several, and full and unconditional; subject to certain customary release provisions contained in the indenture governing the senior notes. On December 17, 2014, the Company sold all of its interest in Aurelian Resources Inc., previously a guarantor of the notes. As a result, Aurelian Resources Inc. was released in December 2014 as a guarantor, in accordance with release provisions of the Indenture. The following tables contain separate financial information related to the guarantor subsidiaries as set out in the consolidating balance sheets as at December 31, 2014 and December 31, 2013 and the consolidating statements of operations, statements of comprehensive loss and statements of cash flows for the years ended December 31, 2014 and 2013. For purposes of this information, the financial statements of Kinross Gold Corporation and of the guarantor subsidiaries reflect investments in subsidiary companies on an equity accounting basis.
2014 2013
Cash compensation - Salaries, short term incentives, and other benefits 9.4$ 10.7$
Long term incentives, including share-based payments 11.8 11.7
Termination and post-retirement benefits 4.8 3.0
Total compensation paid to key management personnel 26.0$ 25.4$
Years ended December 31,
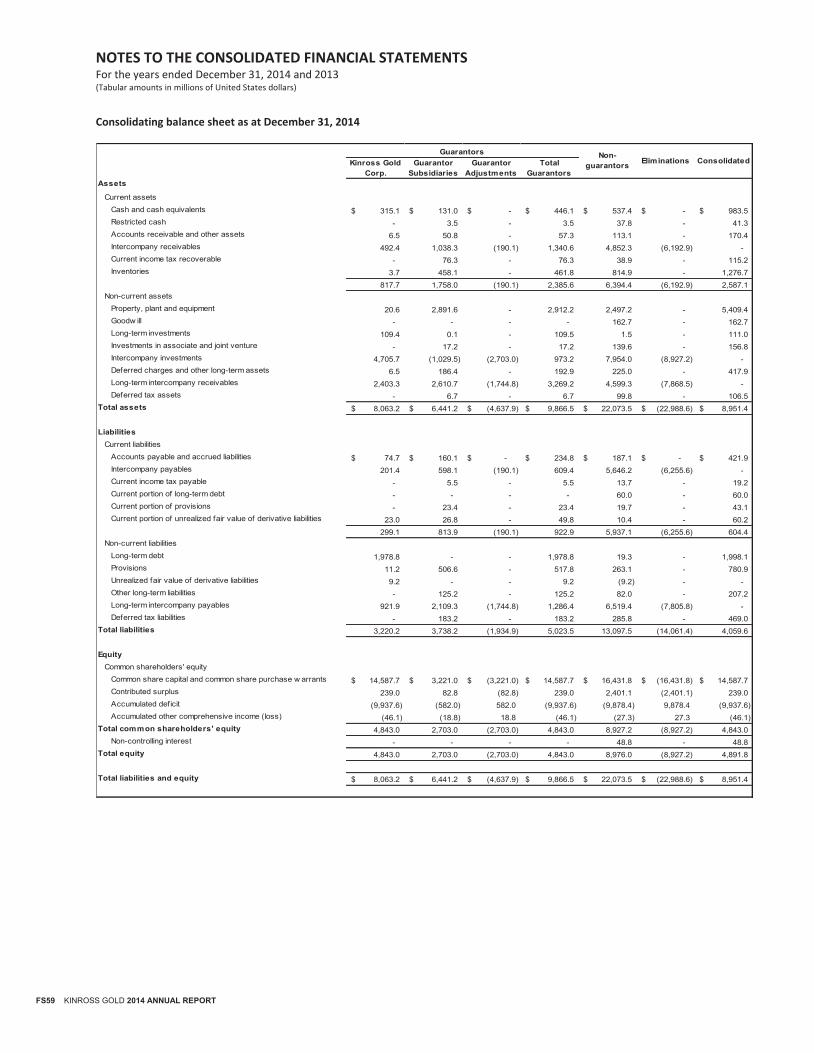
NOTES TO THE CONSOLIDATED FINANCIAL STATEMENTS For the years ended December 31, 2014 and 2013 (Tabular amounts in millions of United States dollars)
FS59 KINROSS GOLD 2014 ANNUAL REPORT
Consolidating balance sheet as at December 31, 2014
Kinross Gold Corp.
Guarantor Subsidiaries
Guarantor Adjustments
TotalGuarantors
Assets
Current assetsCash and cash equivalents 315.1$ 131.0$ -$ 446.1$ 537.4$ -$ 983.5$ Restricted cash - 3.5 - 3.5 37.8 - 41.3 Accounts receivable and other assets 6.5 50.8 - 57.3 113.1 - 170.4 Intercompany receivables 492.4 1,038.3 (190.1) 1,340.6 4,852.3 (6,192.9) - Current income tax recoverable - 76.3 - 76.3 38.9 - 115.2 Inventories 3.7 458.1 - 461.8 814.9 - 1,276.7
817.7 1,758.0 (190.1) 2,385.6 6,394.4 (6,192.9) 2,587.1 Non-current assets
Property, plant and equipment 20.6 2,891.6 - 2,912.2 2,497.2 - 5,409.4 Goodw ill - - - - 162.7 - 162.7 Long-term investments 109.4 0.1 - 109.5 1.5 - 111.0 Investments in associate and joint venture - 17.2 - 17.2 139.6 - 156.8 Intercompany investments 4,705.7 (1,029.5) (2,703.0) 973.2 7,954.0 (8,927.2) - Deferred charges and other long-term assets 6.5 186.4 - 192.9 225.0 - 417.9 Long-term intercompany receivables 2,403.3 2,610.7 (1,744.8) 3,269.2 4,599.3 (7,868.5) - Deferred tax assets - 6.7 - 6.7 99.8 - 106.5
Total assets 8,063.2$ 6,441.2$ (4,637.9)$ 9,866.5$ 22,073.5$ (22,988.6)$ 8,951.4$
LiabilitiesCurrent liabilities
Accounts payable and accrued liabilities 74.7$ 160.1$ -$ 234.8$ 187.1$ -$ 421.9$ Intercompany payables 201.4 598.1 (190.1) 609.4 5,646.2 (6,255.6) - Current income tax payable - 5.5 - 5.5 13.7 - 19.2 Current portion of long-term debt - - - - 60.0 - 60.0 Current portion of provisions - 23.4 - 23.4 19.7 - 43.1 Current portion of unrealized fair value of derivative liabilities 23.0 26.8 - 49.8 10.4 - 60.2
299.1 813.9 (190.1) 922.9 5,937.1 (6,255.6) 604.4 Non-current liabilities
Long-term debt 1,978.8 - - 1,978.8 19.3 - 1,998.1 Provisions 11.2 506.6 - 517.8 263.1 - 780.9 Unrealized fair value of derivative liabilities 9.2 - - 9.2 (9.2) - - Other long-term liabilities - 125.2 - 125.2 82.0 - 207.2 Long-term intercompany payables 921.9 2,109.3 (1,744.8) 1,286.4 6,519.4 (7,805.8) - Deferred tax liabilities - 183.2 - 183.2 285.8 - 469.0
Total liabilities 3,220.2 3,738.2 (1,934.9) 5,023.5 13,097.5 (14,061.4) 4,059.6
Equity Common shareholders' equity
Common share capital and common share purchase w arrants 14,587.7$ 3,221.0$ (3,221.0)$ 14,587.7$ 16,431.8$ (16,431.8)$ 14,587.7$ Contributed surplus 239.0 82.8 (82.8) 239.0 2,401.1 (2,401.1) 239.0 Accumulated deficit (9,937.6) (582.0) 582.0 (9,937.6) (9,878.4) 9,878.4 (9,937.6) Accumulated other comprehensive income (loss) (46.1) (18.8) 18.8 (46.1) (27.3) 27.3 (46.1)
Total common shareholders' equity 4,843.0 2,703.0 (2,703.0) 4,843.0 8,927.2 (8,927.2) 4,843.0 Non-controlling interest - - - - 48.8 - 48.8
Total equity 4,843.0 2,703.0 (2,703.0) 4,843.0 8,976.0 (8,927.2) 4,891.8
Total liabilities and equity 8,063.2$ 6,441.2$ (4,637.9)$ 9,866.5$ 22,073.5$ (22,988.6)$ 8,951.4$
Guarantors Non-guarantors Eliminations Consolidated
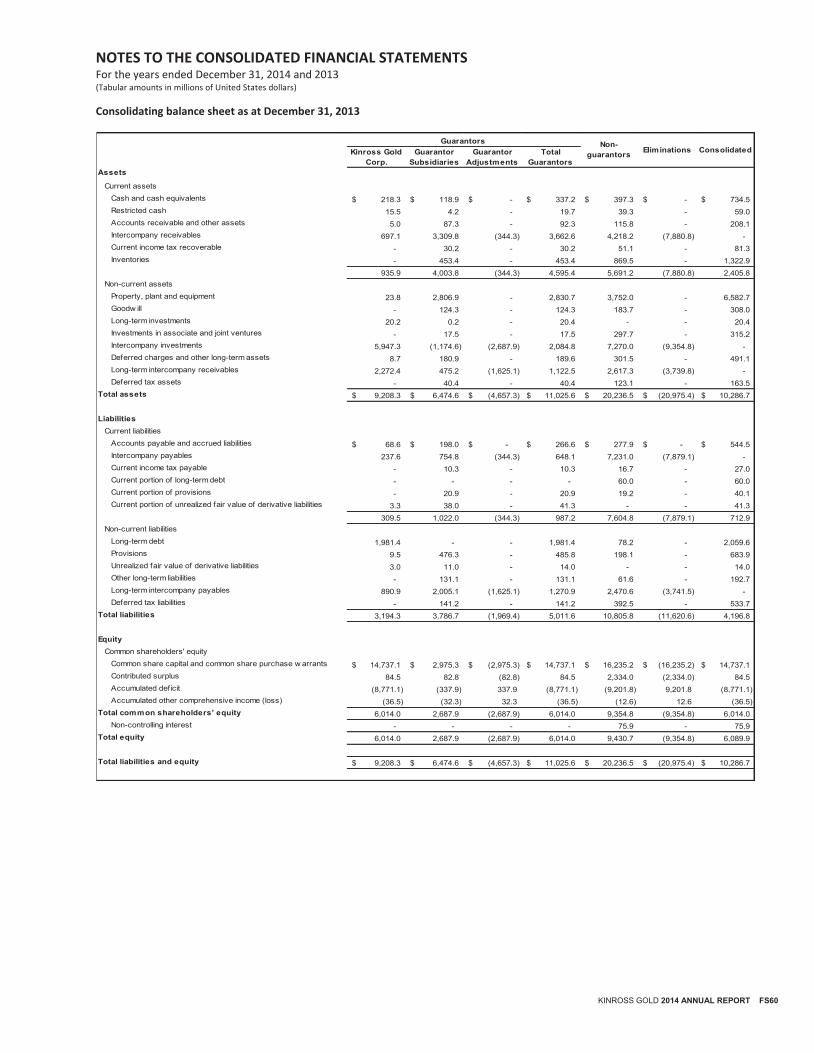
NOTES TO THE CONSOLIDATED FINANCIAL STATEMENTS For the years ended December 31, 2014 and 2013 (Tabular amounts in millions of United States dollars)
KINROSS GOLD 2014 ANNUAL REPORT FS60
Consolidating balance sheet as at December 31, 2013
Kinross Gold Corp.
Guarantor Subsidiaries
Guarantor Adjustments
TotalGuarantors
Assets
Current assetsCash and cash equivalents 218.3$ 118.9$ -$ 337.2$ 397.3$ -$ 734.5$ Restricted cash 15.5 4.2 - 19.7 39.3 - 59.0 Accounts receivable and other assets 5.0 87.3 - 92.3 115.8 - 208.1 Intercompany receivables 697.1 3,309.8 (344.3) 3,662.6 4,218.2 (7,880.8) - Current income tax recoverable - 30.2 - 30.2 51.1 - 81.3 Inventories - 453.4 - 453.4 869.5 - 1,322.9
935.9 4,003.8 (344.3) 4,595.4 5,691.2 (7,880.8) 2,405.8 Non-current assets
Property, plant and equipment 23.8 2,806.9 - 2,830.7 3,752.0 - 6,582.7 Goodw ill - 124.3 - 124.3 183.7 - 308.0 Long-term investments 20.2 0.2 - 20.4 - - 20.4 Investments in associate and joint ventures - 17.5 - 17.5 297.7 - 315.2 Intercompany investments 5,947.3 (1,174.6) (2,687.9) 2,084.8 7,270.0 (9,354.8) - Deferred charges and other long-term assets 8.7 180.9 - 189.6 301.5 - 491.1 Long-term intercompany receivables 2,272.4 475.2 (1,625.1) 1,122.5 2,617.3 (3,739.8) - Deferred tax assets - 40.4 - 40.4 123.1 - 163.5
Total assets 9,208.3$ 6,474.6$ (4,657.3)$ 11,025.6$ 20,236.5$ (20,975.4)$ 10,286.7$
LiabilitiesCurrent liabilities
Accounts payable and accrued liabilities 68.6$ 198.0$ -$ 266.6$ 277.9$ -$ 544.5$ Intercompany payables 237.6 754.8 (344.3) 648.1 7,231.0 (7,879.1) - Current income tax payable - 10.3 - 10.3 16.7 - 27.0 Current portion of long-term debt - - - - 60.0 - 60.0 Current portion of provisions - 20.9 - 20.9 19.2 - 40.1 Current portion of unrealized fair value of derivative liabilities 3.3 38.0 - 41.3 - - 41.3
309.5 1,022.0 (344.3) 987.2 7,604.8 (7,879.1) 712.9 Non-current liabilities
Long-term debt 1,981.4 - - 1,981.4 78.2 - 2,059.6 Provisions 9.5 476.3 - 485.8 198.1 - 683.9 Unrealized fair value of derivative liabilities 3.0 11.0 - 14.0 - - 14.0 Other long-term liabilities - 131.1 - 131.1 61.6 - 192.7 Long-term intercompany payables 890.9 2,005.1 (1,625.1) 1,270.9 2,470.6 (3,741.5) - Deferred tax liabilities - 141.2 - 141.2 392.5 - 533.7
Total liabilities 3,194.3 3,786.7 (1,969.4) 5,011.6 10,805.8 (11,620.6) 4,196.8
Equity Common shareholders' equity
Common share capital and common share purchase w arrants 14,737.1$ 2,975.3$ (2,975.3)$ 14,737.1$ 16,235.2$ (16,235.2)$ 14,737.1$ Contributed surplus 84.5 82.8 (82.8) 84.5 2,334.0 (2,334.0) 84.5 Accumulated deficit (8,771.1) (337.9) 337.9 (8,771.1) (9,201.8) 9,201.8 (8,771.1) Accumulated other comprehensive income (loss) (36.5) (32.3) 32.3 (36.5) (12.6) 12.6 (36.5)
Total common shareholders' equity 6,014.0 2,687.9 (2,687.9) 6,014.0 9,354.8 (9,354.8) 6,014.0 Non-controlling interest - - - - 75.9 - 75.9
Total equity 6,014.0 2,687.9 (2,687.9) 6,014.0 9,430.7 (9,354.8) 6,089.9
Total liabilities and equity 9,208.3$ 6,474.6$ (4,657.3)$ 11,025.6$ 20,236.5$ (20,975.4)$ 10,286.7$
Guarantors Non-guarantors Eliminations Consolidated
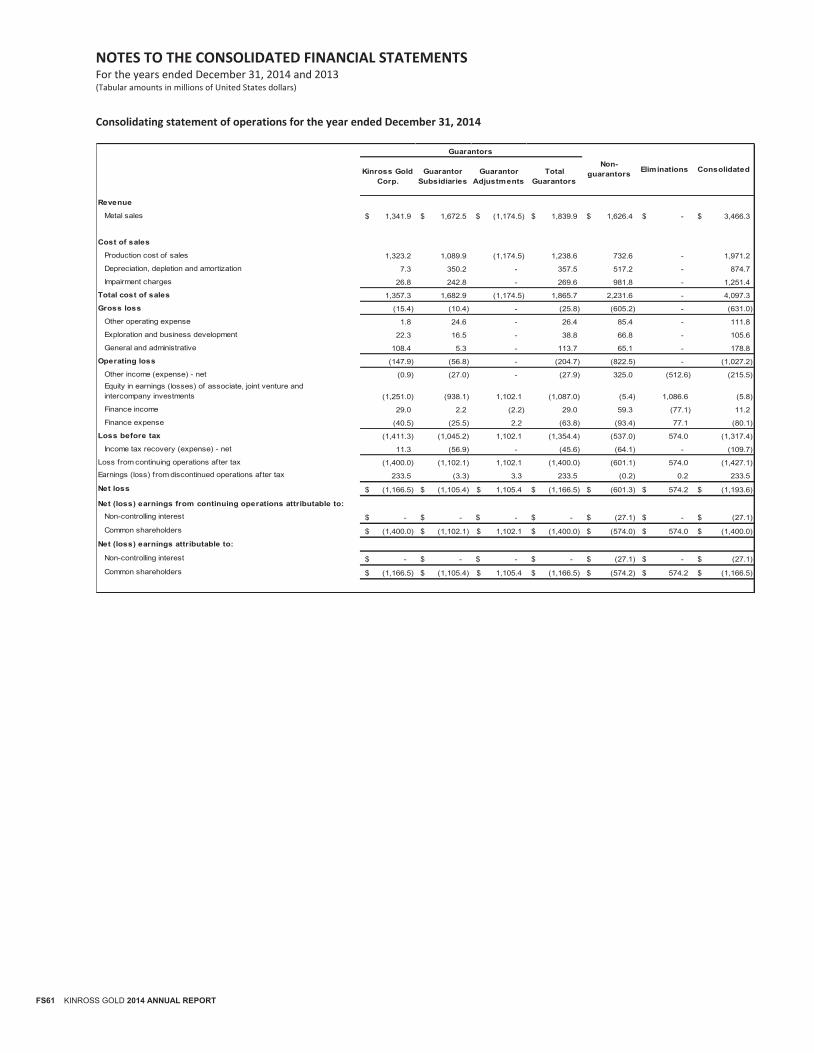
NOTES TO THE CONSOLIDATED FINANCIAL STATEMENTS For the years ended December 31, 2014 and 2013 (Tabular amounts in millions of United States dollars)
FS61 KINROSS GOLD 2014 ANNUAL REPORT
Consolidating statement of operations for the year ended December 31, 2014
Kinross Gold Corp.
Guarantor Subsidiaries
Guarantor Adjustments
TotalGuarantors
Revenue
Metal sales 1,341.9$ 1,672.5$ (1,174.5)$ 1,839.9$ 1,626.4$ -$ 3,466.3$
Cost of sales
Production cost of sales 1,323.2 1,089.9 (1,174.5) 1,238.6 732.6 - 1,971.2
Depreciation, depletion and amortization 7.3 350.2 - 357.5 517.2 - 874.7
Impairment charges 26.8 242.8 - 269.6 981.8 - 1,251.4
Total cost of sales 1,357.3 1,682.9 (1,174.5) 1,865.7 2,231.6 - 4,097.3
Gross loss (15.4) (10.4) - (25.8) (605.2) - (631.0)
Other operating expense 1.8 24.6 - 26.4 85.4 - 111.8
Exploration and business development 22.3 16.5 - 38.8 66.8 - 105.6
General and administrative 108.4 5.3 - 113.7 65.1 - 178.8
Operating loss (147.9) (56.8) - (204.7) (822.5) - (1,027.2)
Other income (expense) - net (0.9) (27.0) - (27.9) 325.0 (512.6) (215.5) Equity in earnings (losses) of associate, joint venture and intercompany investments (1,251.0) (938.1) 1,102.1 (1,087.0) (5.4) 1,086.6 (5.8)
Finance income 29.0 2.2 (2.2) 29.0 59.3 (77.1) 11.2
Finance expense (40.5) (25.5) 2.2 (63.8) (93.4) 77.1 (80.1)
Loss before tax (1,411.3) (1,045.2) 1,102.1 (1,354.4) (537.0) 574.0 (1,317.4)
Income tax recovery (expense) - net 11.3 (56.9) - (45.6) (64.1) - (109.7)
Loss from continuing operations after tax (1,400.0) (1,102.1) 1,102.1 (1,400.0) (601.1) 574.0 (1,427.1) Earnings (loss) from discontinued operations after tax 233.5 (3.3) 3.3 233.5 (0.2) 0.2 233.5
Net loss (1,166.5)$ (1,105.4)$ 1,105.4$ (1,166.5)$ (601.3)$ 574.2$ (1,193.6)$
Net (loss) earnings from continuing operations attributable to:Non-controlling interest -$ -$ -$ -$ (27.1)$ -$ (27.1)$
Common shareholders (1,400.0)$ (1,102.1)$ 1,102.1$ (1,400.0)$ (574.0)$ 574.0$ (1,400.0)$
Net (loss) earnings attributable to:
Non-controlling interest -$ -$ -$ -$ (27.1)$ -$ (27.1)$
Common shareholders (1,166.5)$ (1,105.4)$ 1,105.4$ (1,166.5)$ (574.2)$ 574.2$ (1,166.5)$
GuarantorsNon-
guarantors Eliminations Consolidated
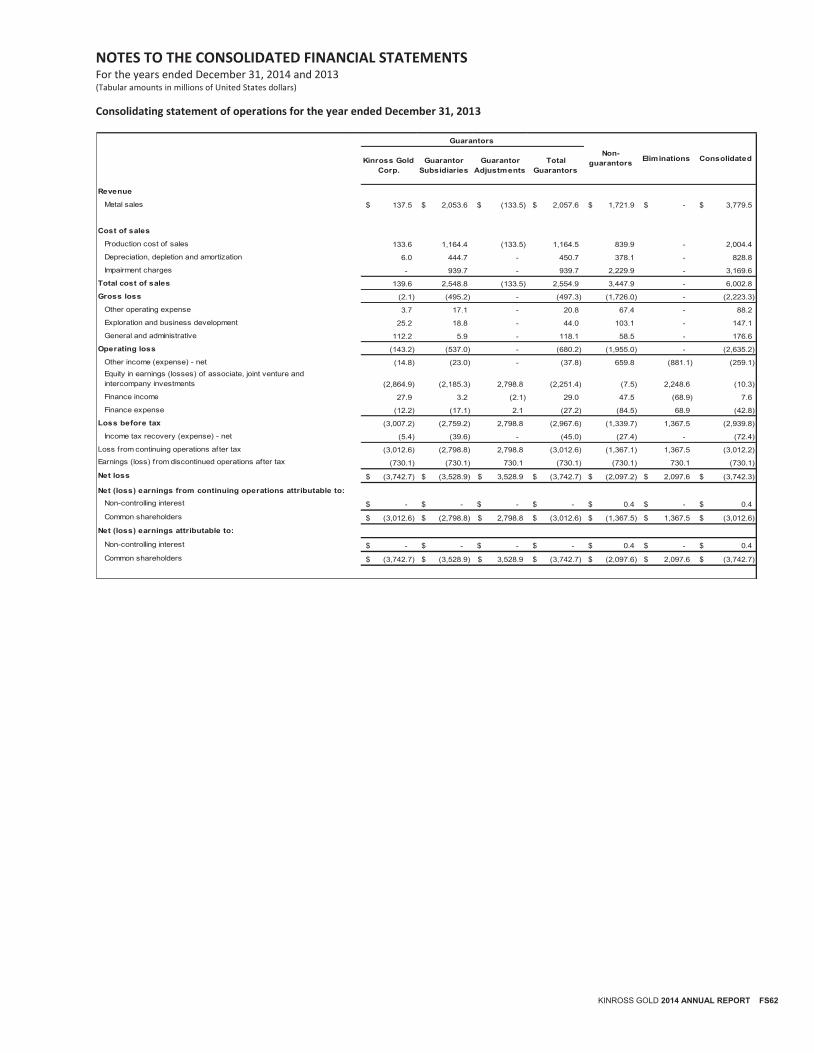
NOTES TO THE CONSOLIDATED FINANCIAL STATEMENTS For the years ended December 31, 2014 and 2013 (Tabular amounts in millions of United States dollars)
KINROSS GOLD 2014 ANNUAL REPORT FS62
Consolidating statement of operations for the year ended December 31, 2013
Kinross Gold Corp.
Guarantor Subsidiaries
Guarantor Adjustments
TotalGuarantors
Revenue
Metal sales 137.5$ 2,053.6$ (133.5)$ 2,057.6$ 1,721.9$ -$ 3,779.5$
Cost of sales
Production cost of sales 133.6 1,164.4 (133.5) 1,164.5 839.9 - 2,004.4
Depreciation, depletion and amortization 6.0 444.7 - 450.7 378.1 - 828.8
Impairment charges - 939.7 - 939.7 2,229.9 - 3,169.6
Total cost of sales 139.6 2,548.8 (133.5) 2,554.9 3,447.9 - 6,002.8
Gross loss (2.1) (495.2) - (497.3) (1,726.0) - (2,223.3)
Other operating expense 3.7 17.1 - 20.8 67.4 - 88.2
Exploration and business development 25.2 18.8 - 44.0 103.1 - 147.1
General and administrative 112.2 5.9 - 118.1 58.5 - 176.6
Operating loss (143.2) (537.0) - (680.2) (1,955.0) - (2,635.2)
Other income (expense) - net (14.8) (23.0) - (37.8) 659.8 (881.1) (259.1) Equity in earnings (losses) of associate, joint venture and intercompany investments (2,864.9) (2,185.3) 2,798.8 (2,251.4) (7.5) 2,248.6 (10.3)
Finance income 27.9 3.2 (2.1) 29.0 47.5 (68.9) 7.6
Finance expense (12.2) (17.1) 2.1 (27.2) (84.5) 68.9 (42.8)
Loss before tax (3,007.2) (2,759.2) 2,798.8 (2,967.6) (1,339.7) 1,367.5 (2,939.8)
Income tax recovery (expense) - net (5.4) (39.6) - (45.0) (27.4) - (72.4)
Loss from continuing operations after tax (3,012.6) (2,798.8) 2,798.8 (3,012.6) (1,367.1) 1,367.5 (3,012.2) Earnings (loss) from discontinued operations after tax (730.1) (730.1) 730.1 (730.1) (730.1) 730.1 (730.1)
Net loss (3,742.7)$ (3,528.9)$ 3,528.9$ (3,742.7)$ (2,097.2)$ 2,097.6$ (3,742.3)$
Net (loss) earnings from continuing operations attributable to:Non-controlling interest -$ -$ -$ -$ 0.4$ -$ 0.4$
Common shareholders (3,012.6)$ (2,798.8)$ 2,798.8$ (3,012.6)$ (1,367.5)$ 1,367.5$ (3,012.6)$
Net (loss) earnings attributable to:
Non-controlling interest -$ -$ -$ -$ 0.4$ -$ 0.4$
Common shareholders (3,742.7)$ (3,528.9)$ 3,528.9$ (3,742.7)$ (2,097.6)$ 2,097.6$ (3,742.7)$
GuarantorsNon-
guarantors Eliminations Consolidated
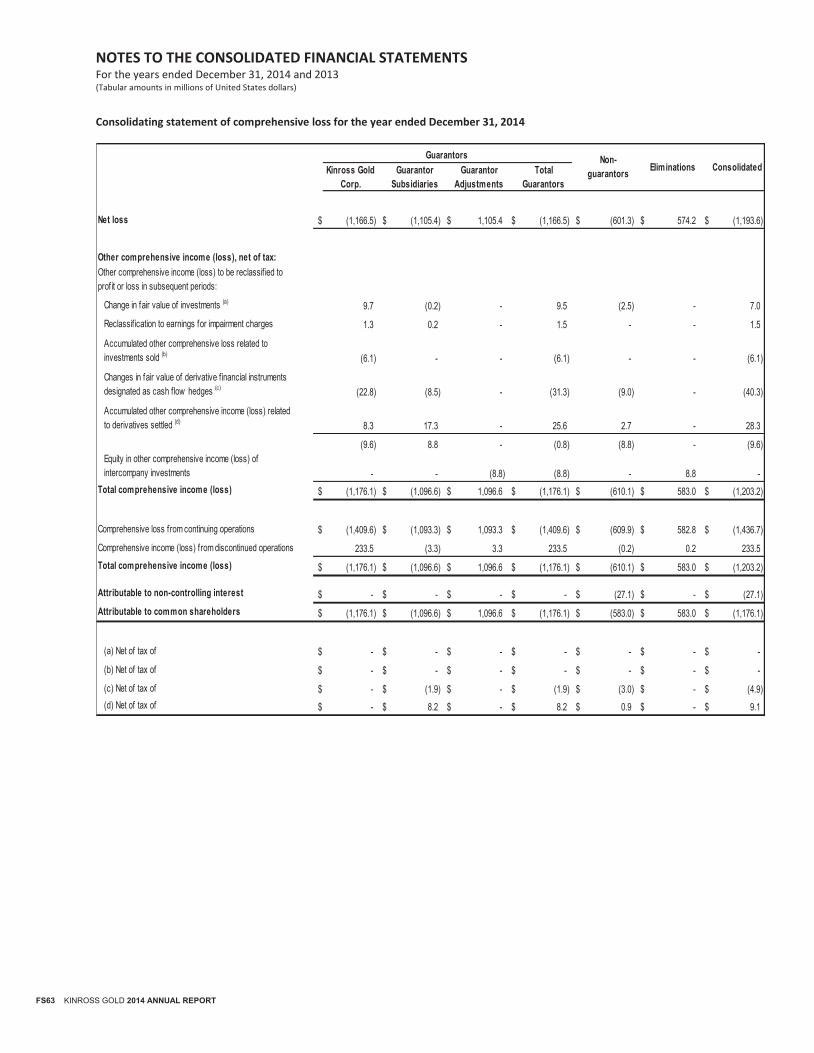
NOTES TO THE CONSOLIDATED FINANCIAL STATEMENTS For the years ended December 31, 2014 and 2013 (Tabular amounts in millions of United States dollars)
FS63 KINROSS GOLD 2014 ANNUAL REPORT
Consolidating statement of comprehensive loss for the year ended December 31, 2014
Kinross Gold Corp.
Guarantor Subsidiaries
Guarantor Adjustments
TotalGuarantors
Net loss $ (1,166.5) $ (1,105.4) $ 1,105.4 $ (1,166.5) $ (601.3) $ 574.2 $ (1,193.6)
Other comprehensive income (loss), net of tax: Other comprehensive income (loss) to be reclassif ied to profit or loss in subsequent periods:
Change in fair value of investments (a) 9.7 (0.2) - 9.5 (2.5) - 7.0
Reclassif ication to earnings for impairment charges 1.3 0.2 - 1.5 - - 1.5
Accumulated other comprehensive loss related to investments sold (b) (6.1) - - (6.1) - - (6.1)
Changes in fair value of derivative f inancial instruments designated as cash flow hedges (c) (22.8) (8.5) - (31.3) (9.0) - (40.3)
Accumulated other comprehensive income (loss) related to derivatives settled (d) 8.3 17.3 - 25.6 2.7 - 28.3
(9.6) 8.8 - (0.8) (8.8) - (9.6) Equity in other comprehensive income (loss) of intercompany investments - - (8.8) (8.8) - 8.8 -
Total comprehensive income (loss) $ (1,176.1) $ (1,096.6) $ 1,096.6 $ (1,176.1) $ (610.1) $ 583.0 $ (1,203.2)
Comprehensive loss from continuing operations $ (1,409.6) $ (1,093.3) $ 1,093.3 $ (1,409.6) $ (609.9) $ 582.8 $ (1,436.7)
Comprehensive income (loss) from discontinued operations 233.5 (3.3) 3.3 233.5 (0.2) 0.2 233.5 Total comprehensive income (loss) $ (1,176.1) $ (1,096.6) $ 1,096.6 $ (1,176.1) $ (610.1) $ 583.0 $ (1,203.2)
Attributable to non-controlling interest $ - $ - $ - $ - $ (27.1) $ - $ (27.1) Attributable to common shareholders $ (1,176.1) $ (1,096.6) $ 1,096.6 $ (1,176.1) $ (583.0) $ 583.0 $ (1,176.1)
(a) Net of tax of $ - $ - $ - $ - $ - $ - $ -
(b) Net of tax of $ - $ - $ - $ - $ - $ - $ -
(c) Net of tax of $ - $ (1.9) $ - $ (1.9) $ (3.0) $ - $ (4.9) (d) Net of tax of $ - $ 8.2 $ - $ 8.2 $ 0.9 $ - $ 9.1
Guarantors Non-guarantors Eliminations Consolidated
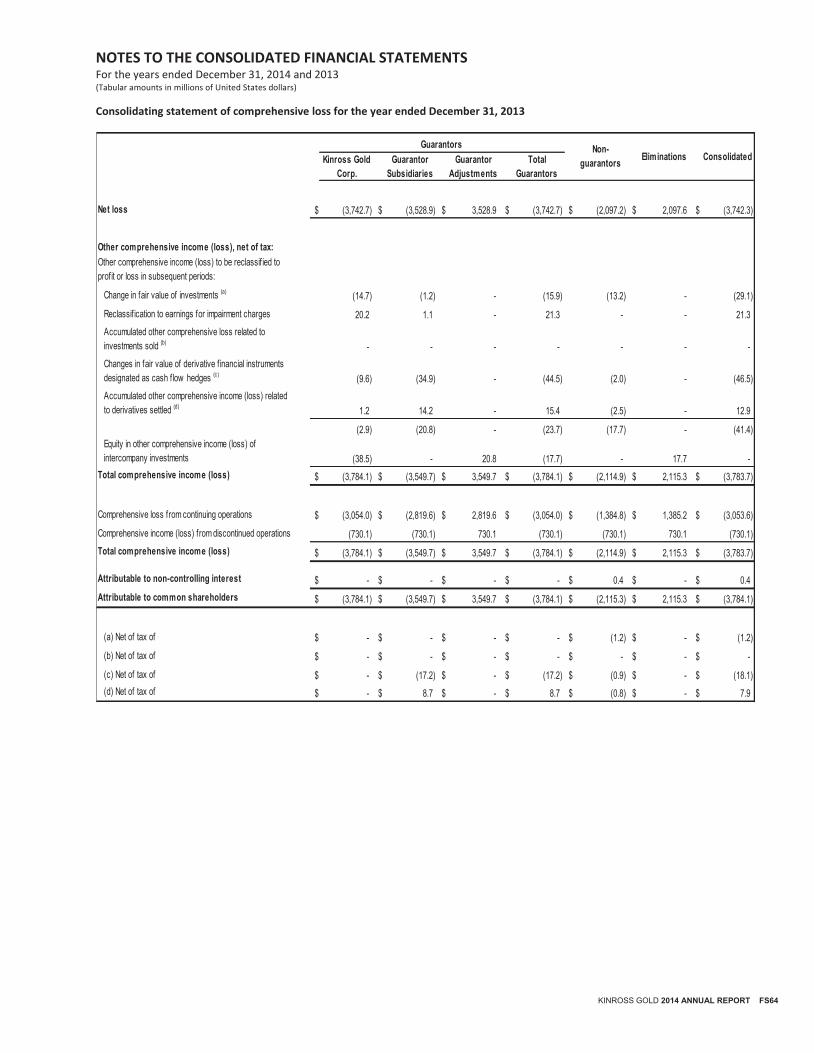
NOTES TO THE CONSOLIDATED FINANCIAL STATEMENTS For the years ended December 31, 2014 and 2013 (Tabular amounts in millions of United States dollars)
KINROSS GOLD 2014 ANNUAL REPORT FS64
Consolidating statement of comprehensive loss for the year ended December 31, 2013
Kinross Gold Corp.
Guarantor Subsidiaries
Guarantor Adjustments
TotalGuarantors
Net loss $ (3,742.7) $ (3,528.9) $ 3,528.9 $ (3,742.7) $ (2,097.2) $ 2,097.6 $ (3,742.3)
Other comprehensive income (loss), net of tax: Other comprehensive income (loss) to be reclassif ied to profit or loss in subsequent periods:
Change in fair value of investments (a) (14.7) (1.2) - (15.9) (13.2) - (29.1)
Reclassif ication to earnings for impairment charges 20.2 1.1 - 21.3 - - 21.3 Accumulated other comprehensive loss related to investments sold (b) - - - - - - - Changes in fair value of derivative f inancial instruments designated as cash flow hedges (c) (9.6) (34.9) - (44.5) (2.0) - (46.5) Accumulated other comprehensive income (loss) related to derivatives settled (d) 1.2 14.2 - 15.4 (2.5) - 12.9
(2.9) (20.8) - (23.7) (17.7) - (41.4) Equity in other comprehensive income (loss) of intercompany investments (38.5) - 20.8 (17.7) - 17.7 -
Total comprehensive income (loss) $ (3,784.1) $ (3,549.7) $ 3,549.7 $ (3,784.1) $ (2,114.9) $ 2,115.3 $ (3,783.7)
Comprehensive loss from continuing operations $ (3,054.0) $ (2,819.6) $ 2,819.6 $ (3,054.0) $ (1,384.8) $ 1,385.2 $ (3,053.6)
Comprehensive income (loss) from discontinued operations (730.1) (730.1) 730.1 (730.1) (730.1) 730.1 (730.1) Total comprehensive income (loss) $ (3,784.1) $ (3,549.7) $ 3,549.7 $ (3,784.1) $ (2,114.9) $ 2,115.3 $ (3,783.7)
Attributable to non-controlling interest $ - $ - $ - $ - $ 0.4 $ - $ 0.4 Attributable to common shareholders $ (3,784.1) $ (3,549.7) $ 3,549.7 $ (3,784.1) $ (2,115.3) $ 2,115.3 $ (3,784.1)
(a) Net of tax of $ - $ - $ - $ - $ (1.2) $ - $ (1.2)
(b) Net of tax of $ - $ - $ - $ - $ - $ - $ -
(c) Net of tax of $ - $ (17.2) $ - $ (17.2) $ (0.9) $ - $ (18.1) (d) Net of tax of $ - $ 8.7 $ - $ 8.7 $ (0.8) $ - $ 7.9
Guarantors Non-guarantors Eliminations Consolidated
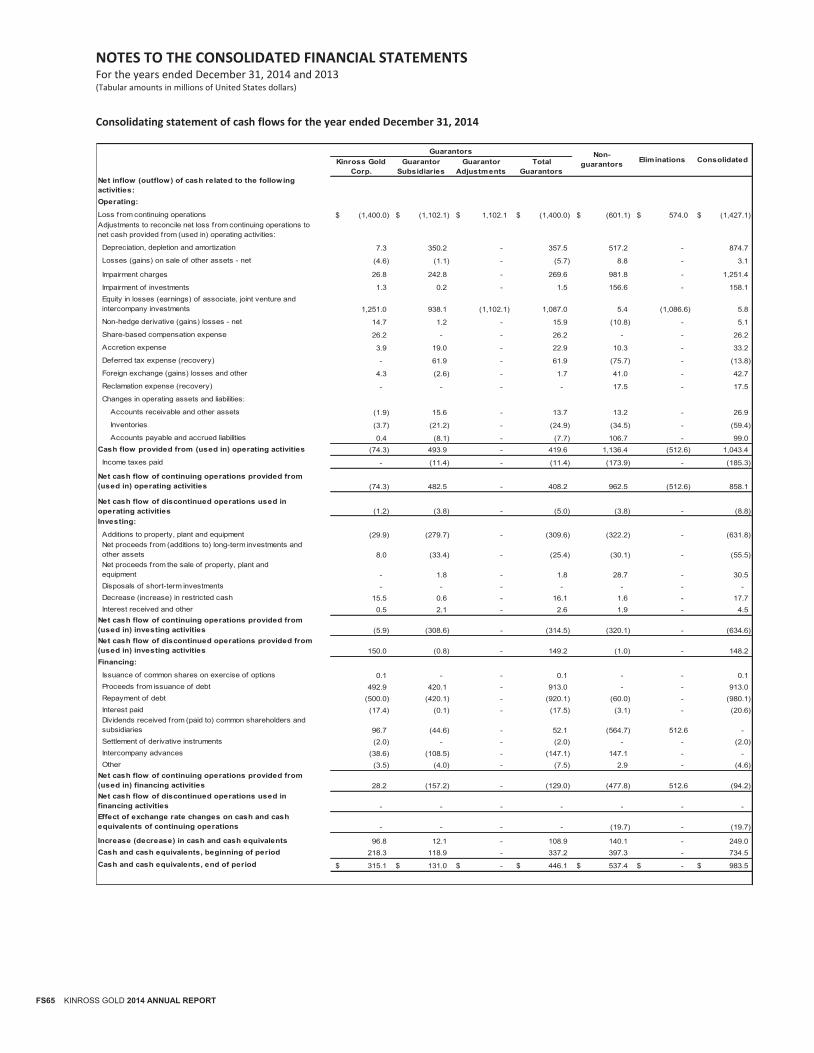
NOTES TO THE CONSOLIDATED FINANCIAL STATEMENTS For the years ended December 31, 2014 and 2013 (Tabular amounts in millions of United States dollars)
FS65 KINROSS GOLD 2014 ANNUAL REPORT
Consolidating statement of cash flows for the year ended December 31, 2014
Kinross Gold Corp.
Guarantor Subsidiaries
Guarantor Adjustments
TotalGuarantors
Net inflow (outflow) of cash related to the following activities:Operating:
Loss from continuing operations (1,400.0)$ (1,102.1)$ 1,102.1$ (1,400.0)$ (601.1)$ 574.0$ (1,427.1)$ Adjustments to reconcile net loss from continuing operations to net cash provided from (used in) operating activities:
Depreciation, depletion and amortization 7.3 350.2 - 357.5 517.2 - 874.7
Losses (gains) on sale of other assets - net (4.6) (1.1) - (5.7) 8.8 - 3.1
Impairment charges 26.8 242.8 - 269.6 981.8 - 1,251.4
Impairment of investments 1.3 0.2 - 1.5 156.6 - 158.1 Equity in losses (earnings) of associate, joint venture and intercompany investments 1,251.0 938.1 (1,102.1) 1,087.0 5.4 (1,086.6) 5.8
Non-hedge derivative (gains) losses - net 14.7 1.2 - 15.9 (10.8) - 5.1
Share-based compensation expense 26.2 - - 26.2 - - 26.2
Accretion expense 3.9 19.0 - 22.9 10.3 - 33.2
Deferred tax expense (recovery) - 61.9 - 61.9 (75.7) - (13.8)
Foreign exchange (gains) losses and other 4.3 (2.6) - 1.7 41.0 - 42.7
Reclamation expense (recovery) - - - - 17.5 - 17.5
Changes in operating assets and liabilities:
Accounts receivable and other assets (1.9) 15.6 - 13.7 13.2 - 26.9
Inventories (3.7) (21.2) - (24.9) (34.5) - (59.4)
Accounts payable and accrued liabilities 0.4 (8.1) - (7.7) 106.7 - 99.0 Cash flow provided from (used in) operating activities (74.3) 493.9 - 419.6 1,136.4 (512.6) 1,043.4
Income taxes paid - (11.4) - (11.4) (173.9) - (185.3)
Net cash flow of continuing operations provided from (used in) operating activities (74.3) 482.5 - 408.2 962.5 (512.6) 858.1
Net cash flow of discontinued operations used in operating activities (1.2) (3.8) - (5.0) (3.8) - (8.8) Investing:
Additions to property, plant and equipment (29.9) (279.7) - (309.6) (322.2) - (631.8) Net proceeds from (additions to) long-term investments and other assets 8.0 (33.4) - (25.4) (30.1) - (55.5) Net proceeds from the sale of property, plant and equipment - 1.8 - 1.8 28.7 - 30.5 Disposals of short-term investments - - - - - - - Decrease (increase) in restricted cash 15.5 0.6 - 16.1 1.6 - 17.7 Interest received and other 0.5 2.1 - 2.6 1.9 - 4.5 Net cash flow of continuing operations provided from (used in) investing activities (5.9) (308.6) - (314.5) (320.1) - (634.6) Net cash flow of discontinued operations provided from (used in) investing activities 150.0 (0.8) - 149.2 (1.0) - 148.2 Financing:
Issuance of common shares on exercise of options 0.1 - - 0.1 - - 0.1 Proceeds from issuance of debt 492.9 420.1 - 913.0 - - 913.0 Repayment of debt (500.0) (420.1) - (920.1) (60.0) - (980.1) Interest paid (17.4) (0.1) - (17.5) (3.1) - (20.6) Dividends received from (paid to) common shareholders and subsidiaries 96.7 (44.6) - 52.1 (564.7) 512.6 - Settlement of derivative instruments (2.0) - - (2.0) - - (2.0) Intercompany advances (38.6) (108.5) - (147.1) 147.1 - - Other (3.5) (4.0) - (7.5) 2.9 - (4.6) Net cash flow of continuing operations provided from (used in) financing activities 28.2 (157.2) - (129.0) (477.8) 512.6 (94.2) Net cash flow of discontinued operations used in financing activities - - - - - - - Effect of exchange rate changes on cash and cash equivalents of continuing operations - - - - (19.7) - (19.7)
Increase (decrease) in cash and cash equivalents 96.8 12.1 - 108.9 140.1 - 249.0 Cash and cash equivalents, beginning of period 218.3 118.9 - 337.2 397.3 - 734.5 Cash and cash equivalents, end of period 315.1$ 131.0$ -$ 446.1$ 537.4$ -$ 983.5$
Guarantors Non-guarantors Eliminations Consolidated
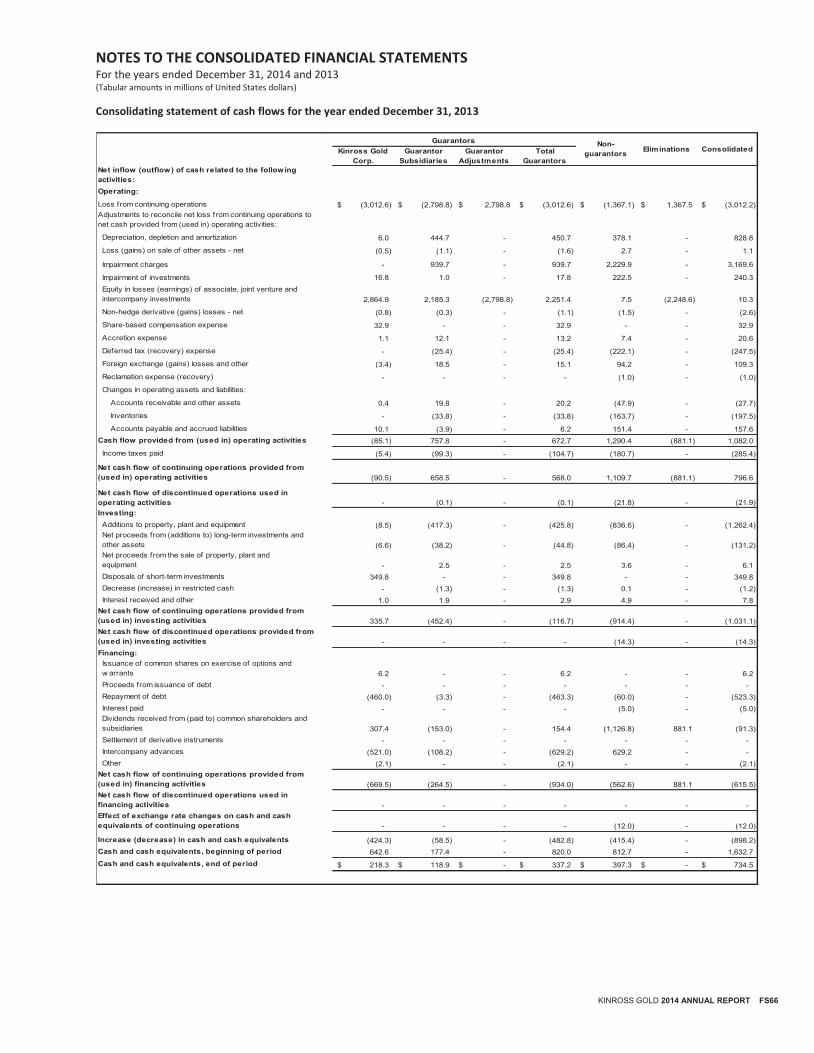
NOTES TO THE CONSOLIDATED FINANCIAL STATEMENTS For the years ended December 31, 2014 and 2013 (Tabular amounts in millions of United States dollars)
KINROSS GOLD 2014 ANNUAL REPORT FS66
Consolidating statement of cash flows for the year ended December 31, 2013
Kinross Gold Corp.
Guarantor Subsidiaries
Guarantor Adjustments
TotalGuarantors
Net inflow (outflow) of cash related to the following activities:Operating:
Loss from continuing operations (3,012.6)$ (2,798.8)$ 2,798.8$ (3,012.6)$ (1,367.1)$ 1,367.5$ (3,012.2)$ Adjustments to reconcile net loss from continuing operations to net cash provided from (used in) operating activities:
Depreciation, depletion and amortization 6.0 444.7 - 450.7 378.1 - 828.8
Loss (gains) on sale of other assets - net (0.5) (1.1) - (1.6) 2.7 - 1.1
Impairment charges - 939.7 - 939.7 2,229.9 - 3,169.6
Impairment of investments 16.8 1.0 - 17.8 222.5 - 240.3 Equity in losses (earnings) of associate, joint venture and intercompany investments 2,864.9 2,185.3 (2,798.8) 2,251.4 7.5 (2,248.6) 10.3
Non-hedge derivative (gains) losses - net (0.8) (0.3) - (1.1) (1.5) - (2.6)
Share-based compensation expense 32.9 - - 32.9 - - 32.9
Accretion expense 1.1 12.1 - 13.2 7.4 - 20.6
Deferred tax (recovery) expense - (25.4) - (25.4) (222.1) - (247.5)
Foreign exchange (gains) losses and other (3.4) 18.5 - 15.1 94.2 - 109.3
Reclamation expense (recovery) - - - - (1.0) - (1.0)
Changes in operating assets and liabilities:
Accounts receivable and other assets 0.4 19.8 - 20.2 (47.9) - (27.7)
Inventories - (33.8) - (33.8) (163.7) - (197.5)
Accounts payable and accrued liabilities 10.1 (3.9) - 6.2 151.4 - 157.6 Cash flow provided from (used in) operating activities (85.1) 757.8 - 672.7 1,290.4 (881.1) 1,082.0
Income taxes paid (5.4) (99.3) - (104.7) (180.7) - (285.4)
Net cash flow of continuing operations provided from (used in) operating activities (90.5) 658.5 - 568.0 1,109.7 (881.1) 796.6
Net cash flow of discontinued operations used in operating activities - (0.1) - (0.1) (21.8) - (21.9) Investing: Additions to property, plant and equipment (8.5) (417.3) - (425.8) (836.6) - (1,262.4) Net proceeds from (additions to) long-term investments and other assets (6.6) (38.2) - (44.8) (86.4) - (131.2) Net proceeds from the sale of property, plant and equipment - 2.5 - 2.5 3.6 - 6.1 Disposals of short-term investments 349.8 - - 349.8 - - 349.8 Decrease (increase) in restricted cash - (1.3) - (1.3) 0.1 - (1.2) Interest received and other 1.0 1.9 - 2.9 4.9 - 7.8 Net cash flow of continuing operations provided from (used in) investing activities 335.7 (452.4) - (116.7) (914.4) - (1,031.1) Net cash flow of discontinued operations provided from (used in) investing activities - - - - (14.3) - (14.3) Financing: Issuance of common shares on exercise of options and w arrants 6.2 - - 6.2 - - 6.2 Proceeds from issuance of debt - - - - - - - Repayment of debt (460.0) (3.3) - (463.3) (60.0) - (523.3) Interest paid - - - - (5.0) - (5.0) Dividends received from (paid to) common shareholders and subsidiaries 307.4 (153.0) - 154.4 (1,126.8) 881.1 (91.3) Settlement of derivative instruments - - - - - - - Intercompany advances (521.0) (108.2) - (629.2) 629.2 - - Other (2.1) - - (2.1) - - (2.1) Net cash flow of continuing operations provided from (used in) financing activities (669.5) (264.5) - (934.0) (562.6) 881.1 (615.5) Net cash flow of discontinued operations used in financing activities - - - - - - - Effect of exchange rate changes on cash and cash equivalents of continuing operations - - - - (12.0) - (12.0)
Increase (decrease) in cash and cash equivalents (424.3) (58.5) - (482.8) (415.4) - (898.2) Cash and cash equivalents, beginning of period 642.6 177.4 - 820.0 812.7 - 1,632.7 Cash and cash equivalents, end of period 218.3$ 118.9$ -$ 337.2$ 397.3$ -$ 734.5$
Guarantors Non-guarantors Eliminations Consolidated
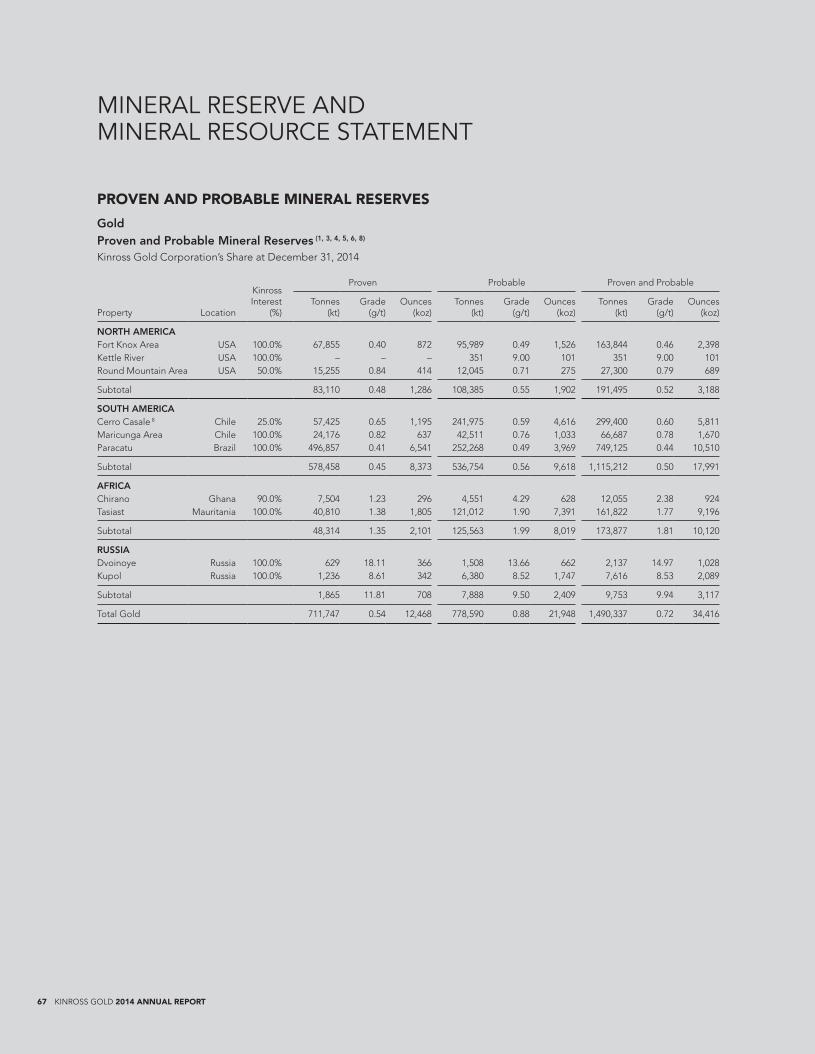
67 KINROSS GOLD 2014 ANNUAL REPORT
MINERAL RESERVE AND MINERAL RESOURCE STATEMENT
PROVEN AND PROBABLE MINERAL RESERVES
GoldProven and Probable Mineral Reserves (1, 3, 4, 5, 6, 8)
Kinross Gold Corporation’s Share at December 31, 2014
Property Location
KinrossInterest
(%)
Proven Probable Proven and Probable
Tonnes (kt)
Grade (g/t)
Ounces (koz)
Tonnes (kt)
Grade (g/t)
Ounces (koz)
Tonnes (kt)
Grade (g/t)
Ounces (koz)
NORTH AMERICAFort Knox Area USA 100.0% 67,855 0.40 872 95,989 0.49 1,526 163,844 0.46 2,398 Kettle River USA 100.0% – – – 351 9.00 101 351 9.00 101 Round Mountain Area USA 50.0% 15,255 0.84 414 12,045 0.71 275 27,300 0.79 689
Subtotal 83,110 0.48 1,286 108,385 0.55 1,902 191,495 0.52 3,188
SOUTH AMERICACerro Casale 8 Chile 25.0% 57,425 0.65 1,195 241,975 0.59 4,616 299,400 0.60 5,811 Maricunga Area Chile 100.0% 24,176 0.82 637 42,511 0.76 1,033 66,687 0.78 1,670 Paracatu Brazil 100.0% 496,857 0.41 6,541 252,268 0.49 3,969 749,125 0.44 10,510
Subtotal 578,458 0.45 8,373 536,754 0.56 9,618 1,115,212 0.50 17,991
AFRICAChirano Ghana 90.0% 7,504 1.23 296 4,551 4.29 628 12,055 2.38 924 Tasiast Mauritania 100.0% 40,810 1.38 1,805 121,012 1.90 7,391 161,822 1.77 9,196
Subtotal 48,314 1.35 2,101 125,563 1.99 8,019 173,877 1.81 10,120
RUSSIADvoinoye Russia 100.0% 629 18.11 366 1,508 13.66 662 2,137 14.97 1,028 Kupol Russia 100.0% 1,236 8.61 342 6,380 8.52 1,747 7,616 8.53 2,089
Subtotal 1,865 11.81 708 7,888 9.50 2,409 9,753 9.94 3,117
Total Gold 711,747 0.54 12,468 778,590 0.88 21,948 1,490,337 0.72 34,416
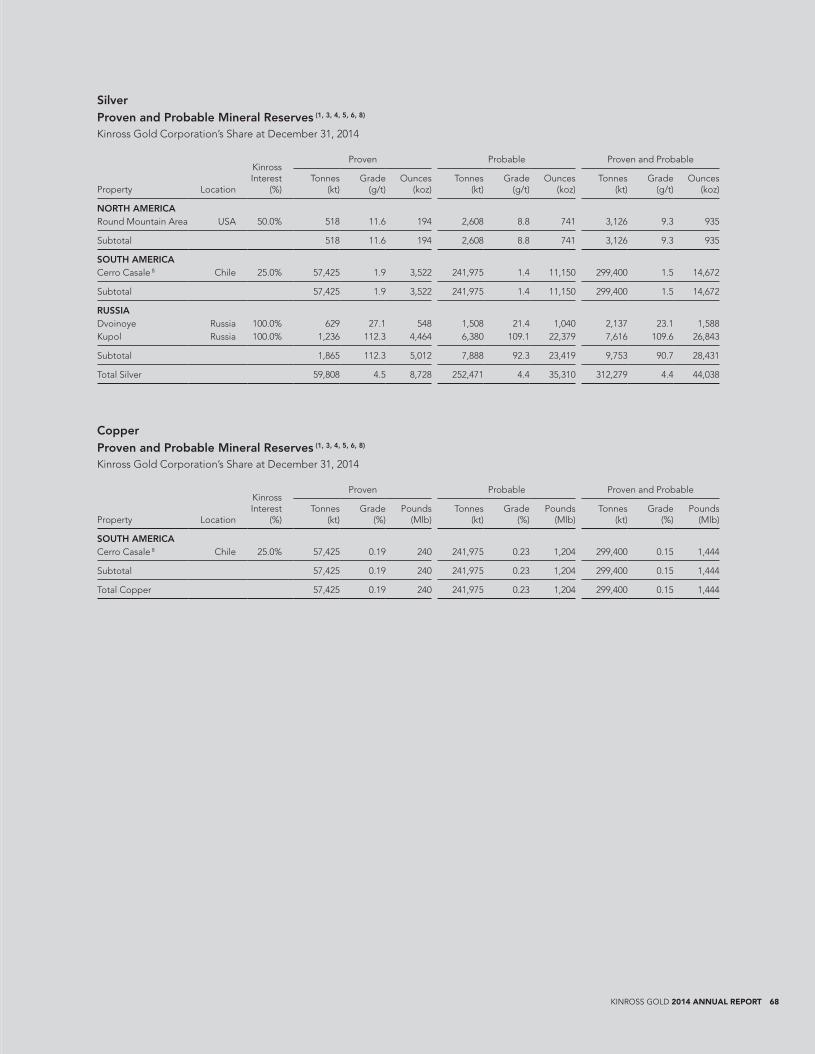
KINROSS GOLD 2014 ANNUAL REPORT 68
SilverProven and Probable Mineral Reserves (1, 3, 4, 5, 6, 8)
Kinross Gold Corporation’s Share at December 31, 2014
Property Location
KinrossInterest
(%)
Proven Probable Proven and Probable
Tonnes (kt)
Grade (g/t)
Ounces (koz)
Tonnes (kt)
Grade (g/t)
Ounces (koz)
Tonnes (kt)
Grade (g/t)
Ounces (koz)
NORTH AMERICARound Mountain Area USA 50.0% 518 11.6 194 2,608 8.8 741 3,126 9.3 935
Subtotal 518 11.6 194 2,608 8.8 741 3,126 9.3 935
SOUTH AMERICACerro Casale 8 Chile 25.0% 57,425 1.9 3,522 241,975 1.4 11,150 299,400 1.5 14,672
Subtotal 57,425 1.9 3,522 241,975 1.4 11,150 299,400 1.5 14,672
RUSSIADvoinoye Russia 100.0% 629 27.1 548 1,508 21.4 1,040 2,137 23.1 1,588 Kupol Russia 100.0% 1,236 112.3 4,464 6,380 109.1 22,379 7,616 109.6 26,843
Subtotal 1,865 112.3 5,012 7,888 92.3 23,419 9,753 90.7 28,431
Total Silver 59,808 4.5 8,728 252,471 4.4 35,310 312,279 4.4 44,038
CopperProven and Probable Mineral Reserves (1, 3, 4, 5, 6, 8)
Kinross Gold Corporation’s Share at December 31, 2014
Property Location
KinrossInterest
(%)
Proven Probable Proven and Probable
Tonnes (kt)
Grade (%)
Pounds (Mlb)
Tonnes (kt)
Grade (%)
Pounds (Mlb)
Tonnes (kt)
Grade (%)
Pounds (Mlb)
SOUTH AMERICACerro Casale 8 Chile 25.0% 57,425 0.19 240 241,975 0.23 1,204 299,400 0.15 1,444
Subtotal 57,425 0.19 240 241,975 0.23 1,204 299,400 0.15 1,444
Total Copper 57,425 0.19 240 241,975 0.23 1,204 299,400 0.15 1,444
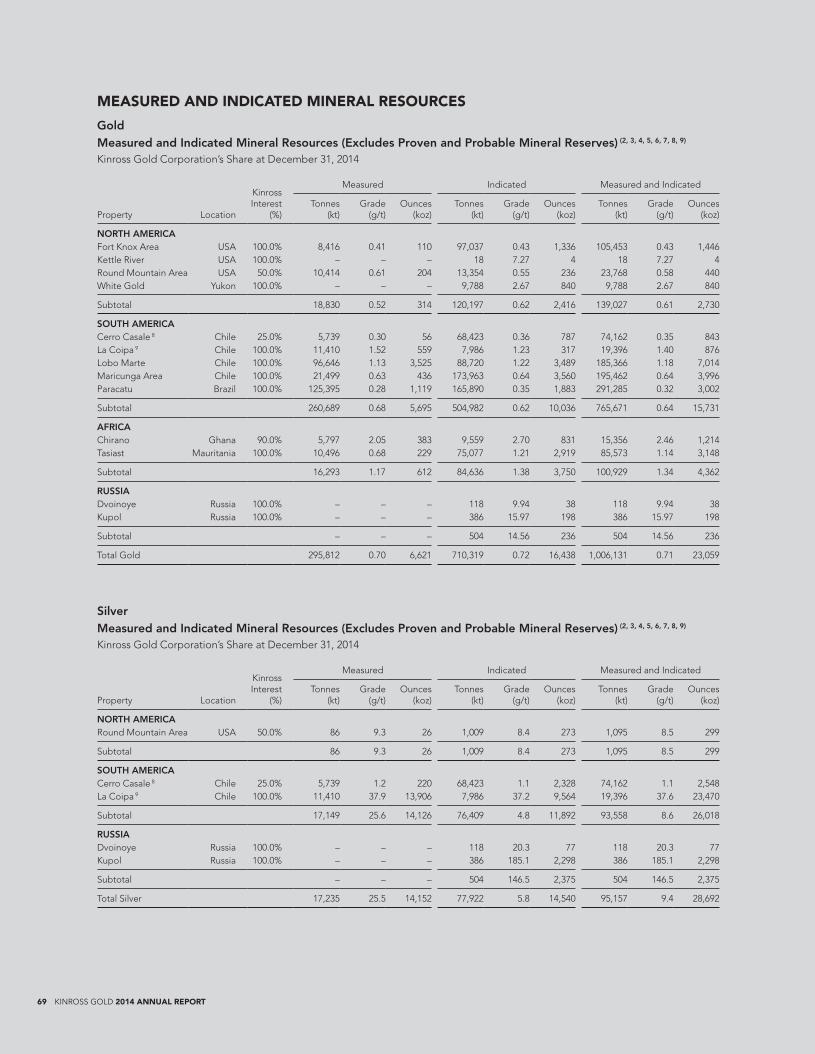
69 KINROSS GOLD 2014 ANNUAL REPORT
MEASURED AND INDICATED MINERAL RESOURCES
GoldMeasured and Indicated Mineral Resources (Excludes Proven and Probable Mineral Reserves) (2, 3, 4, 5, 6, 7, 8, 9)
Kinross Gold Corporation’s Share at December 31, 2014
Property Location
KinrossInterest
(%)
Measured Indicated Measured and Indicated
Tonnes (kt)
Grade (g/t)
Ounces (koz)
Tonnes (kt)
Grade (g/t)
Ounces (koz)
Tonnes (kt)
Grade (g/t)
Ounces (koz)
NORTH AMERICAFort Knox Area USA 100.0% 8,416 0.41 110 97,037 0.43 1,336 105,453 0.43 1,446 Kettle River USA 100.0% – – – 18 7.27 4 18 7.27 4 Round Mountain Area USA 50.0% 10,414 0.61 204 13,354 0.55 236 23,768 0.58 440 White Gold Yukon 100.0% – – – 9,788 2.67 840 9,788 2.67 840
Subtotal 18,830 0.52 314 120,197 0.62 2,416 139,027 0.61 2,730
SOUTH AMERICACerro Casale 8 Chile 25.0% 5,739 0.30 56 68,423 0.36 787 74,162 0.35 843 La Coipa 9 Chile 100.0% 11,410 1.52 559 7,986 1.23 317 19,396 1.40 876 Lobo Marte Chile 100.0% 96,646 1.13 3,525 88,720 1.22 3,489 185,366 1.18 7,014 Maricunga Area Chile 100.0% 21,499 0.63 436 173,963 0.64 3,560 195,462 0.64 3,996 Paracatu Brazil 100.0% 125,395 0.28 1,119 165,890 0.35 1,883 291,285 0.32 3,002
Subtotal 260,689 0.68 5,695 504,982 0.62 10,036 765,671 0.64 15,731
AFRICAChirano Ghana 90.0% 5,797 2.05 383 9,559 2.70 831 15,356 2.46 1,214 Tasiast Mauritania 100.0% 10,496 0.68 229 75,077 1.21 2,919 85,573 1.14 3,148
Subtotal 16,293 1.17 612 84,636 1.38 3,750 100,929 1.34 4,362
RUSSIADvoinoye Russia 100.0% – – – 118 9.94 38 118 9.94 38 Kupol Russia 100.0% – – – 386 15.97 198 386 15.97 198
Subtotal – – – 504 14.56 236 504 14.56 236
Total Gold 295,812 0.70 6,621 710,319 0.72 16,438 1,006,131 0.71 23,059
SilverMeasured and Indicated Mineral Resources (Excludes Proven and Probable Mineral Reserves) (2, 3, 4, 5, 6, 7, 8, 9)
Kinross Gold Corporation’s Share at December 31, 2014
Property Location
KinrossInterest
(%)
Measured Indicated Measured and Indicated
Tonnes (kt)
Grade (g/t)
Ounces (koz)
Tonnes (kt)
Grade (g/t)
Ounces (koz)
Tonnes (kt)
Grade (g/t)
Ounces (koz)
NORTH AMERICARound Mountain Area USA 50.0% 86 9.3 26 1,009 8.4 273 1,095 8.5 299
Subtotal 86 9.3 26 1,009 8.4 273 1,095 8.5 299
SOUTH AMERICACerro Casale 8 Chile 25.0% 5,739 1.2 220 68,423 1.1 2,328 74,162 1.1 2,548 La Coipa 9 Chile 100.0% 11,410 37.9 13,906 7,986 37.2 9,564 19,396 37.6 23,470
Subtotal 17,149 25.6 14,126 76,409 4.8 11,892 93,558 8.6 26,018
RUSSIADvoinoye Russia 100.0% – – – 118 20.3 77 118 20.3 77 Kupol Russia 100.0% – – – 386 185.1 2,298 386 185.1 2,298
Subtotal – – – 504 146.5 2,375 504 146.5 2,375
Total Silver 17,235 25.5 14,152 77,922 5.8 14,540 95,157 9.4 28,692

KINROSS GOLD 2014 ANNUAL REPORT 70
CopperMeasured and Indicated Mineral Resources (Excludes Proven and Probable Mineral Reserves) (2, 3, 4, 5, 6, 7, 8)
Kinross Gold Corporation’s Share at December 31, 2014
Property Location
KinrossInterest
(%)
Measured Indicated Measured and Indicated
Tonnes (kt)
Grade (%)
Pounds (Mlb)
Tonnes (kt)
Grade (%)
Pounds (Mlb)
Tonnes (kt)
Grade (%)
Pounds (Mlb)
SOUTH AMERICACerro Casale 8 Chile 25.0% 5,739 0.1 17 68,423 0.2 248 74,162 0.16 265
Subtotal 5,739 0.1 17 68,423 0.2 248 74,162 0.16 265
Total Copper 5,739 0.13 17 68,423 0.16 248 74,162 0.16 265
INFERRED MINERAL RESOURCES
GoldInferred Mineral Resources (2, 3, 4, 5, 6, 7, 8, 9)
Kinross Gold Corporation’s Share at December 31, 2014
Property Location
KinrossInterest
(%)Tonnes
(kt)
Inferred Grade
(g/t) Ounces
(koz)
NORTH AMERICAFort Knox Area USA 100.0% 13,500 0.44 189 Kettle River USA 100.0% 26 7.19 6 Round Mountain Area USA 50.0% 7,861 0.51 130 White Gold Yukon 100.0% 2,166 1.79 125
Subtotal 23,553 0.59 450
SOUTH AMERICACerro Casale 8 Chile 25.0% 123,860 0.38 1,498 La Coipa 9 Chile 100.0% 726 1.06 25 Lobo Marte Chile 100.0% 2,003 1.07 69 Maricunga Area Chile 100.0% 57,439 0.58 1,065 Paracatu Brazil 100.0% 2,283 0.31 22
Subtotal 186,311 0.45 2,679
AFRICAChirano Ghana 90.0% 1,204 3.43 133 Tasiast Mauritania 100.0% 8,951 1.71 492
Subtotal 10,155 1.91 625
RUSSIADvoinoye Russia 100.0% 122 12.10 47 Kupol Russia 100.0% 474 12.55 191
Subtotal 596 12.46 238
Total Gold 220,615 0.56 3,992
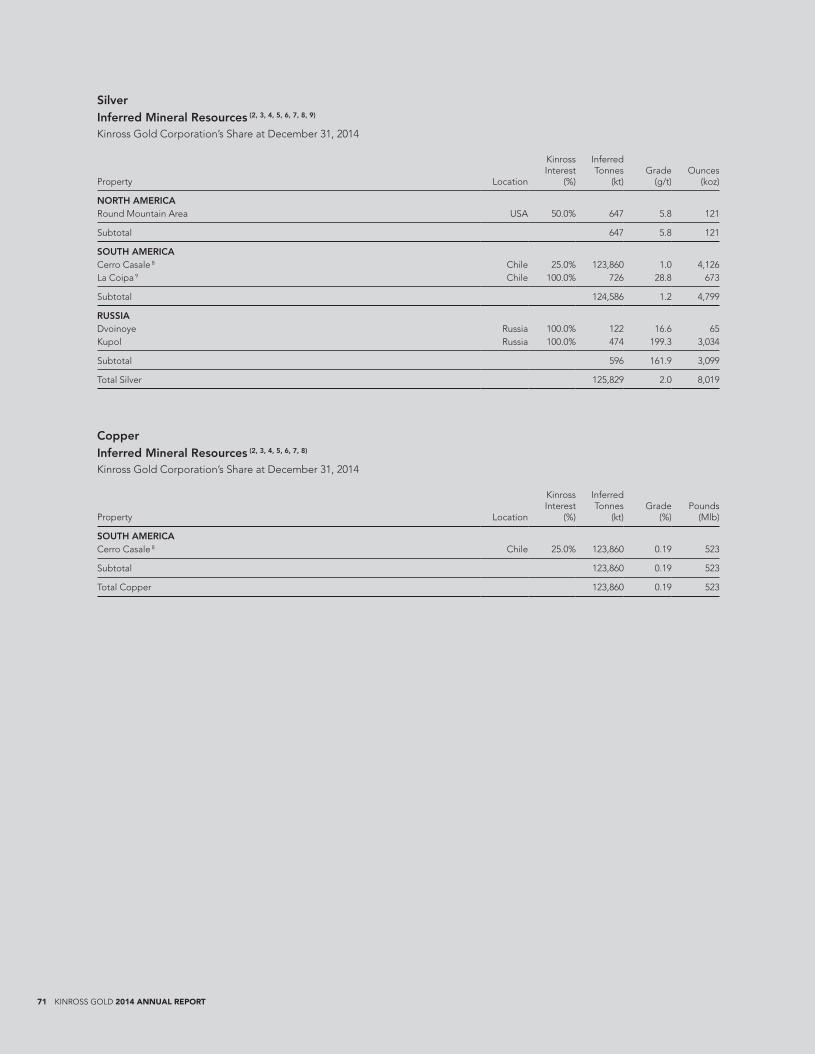
71 KINROSS GOLD 2014 ANNUAL REPORT
SilverInferred Mineral Resources (2, 3, 4, 5, 6, 7, 8, 9)
Kinross Gold Corporation’s Share at December 31, 2014
Property Location
KinrossInterest
(%)
Inferred Tonnes
(kt) Grade
(g/t) Ounces
(koz)
NORTH AMERICARound Mountain Area USA 50.0% 647 5.8 121
Subtotal 647 5.8 121
SOUTH AMERICACerro Casale 8 Chile 25.0% 123,860 1.0 4,126 La Coipa 9 Chile 100.0% 726 28.8 673
Subtotal 124,586 1.2 4,799
RUSSIADvoinoye Russia 100.0% 122 16.6 65 Kupol Russia 100.0% 474 199.3 3,034
Subtotal 596 161.9 3,099
Total Silver 125,829 2.0 8,019
CopperInferred Mineral Resources (2, 3, 4, 5, 6, 7, 8)
Kinross Gold Corporation’s Share at December 31, 2014
Property Location
KinrossInterest
(%)
Inferred Tonnes
(kt) Grade
(%) Pounds
(Mlb)
SOUTH AMERICACerro Casale 8 Chile 25.0% 123,860 0.19 523
Subtotal 123,860 0.19 523
Total Copper 123,860 0.19 523
KINROSS GOLD 2014 ANNUAL REPORT 72
Mineral Reserve and Mineral Resource Statement Notes
(1) Unless otherwise noted, the Company’s mineral reserves are estimated using appropriate cut-off grades based on an assumed gold price of $US 1,200 per ounce, a silver price of $US 20.00 per ounce and a copper price of $US $3.00 per pound. Mineral reserves are estimated using appropriate process recoveries, operating costs and mine plans that are unique to each property and include estimated allowances for dilution and mining recovery. Mineral reserve estimates are reported in contained units and are estimated based on the following foreign exchange rates:
Russian Rouble to $US 35
Chilean Peso to $US 575
Brazilian Real to $US 2.50
Ghanaian Cedi to $US 2.75
Mauritanian Ouguiya to $US 290
(2) Unless otherwise noted, the Company’s mineral resources are estimated using appropriate cut-off grades based on a gold price of $US 1,400 per ounce, a silver price of $US 22.00 per ounce, a copper price of $US $3.25 per pound and the following foreign exchange rates:
Russian Rouble to $US 34
Chilean Peso to $US 525
Brazilian Real to $US 2.50
Ghanaian Cedi to $US 2.50
Mauritanian Ouguiya to $US 300
(3) The Company’s mineral reserve and mineral resource estimates as at December 31, 2014 are classified in accordance with the Canadian Institute of Mining, Metallurgy and Petroleum (“CIM”) “CIM Definition Standards – For Mineral Resources and Mineral Reserves” adopted by the CIM Council (as amended, the “CIM Definition Standards”) in accordance with the requirements of National Instrument 43-101 “Standards of Disclosure for Mineral Projects” (“NI 43-101”). Mineral reserve and mineral resource estimates reflect the Company’s reasonable expectation that all necessary permits and approvals will be obtained and maintained.
(4) Cautionary note to U.S. Investors concerning estimates of mineral reserves and mineral resources. These estimates have been prepared in accordance with the requirements of Canadian securities laws, which differ from the requirements of United States’ securities laws. The terms “mineral reserve”, “proven mineral reserve” and “probable mineral reserve” are Canadian mining terms as defined in accordance with NI 43-101 and the CIM Definition Standards. The CIM Definition Standards differ from the definitions in the United States Securities and Exchange Commission (“SEC”) Guide 7 (“SEC Guide 7”) under the United States Securities Act of 1933, as amended. Under SEC Guide 7, a “final” or “bankable” feasibility study is required to report mineral reserves, the three-year historical average price is used in any mineral reserve or cash flow analysis to designate mineral reserves and the primary environmental analysis or report must be filed with the appropriate governmental authority. In addition, the terms “mineral resource”, “measured mineral resource”, “indicated mineral resource” and “inferred mineral resource” are defined in NI 43-101 and recognized by Canadian securities laws but are not defined terms under SEC Guide 7 or recognized under U.S. securities laws. U.S. investors are cautioned not to assume that any part or all of mineral deposits in these categories will ever be upgraded to mineral reserves. “Inferred mineral resources” have a great amount of uncertainty as to their existence, and great uncertainty as to their economic and legal feasibility. It cannot be assumed that all or any part of an “inferred mineral resource” will ever be upgraded to a higher category. Under Canadian securities laws, estimates of “inferred mineral resources” may not form the basis of feasibility or pre-feasibility studies, except in rare cases. U.S. investors are cautioned not to assume that all or any part of an inferred mineral resource exists or is economically or legally mineable. Accordingly, these mineral reserve and mineral resource estimates and related information may not be comparable to similar information made public by U.S. companies subject to the reporting and disclosure requirements under the United States federal laws and the rules and regulations thereunder, including SEC Guide 7.
(5) Except as provided in Note (8), the Company’s mineral resource and mineral reserve estimates were prepared under the supervision of and verified by Mr. John Sims, an officer of Kinross, who is a qualified person as defined by NI 43-101.
(6) The Company’s normal data verification procedures have been used in collecting, compiling, interpreting and processing the data used to estimate mineral reserves and mineral resources. Independent data verification has not been performed.
(7) Mineral resources that are not mineral reserves do not have to demonstrate economic viability. Mineral resources are subject to infill drilling, permitting, mine planning, mining dilution and recovery losses, among other things, to be converted into mineral reserves. Due to the uncertainty associated with inferred mineral resources, it cannot be assumed that all or any part of an inferred mineral resource will ever be upgraded to indicated or measured mineral resources, including as a result of continued exploration.
(8) Estimates for the Cerro Casale project are based on a project update completed by Barrick Gold Corporation in the first half of 2011 and have been updated to reflect current guidance. Mineral reserves and mineral resources are estimated using appropriate cut-off grades based on the following commodity prices and foreign exchange rates:
Mineral reserves – Gold price of $US 1,000 per ounce, Silver price of $US 16.00 per ounce, Copper price of $US 2.00 per pound, Chilean Peso to $US 525
Mineral resources – Gold price of $US 1,400 per ounce, Silver price of $US 19.00 per ounce, Copper price of $US 3.50 per pound, Chilean Peso to $US 585
The mineral reserve and mineral resource estimates for Cerro Casale were prepared under the supervision of Mr. Rick Sims, who is a qualified person as defined by NI 43-101.
(9) Includes mineral resources from the Puren deposit in which the Company holds a 65% interest.
73 KINROSS GOLD 2014 ANNUAL REPORT
MINERAL RESERVE AND MINERAL RESOURCE DEFINITIONS
A Mineral Reserve is the economically mineable part of a Measured or Indicated Mineral Resource demonstrated by at least a Preliminary Feasibility Study. This Study must include adequate information on mining, processing, metallurgical, economic and other relevant factors that demonstrate, at the time of reporting, that economic extraction can be justified. A Mineral Reserve includes diluting materials and allowances for losses that may occur when the material is mined.
A “Probable Mineral Reserve” is the economically mineable part of an Indicated and, in some circumstances, a Measured Mineral Resource demonstrated by at least a Preliminary Feasibility Study. This Study must include adequate information on mining, processing, metallurgical, economic, and other relevant factors that demonstrate, at the time of reporting, that economic extraction can be justified.
A “Proven Mineral Reserve” is the economically mineable part of a Measured Mineral Resource demonstrated by at least a Preliminary Feasibility Study. This Study must include adequate information on mining, processing, metallurgical, economic, and other relevant factors that demonstrate, at the time of reporting, that economic extraction is justified.
A Mineral Resource is a concentration or occurrence of diamonds, natural solid inorganic material, or natural solid fossilized organic material including base and precious metals, coal, and industrial minerals in or on the Earth’s crust in such form and quantity and of such a grade or quality that it has reasonable prospects for economic extraction. The location, quantity, grade, geological characteristics and continuity of a Mineral Resource are known, estimated or interpreted from specific geological evidence and knowledge.
An “Inferred Mineral Resource” is that part of a Mineral Resource for which quantity and grade or quality can be estimated on the basis of geological evidence and limited sampling and reasonably assumed, but not verified, geological and grade continuity. The estimate is based on limited information and sampling gathered through appropriate techniques from locations such as outcrops, trenches, pits, workings and drill holes.
An “Indicated Mineral Resource” is that part of a Mineral Resource for which quantity, grade or quality, densities, shape and physical characteristics can be estimated with a level of confidence sufficient to allow the appropriate application of technical and economic parameters, to support mine planning and evaluation of the economic viability of the deposit. The estimate is based on detailed and reliable exploration and testing information gathered through appropriate techniques from locations such as outcrops, trenches, pits, workings and drill holes that are spaced closely enough for geological and grade continuity to be reasonably assumed.
A “Measured Mineral Resource” is that part of a Mineral Resource for which quantity, grade or quality, densities, shape, and physical characteristics are so well established that they can be estimated with confidence sufficient to allow the appropriate application of technical and economic parameters, to support production planning and evaluation of the economic viability of the deposit. The estimate is based on detailed and reliable exploration, sampling and testing information gathered through appropriate techniques from locations such as outcrops, trenches, pits, workings and drill holes that are spaced closely enough to confirm both geological and grade continuity.

KINROSS GOLD 2014 ANNUAL REPORT 74
SUMMARIZED FIVE-YEAR REVIEW (6, 7)
(in millions, except per share amounts) 2014 2013 2012 2011 2010
Operating results from continuing operations
Revenue $ 3,466.3 $ 3,779.5 $ 4,307.3 $ 3,842.5 $ 2,915.4
Net earnings (loss) from continuing operations attributable to common shareholders
(1,400.0) (3,012.6) (2,546.2) (2,093.5) 1,034.4
Cash flow from continuing operations provided from operating activities
858.1 796.6 1,317.3 1,366.6 967.4
Capital expenditures 631.8 1,262.4 1,858.3 1,538.5 564.0
Financial position
Cash, cash equivalents and short-term investments $ 983.5 $ 734.5 $ 1,982.5 $ 1,767.3 $ 1,466.6
Working capital 1,982.7 1,692.9 2,281.8 2,322.1 1,687.0
Total assets 8,951.4 10,286.7 14,882.6 16,508.8 17,795.2
Long-term debt (including current portion) 2,058.1 2,119.6 2,632.6 1,633.1 474.4
Common shareholders’ equity 4,843.0 6,014.0 9,850.2 12,390.4 14,531.1
Per share data
Net earnings (loss) from continuing operations attributable to common shareholders – basic
$ (1.22) $ (2.64) $ (2.24) $ (1.84) $ 1.25
2014 KINROSS SHARE TRADING DATA
High Low
TSX (Cdn dollars)
First quarter $ 5.99 $ 4.42
Second quarter $ 4.82 $ 3.97
Third quarter $ 4.78 $ 3.62
Fourth quarter $ 3.80 $ 2.27
NYSE (U.S. dollars)
First quarter $ 5.44 $ 4.01
Second quarter $ 4.45 $ 3.66
Third quarter $ 4.47 $ 3.23
Fourth quarter $ 3.38 $ 2.00
75 KINROSS GOLD 2014 ANNUAL REPORT
CAUTIONARY STATEMENT ON FORWARD-LOOKING INFORMATION
All statements, other than statements of historical fact, contained or incorporated by reference in this Annual Report including, but not limited to, any information as to the future financial or operating performance of Kinross, constitute ‘‘forward-looking information’’ or ‘‘forward-looking statements’’ within the meaning of certain securities laws, including the provisions of the Securities Act (Ontario) and the provisions for ‘‘safe harbour’’ under the United States Private Securities Litigation Reform Act of 1995 and are based on expectations, estimates and projections as of the date of this Annual Report. Forward-looking statements contained in this Annual Report, include, but are not limited to, those under the headings “To Our Shareholders”, “2015 Guidance”, “Our Value Proposition”, “Mineral Reserve and Mineral Resource Statement”, “Proven and Probable Mineral Reserves”, “Measured and Indicated Mineral Resources”, “Inferred Mineral Resources”, and include, without limitation, statements with respect to our guidance for production, production costs of sales, all-in sustaining cost and capital expenditures; mineral reserve and mineral resource estimates; cost review and reduction initiatives including, without limitation, optimization of projects and operations, as well as references to other possible events, the future price of gold and silver, the estimation and realization of mineral reserves and mineral resources, the timing and amount of estimated future production, costs of production, capital expenditures, exploration, development and mining activities, permitting timelines, currency fluctuations, requirements for additional capital, government regulation, environmental risks and reclamation costs, title disputes, or litigation or claims and limitations on insurance coverage. The words “2015E”, “believe”, “estimate”, ‘‘expect’’, ‘‘explore’’, ‘‘forecast”, “focus”, “guidance”, “initiative”, “on track”, “opportunity”, “plan”, “possible”, “potential”, “principle”, “priority”, “projected”, “promising”, “proposition”, “prospect”, “study” and “target”, or variations of or similar such words and phrases or statements that certain actions, events or results may, could, should or will be achieved, received or taken, or will occur or result and similar such expressions identify forward-looking statements. Forward-looking statements are necessarily based upon a number of estimates and assumptions that, while considered reasonable by Kinross as of the date of such statements, are inherently subject to significant business, economic and competitive uncertainties and contingencies. The estimates, models and assumptions of Kinross referenced, contained or incorporated by reference in this Annual Report, which may prove to be incorrect, include, but are not limited to, the various assumptions set forth herein and in our most recently filed Annual Information Form and our Management’s Discussion and Analysis for the fiscal year ended December 31, 2014 (“2014 MD&A”) as well as: (1) there being no significant disruptions affecting the operations of the Company or any entity in which it now or hereafter directly or indirectly holds an investment, whether due to labour disruptions, supply disruptions, power disruptions, damage to equipment or otherwise; (2) permitting, development, operations and expansion at Paracatu (including, without limitation, land acquisitions and permitting for the construction and operation of the new tailings facility) being consistent with our current expectations; (3) political and legal developments in any jurisdiction in which the Company, or any entity in which it now or hereafter directly or indirectly holds an investment, operates being consistent with its current expectations including, without limitation, the impact of escalating political tensions and uncertainty in the Russian Federation and Ukraine or any related sanctions and any other similar restrictions or penalties imposed, or actions taken, by any government, and any potential amendments to the Brazilian Mining Code, the Mauritanian Customs Code, the Mauritanian Mining Code, the Mauritanian VAT regime and water legislation or other water use restrictions in Chile (including, but not limited to, the interpretation, implementation and application of any such amendments), being consistent with Kinross’ current expectations; (4) the exchange rate between the Canadian dollar, Brazilian real, Chilean peso, Russian rouble, Mauritanian ouguiya, Ghanaian cedi and the U.S. dollar being approximately consistent with current levels; (5) certain price assumptions for gold and silver; (6) prices for diesel, natural gas, fuel oil, electricity and other key supplies being approximately consistent with current levels; (7) production and cost of sales forecasts for the Company, and entities in which it now or hereafter directly or indirectly holds an investment, meeting expectations; (8) the accuracy of the current mineral reserve and mineral resource estimates of the Company (including but not limited to ore tonnage and ore grade estimates); (9) labour and materials costs increasing on a basis consistent with Kinross’ current expectations; (10) the development of, operations at and production from the Company’s operations, being consistent with Kinross’ current expectations; (11) the terms and conditions of the legal and fiscal stability agreements for the Tasiast and Chirano operations being interpreted and applied in a manner consistent with their intent and Kinross’ expectations; (12) goodwill and/or asset impairment potential; and (13) access to capital markets, including but not limited to
KINROSS GOLD 2014 ANNUAL REPORT 76
maintaining an investment grade debt rating and, as required, maintaining partial project financing for Dvoinoye and Kupol being consistent with the Company’s current expectations. Known and unknown factors could cause actual results to differ materially from those projected in the forward-looking statements. Such factors include, but are not limited to: sanctions (any other similar restrictions or penalties) now or subsequently imposed, or other actions taken, by, against, in respect of or otherwise impacting any jurisdiction in which the Company is domiciled or operates (including but not limited to the Russian Federation, Canada, the European Union and the United States), or any government or citizens of, persons or companies domiciled in, or the Company’s business, operations or other activities in, any such jurisdiction; litigation commenced, or other claims or actions brought, against the Company (and/or any of its directors, officers or employees) in respect of the cessation by the Company of investment in and development of FDN and its sale, or any of the Company’s prior activities on or in respect thereof or otherwise in Ecuador; fluctuations in the currency markets; fluctuations in the spot and forward price of gold or certain other commodities (such as fuel and electricity); changes in the discount rates applied to calculate the present value of net future cash flows based on country-specific real weighted average cost of capital; changes in the market valuations of peer group gold producers and the Company, and the resulting impact on market price to net asset value multiples; changes in various market variables, such as interest rates, foreign exchange rates, gold or silver prices and lease rates, or global fuel prices, that could impact the mark-to-market value of outstanding derivative instruments and ongoing payments/receipts under any financial obligations; risks arising from holding derivative instruments (such as credit risk, market liquidity risk and mark-to-market risk); changes in national and local government legislation, taxation (including but not limited to income tax, advance income tax, stamp tax, withholding tax, capital tax, tariffs, value-added or sales tax, capital outflow tax, capital gains tax, windfall or windfall profits tax, royalty, excise tax, customs/import or export taxes/duties, asset taxes, asset transfer tax, property use or other real estate tax, together with any related fine, penalty, surcharge, or interest imposed in connection with such taxes), controls, policies and regulations; the security of personnel and assets; political or economic developments in Canada, the United States, Chile, Brazil, Russia, Ecuador, Mauritania, Ghana, or other countries in which Kinross, or entities in which it now or hereafter directly or indirectly holds an interest, do business or may carry on business; business opportunities that may be presented to, or pursued by, us; our ability to successfully integrate acquisitions and complete divestitures; operating or technical difficulties in connection with mining or development activities; employee relations; litigation or other claims against, or regulatory investigations and/or any enforcement actions or sanctions in respect of the Company (and/or its directors, officers, or employees) including, but not limited to, securities class action litigation in Canada and/or the United States, or any investigations, enforcement actions and/or sanctions under any applicable anti-bribery, international sanctions and/or anti-money laundering laws and regulations in Canada, the United States or any other applicable jurisdiction; the speculative nature of gold exploration and development including, but not limited to, the risks of obtaining necessary licenses and permits; diminishing quantities or grades of reserves; adverse changes in our credit rating; and contests over title to properties, particularly title to undeveloped properties. In addition, there are risks and hazards associated with the business of gold exploration, development and mining, including environmental hazards, industrial accidents, unusual or unexpected formations, pressures, cave-ins, flooding and gold bullion losses (and the risk of inadequate insurance, or the inability to obtain insurance, to cover these risks). Many of these uncertainties and contingencies can directly or indirectly affect, and could cause, Kinross’ actual results to differ materially from those expressed or implied in any forward-looking statements made by, or on behalf of, Kinross, including but not limited to resulting in an impairment charge on goodwill and/or assets. There can be no assurance that forward-looking statements will prove to be accurate, as actual results and future events could differ materially from those anticipated in such statements. Forward-looking statements are provided for the purpose of providing information about management’s expectations and plans relating to the future. All of the forward looking statements made in this Annual Report are qualified by these cautionary statements and those made in our other filings with the securities regulators of Canada and the United States including, but not limited to, the cautionary statements made in the ‘‘Risk Factors’’ section of our most recently filed Annual Information Form and “Risk Analysis” section of our 2014 MD&A. These factors are not intended to represent a complete list of the factors that could affect Kinross. Kinross disclaims any intention or obligation to update or revise any forward-looking statements or to explain any material difference between subsequent actual events and such forward-looking statements, except to the extent required by applicable law.
77 KINROSS GOLD 2014 ANNUAL REPORT
Key Sensitivities
Approximately 60%-70% of the Company’s costs are denominated in US dollars. A 10% change in foreign currency exchange rates would be expected to result in an approximate $14 impact on production cost of sales per ounce 8. Specific to the Russian rouble, a 10% change in the exchange rate would be expected to result in an approximate $11 impact on Russian production cost of sales per ounce. A $10 per barrel change in the price of oil would be expected to result in an approximate $1 impact on production cost of sales per ounce. A $100 change in the price of gold would be expected to result in an approximate $3 impact on production cost of sales per ounce as a result of a change in royalties.
Other Information
Where we say ‘‘we’’, ‘‘us’’, ‘‘our’’, the ‘‘Company’’, or ‘‘Kinross’’ in this Annual Report, we mean Kinross Gold Corporation and/or one or more or all of its subsidiaries, as may be applicable. The technical information about the Company’s mineral properties (other than exploration activities) contained in this Annual Report, including but not limited to mineral reserve and mineral resource estimates, has been prepared under the supervision of Mr. John Sims, an officer of the Company who is a “qualified person” within the meaning of National Instrument 43-101 (“NI 43-101”). The technical information about the Company’s exploration activities contained in this Annual Report, including but not limited to drill programs and results, has been prepared under the supervision of Mr. Sylvain Guerard, an officer of the Company who is a “qualified person” within the meaning of NI 43‐101.
ENDNOTES
1 “Adjusted net earnings attributable to common shareholders”, “Adjusted net earnings per share”, “Adjusted operating cash flow”, “Attributable production cost of sales per equivalent ounce sold” and “Attributable all-in sustaining cost per equivalent ounce sold” figures used throughout this report are non-GAAP financial measures. For the definition and reconciliation of these non-GAAP measures, refer to Section 11, Supplemental Information of Management’s Discussion and Analysis in this report. Adjusted operating cash flow per share, also a non-GAAP measure, is defined as “adjusted operating cash flow” divided by the “weighted average number of common shares outstanding (basic)”. The weighted average number of common shares outstanding (basic) during the year ended December 31, 2014 was 1,144.3 million (2013: 1,142.1 million; 2012: 1,139.1 million).
2 Kinross’ guidance and outlook for 2015 represents forward-looking information and users are cautioned that actual results may vary. Please refer to the Cautionary Statement on page 75, as well as the Company’s news release dated February 10, 2015, available on our website at www.kinross.com for more information.
3 “Attributable” are based on Kinross’ 90% share of Chirano production.
4 See Kinross’ 2014 Mineral Reserve and Mineral Resource Statement released on February 10, 2015 and on pages 67 to 73 in this report.
5 Reported net loss includes an after-tax non-cash impairment charge of $932.2 million (2013: $2,834.1 million; 2012: $3,206.1 million) which includes charges related to property, plant and equipment of $342.5 million at Tasiast and $213.8 million at Chirano.
6 On June 10, 2013, the Company announced its decision to cease development of Fruta del Norte (“FDN”). As a result, FDN was classified as a discontinued operation. On December 17, 2014, the Company disposed of its interest in FDN. On June 28, 2012, the Company disposed of its interest in Crixás. The comparative figures exclude the results of FDN and Crixás.
7 Figures reported for 2010 and 2011 have not been recast for IFRS 11, which was adopted on January 1, 2013.
8 Refers to all of the currencies in the countries where the Company has mining operations, fluctuating simultaneously by 10% in the same direction, either appreciating, or depreciating, taking into consideration the impact of hedging and the weighting of each currency within our consolidated cost structure.
Kinross is a Canadian-based senior gold mining company with mines and projects in Brazil, Chile, Ghana, Mauritania, Russia and the United States. Kinross is focused on delivering value based on its core principles of operational excellence, balance sheet strength and responsible mining.Kinross maintains listings on the Toronto Stock Exchange (symbol:K) and the New York Stock Exchange (symbol:KGC).
LETTER TO SHAREHOLDERS 1
2014 ACHIEVEMENTS 4
DIRECTORS 6
CORPORATE GOVERNANCE HIGHLIGHTS 6
FINANCIAL REVIEW 7
CAUTIONARY STATEMENT ON 75 FORWARD-LOOKING INFORMATION
All figures in U.S. dollars and from continuing operations.
Endnotes can be found on page 77 of this 2014 Annual Report.
Read the annual report online:
2014ANNUALREPORT.KINROSS.COM
CORPORATE INFORMATION
Shareholder Information
Transfer Agent and Registrar
ComputershareInvestor Services Inc.Toronto, Ontario, CanadaToll-free: 1-800-564-6253
Proxy Solicitation Agent
Kingsdale Shareholder ServicesToronto, Ontario, Canada
Annual and Special Shareholders Meeting
Wednesday, May 6, 2015 at 10:00 a.m. EDT at the Glenn Gould Studio, 250 Front Street West, Toronto, Ontario, Canada
Trading Data
TSXK — commonNYSEKGC — common
Legal Counsel
Osler, Hoskin & Harcourt LLPToronto, Ontario, Canada
Sullivan & Cromwell LLPNew York, New York,United States
Auditors
KPMG LLPToronto, Ontario, Canada
Contact Information
General
Kinross Gold Corporation25 York Street, 17th FloorToronto, Ontario,Canada M5J 2V5
Website: Kinross.comTelephone: 416-365-5123Toll-free: 1-866-561-3636Facsimile: 416-363-6622Email: [email protected]
Media Relations
Andrea Mandel-CampbellVice-President, Corporate CommunicationsTelephone: 647-788-4179Email: [email protected]
Investor Relations
Tom Elliott, Vice-President,Investor RelationsTelephone: 416-365-3390Email: [email protected]
Shareholder Inquiries
ComputershareInvestor Services Inc.9th Floor,100 University AvenueToronto, Ontario,Canada M5J 2Y1www.computershare.com/kinrossToll-free: 1-800-564-6253Toll-free facsimile:1-888-453-0330
Publications
To obtain copies of Kinross’ publications, please visit our corporate website at Kinross.com, or contact us by email at [email protected] or call 1-866-561-3636.
Corporate Responsibility Report
Kinross publishes its corporate responsibility performance data annually and a comprehensiveGlobal Reporting Initiative (GRI) report every two years. Our 2013 CR Report is currently available on our website and provides a detailed account of our social, environmental, and health and safety performance for 2012 and 2013.
designed and produced by smith + associates www.smithandassoc.com Please recycle.
@KinrossGold
Operational ExcellenceBalance Sheet Strength
Responsible Mining
Delivering Results
ANNUAL REPORT 2014
KIN
ROSS G
OLD
2014 AN
NU
AL R
EP
OR
T
KINROSS GOLD CORPORATION25 York Street, 17th FloorToronto, Ontario, CanadaM5J 2V5