Embed Size (px)
Citation preview

8/6/2019 2011 07 29 Migbank Daily Technical Analysis Report+
http://slidepdf.com/reader/full/2011-07-29-migbank-daily-technical-analysis-report 1/15
DAILY TECHNICAL REPORT 29 July, 2011
MARKET S-TERMMULTI-DAY L-TERMMULTI-WEEK STRATEGY/POSITION ENTRYLEVEL OBJECTIVES/COMMENTS STOP
EUR/USD SHORT 3 1.4260 1.4020/1.3840/1.3410 1.4450
GBP/USD Buy limit 3 1.6190 1.6260/1.6350/1.6550 1.6120
USD/JPY Awaiting Trade Setup above 80.00.
USD/CHF SHORT 3 0.7997 0.7897/0.7700/0.7600 (Entered on 27/07/2011) 0.8097
USD/CAD Await Trade Setup (neutral).
AUD/USD Awaiting Trade Setup.
GBP/JPY Sell limit 3 127.00 126.25/124.50/122.36 127.75
EUR/JPY SHORT 1 117.70 105.44 (Entered on 04/07/2011) 113.70
EUR/GBP Sell limit 3 0.8810 0.8760/0.8500/0.8285 0.8860
EUR/CHF SHORT 2 1.1650 1.1270/1.1000 (Entered on 26/07/2011) 1.1575
GOLD Sell Stop 3 1590 1505/1470/1440 1605
SILVER SHORT 3 39.2800 36.7750/32.3125/28.9000 41.5500
Ron William, CMT, MSTA
Bijoy Kar, CFA
WINNER BEST SPECIALIST RESEARCH
DISCLAIMER & DISCLOSURESPlease read the disclaimer and thedisclosures which can be found atthe end of this report
Notes: Entries are in 3 units and objectives are at 3 separate levels where 1 unit will be exited. When the first objective (PT 1) has been hit the stop will be moved to the entry
point for a near risk‐free trade. When the second objective (PT 2) has been hit the stop will be moved to PT 1 locking in more profit. All orders are valid until the next report is
published, or a trading strategy alert is sent between reports.
MIG BANK Forex Broker 14, rte des Gouttes d’Or CH-2008 Neuchâtel Switzerland
Tel +41 32 722 81 00 Fax +41 32 722 81 01 [email protected] www.migbank.com

8/6/2019 2011 07 29 Migbank Daily Technical Analysis Report+
http://slidepdf.com/reader/full/2011-07-29-migbank-daily-technical-analysis-report 2/15
2
DAILY TECHNICAL REPORT29 July, 2011
www.migbank.com
Failed breakout reinforces key level at 1.4580.
EUR/USDs recent bearish engulfing reversal pattern signaled yet another
failed breakout from this ominous “Bermuda” triangle pattern. The move
(which was fuelled by broad weakness across key markets), also helped
reinforce key resistance at 1.4580, while reminding us NOT to jump the
gun too quickly in this volatile environment.
We still expect sharp price moves across key “risk” market proxies aroundour important July 29-30th cycle inflection point (+/-) 2/3 days, which
coincides (or not) with the official US Debt ceiling resolution next week.
Our long standing bearish view remains in play while the downtrend (from
May) holds. A resumption of bearish momentum will target 1.3928 (200-
DMA), where a large amount of die-hard trend followers will be watchingclosely for repeat support or a big squeeze lower. Only a close above
1.4580 will lead to a reassessment of this view.
Inversely, the US dollar index is staging an oversold bounce from key
support at 73.50-73.00. We expect this level to hold (as the last point of
defence), helping launch a rebound back into 80.00.
SPECIAL REPORT : EUR/USD ˝A Fall From Grace˝ ? Decline Targets 1.3770/1.3410. Please select link: REPORT VIDEO
S-T TREND L-T TREND STRATEGY
SHORT 3: 1.4260, Obj: 1.4020/1.3840/1.3410, Stop: 1,4450
EUR/USD
Ron William, Technical Strategist, E-mail: [email protected], Phone: +41 32 7228 454
EUR/USD
EUR/USD daily chart, Bloomberg Finance LP
US Dollar Index daily and weekly chart, with COT Liquidity, Bloomberg Finance LP
EURUSD's BERMUDA TRIANGLE
REVERSALPATTERN
AT 200 DMA(1.3928)
FAILEDBREAKOUT
REVERSALPATTERN
PIVOT ZONE
+
-
STILLUNWINDING!
US$ INDEX
(Weekly)(4 YEARS)
TD EXHAUSTIONBUY SIGNAL 13
+27% +19%
TRIGGER
(15000)
COT LIQUIDITY EXTREME NETUS $ SHORTPOSITIONS
KEY
13 SUPPORT(73.50)
US DOLLAR INDEX
(Daily – 2 years)
DEMARKEXHAUSTIONBUY SIGNALS
9
200-DMA(76.91)

8/6/2019 2011 07 29 Migbank Daily Technical Analysis Report+
http://slidepdf.com/reader/full/2011-07-29-migbank-daily-technical-analysis-report 3/15
3
DAILY TECHNICAL REPORT29 July, 2011
www.migbank.com
Short-term rising trend remains intact while above 1.6121.
GBP/USD has bounced from the 50 week moving average, currently at
1.6006. The recovery that has followed has also pushed above the
resistance of a daily bear channel, warning of a return to 1.6547 and then
1.6747.
Furthermore, long-term trend-line resistance off 2.1162 has been tested as
support, suggesting that the recovery from 1.4331, in the weekly
timeframe, remains intact.
Short-term structure present since 1.6439 suggests that we are in the
midst of a corrective phase with a return to the platform near 1.6200 now
favoured, hence our recommendation at 1.6190.
Failure to remain above 1.6200 will warn of a fresh relapse.
S-T TREND L-T TREND STRATEGY
Buy limit 3 at 1.6190, Objs: 1.6260/1.6350/1.6550, Stop: 1.6120.
GBP/USD
Bijoy Kar, Technical Strategist, E-mail: [email protected], Phone: +41 32 7228 424
GBP/USD
GBP/USD hourly chart, Bloomberg Finance LP
GBP/USD weekly chart, Bloomberg Finance LP

8/6/2019 2011 07 29 Migbank Daily Technical Analysis Report+
http://slidepdf.com/reader/full/2011-07-29-migbank-daily-technical-analysis-report 4/15

8/6/2019 2011 07 29 Migbank Daily Technical Analysis Report+
http://slidepdf.com/reader/full/2011-07-29-migbank-daily-technical-analysis-report 5/15
5
DAILY TECHNICAL REPORT29 July, 2011
www.migbank.com
Maintains a tight consolidation range, awaiting a breakout.
USD/CHF continues to trade close to the support of a multi-month fallingwedge formation. In fact a tight consolidation range has developed with a
breakout expected to the downside, ahead of a possible recovery higher.
We also view the short-term structure present since 0.8278 as being
bearish in nature and look for an extension lower, towards 0.7900 initially.
We note that a push under the long-term wedge support is required to
complete this ultimately bullish long term pattern.
Should this break lower take place, the probability of a recovery higher
would then be increased.
In the absence of a break under the wedge support, we look for a push
back over 0.8551 before considering longs.
S-T TREND L-T TREND STRATEGY
Short 3 at 0.7997, Objs: 0.7897/0.7700/0.7600, Stop: 0.8097.
USD/CHF hourly chart, Bloomberg Finance LP
Bijoy Kar, Technical Strategist, E-mail: [email protected], Phone: +41 32 7228 424
USD/CHFUSD/CHF
USD/CHF daily chart, Bloomberg Finance LP

8/6/2019 2011 07 29 Migbank Daily Technical Analysis Report+
http://slidepdf.com/reader/full/2011-07-29-migbank-daily-technical-analysis-report 6/15
6
DAILY TECHNICAL REPORT29 July, 2011
www.migbank.com
Unwinding from multi-year lows.
USD/CAD is once again unwinding from multi-year lows at 0.9407 and itsextremely oversold conditions. Corrective activity was originally triggered
after the rate’s expanding pattern initially failed at key resistance into
0.9906-0.9915 (38.2% Fib-Sept 2010 decline & 200 DMA).
Meantime, our medium/long-term perspective remains neutralised after
the failed breakout from the multi-month wedge pattern.
Indeed, the bulls must now recapture 0.9779 (12th July high), to achieve a
sustainable recovery into 0.9968 (17th March high) and 1.0000 (parity
level).
Elsewhere, EUR/CAD is consolidating having recently breached its 200-day
MA. Key support can be found at 1.3379 (61.8% Fib).
In contrast, CHF/CAD continues to exhibit volatile prices swing within its
trading range, while attempting to retest the 2011 highs at 1.1887. We are
watching bullish probes closely for a potential breakout to the upside.
Such a move would re-establish the uptrend and signal further unwinding
of risk appetite in the global markets.
S-T TREND L-T TREND STRATEGY
Awaiting trade setup (Neutral).
Ron William, Technical Strategist, E-mail: [email protected], Phone: +41 32 7228 454
USD/CAD
USD/CAD daily and chart, Bloomberg Finance LP
EUR/CAD and CHF/CAD daily chart, Bloomberg Finance LP
USD/CAD(Weekly )
0.9059
TDBUYSIGNAL
13
EXHAUSTION
FAILED
FALLINGWEDGE
CHANNEL
BREAKOUT
FROM
EXPANDINGPATTERN
INITIAL FAILURE
USD/CAD (Daily)
AT RESISTANCE
MAJOR LOW(0.9446)
61.8%(1.3379)
MAJOR RESISTANCE
EUR/CAD(Daily)
200-DMA
(1.3715)
38.2%(1474.69)
50%(1474.69)
CHF
61.8%(1474.69)
/CAD (Daily)

8/6/2019 2011 07 29 Migbank Daily Technical Analysis Report+
http://slidepdf.com/reader/full/2011-07-29-migbank-daily-technical-analysis-report 7/15
7
DAILY TECHNICAL REPORT29 July, 2011
www.migbank.com
NEW multi year highs under pressure?
AUD/USD has sharply unwound from its multi-year highs at 1.1081. Nextresistance can be found at the psychological level of 1.1200. We are still
watching to buy on a pullback, but would prefer to see sustained gains at
these extreme levels.
Meantime, support can be found at 1.0810 and 1.0443 (TDST line),
thereafter unlocking extended downside scope into 1.0359 (50% Fib), then
1.0205 and 0.9990.
Elsewhere, the Aussie dollar remains weak against the New Zealand dollar.
The pair is still locked within its new bear cycle structure while it holds
beneath its 200-day MA. Key support can be found at 1.2500/1.2463.
The Aussie dollar has also weakened against the Japanese yen, back into
its multi-month pattern floor. Only a confirmed downside breakout would
signal a switch to risk aversion in the financial community.
S-T TREND L-T TREND STRATEGY
Awaiting Trade Setup.
AUD/USD
Ron William, Technical Strategist, E-mail: [email protected], Phone: +41 32 7228 454
AUD/NZD and AUD/JPY daily chart, Bloomberg Finance LP
AUD/USD daily chart, Bloomberg Finance LP
0.9804
0.9706
KEY SUPPORT
V-SHAPEUPSIDE REVERSAL
0.9537
1.0256
AUD/USD (Daily – 1 YEAR)
1.0200200-DMA(1.0234)
200-DMACAPSBEARMKT
AUD/NZD
(Daily)
KEY SUPPORT1.2500 / 1.2463
38.2%(84.09)
POTENTIALBREAKOUT
ADDS TO61.8%(80.42)
EXHAUSTIONSELL SIGNAL
RISKAVERSION
50%(82.25)
AUD/JPY
(Daily)
TD
200-DMA(83.75)

8/6/2019 2011 07 29 Migbank Daily Technical Analysis Report+
http://slidepdf.com/reader/full/2011-07-29-migbank-daily-technical-analysis-report 8/15
8
DAILY TECHNICAL REPORT29 July, 2011
www.migbank.com
Breaks out of hourly consolidation pattern to the downside.
GBP/JPY has thus far met resistance close to the prior swing low at 128.17,reaching 128.43.
This was followed by a period of consolidation which has now resolved
lower, pushing under both 126.73/66. We now see scope for a short-term
squeeze higher ahead of a fresh swing to the downside.
This now returns our bias back towards the daily bear channel support,
currently at 123.15.
Back over 127.70 will neutralise the short-term outlook, but in the
meantime, assuming a general risk off atmosphere can be maintained,
scope is seen for continued weakness.
S-T TREND L-T TREND STRATEGY
Sell limit 3 at 127.00, Objs: 126.25/124.50/122.36, Stop: 127.75.
GBP/JPY
GBP/JPY daily chart, Bloomberg Finance LP
Bijoy Kar, Technical Strategist, E-mail: [email protected], Phone: +41 32 7228 424
GBP/JPY hourly chart, Bloomberg Finance LP

8/6/2019 2011 07 29 Migbank Daily Technical Analysis Report+
http://slidepdf.com/reader/full/2011-07-29-migbank-daily-technical-analysis-report 9/15
9
DAILY TECHNICAL REPORT29 July, 2011
www.migbank.com
Structuure present since 113.57 suggests an extension lower.
EUR/JPY has broken down again after completing a recovery phasefollowing the peak at 123.33 and then subsequently failing to hold over
116.00.
We combine this with the recent break under the platform near 113.42/50,
which also constitutes a push under the 200 day moving average.
Losses from yesterday have broken under trend-line support off 109.63,
which weakens the outlook further. In fact short-term structure present since 113.57 suggests scope for a
substantial extension lower beyond 109.58 targeting the 107.00 area
initially.
However, we continue to favour a full retrace back to 105.44 over the
coming weeks.
We also note that the recent sharp fall has moved the price back under the
50 week moving average.
Failure to remain under 113.57 on a daily closing basis will warn of an end
to weakness and a return to strength.
S-T TREND L-T TREND STRATEGY
Short 1 at 117.70, Obj: 105.44, Stop: 113.70.
EUR/JPY hourly chart, Bloomberg Finance LP
Bijoy Kar, Technical Strategist, E-mail: [email protected], Phone: +41 32 7228 424
EUR/JPY daily chart, Bloomberg Finance LP
EUR/JPY EUR/JPY EUR/JPY EUR/JPY

8/6/2019 2011 07 29 Migbank Daily Technical Analysis Report+
http://slidepdf.com/reader/full/2011-07-29-migbank-daily-technical-analysis-report 10/15
10
DAILY TECHNICAL REPORT29 July, 2011
www.migbank.com
Break under support warns of fresh leg lower.
Trade recommendation altered again. EUR/GBP appears to have completed the rising phase seen since 0.8285,
with the move lower from 0.9084 meeting 0.8705 thus far.
A return to the 200 day moving average is now favoured. This currently
lies near 0.8667.
The break out of the rising hourly channel suggests the resumption of a
fresh leg lower. With this in mind we seek a lower high to initiate a shortposition.
Back over 0.8850 is required to negate this short-term bearish outlook.
We also note that a push under 0.8611 is required to break down the
current longer-term bullish structure.
S-T TREND L-T TREND STRATEGY
Sell limit 3 at 0.8810, Objs: 0.8760/0.8500/0.8285, Stop: 0.8860. EUR/GBP hourly chart, Bloomberg Finance LP
EUR/GBP weekly chart, Bloomberg Finance LP
EUR/GBPEUR/GBP
Bijoy Kar, Technical Strategist, E-mail: [email protected], Phone: +41 32 7228 424

8/6/2019 2011 07 29 Migbank Daily Technical Analysis Report+
http://slidepdf.com/reader/full/2011-07-29-migbank-daily-technical-analysis-report 11/15
11
DAILY TECHNICAL REPORT29 July, 2011
www.migbank.com
Under 1.1519 opens up a return to 1.1374.
Stop lowered to 1.1575. EUR/CHF has registered a lower high at 1.1892 last week, after leaving a
false break out of a rising channel.
After maintaining the break under the 61.8% retrace of the 1.1374-1.1892
rise, we expect a re-test and potential break under the recent low at
1.1374.
The longer-term falling trend remains intact and while under 1.1892 wewould favour a continuation of this larger trend.
We note, that in the absence of further stresses from the Eurozone
periphery, that a strong recovery higher would become likely due to the
probable extreme short positioning in this market.
S-T TREND L-T TREND
Short 2 at 1.1650, Objs: 1.1270/1.1000, Stop: 1.1575.
EUR/CHF daily chart, Bloomberg Finance LP
EUR/CHF
EUR/CHF hourly chart, Bloomberg Finance LP
Bijoy Kar, Technical Strategist, E-mail: [email protected], Phone: +41 32 7228 424

8/6/2019 2011 07 29 Migbank Daily Technical Analysis Report+
http://slidepdf.com/reader/full/2011-07-29-migbank-daily-technical-analysis-report 12/15
12
DAILY TECHNICAL REPORT29 July, 2011
www.migbank.com
Gold prices struggle beneath resistance at 1624-1640.
Raised sell order to 1590. Gold prices are struggling beneath resistance at1620-24 and 1640. The yellow metal MUST close above these levels in
order to confirm sustainable extensions higher in line with the major
uptrend towards 1700.00.
Until then, we prefer to hedge for downside risks following the recent
unprecedented explosive upside move, which triggered a confluence of our momentum exhaustion signals.
As previously stated, it is critical the market confirmed a reversal beneath a
filtered price/time trigger point. This downside trigger level still holds at
1588/82.
In terms of the big picture, we continue to watch price activity within the
apex of the 12-year exhaustion pattern (illustrated on the weekly log chart),
which has also developed a unique long-term DeMark™ exhaustion signal.
Gold’s COT liquidity indicator (net long positions) remains squeezed within
a tight range (as Gold continued to push to record highs on lower volume).
At this stage, the risk remains for a downside breakout which would unlock
over 1.5 years of sizeable gold long positions.
S-T TREND L-T TREND STRATEGY
Sell Stop 3 at 1590, Obj: 1505,1470, 1440 Stop: 1605
GOLD
Gold daily, weekly chart and COT liquidity, Bloomberg Finance LP
Ron William, Technical Strategist, E-mail: [email protected], Phone: +41 32 7228 454
8/6/2019 2011 07 29 Migbank Daily Technical Analysis Report+
http://slidepdf.com/reader/full/2011-07-29-migbank-daily-technical-analysis-report 13/15
13
DAILY TECHNICAL REPORT29 July, 2011
www.migbank.com
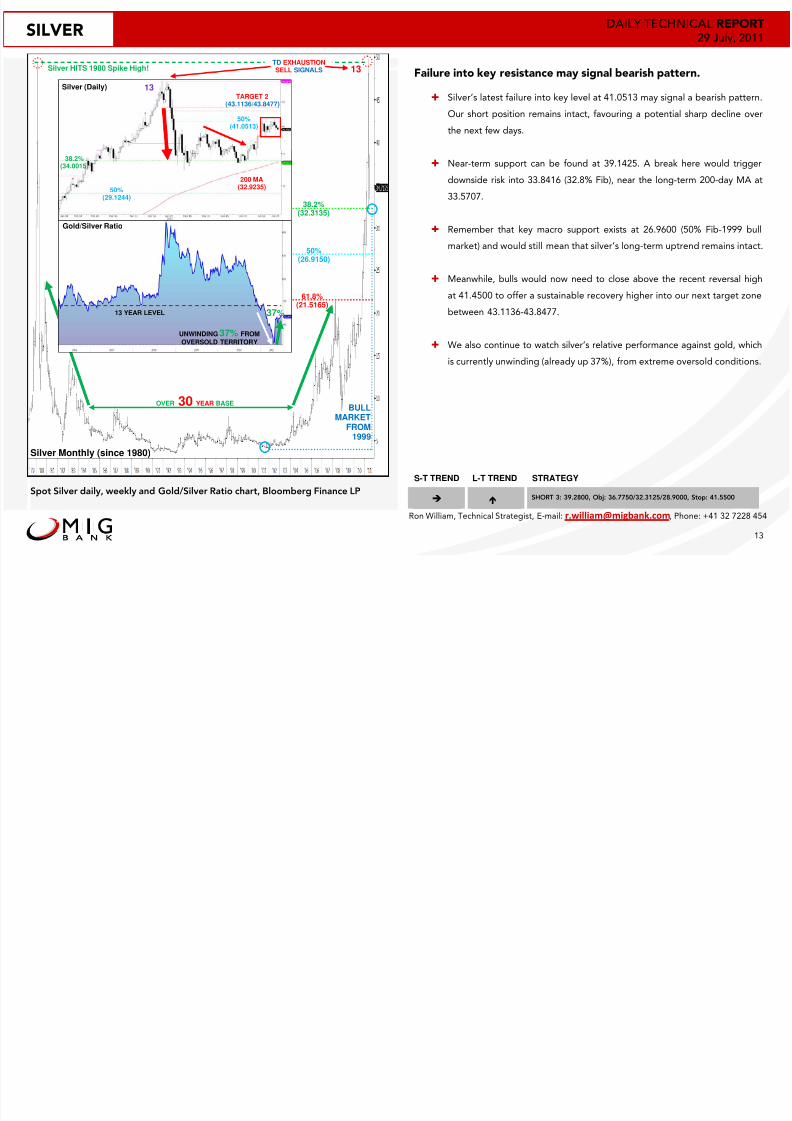
Failure into key resistance may signal bearish pattern.
Silver’s latest failure into key level at 41.0513 may signal a bearish pattern.Our short position remains intact, favouring a potential sharp decline over
the next few days.
Near-term support can be found at 39.1425. A break here would trigger
downside risk into 33.8416 (32.8% Fib), near the long-term 200-day MA at
33.5707.
Remember that key macro support exists at 26.9600 (50% Fib-1999 bull
market) and would still mean that silver’s long-term uptrend remains intact.
Meanwhile, bulls would now need to close above the recent reversal high
at 41.4500 to offer a sustainable recovery higher into our next target zone
between 43.1136-43.8477.
We also continue to watch silver’s relative performance against gold, which
is currently unwinding (already up 37%), from extreme oversold conditions.
S-T TREND L-T TREND STRATEGY
SHORT 3: 39.2800, Obj: 36.7750/32.3125/28.9000, Stop: 41.5500
SILVER
Spot Silver daily, weekly and Gold/Silver Ratio chart, Bloomberg Finance LP
Ron William, Technical Strategist, E-mail: [email protected], Phone: +41 32 7228 454
BULLMARKET
FROM1999
Silver Monthly (since 1980)
13
OVER BASE
38.2%(32.3135)
50%(26.9150)
30 YEAR
61.8%(21.5165)
Silver HITS 1980 Spike High!
TD EXHAUSTIONSIGNALSSELL
UNWINDING 37% FROMOVERSOLD TERRITORY
Gold/Silver Ratio
37%13 YEAR LEVEL
TARGET 2(43.1136/43.8477)
Silver (Daily) 13
38.2%(34.0015)
50%
(29.1244)
200 MA(32.9235)
50%(41.0513)
LEGAL
8/6/2019 2011 07 29 Migbank Daily Technical Analysis Report+
http://slidepdf.com/reader/full/2011-07-29-migbank-daily-technical-analysis-report 14/15
14
DAILY TECHNICAL REPORT29 July, 2011
www.migbank.com
Limitation of liability
MIG BANK disclaims, without limitation, all liability for any loss or damage of any kind,including any direct, indirect or consequential damages.
Material Interests
MIG BANK and/or its board of directors, executive management and employees may have
or have had interests or positions on, relevant securities.
Copyright
All material produced is copyright to MIG BANK and may not be copied, e-mailed, faxed or
distributed without the express permission of MIG BANK
Notes: Entries are in 3 units and objectives are at 3 separate levels where 1
unit will be exited. When the first objective (PT 1) has been hit the stop will be
moved to the entry point for a near risk-free trade. When the second objective
(PT 2) has been hit the stop will be moved to PT 1 locking in more profit. All
orders are valid until the next report is published, or a trading strategy alert is
sent between reports.
No information published constitutes a solicitation or offer, or
recommendation, to buy or sell any investment instrument, to effect
any transactions, or to conclude any legal act of any kind whatsoever.
The information published and opinions expressed are provided by
MIG BANK for personal use and for informational purposes only and
are subject to change without notice. MIG BANK makes no
representations (either expressed or implied) that the information and
opinions expressed are accurate, complete or up to date. In
particular, nothing contained constitutes financial, legal, tax or other
advice, nor should any investment or any other decisions be made
solely based on the content. You should obtain advice from a
qualified expert before making any investment decision.
All opinion is based upon sources that MIG BANK believes to be
reliable but they have no guarantees that this is the case. Therefore,
whilst every effort is made to ensure that the content is accurate and
complete, MIG BANK makes no such claim.
No information published constitutes a solicitation or offer, or
recommendation, to buy or sell any investment instrument, to effect
any transactions, or to conclude any legal act of any kind whatsoever.
The information published and opinions expressed are provided by
D I S
C L A
I M E R
LEGALTERMS

8/6/2019 2011 07 29 Migbank Daily Technical Analysis Report+
http://slidepdf.com/reader/full/2011-07-29-migbank-daily-technical-analysis-report 15/15
15
DAILY TECHNICAL REPORT29 July, 2011
www.migbank.com
Howard FriendChief Market Strategist
[email protected] StrategistBjioy Kar
Tel.+41 32 722 81 00CH-2008 Neuchâtel14, rte des Gouttes d’Or
www.migbank.com
MIG BANK [email protected]
[email protected] StrategistRon William
CONTACT