Embed Size (px)
Citation preview
Title: Systems immunology: a primer for biophysicists. Authors: Grégoire Altan-Bonnet1 and Thierry Emonet2,3 Affiliations: 1 ImmunoDynamics Group, Programs in Computational Biology and Immunology, Memorial Sloan-Kettering Cancer Center, New York, NY 10065, USA. Email: [email protected] 2 Department of Molecular, Cellular, and Developmental Biology, Yale University, New Haven CT 06520, USA. Email: [email protected] 3 Interdepartmental Program in Computational Biology and Bioinformatics, Yale University, New Haven, CT 06520, USA Keywords: Systems Immunology Computer modeling Immunology Ligand-receptor interaction T cell signaling Robusntess Phenotypic Variability Cell division Lymphocyte proliferation Quantitative Biology
Synopsis (50-100 words) This chapter is an introduction, focused on T cell biology, for biophysicists interested in the burgeoning field of systems immunology. First we introduce three fundamental issues about immune responses that call for a quantitative understanding. Second we review recent work on T cell activation that combines theoretical modeling and experimental work. Finally, we review different models of T cell proliferation. We highlight how immunology benefits from more quantitative approaches (both experimentally and theoretically) and how the immune system is ideal to develop and test new concepts in systems biology. This chapter reviews few problems in Immunology where biophysics or (to be more current with our time’s semantics) systems biology or quantitative biology contributed critically to our understanding. Immunology is not a discipline often studied by biophysicists, physicists or systems biologists. For historical and practical reasons, immunology has been developed for the last 150 years mostly by clinicians and veterinarians. Accordingly, the ultimate goal of immunology has been to understand the immune system to unleash its full potential against diseases –infection or cancer- or to tame its spurious activity in autoimmune disorders. This medical focus has led to the use of a sophisticated terminology and many empirical observations that can appear challenging to the newcomer. However, many key contributors to immunology have relied on concepts or techniques borrowed from other fields: for example, Pasteur’s insight on vaccination and Lansteiner’s classification of blood groups heavily rely on concepts from chemistry; Tonegawa’s study of antibody diversity stemmed from a molecular biologist’s interest (Silverstein, 2001). Hence, despite the apparent opacity of immunology as a field, the study of the immune system benefits from many different scientific approaches. This chapter aims at opening up the study of the immune system to “quantitative biologists”: we are reviewing the field to point out how quantitative measurements on the immune system are calling for more sophisticated modeling efforts that will develop a more quantitative framework to understanding immune responses. Our goal is to entice biophysicists to study the immune system as an ideal “complex” system. As the –omics revolution (i.e. progress in genomics, proteomics etc.) is increasing the amount of experimental observations on biological systems, from neuroscience to development, biologists are looking for systems whose complexity is “manageable”: this implies an ease to manipulate the system, and a library of perturbation tools that 150 years of immunology and specific characteristics of the immune system deliver. As discussed in this chapter, the immune system is a dynamical collection of cells that communicate via cell-cell contact and chemical secretion: immune responses are readily studied as emergent properties of these cells, and the network of their extracellular interactions can be easily manipulated. Our aim is to point out not only how much Immunology benefits from more quantitative approaches, but also why quantitative biologists should consider the immune system as a great subject to study complexity in biology.
The immune system is classically divided into two components (Murphy et al., 2008b): the innate immune system that relies on germline-encoded genes that recognize molecular signatures derived from pathogens (e.g. liposaccharides, single-stranded RNA) and the adaptive immune system that relies on somatically-mutated receptors to recognize other molecular signatures derived from pathogens (so-called antigens). Both systems are comprised of a vast arsenal of cell types, but, for clarity and brevity we focus on one subset of the cellular arsenal, the T lymphocytes. These T cells are white blood cells that orchestrate the adaptive immune response, by unleashing cytotoxic destruction of infected cells. T cells activate/recruit other immune cells, such as B cells or
macrophages, by secreting cytokines. They also suppress spurious triggering of the immune system that otherwise may develop into auto-immune disorders. Because of their varied functions, the study of T cells has been the centerfold of the Immunology field for the last 30 years.
This chapter is organized in three sections. The first section introduces three classical problems of immunology and explains why fundamental issues about immune responses call for a quantitative understanding. To help biophysicists acquire a modicum of the experimental arsenal available to immunologists, this section also introduces the main experimental techniques used in the study of the immune system. The second section reviews recent work on T cell activation that combines theoretical modeling and experimental work. In the last section, we review different models of T cell proliferation. This chapter does not pretend to be exhaustive, and avoids consciously a lot of the technical details and nomenclatures used by immunologists to be used as an introduction to the burgeoning field of systems immunology. 1. Overview of systems immunology. The immune system relies on the ability of its lymphocytes to detect foreign polypeptides to focus a specific immune response against infected cells or against the pathogens themselves, without harming healthy tissues. Pioneering work by Ehrlich (Silverstein, 2001) introduced the notion of self/non-self discrimination, which turned out to be a powerful concept that led to many discoveries in immunology. The central theory for modern cellular immunology was initiated by Burnett in the 1950s and named clonal selection theory. This work was truly theoretical in its formalism, as Burnett enunciated 4 postulates that had to wait for experimental confirmations later on. First, each lymphocyte (B or T cell) is endowed with a single type of antigen receptor. Second, these receptors need to be engaged by an antigen to activate the carrying cell. Third, the activated cells gain new functions while keeping the identity of their receptor. Fourth, self-reactive cells (i.e. cells whose receptors are engaged by antigens from self tissues) are eliminated. These four postulates really constitute a theoretical framework to account for the dynamics of immune responses: upon implementation, they can establish how self/non-self discrimination in the immune system emerges from the activation of individual cells.
The impact of the clonal selection theory for the field of Immunology has been immense yet limited: immense as it constituted the conceptual framework for experimental discoveries; limited in the sense that it could not deliver explicit predictions for molecular mechanisms to be tested experimentally. The clonal selection theory remains essentially correct even though it required major updates: recent discoveries highlighted the role of the innate system (Janeway and Medzhitov, 2002): inflammatory responses against pathogen-associated molecules are necessary to validate adaptive immune responses against pathogenic antigens. Hence self/non-self discrimination by lymphocytes is cross-checked with environmental status. Moreover, recent studies have shown that there exists self-responsive T cell clones circulating in the body and peripheral mechanisms that enforce tolerance (Sakaguchi, 2004). As Immunology progresses, our knowledge of the complexity of molecular and cellular controls of the immune responses becomes ever more complete (Janeway, 1989, Medzhitov, 2009). Yet, there is a need for more theoretical studies to both synthesize current knowledge, identify conceptual problems but also to anticipate new experimental discoveries (Matzinger, 2007). Biophysics and Systems Biology may help expand our theoretical understanding of the immune system as discussed below. 1.1. Three problems of immunology for Biophysicists
In this section, we discuss three classic questions about the immune system. We present simplified examples to highlight how quantitative modeling can help address these issues.
1.1.1. Affinity maturation A classic field of study where quantitative modeling contributed to our understanding of immunology is the issue of affinity maturation for antibodies produced by B cells. At the early stage of an infection, a large set of B cell clones may recognize antigens from pathogens and get activated. This triggers a program of differentiation whereby B cells switch the class of antibody it produces (from the low affinity multivalent IgM to the higher affinity divalent IgG or others) and use somatic hyper-mutation targeted onto the Ig genes to evolve a better set of antibody. As conjectured by the Clonal Selection Theory (and essentially validated with molecular details later on), B cell clones that are of higher affinity get to proliferate and accumulate more mutations, while B cell clones of lower affinities die by apoptosis. The end result is that, over the course of a primary infection, followed by a recall infection, the average affinity of antibodies produced by B cells to recognize a given pathogen can increase by more than 104 fold (Eisen and Siskind, 1964). This observation has been a watershed for Biophysicists, leading them to quantify this affinity maturation, and dissect it at the structural level. Moreover, early efforts in modeling (as reviewed in the classic “Immunology for Physicists” (Perelson and Weisbuch, 1997)) implemented the clonal selection theory and demonstrated how phenomenological models based on prey-predator frameworks could account for antibody affinity maturation. However, the impact of these models remained more conceptual (with a huge impact in the field of artificial immune systems by computer scientists (Hofmeyr and Forrest, 2000)) than functional as a lot of molecular details remained unknown at the time. Recent progress have identified key mechanisms involved in affinity maturation, from the mutation machinery (Chaudhuri et al., 2007, Dudley et al., 2005, Chaudhuri et al., 2003, Teng and Papavasiliou, 2007), to the kinetics of formation of germinal centers (Allen et al., 2007), where B and T cells interact to orchestrate affinity maturation. Hence, a lot of quantitative details of antibody affinity maturation are being measured and calling for more integrated, molecularly-accurate and self-contained models. 1.1.2. Explosive and controlled cell proliferation in the adaptive immune system. One striking feature of the immune system is its explosiveness in response to pathogenic challenges. To match the rapid proliferation of viruses and bacteria, the immune system must rely on the rapid proliferation and expansion of B & T cell clones that can specifically target the pathogen. The amplification of the response can be large, up to 105-fold expansion for T cells within days following infection (Blattman et al., 2002, Hataye et al., 2006). Amazingly, despite being always ready to mount such explosive responses, the immune system rarely misfires in response to spurious challenges. Auto-immune disorders, which are attacks to self-tissues, are relatively rare considering the constant pathogenic challenges that our body experiences daily. This controlled-explosiveness is an important property of immune responses for systems biologists to ponder (De Boer et al., 2001). Importantly, the process is highly dynamic because the immune system cannot and does not maintain this large population of proliferating T cells. Instead it uses contraction by apoptosis to return a T cell clone population to its original frequency, albeit in a memory stage with extended lifetime and enhanced responsiveness rather than a naïve stage (Hataye et al., 2006). Understanding
quantitatively how expansion and contraction are finely tuned to match the pathogenic onslaught while maintaining the overall long-term organization of the immune system remains a quantitative challenge for systems immunologists. 1.1.3. Immune memory and vaccination.
The oldest and most fascinating observation pertaining to the science of Immunology came with the historian Thucydides. As a first witness of the great Athenian plague in 429 BC, Thucydides reported how sick individuals that survived their infection, were “immune” to subsequent infection and could tend to sick patients without risk to their own health. Such circumstantial evidence of immunity was repeated after that, but the first example of practical implementation of this observation belongs to Indian physicians of the 8th century of our era (Hopkins, 2002) who used variolation (the inoculation of smallpox on skin scabs) to immunize people against smallpox. Such manipulation of the immune system to generate a memory of past infections was generalized and conceptualized by Jenner and Pasteur in the XIXth century and enabled the eradication of diseases by vaccination during the XXth century. Immunological memory (and its importance for public health) cannot be underestimated, and remains a fascinating question in Immunology (Ahmed and Gray, 1996, Zinkernagel et al., 1996). The immune system is able to maintain a set of cells that differentiated during a first exposure to a pathogen to lead the response during a second exposure. Amazingly, these memory cells and their associated immunological memory can be maintained across the whole lifespan of an individual. Memory cells are plasma B cells (that produce high levels of neutralizing antibodies that recognize the pathogen with high affinity) or cytotoxic T cells (that specifically kill cells infected with viruses that do not induce degeneration). At the quantitative level, the striking characteristic of these memory cells is their enhanced capacity to “snip an infection at the bud” based on faster kinetics and stronger amplitude of their response. At the molecular level, immunological memories can be quantified with the amount of antibodies and their affinity to pathogenic antigens or by the number and efficiency of cytotoxic T cells that participate in infection clearance (during a so-called recall). In fact, these quantitative characteristics are mostly distinguishes memory cells from naïve cells (faster arming of cytotoxic capabilities, faster proliferation etc.): at the cellular level, the difference between naïve and memory cells is practically quantitative rather than qualitative. Thus the establishment of immune memory must be modeled as a preconditioning of the immune system for faster/stronger response. Immunologists have focused on identifying markers of memory states (this has practical consequences when testing and optimizing new vaccines), but systems biology is needed to analyze quantitatively the dynamics of the generation, maintenance and recall of memory lymphocytes (Antia et al., 2005).
1.2. The scalable complexity of the immune system, in times & space
Here, we introduce the main components of the adaptive immune response. As described previously, mounting a successful immune response invokes many processes, from targeted mutations to cell proliferation and death to cell maintenance. Hence, many timescales must be integrated in any model of the immune system. For example, when focusing on T cell response, activation occurs on molecular timescales, with the recognition of foreign-derived ligands taking
place within seconds of engagement with antigens; the signaling response associated with ligand recognition by its receptor has characteristic timescales from min to hr; a cytotoxic response (release of hole-forming proteins to kill infected cells) takes minutes to hours, transcriptional programs are activated on timescales from hours to days; the proliferation and death program starts typically after 24hr and terminates after a week; finally, the maintenance of memory T cells must be understood across the lifetime of the organisms (years). Hence, immune responses broach many timescales (from seconds to years) and these timescales are not necessarily well-separated: for example, the activation of transcriptional programs implies new surface receptors that modulate the signaling responses of T cells over long timescales, or the proliferation and death of T cells influence the size of the effector pool and the amount of available cytokines secreted by T cells. The rich dynamics involved in T cell activation is critical in enabling the immune system to rapidly adapt to dynamic challenges: from its ability to trigger macroscopic responses in terms of cytokine secretion or cell proliferation, to the need to terminate the response upon pathogenic clearance and to maintain homeostatis.
1.3. A simplified list of key players in the immune response orchestrated by T cells. The exceptional molecular and cellular complexity of the immune system implies a large corpus of knowledge necessary to navigate the field and read immunology papers. This has often been a limiting step for physicists, mathematicians or even biologists outside of immunology to participate in the study of the immune system Here we compile a modicum of information to help newcomers entering the field of systems immunology. For reason of space and clarity, we are focusing solely on the adaptive immune response mediated by T cells. This is of course a major simplification considering the diversity of cell types involved in an immune response: dendritic cells, eosinophils, macrophages, mast cells, basophils, natural killer cells etc. The contribution of these cells to an immune response is critical, since their activation is the green light that triggers the adaptive immune response. As a further simplification, we will not talk about B cells despite the fact that they contribute critically to the adaptive response by presenting antigens to T cells and by releasing neutralizing antibodies upon activation. Understanding the role played by all these cells will require large experimental datasets that will have to be integrated one day into a complete dynamical model of the immune system. T cells in the immune system can be categorized in three main states. As thymocytes, T cells are undergoing a strict developmental program of positive and negative selection for responsiveness against self antigens in the thymus. As naïve lymphocytes that live in peripheral lymphoid tissues, T cells survive in a quiescent state until they recognize an antigen that triggers their activation, differentiation and proliferation. At that point they are called T effector cells. Finally, T cells also exist as memory cells, which maintain the expression of the same receptor as the naïve cells from which they originated The activation of a T cell starts with the engagement of the T cell receptor (TCR) with agonistic antigens. T cell antigens consist of short peptides (made of 8 to 10 amino acids) that are loaded onto Major Histocompatibility Complexes (MHC). These complex are presented on the surface of other cells, such as dendritic cells, macrophages or B cells, which are the main antigen-presenting cells, a.k.a. APC. Following their activation, T cell can follow various routes depending on the coreceptors that they express (CD4 or CD8), and the inflammatory environments they encounter. T cells can become cytotoxic, i.e. release proteins (perforin, granzymes) that poke holes into target (infected) cells. T cells can also gain helper functions, whereby they synthesize and secrete proteins (cytokines or interleukins) that diffuse in the extracellular medium to orchestrate the
immune response of other cells beside themselves. There exist three main types of helper cells: so-called Th1 cells trigger a cellular immune response by releasing interferon cytokines that boost cytotoxicity and macrophage phagocytic activity; Th2 cells trigger the humoral immune responses by driving B cell differentiation; Th17 cells orchestrate the adaptive immune response to control microbial populations in mucosal tissues. These three main subtypes of helper T cells can be quantitatively recognized based on the pattern of interleukins they secrete: IFNγ and IL-12 for Th1 cells, IL-4 for Th2 cells, IL-17, IL-21 and IL-23 for Th17 cells. 1.4. Experimental toolkit for Biophysicists studying the immune system. In this section, we introduce the experimental toolkit that Biophysicists could and should borrow from Immunologists to study the immune system. This leads us to emphasize how the immune system may be an ideal system of study for quantitative biologists who aim at tackling biological complexity, both experimentally and theoretically.
1.4.1. Extracting quantitative parameters about the immune system.
Single-cell phenotyping is the most ubiquitous tool used by immunologists. In a typical immunology experiment, a mouse is exposed to a pathogen, sacrificed at different timepoints, its spleen and lymph nodes are harvested and prepared in a single suspension. Next the harvested cells are stained with fluorophore-coupled antibodies that target different proteins expressed on the surface or (if the cells have been fixed and permeabilized) intracellularly. Immunologists then analyzed this sample through a flow cytometer to acquire the multi-distribution of staining within the cell suspension.
Such single-cell phenotyping has largely been limited to analysis of surface markers or secreted proteins such as cytokines. Typically, an immunology experiment tracks a particular cohort of cells (e.g. T lymphocytes) during an immune response: in terms of differentiation (up/downregulation of surface markers of secretion of cytokines), in terms of location (expression of chemokine receptors, localization in different organs) or in terms of numbers (monitoring of proliferation and death). In these cases, qualitative differences between experimental conditions (e.g. wild-type vs some genetic modifications) are being sought after. However, we want to emphasize that more quantitative information can be extracted from similar experimental measurements and that such data is critical to develop quantitative models.
Very simple calibration protocols have been used to yield more quantitative measurements on the immune responses. In order to quantify the immune responses, one needs to measure the number of cells, what molecules they are secreting or presenting on their surface, and how these molecules are being sensed by other cells. First, rate constants and binding affinity between receptors and ligand can be measured. The generalization of the surface plasmon resonance techniques (Aslan et al., 2005), and better experimental protocols to purify soluble version of proteins of immunological interest, have led experimentalists to measure the biophysical characteristics of the components of the immune system. For example, in section 2.1, we present the example of the TCR/pMHC and few cytokine/cytokine receptor interactions. Second, absolute numbers of proteins are readily measurable. For example, using calibration beads and well-characterized monoclonal antibodies, experimentalists can measure absolute level of expression for surface proteins (e.g. TCR, CD4/8 etc). Using purified proteins, one can calibrate western blot measurements to determine the number of proteins per cell in a lysate. Note that quantitative mass spectrometry (Baxter and Hodgkin, 2002) is being generalized to provide
systematic quantitative information on the levels of expression of proteins and post-transcriptionally modified proteins (phosphorylation, glycosylation etc.)
Third, beyond molecular components, counting the absolute number of cells within an organ can be done by flow cytometry.
These various techniques yield “hard” numbers that can generate complex statistical observations and superbly constrain any mathematical model of the immune response (Deenick et al., Gett and Hodgkin). The generalization of multicolor cytometers equipped with multiple lasers (4), and multiple detectors (typically 16) allow experimenters to monitor the complexity of immune responses.(Hale et al.): typically, one can use 10 detectors to separate different subpopulation of lymphocytes (B and T cells) or of monocytes (DC, macrophages etc.). Within each subpopulation, one can characterize the cellular state of differentiation by staining for cytokines under production or by monitoring the dilution of fluorescent markers or other cellular characteristics. Ultimately, the complexity of the dataset to be acquired is determined by the panel of available antibodies. For historical reason, Immunology is quite unique in that respect, because such repertoire of antibody can be quite exhaustive. Note that the high flow rates of acquisition managed by modern-day flow cytometers allow experimenters to acquire up to 25,000 cells per second. Hence studying a whole spleen (150 Millions cells) or focusing on rare subpopulation is easily achievable with modern-day machines.
To conclude, immunology is a field that yields unprecedented wealth of quantitative measurements on a complex biological system. Such experimental parametrization should enable the development of computer models that maintain molecular realism while aiming at understanding macroscopic function. So far, computer models in immunology have not taken advantage of this wealth of information and have remained mostly phenomenological. As a result, these models have had a reduced impact on the field of Immunology, as their lack of molecular details made them hardly falsifiable by experimental measurements.
1.4.2. Measuring cell division and death.
As detailed in section 3, a large part of modeling the immune system relates to the “bean counting” of lymphocyte proliferation during an immune response. There exists a large panoply of experimental tools that allow experimenters to quantify proliferation and death in the immune system. To detect cell division, experimenters can rely on the presentation of surface markers (Ki67) or the incorporation of tagged nucleotides (e.g. Bromodeoxyuridine or BrdU) into the newly synthesized DNA of replicating cells (during the S phase of the cell cycle). The latter requires further permeabilization and denaturation, followed by antibody staining to detect the BrdU incorporation. Experimentalists have also used specific antibodies against cyclins or DNA-incorporating dyes to monitor the mitotic stage of individual lymphocytes (Baxter and Hodgkin, 2002).
But the most classical method to monitor lymphocyte division in vivo or in vitro is the CFSE dilution method. Cells of interest are stained with CFSE (or CFDA) that penetrates the cell, gets esterified and covalently-linked to a random and small fraction of all the proteins within that cell. Upon activation and cell division, the amount of CFSE fluorescence per cell is divided by 2 for each descendant, and up to 8 divisions can be readily resolved by fitting the distribution (because of size homogeneity in the naïve state, this CFSE staining yields a very narrow distribution of fluorescence for generation 0). Quantitative analysis of these CFSE profiles is a field onto itself (Baxter and Hodgkin, 2002), and we will review some of the results derived from this method in section 3.
To detect cell death, experimenters can expose a population of cells to dyes whose fluorescence is turned on by incorporation within DNA. Indeed, dead cells lose the integrity of their plasma membrane and let these dyes permeate the nucleus such that they become brightly fluorescent. Two commonly-used dyes are propidium iodine or DAPI. It is also possible to use specific markers (e.g. annexin V or residues of caspase activation) to monitor the fraction of cells undergoing apoptosis. To conclude, there exists a panoply of quantitative assays that experimentalists have developed over the years to monitor cell proliferation and death during an immune response. 1.4.3. Single-cell phosphoprofiling There also exist new technological developments for which the contribution of Biophysicists within Immunology is very valuable. The recent production of a wide array of phospho-specific antibodies that can detect modified forms of proteins involved in cell signaling cascades and optimized for flow cytometric use, allows experimenters to monitor the phospho-profile of individual cells. In particular, experimentalists can now directly relate individual cellular phenotypes to the same cell’s functional behavior (Baxter and Hodgkin, 2002). In the context of the study of the immune system, single-cell phospho-profiling enables the monitoring of the activation and response of individual cells within an heterogeneous mix of varied cell types (e.g. lymphocytes, monocytes, stromal cells etc.).
For example, Irish et al. (Irish et al., 2004a) used multiparameter FACS analysis to characterize the responsiveness of tumor cells towards a panel of chemokine/cytokine/growth factors. The strength of their method led to the identification of many cell subtypes within single tumors, ultimately offering a refined statistical predictor for clinical outcome in chemotherapy treatments. Most strikingly, a particular phenotype (e.g., sensitivity to chemotherapy or Flt3 mutation) could not be assigned to a single molecular phenotype (e.g., upregulation of receptor) but rather to the convolution of many signaling “signatures”. For example, Irish et al. identified a subpopulation of cells with distinc functional responses: phosphorylation of the transcription factor STAT5 after exposure to specific cytokines (e.g. GM-CSF treatment and/or G-CSF and/or IL-3 and/or IFNγ and/or phosphorylation of the kinase ERK1/2 after treatment with a specific ligand FL (Irish et al., 2004b)).
For the purpose of understanding the biophysics of T cell activation, single-cell analysis enables the identification of multiparametric determinants for lymphocyte responsiveness that can be tested through computer modeling. Note that this constitutes a technical advantage in studying mammalian cells compared to E.coli or yeast (systems in which the issues of robustness in cell signaling or gene expression have classically been studied (Barkai and Leibler, 1997)): facile intracellular staining and FACS analysis of native proteins is only readily achievable in these higher-organism cells, opening the gate to a rich analysis of phenotype/function relationships not readily accessible in cell-wall-endowed cells. On a very practical note, the overhead investment of flow cytometers as well as the readily-available libraries of antibodies against immune determinants for clinical diagnostics make Immunology the best field to apply single-cell phospho-profiling.
1.4.4. Genetic perturbation of the immune response.
Since the beginning of the 90s’, cellular immunologists have relied on the creation of transgenic models and knock-out models to address the role of specific genes in the establishment of immune responses. To generate a transgenic model or a knock-out mouse, a gene of interest is added or
removed by homologous recombination or by gene trapping within the nuclei of an embryonic stem (ES) cell, and this ES cells is grown in vitro and added to an embryo to reconstitute a full genetically-modified model. This knock-out technique has become a routine (albeit time-, effort- and money- consuming) procedure in immunology labs. Using the same approach, many transgenic mice, whereby an additional gene (e.g. TCR or mutant signaling protein) is added to the genome of a mouse, have been generated. Moreover, there exists a whole genetic toolbox (TET system, Lox-Cre ) that facilitates the external control (in time, location and differentiation state) of these genetic pertubations. This enables immunologists to perturb the immune network with specificity and flexibility.
One experimental aspect of fundamental value for systems immunology is the ability to reconstitute immune systems from such genetically varied parts. Injecting cells from one donor mouse into another recipient mouse (as long as they share the same repertoire of MHC to avoid graft rejection) via the tail-end vein of the mouse or via retro-orbital sinus vein is performed routinely in immunology labs. One can use such adoptive transfer of genetically-modified cells to build or perturb the immune system. For example, immunologists commonly rely on bone marrow chimera whereby the immune system of host mice is deleted via sub-lethal X-ray radiation, and reconstituted with cells isolated from the bone marrow extracted from femurs of donor mice (i.e. hematopoeitic progenitor cells). This classical approach of adoptive transfer short-cuts the time-consuming breeding of genetically modified organisms, and allow experimenters to rapidly test different combination of genetic perturbations within a subpopulation of an otherwise undisturbed organism. There are limitations to the use of such genetic models, as the intricacies of feedback regulation in a biological network as complex as the immune system may yield to compensations limiting the impact and interpretability of the genetic perturbation. For these reasons we and others have been building a quantitative systems immunology approach to complement the genetic one. This novel quantitative approach consists of tracking how individual lymphocytes decide at the molecular level between activation and tolerance. Indeed how local signals (e.g. antigen response) and global signals (e.g. inflammation status) are integrated to make the immune response is, at the fundamental level, a systems property. Recent developments in immune monitoring and computer modeling (as introduced in sections 2 & 3)
1.4.5. The immune system as an ideal complex biological system to study.
As delineated in this chapter, immunology is, at its core, a “number” game. The difference between antigens (derived from foreign proteins) and non-antigens (derived from self proteins) is essentially a difference in the dissociation rates of the antigen/receptor complex; understanding differentiation in a population of activated lymphocytes implies estimating the amount of produced cytokine and the ensued signaling cascades; estimating the amplitude of an immune response implies quantifying lymphocyte proliferation and death etc. For these reasons the immune system is an ideal “complex” system of study for Biophysicists. We would like to argue that the immune system might indeed be an ideal biological system whose complexity remains manageable experimentally. Classically, more mathematically-inclined biologists have focused on the nervous system where the issues at stake (consciousness, memory etc.) are deep and far-reaching. However, nervous systems are hard-to-tackle experimentally, in the sense that their experimental modification stumbles on the hard-wiring of its cellular components. The immune system is more fluid by nature: it is essentially a collection of agent cells that communicate and self-organize (via fluid cell-cell contacts or cytokine exchange) to generate an immune response.
The experimental tools are allowing quantitative biologists to address issues in immunology
with remarkable acuity: in order to understand immune responses as emerging properties of a collection of cells, one must “build” an immune system from the ground up. In other words, as for any self-organized system (May, 2004), understanding the immune response implies being able to rebuild one “from scratch” simply by assembling the set of components deemed critical. 2. Modeling T cell activation quantitatively. 2.1. Biophysics of ligand-receptor interactions in T cell signaling One of the early experimental observation that spurred modeling efforts in the field of T cell activation is the correlation between lifetime of pMHC-TCR interaction and strength of activation. As the surface Plasmon resonance technique became ubiquitous in Biophysics lab in the mid-1990s’, as well as optimizied protocol to prepare and purify recombinant peptide-MHC complex and TCR, researchers unravel the biophysical characteristics of pMHC-TCR interaction. The first surprise was the relatively weak affinity of pMHC-TCR interaction (in the range of 1-10µM) when compared e.g. with antigen-antibody interactions, which can reach 1pMol range for B cells. Further studies however revealed that the weak affinity of pMHC to TCR stems from the randomness of somatic mutation of the binding interface and the lack of affinity maturation for the TCR. Interestingly, this weak affinity is critical to enforce specificity and therefore being able to distinguish between agonist and non-agonist, because single mutation in the antigenic peptide can commute the pMHC ligand from agonist to non-agonist. Overall, strong agonist pMHC tend to bind with lifetimes of more than 10s, while non-agonist bind with lifetimes less than 3s at room temperature. The association rates (around 104 Mol-1.s-1) are essentially independent of the peptides and do not contribute to ligand discrimination. The second quantitative observation is the observed variation in activation threshold. For each clone of T cells, endowed with different TCR, researchers have screened libraries of peptide to make a repertoire of ligands, from strong agonist (that can trigger the T cells under consideration with 1 to 10 ligands) to non-agonists or nulls. For different TCR, the biophysical characteristics of a ligand can vary greatly, and there certainly does not exist one universal threshold in terms of ligand/receptor dynamics: each T cell clone is found to adjust its threshold of activation, most likely by fixing different levels of signaling molecules (receptor, co-receptor, kinases etc.). This observation implies that: 1) fine-tuning the TCR signaling machinery during interaction with self antigens is possible (e.g. during T cell development); 2) the TCR signaling machinery is not robust i.e. activation through the same signaling cascade can drive varied responses (Chang et al., 2007). One caveat of these measurements is its reliance on soluble ligand and receptor purified from bacterial or insect expression systems. It is possible in particular that post-translational modifications that could be critically relevant in vivo (Daniels et al., 2001, Daniels et al., 2002) (e.g. syalation) are missed in these studies. On the other hand, these post-translational modifications might simply shift the overall spectrum of ligands (adding glycosylation may hinder pMHC-TCR interaction, and reduce the binding affinity of all antigens: the affinity of agonist ligands would be reduced yet remain stronger than the affinity of non-agonist ligands). Another caveat of the surface Plasmon technique is that most reported measurements are performed at room temperature (out of experimental practical reasons rather than fundamental limitations). Probing TCR/pMHC kinetics of interactions at 37°C has repeatedly yielded intriguing
(but often not confirmed) results. For example, Rosette et al. (Rosette et al., 2001) reported an extremely long lifetime (t>10min) at 37°C for the OT-1 TCR/Kb/OVA complex. This observation has not been reproduced for other TCR/pMHC complexes and is incompatible with dissociation rates for pMHC tetramers on the surface of T cells at 37°C so its significance is challenging. Kroogaard et al. (Krogsgaard et al., 2003) made a systematic effort to compare measurements at varied temperatures, from 20°C to 37°C for the 5C.C7 TCR: they found that discrepancy in the hierarchy of antigen potency related to large changes in heat capacity for the association rate of the ligand with its receptor. A critical conformational change (quantified by this heat capacity change, which itself quantifies the solvent reorganization) was conjectured and analyzed theoretically . A third intriguing result was reported by Reich et al. using dynamic light scattering to measure aggregation of TCR and pMHC in solution at 37°C: they reported that supramolecular aggregation could occur but was specific of agonist ligands. This result suggested an appealing explanation for how TCR signaling could be triggered: by analogy with the EGF receptor system, (whereby dimerization of receptors enable trans-phosphorylation by receptor-associated kinases), individual TCR engagement could be greatly enhanced by aggregation with self-engaged receptor. Thus unengaged receptors could be maintained in a metastable “fluid” state that switches molecular conformation and crystallizes upon a seed engagement with an agonist ligand, by analogy with the ice 9 allegory (Lansbury and Caughey, 1995). This would explain how few agonist ligands could trigger such a macroscopic signaling responses (a typical calcium influx upon TCR triggering rushes in 106 ions within 1 min of engagement with a single receptor).
Another limitation of the measurements by surface Plasmon resonance is its reliance on soluble pMHC/TCR interactions. This soluble setting uncouples ligand-receptor dynamics from the membrane fluctuations. It is possible however that membrane fluctuations mightaccelerate binding/unbinding by colocalizing the molecules or by applying mechanical constraints on the formed complex. Recent in situ measurements of pMHC/TCR interactions relied on single-molecule FRET reporter to measure the engagement of TCR on the surface of a T cell (Huppa et al., 2010). These results will need to be integrated in updated models of the signaling cascade to take into account the faster dynamics of association/dissociation of the ligand/receptor pair on the surface of cells; nevertheless the hierarchy of ligands (from agonist to non-agonist) seem to be conserved once this acceleration factors are taking into account. 2.2. From biophysics to function: how TCR engagement is transduced intracellularly. Researchers have used many different readouts to assess the functional consequence of TCR engagements by pMHC ligands. For example, the Eisen group monitored cytotoxic activity in a population of CD8+ T cells and extrapolated that a single pMHC can be enough to trigger T cell response (Sykulev et al., 1996). Other groups have used different readouts of activity. For example (Daniels et al., 2006) monitored the upregulation of the glycoprotein CD69, which is rapidly expressed upon activation to drive T cell exit from lymph nodes and targeting to peripheral tissues. Another possible readout of activity is cytokine secretion, which typically occurs after 3 hours of TCR engagement (Madrenas et al., 1997). Others groups have used T cell proliferation or T cell development when studying thymocytes. One of such striking measurement of T cell specificity was reported by the Palmer group (Daniels et al., 2006): they used thymocytes endowed with a well characterized TCR and measured how their short-term response scaled over 7 decades of potency when activated by MHC loaded with different peptides. Yet, long-term responses of the same thymocytes displayed a very digital threshold in terms of peptide potency (Figure 1). Hence, these
thymocytes were found to make a very sharp and specific discrimination of peptides loaded onto MHC (Daniels et al., 2006).
The first conceptual idea put forth to explain how minute differences in the sequence of the loaded peptide onto MHC could yield such drastic differences in TCR signaling and T cell activation was a kinetic proofreading scheme by McKeithan (McKeithan, 1995). Within the TCR-associated chains, there are 10 tyrosines that get phosphorylated upon engagement by pMHC. McKeithan pointed out that these phosphorylations are irreversible additions that may occur in a stepwise manner and introduce time delays. At each step, pMHC can unbind from the TCR and trigger a rapid dephosphorylation of the TCR complex. This implies that the lifetime of the pMHC-TCR interaction is being tested iteratively at each proofreading steps. A simple calculation can be carried out to estimate the specificity of the kinetic proofreading scheme in TCR signaling. Consider one TCR molecule that is engaged by two different types of pMHC, which bind with characteristic lifetimes τi (i=1 or 2). We are comparing the amount of phosphorylation onto the TCR engaged by Ni pMHC binding We compute the ratio R of the number of TCR that got phosphorylated k times upon engagement with two different pMHC (that bind with characteristic lifetimes τ1 and τ2 to a given TCR).
The prefactor A depends on the total time of engagement and the characteristic time of the kinetic proofreading steps. Typically, we are comparing agonist ligands (that bind typically with a lifetime τ1>10s) and non-agonist ligands (that bind typically with a lifetime τ2<3s). This formula illustrates how multiple kinetic proofreading steps amplify the difference between good and poor ligands. Ultimately, T cells can respond to as low as 1 pMHC1 while not responding to 105 pMHC2: for a ratio of lifetimes τ1/ τ2=3, that would imply at least 10 tyrosines. Hence, kinetic proofreading could amplify the signaling difference of agonist and non-agonist ligands to the point of achieving the required specificity. However, there are many experimental observations that suggest that kinetic proofreading is not sufficient (Altan-Bonnet and Germain, 2005, Feinerman et al., 2008a). First, the kinetics and amplitude of the phosphorylation cascades are not compatible with the slow and “signal-extinguishing” characteristics of a kinetic proofreading (Feinerman et al., 2008a). Second, the 10 tyrosines on the TCR could potentially get phosphorylated all at once, short-cutting the necessary long time delays Note that there have been reports of specific order in phosphorylation (Kersh et al.), substantiated by conformational change in the CD3 associated chains that control tyrosine accessibility (Aivazian and Stern). Ultimately, kinetic proofreading constitutes one part of the solution towards enforcing sharp ligand discrimination but by itself it cannot achieve the single-agonist responsiveness, i.e. the exclusion of 105 non-agonist within a minute of T-APC contact. Additional features are necessary to reconcile the speed, sensitivity and specificity of TCR signaling. Modeling efforts then focused on the dynamics of signaling responses to account for the specificity of T cell activation. The main insight was that feedback regulation can modulate a kinetic proofreading process towards enhanced ligand discrimination. In a nutshell, early engagement of the receptors can trigger the activation of phosphatases (e.g. CD45 or SHP-1) that slows down the phosphorylation cascades and block signals from weak (i.e. self) ligands from activating T cells. For stronger ligands (i.e. non-self), the activation of positive feedback loops is critical to stabilize the signaling events and commit cells towards activation. Two pathways have been suggested to achieve such digital filtering of TCR/pMHC interactions. First the kinase that initiates TCR signaling (Lck)
was shown to be phosphorylated on Serine 59 and protected from dephosphorylation by phosphatases upon ERK activation (Stefanova et al., 2003), for ligands that are strong enough to bypass any negative feedback (Altan-Bonnet and Germain, 2005, Stefanova et al., 2003). Second, the discovery that the factor SOS can boost its guanine nucleotide exchange onto Ras upon binding of active Ras in a catalytic pocket was identified as a key positive feedback to explain digital filtering of signal transduction in lymphocytes (Chakraborty et al., 2009).
Modeling these competing positive and negative feedback pathways (Figure 2A) accounted for a bifurcation within phosphorylation patterns: for non-self pMHCs (which bind strongly to TCR), the enzymatic modification of LCK by the MAPK ERK-1 protects from dephosphorylation the molecules involved in the most proximal signaling events induced by TCR ligation; for self pMHCs (which bind more weakly to TCR), the phosphatase SHP-1 dephosphorylates these proximal signaling components and quenches the cell response before ERK activation can protect the signaling apparatus. Thus, this bifurcation in cell signaling defines a strict threshold of TCR ligands capable of inducing T cell activation (Figure 2B).
Quantitative modeling of the signaling cascade led to a better understanding of the dynamics of this bifurcation (Altan-Bonnet and Germain, 2005, Lipniacki et al., 2008, Owens et al.): in T cells, a rapid-onset but slowly rising recruitment of SHP-1 to LCK in the TCR complex competes with a delayed but digital activation of the MAPK pathway. Computer simulations using this quantitative model resulted in several predictions concerning T cell activation that have been confirmed by direct experimentation. A key finding was a non-linear, rapidly rising increase in the time to activation of the MAPK cascade with decreasing numbers of ligands: this divergence plays a central role in the useful operation of this pathway as a high-gain digital amplifier. These simulations also provided an understanding of the previously reported puzzling pattern of transient activation of SHP-1 by agonist ligands. A third novel aspect of the results was the demonstration of increasing antagonist potency of poorly binding ligands as they approached the threshold defining agonists (Altan-Bonnet and Germain, 2005, Feinerman et al., 2008a).
Most relevant to our understanding of ligand discrimination in T cell activation, the simulations also predicted the capacity of T cells to reprogram their agonist threshold (“tune their responsiveness”) through modest alterations in the intracellular concentration of CD8 and SHP-1. This prediction was tested using T cells undergoing TCR-induced proliferation (blasts): for these primed cells, there was a narrow window of presentation of ligands that were non-stimulatory for naïve T cells yet evoked a measurable ERK response in T cell blasts [1]. This arose because of a slowdown in the rate of SHP-1 generation when the substrate concentration was lowered. Higher ligand levels overcame this limitation on negative feedback and properly inhibited the response to such weakly binding ligands. This feature of T cell signaling biochemistry may be functionally relevant in early stages of infection when T cells could take advantage of self-derived ligands to respond to a limited amount of pathogen-derived ligands.
Thus, computer simulation and systematic experimental probing of T cell activation, has lead to a more quantitative model of the early events in T cell signaling. In particular, the transduction of minute biophysical differences in ligand/receptor interaction into macroscopic functional differences in signaling was accounted for and explained how these cellular components of the adaptive immune system enforce the fast and sensitive self/non-self ligand discrimination. Functionally, the most relevant insight from computer modeling is the basis for actively tuning the threshold for agonist functionality during T cell differentiation in the thymus or periphery, based on regulation of the competition between positive and negative feedbacks through modest changes in the intracellular concentrations of key molecules.
These results about ligand discrimination in lymphocytes can shed light on other decision-making pathways in systems biology. For example it is interesting to draw parallels to EGF/NGF signaling in neural cell lines (Sasagawa et al., 2005, Santos et al., 2007). In this system, the activation of one kinase carries various functional consequences: activation by EGF (with activation of RKIP negative feedback) yields transient phosphorylation of ERK, which drives proliferation and death. Activation by NGF (with activation of PKCδ positive feedback) yields stable ERK activation and drives differentiation. This differential signaling through one single kinase takes place similarly in T cell signaling: during T cell development, weak and sustained ERK activation drives positive selection and differentiation into naïve peripheral T cell; strong and transient ERK activation triggers apoptosis and is critical for negative selection i.e. the elimination of overtly-reactive T cells (Starr et al., 2003). Hence studying quantitatively lymphocytes’ ligand discrimination help understand how other signaling network may produce sharp decision with functional relevance to biology. To conclude, the study of ligand discrimination by T lymphocytes is a core problem in mathematical modeling of immune responses. Accounting for the specificity/sensitivity and speed of T cell activation upon receptor engagement requires quantitative modeling. Early models suggested that kinetic proofreading schemes could be at play to amplify biophysical quantitative differences into qualitatively-distinct signaling responses. But more recent models have emphasized the differential regulation of signaling responses by feedback pathways. This is more than a formal exercise. Understanding how ligand discrimination is achieved by the TCR signaling machinery will enable identification of critical regulators whose up/down regulation could modulate self/non-self discrimination with potential clinical applications. 2.3. Spatio-temporal coupling of TCR signaling and membrane dynamics For simplicity, early modeling efforts on T cell activation have assumed that the reactions take place in a well-mixed reactor. There are arguments to support this formalism: the size of T cell cytoplasm –15fl– and the high concentrations of signaling proteins –typically 104 to 106, which translates into 1 to 100µM concentrations– imply that diffusion kinetics can be so rapid so that not being rate-limiting. On the other hand, imaging studies of T cell activation has revealed striking spatio-temporal couplings between TCR signaling and membrane dynamics. Most impressive was the discovery of the immunological synapse, at the end of the 90s’ as the characteristic patterning of membrane proteins on the surface of T cells and antigen-presenting cells. Work from the Kupfer (Monks et al., 1998) and Dustin (Grakoui et al., 1999) laboratories demonstrated how, upon T:APC engagements, TCR-pMHC contacts accumulate at the center of the cell-cell contact region, the so-called C-SMAC for central supramolecular assembly. At the same time, contacts between adhesion molecules (LFA-1 and ICAM) form a surrounding outer ring, which is called the p-SMAC for peripheral supramolecular assembly (see Figure 3). The mechanical constraints associated with the varied size of ligand/receptor complexes and adhesion molecules were quickly identified as potential driving forces to generate such a self-organized pattern. Indeed, the longitudinal length of a pMHC/TCR complex is 14nm, while the length of the LFA/ICAM complex is 41nm. Experimental modification of the pMHC height (using chimeras with immunoglobulin) demonstrated how these spatial characteristics are critical for TCR signaling while not affecting pMHC/TCR engagement in control measurements (Choudhuri et al., Choudhuri et al.).
Theoretical modeling of the immunological synapses is critical to understand how membrane receptors can self-organize by coupling biochemical interaction and mechanical constrains. A. Chakraborty’s group has pioneered this line of research by modeling the spatio-temporal dynamics of membrane receptors with Ginzburg-Landau-type equations (Landau et al., 1978). All ligands and
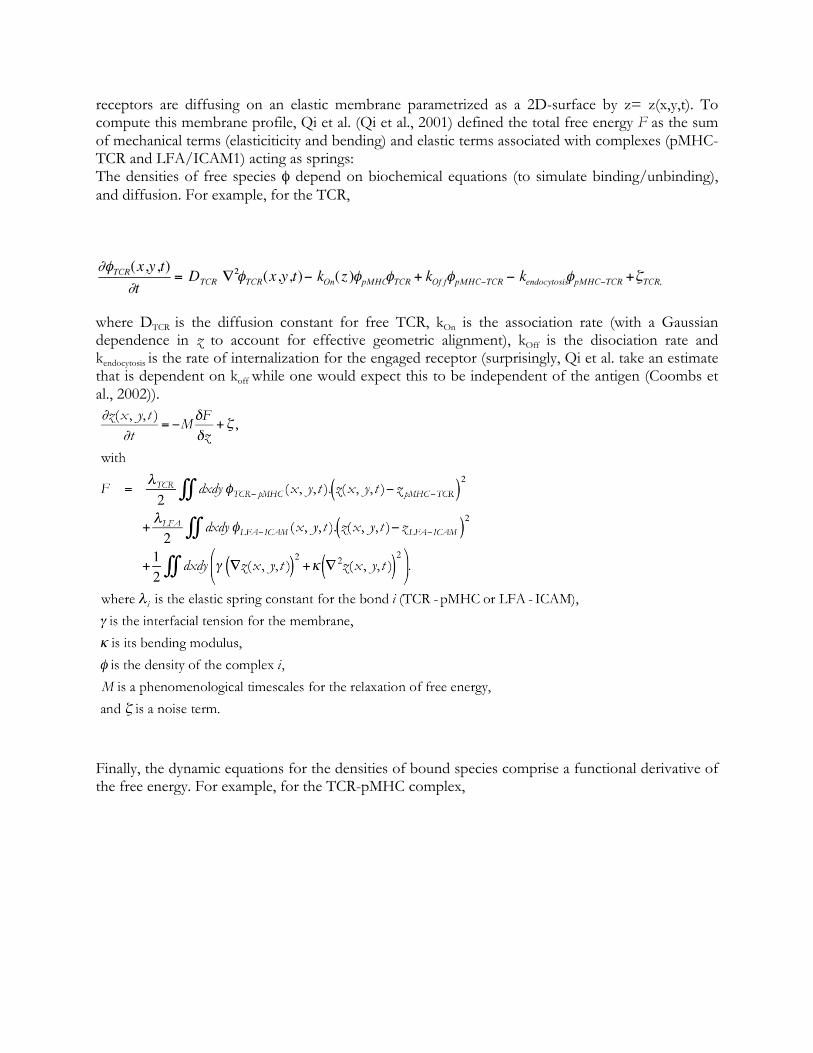
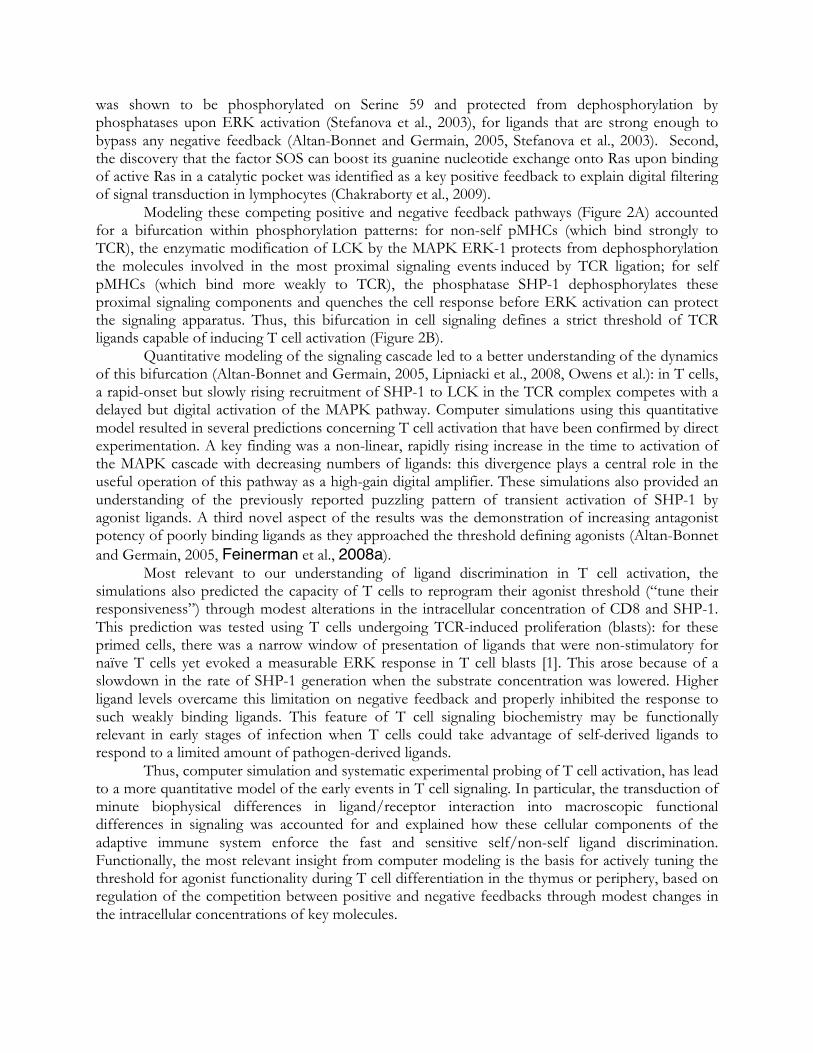
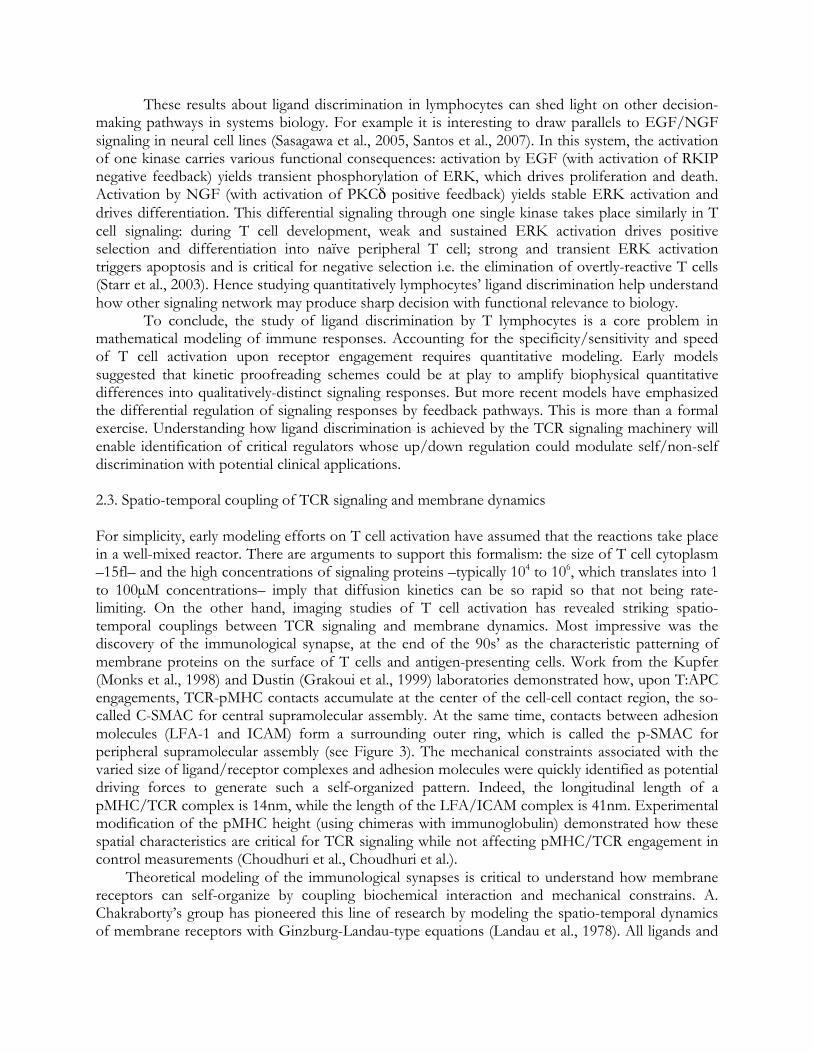
receptors are diffusing on an elastic membrane parametrized as a 2D-surface by z= z(x,y,t). To compute this membrane profile, Qi et al. (Qi et al., 2001) defined the total free energy F as the sum of mechanical terms (elasticiticity and bending) and elastic terms associated with complexes (pMHC-TCR and LFA/ICAM1) acting as springs:
The densities of free species φ depend on biochemical equations (to simulate binding/unbinding), and diffusion. For example, for the TCR,
where DTCR is the diffusion constant for free TCR, kOn is the association rate (with a Gaussian dependence in z to account for effective geometric alignment), kOff is the disociation rate and kendocytosis is the rate of internalization for the engaged receptor (surprisingly, Qi et al. take an estimate that is dependent on koff while one would expect this to be independent of the antigen (Coombs et al., 2002)).
Finally, the dynamic equations for the densities of bound species comprise a functional derivative of the free energy. For example, for the TCR-pMHC complex,
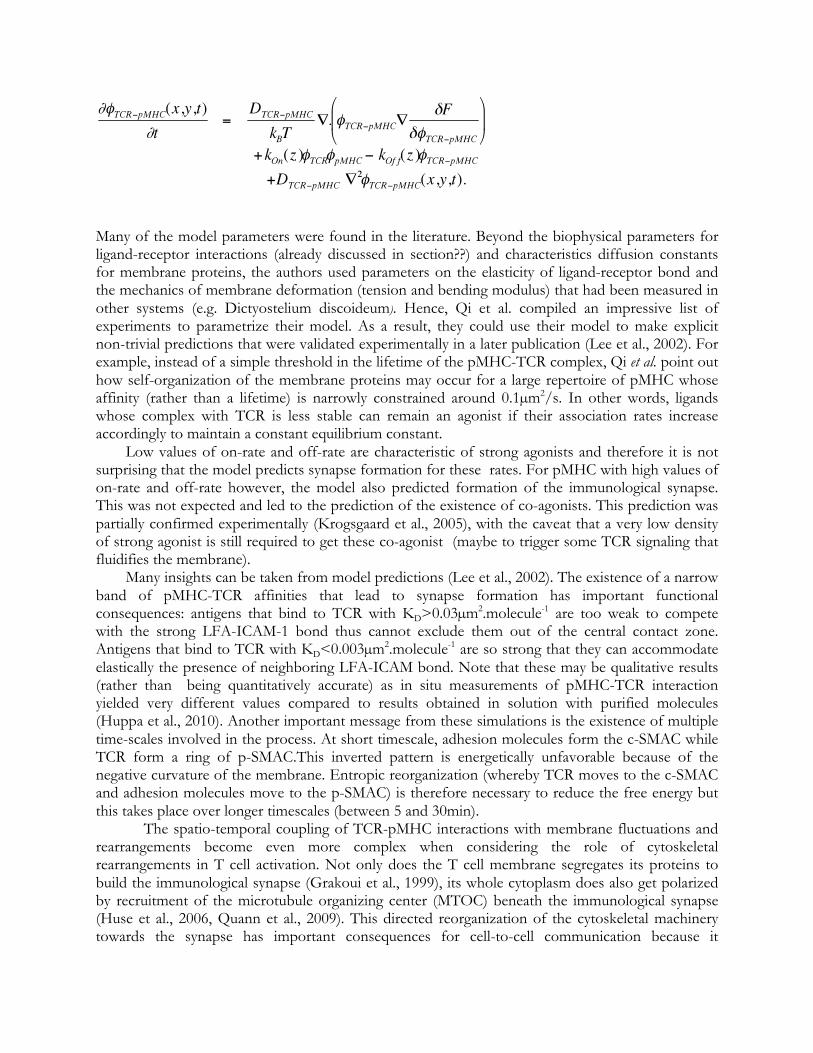
Many of the model parameters were found in the literature. Beyond the biophysical parameters for ligand-receptor interactions (already discussed in section??) and characteristics diffusion constants for membrane proteins, the authors used parameters on the elasticity of ligand-receptor bond and the mechanics of membrane deformation (tension and bending modulus) that had been measured in other systems (e.g. Dictyostelium discoideum). Hence, Qi et al. compiled an impressive list of experiments to parametrize their model. As a result, they could use their model to make explicit non-trivial predictions that were validated experimentally in a later publication (Lee et al., 2002). For example, instead of a simple threshold in the lifetime of the pMHC-TCR complex, Qi et al. point out how self-organization of the membrane proteins may occur for a large repertoire of pMHC whose affinity (rather than a lifetime) is narrowly constrained around 0.1µm2/s. In other words, ligands whose complex with TCR is less stable can remain an agonist if their association rates increase accordingly to maintain a constant equilibrium constant.
Low values of on-rate and off-rate are characteristic of strong agonists and therefore it is not surprising that the model predicts synapse formation for these rates. For pMHC with high values of on-rate and off-rate however, the model also predicted formation of the immunological synapse. This was not expected and led to the prediction of the existence of co-agonists. This prediction was partially confirmed experimentally (Krogsgaard et al., 2005), with the caveat that a very low density of strong agonist is still required to get these co-agonist (maybe to trigger some TCR signaling that fluidifies the membrane).
Many insights can be taken from model predictions (Lee et al., 2002). The existence of a narrow band of pMHC-TCR affinities that lead to synapse formation has important functional consequences: antigens that bind to TCR with KD>0.03µm2.molecule-1 are too weak to compete with the strong LFA-ICAM-1 bond thus cannot exclude them out of the central contact zone. Antigens that bind to TCR with KD<0.003µm2.molecule-1 are so strong that they can accommodate elastically the presence of neighboring LFA-ICAM bond. Note that these may be qualitative results (rather than being quantitatively accurate) as in situ measurements of pMHC-TCR interaction yielded very different values compared to results obtained in solution with purified molecules (Huppa et al., 2010). Another important message from these simulations is the existence of multiple time-scales involved in the process. At short timescale, adhesion molecules form the c-SMAC while TCR form a ring of p-SMAC.This inverted pattern is energetically unfavorable because of the negative curvature of the membrane. Entropic reorganization (whereby TCR moves to the c-SMAC and adhesion molecules move to the p-SMAC) is therefore necessary to reduce the free energy but this takes place over longer timescales (between 5 and 30min).
The spatio-temporal coupling of TCR-pMHC interactions with membrane fluctuations and rearrangements become even more complex when considering the role of cytoskeletal rearrangements in T cell activation. Not only does the T cell membrane segregates its proteins to build the immunological synapse (Grakoui et al., 1999), its whole cytoplasm does also get polarized by recruitment of the microtubule organizing center (MTOC) beneath the immunological synapse (Huse et al., 2006, Quann et al., 2009). This directed reorganization of the cytoskeletal machinery towards the synapse has important consequences for cell-to-cell communication because it
constrains cytotoxic release or cytokine communication to a limited space between cells that are in close contact. Chemical disassembly of the cytoskeleton makes lymphocytes strictly unresponsive to antigen activation (Hao and August, 2005), yet this is not because of a block in cell-cell contacts as even soluble cross-linking antibodies fail to activate T cells whose cytoskeleton has been depolymerized (Valitutti et al., 1995, Delon et al., 1998). Recent work is starting to dissect the subtle dynamics of feedback regulation between T cell signaling and cytoskeletal rearrangements. Early signaling events that occur within microclusters of pMHC-TCR contacts need to grow and fuse before they can generate the critical mass necessary to trigger full activation (Barda-Saad et al., 2005, Seminario and Bunnell, 2008). The role of actin depolymerization in relaxing cell membrane and allowing microcluster expansion has been well documented (Faure et al., 2004). Quantitative modeling will be necessary to integrate these different aspects of feedback regulation between TCR signaling and cytoskeletal rearrangement. One such model has been proposed for B cells to pintpoint how cytoskeletal relaxation maximizes cell-cell contact by inducing cell spreading and collecting larger amount of antigens for receptor engagement (Fleire et al., 2006).
Note that synapse formation is only one aspect of T cell activation and that it does not necessarily correlates with other functions (cytokine production, proliferation rates etc.). Other possible consequences of T cell activation include Calcium influx, phosphorylation of key signaling proteins etc. For example, cytotoxic responses (whereby T cells release perforin and granzyme B to poke holes in targeted antigen-presenting cells) have been found to be independent of synapse formation so other modeling readouts are needed to understand T cell function as pointed out in (Lee et al.). Yet, the interesting physics involved in this model of immunological synapse formation and the originality of the integrative approach followed by the Chakraborty group are noteworthy.
2.4. Cell-to-cell variability in T lymphocyte activation Cell-to-cell variability in the expression level of proteins and other molecular components plays a major role in shaping the variability in the response of isogenic cells to the same stimulus in many biological systems. For example, it is well established that, in a clonal population of bacteria, single cells exhibit a diversity of behaviors (Spudich and Koshland, 1976, Avery, 2006). Non-genetic diversity plays an important role in the persistence of bacterial infections (Balaban et al., 2004). Important sources of phenotypic heterogeneity are molecular noise in gene expression and signal transduction (Raser and O'Shea, 2004, Raser and O'Shea, 2005, Kaern et al., 2005, Pedraza and Paulsson, 2008). Despite some advances (Raser and O'Shea, 2005, Suel et al., 2007, Kaern et al., 2005, Kussell et al., 2005, Kussell and Leibler, 2005, Dubnau and Losick, 2006, Avery, 2006, Losick and Desplan, 2008), in most cases the relationship between phenotypic heterogeneity and function remains unclear or limited to the study of binary systems. In the case of bacterial chemotaxis, one study by Sourjik and coworkers explored the effect of noise in gene expression on the exact adaptation property of the chemotaxis system (Kollmann et al., 2005, Lovdok et al., 2007).
In clonal populations of bacteria for example, non-genetic diversity can be advantageous because it allows some subset of the population to survive temporary perturbations in the environment without imposing long-lasting genotypic changes to the species (Spudich and Koshland, 1976, Avery, 2006, Kussell and Leibler, 2005, Kussell et al., 2005). In addition to fluctuations in the number of molecular components, behavioral variability of an individual cell can also result from the stochastic fluctuations that arise within a signaling pathway. This has been shown to be the case in the classic bacterial chemotaxis system where the behavioral variability of an individual cell adapted to a homogeneous environment could be traced back to the slow fluctuating kinetics of the adaptation reactions (Korobkova et al., 2004, Emonet and Cluzel, 2008). These
various sources of fluctuations alter quantitative features of the chemotaxis response such as response time, but interestingly they do so without affecting the crucial capability of the cell to adapt to background signal and therefore remain sensitive (Barkai and Leibler, 1997). This robustness of the bacterial chemotaxis system stems directly from key aspects of the architecture of both the signaling pathway (Barkai and Leibler, 1997, Yi et al., 2000) and the organization of the genes on the chromosome (Lovdok et al., 2009). Theoretical models have explored the relationship between robustness and fluctuations in bacterial chemotaxis and have made predictions that were tested experimentally, highlighting the extent of noisy adaptation, and its functional relevance towards maintaining high sensitivity in sensing chemical gradients (Alon et al., 1999, Korobkova et al., 2004, Lovdok et al., 2009) Because T cells undergo rapid clonal expansion, we expect that population of isogenic T cells will also exhibit cell-to-cell variability in the levels of the many proteins that mediate their responses to stimuli. The individual T cells resulting from a clonal expansion therefore are likely to exhibit some degree of individuality, even though their genetic background is identical.
However, the concept of robustness in cell signaling has not been thoroughly tested in T cells, despite its obvious relevance to the basic function of the immune system: if naïve T cells, through variations of the number of their cytoplasmic proteins, were to become hypo-responsive, then their ability to detect pathogenic invasion would be impaired; if they were to become hyper-responsive in relationship to the selection threshold set in the thymus, then they could eventually trigger autoimmune catastrophes (following activation by self-derived pMHC). Thus, one would like to establish whether, indeed, ligand discrimination by T cells is intrinsically robust (in the sense that it is not substantially affected by naturally-occurring variations in the levels of expression of signaling proteins) or whether it needs to be constantly fine-tuned in the periphery by feedback pathways evoked through engagement of self-ligands (Grossman and Singer, 1996, Grossman and Paul, 2001).
Using single-peptide counting to measure the dose-response of T cells with quantal accuracy, M. Davis’s group has reported experimental results pointing out how limited the variability of T cell calcium response is (when integrated over the first twenty minutes of contacts between T cells and antigen-presenting cells -APC) (Irvine et al., 2002, Li et al., 2004, Purbhoo et al., 2004). From their data, one can estimate an upper bound for the coefficient of variation (defined by standard deviation divided by mean) for the distribution of activation threshold (defined as the number of ligands that T cells require to get activated): CVthreshold < 75%. In other words, one T cell and its sister have a 95% chance of having similar activation threshold within a factor of 10 in ligands. This is in fact a very narrow distribution when considering how sensitive and specific the TCR signaling machinery is.
On the other hand, T lymphocytes (like any other cells) cannot control the levels of expression of its signaling components better than the limits associated with noise in gene transcription, translation and degradation (Elowitz et al., 2002, Sigal et al., 2006): even a clonal population of T cells has a distribution of signaling components with large coefficient of variation. Typically, in the case of SHP-1 (a key component of TCR negative feedback), the coefficient of variation for the expression is 50% for T cell blasts (Feinerman et al., 2008b): 5% of cells will express 2-fold less than the average and may be hyperresponsive because of this defect in negative feedback (these cells could be auto-immune-prone), 5% of cells will express 2-fold more than the average and may be hyporesponsive because of this excess of negative feedback.
Hence the paradox that needs to be solved: while T cells rely on the kinetics of signal transduction triggered by pMHC-TCR interactions to reliably-discriminate ligands based on minute kinetic differences, we anticipate that cellular variability in the expression levels of signaling proteins would affect the dynamics of TCR transduction cascade towards generating phenotypic variability.
This variability would be expected to compromise the reliability (robustness) of T cells’ self/non-self discrimination.
A possible solution would be to conjecture that the TCR signaling network is essentially a “solid-state” device (Werlen and Palmer) whereby all diffusion steps in the enzymatic phosphorylation or dephosphorylation reactions are non-limiting, making the enzymatic kinetics concentration-independent. This could be achieved with large enzyme concentrations (kassociation[Enzyme]>>kcatalysis) and/or with scaffolding of the enzyme reactions. These two solutions however are not compatible with some observations on T cell activation: TCR ligand discrimination has been shown to be fine-tuned, in the sense that, owing to downregulation of SHP-1 phosphatase (Altan-Bonnet and Germain, 2005) or MAPK phosphatase by mir181a microRNA (Li et al., 2007), non-agonist ligands can be turned into agonist ligands. This flexibility in discriminating between ligands seems incompatible with the notion of TCR signaling network relying on hard-wired biochemical reactions to achieve robustness.
In fact, T cells’ flexibility in adjusting their ligand sensitivity and discrimination is a critical hallmark of T cell development (Lucas et al., 1999, Yasutomo et al., 2000) or peripheral activation and homeostasis (Bhandoola et al., 2002, Grossman and Singer, 1996, Singh et al., 2006, Singh and Schwartz, 2006). As mentioned above, T lymphocytes must undergo a developmental program in the thymus before being released as naïve T cells to the periphery (lymph nodes). Cells entering the thymus as hematopoïetic progenitors must pass two selecting steps: their signaling machinery is checked for responsiveness against self pMHC presented by epithelial cells in the thymus (absence of responsiveness induces death by neglect, while proper responsiveness green-lights further differentiation –so called positive selection); and over-responsiveness towards self pMHC induces apoptosis (during negative selection). Ultimately, thymic differentiation leads to the export of mature T cells whose signaling machinery is properly “wired” as indicated by relevant modest level of signaling in response to self-pMHC that is below some threshold that would be “dangerous” if permitted in the peripheral T cell pool. Practically, only T cells endowed with receptors of intermediate affinity will pass the filters of positive/negative selection (Alam et al., 1996, Savage et al., 1999, Savage and Davis, 2001). Thymic development is actually quite restrictive as only 2% of the progenitors survive positive/negative selection to be released as naïve lymphocytes in the periphery.
The role of self-derived or altered pMHC ligands in positive/negative selection has been well documented. In particular, it was shown that a particular T cell clone could use weak ligands to drive its positive selection, while being unresponsive to this particular ligand in the periphery (Hogquist et al., 1994, Hogquist et al., 1997). For negative selection, the presence of endogenous super-antigens in the thymus has been shown to drive the deletion of thymocytes endowed with a specific Vβ gene segment composing the superantigen-interacting TCR (Murphy et al., 2008a). Selective modulation has been shown to occur in ligand discrimination by differentiating thymocytes, towards extinguishing responses to weak ligands while not affecting responses to strong ligands (Lucas et al., 1999, Yasutomo et al., 2000). More generally, many groups have documented how the manipulation of the pMHC repertoire presented by stromal epithelial cells in the thymus alter both the probability of positive/negative selection of specific T cell clones in the thymus as well as their responsiveness once released in the periphery (Jameson et al., 1995, Teh et al., 1997, Teh et al., 1998, Wong et al., 2001, Starr et al., 2003). Hence, T cells have been shown to tune their responsiveness to ligands at different stages of differentiation, and one should not expect TCR signaling and ligand discrimination to be robust and inflexible.
Using computer modeling of the differential signaling pathways activated by pMHC engagement (see section 2.2) was used to probe the effect of phenotypic variation in the levels of
expression of signaling proteins involved in TCR signaling (Feinerman et al., 2008b). A classical parameter scan for varied levels of expression of signaling proteins predicted that most were working at non-diffusion-limited rates: the enzyme/substrate association step was so rapid compared to the catalytic rates that exact levels of expression were not necessary to maintain consistency in the signal transduction dynamics.
However, few signaling components were associated with some variability in signal transduction upon in silico up- or down-regulation. In particular, TCR and CD8, as the receptor and coreceptor initiating the signaling cascade, determined the minimal number of ligands that are necessary to trigger TCR signaling: because of their direct binding to form a trimer, up-/down-regulating these receptors/coreceptors by a factor X allowed to down-/up-regulate proportionally by the same factor X the minimal number of ligands necessary to trigger signaling. Hence TCR and CD8 can be characterized as proportional or analog regulator of T cell signaling.
On the other hand, the phosphatase SHP-1 (the main negative feedback component in our model (Altan-Bonnet and Germain, 2005)) is activated many steps downstream of ligand-receptor engagement. The levels of expression of SHP-1 were found not to influence the minimal number of ligands necessary to trigger T cell activation, up to a critical level above which T cells can not respond (Feinerman et al., 2008b). Hence, SHP-1 acts a digital regulator whose level of expression controls whether TCR can trigger or not.
To test these computer predictions, a new methodology, based on flow cytometry analysis, was developed. With this method, one could correlate T cell responsiveness (e.g. phosphorylation of ERK MAP kinase) with the endogenous levels of protein expression (e.g. CD8 or SHP-1). All predictions from the computer model were confirmed, with CD8 acting as an analog regulator while SHP-1 acted as a digital regulator. This study also emphasized the extent of variability in the input/output function within a clonal population of primary T ymphocytes.
In this section we have reviewed some aspects of the study of T cell activation that benefited
from biophysical and computational approaches and insights. On a short timescale (<10min), T cells must recognize minute molecular differences in the antigens that are presented to them, and decide between activation and tolerance. This section emphasized how quantifying the biophysics of ligand-receptor interactions and the dynamics of the signaling response can account for ligand discrimination. But immune responses are of course organized on a much longer timescales. In particular, one critical mechanism to counter-act the explosiveness of viral or bacterial infection is to trigger a massive of expansion of specific T cells (to eradicate infected cells, annihilate extracellular pathogens, and orchestrate the immune response). The next section focuses on this aspect of the immune response. 3. T cell proliferation and differentiation One of the hallmark of immune responses is the explosive proliferation of T cells to fight pathogenic infections. Indeed, doctors routinely perform tactile exam to check whether neck lymph nodes are swollen in sick patients). Upon clearance of the infection, the immune system must restore homeostasis, hence the population of pathogen-specific clones undergoes a massive contraction. In Figure 4, we reproduce measurements from Rafi Ahmed’s group whereby the number of a specific T cell clones (responding to epitopes of LCMV virus) is being monitored during an infection with this very LCMV in mice (Murali-Krishna et al., 1998). The number of T cells expands by a factor of 105 within 3-7 days, and contracts back by a factor of 100 over a month.
An important contribution of biophysicists and mathematicians to immunology has been to devise strategies to quantify this expansion/contraction dynamics. This issue is particularly challenging due to the nonlinearity of the processes at stake. But the functional significance of controlled explosive proliferation cannot be under-estimated since it is critical to match the explosive expansion of simpler organisms (viruses, bacteria…).
The general approach to quantifying proliferation, survival and differentiation of T cells has been to fit mathematical models of population growth and death directly to measurements of T cells division statistics. Typical model parameters that can be extracted in this way are cell replication rates, death rates, or moments of the distribution of cell cycle duration within the population of cells. Once a model fit the data reasonably, it can be used as a quantitative tool to study how these parameters vary as a function of changes in experimental conditions (e.g. various stimuli, dose-response, knock-outs, etc.). By treating T cells as logical signal processing machines (Gett and Hodgkin, 2000) and solving an inverse problem (Tarantola, 2006, Tarantola, 2005) to extract information about proliferation and differentiation, the hope is that one can decipher the computation performed by T cells in response to multiple signals(Gett and Hodgkin, 2000, Baxter and Hodgkin, 2002). Note that this approach does not directly provide information about the molecular mechanisms that are at play during an immune response, but it can be used as a tool to quantify the effects of molecular and genetic manipulations on the system. In this section we describe the experimental techniques and data that are used to characterize the statistics of cell proliferation and differentiation in populations of T cells. Next, we review the mathematical models used to fit the data and the main insights for immunology derived from these fits. 3.1. Experimental characterization of T cell proliferation and death Characterizing proliferation, death and differentiation in a population of cells requires measuring the rates of cell division and death. A widely used method is to pulse-label cells with markers such as tritiated thymidine (thymidine labeled with the radioisotope tritium (Hughes et al., 1958)) and BrDU (5-bromo-2’-deocyuridine). These markers are integrated into the DNA during DNA replication as substitutes for thymidine (Eidinoff et al., 1959). Specific labeling of BrDU using antibodies conjugated to fluorescent markers then reveals the cells that where actively replicating their DNA (Gratzner, 1982, Forster et al., 1989). Another DNA label that is often used because it is safe for humans is D-glucose labeling (Macallan et al., 1998, Hellerstein and Neese, 1992, Hellerstein et al., 1999, Hellerstein, 1999, Mohri et al., 2001). Data from such experiments can be conveniently analyzed using flow cytometry and have yielded information about proliferation and death in T cell populations both in vitro and in vivo (see review by (Hellerstein, 1999)). However, one drawback is that cells that have undergone one division cannot be distinguished from those that went through many rounds of replication. Thus this technique provide little information about the number of divisions performed by the cells in the populations. Also, because labeling only happens when cell replicate their DNA, the average death rate within a population cannot be extract from this kind of data alone (Asquith et al., 2006). This problem was solved by Lyons and Parish who devised a method to quantify cell growth and division that used flow cytometric measurements of the fluorescent dye CFSE (Carboxyfluorescein succinimidyl ester) (Lyons and Parish, 1994, Lyons, 2000). CFSE had been previously used to monitor cell migration because it can be retained by cell for very long periods of times without being transferred to neighboring cells (Weston and Parish, 1990, Parish, 1999). In an experiment, cells are treated with the highly cell permeable non-fluorescent CFDA-SE
(carboxyfluorescein diacetate succinimidyl ester). Once in the cells, the acetate groups are removed by intracellular esterases yielding the fluorescent CFSE which cross-links covalently with proteins and makes the cell labeling very stable. The important difference with techniques that label DNA is that CFSE will mark all cells based on their protein content, regardless of if they are replicating their DNA. In general CFSE ends up uniformly distributed in the cells and upon division its intracellular concentration dilutes twofold. It becomes therefore possible to measure death rates and to classify cells by the number of divisions that they have undergone since the beginning of the experiment. CFSE labeling has been used both for in vitro and in vivo studies. For the later however, cells are often labeled in vitro before they are introduced in a host for in vivo monitoring. The reason is that it is difficult to obtain a homogeneous labeling of the cells in vivo and if the labeling is not homogeneous at time zero then clear peaks cannot be distinguished in the flow cytometric measurements, making the analysis more difficult (Asquith et al., 2006). Typically, as many as 7 to 8 divisions can be resolved before the level of fluorescence in individual cells becomes indistinguishable from background. Histograms of CFSE levels obtained from flow cytometric measurements in a growing population of cells usually exhibit multiple intensity peaks, one for each division class (or cohort) i where i is the number of divisions undergone by the cells within a division class. The relative heights of the individual peaks provides information about the probability for a cell to be in a given division class at a given time point. These probabilities depend both on the heterogeneity in cell cycle duration and on the exponential doubling in the number of cells after each divisions, which can be confusing. In order to separate these two bits of information, Gett and Hodgkin devised an elegant graphical analysis that consists of dividing the integrated CFSE intensity under the peak by 2i for each division class i. Doing so removes the effect of the serial doubling and provides information about how the original cells are distributed in the different division classes. Gett and Hodgkin called this distribution the precursor cohort distribution (Deenick et al., 2003, Gett and Hodgkin, 2000) (see Figure 5). In recent years many antigen-specific cytometric tools have been developed to track lymphocytes that are specifically involved in the immune reaction to specific antigens (reviewed in (Thiel et al., 2004)) opening new possibilities for the study of immune responses using quantitative data analysis and mathematical modeling. Finally, cell division and death events can be recorded directly by monitoring a population of cells using film and microscopy as was done for example in studies of tumors and fibroblasts (Dawson et al., 1965, Marin and Bender, 1966, Froese, 1964), and very recently for B cells (Hawkins et al., 2009). The advantage of this approach is that it can provide information about single cell dynamics and the degree of inheritance of death and division behavior from mother to daughter cells (Spencer et al., 2009). 3.2. Mathematical models of T cells proliferation and differentiation. The basic procedure to extract information about cell proliferation statistics from the data just described is to build a mathematical model with biologically relevant parameters and fit it to the data to extract parameter values. Because some a priori information is required to build a mathematical model caution must be exercised in the interpretation of the results. As with all inversion problems, extracting a ‘best’ model from the data may not be possible. Often many models can fit the same data in an acceptable manner and it is the collection of these models that is the real solution to the inverse problem (Tarantola, 2006, Tarantola, 2005) (and section 2 in (Pilyugin et al., 2003)). Inversion procedures are nevertheless widely used in science and engineering: in seismology to extract information about subsurface structures from surface recordings; in astrophysics to study physical processes taking places in stars from spectral lines measurements; in biology to visualize
proteins structures from spectroscopy. In all these cases prior information about the physical properties of the material under study (rock, plasma, amino acids chains) is used together with the laws of physics to construct a mathematical model that describes the dynamical response of the system when it is excited by a source of energy (sound wave, light, radiations). In the case of T cells, there is no set of universal laws that one can use to build a model like in physical system. Instead, proliferation and differentiation behaviors are the result of a computation performed by individual cells using their intracellular transduction and gene regulation machinery.
Keeping these caveats in mind we turn to reviewing the models that have been used in the literature to examine T cells population dynamics. Rather than taking a historical perspective we start with simple Ordinary Differential Equation (ODE) systems describing homogeneous populations and finish with more complex models that attempts to extract information about the heterogeneous behavior of individual cells within a population. 3.2.1. Homogeneous birth-and-death models with constant rates of birth and death. In the case of homogeneous populations, the simplest models are random birth-and-death models in which the increase (division) and decrease (death) in the number of cells per unit time is proportional to the number of cells in the population with rates of proliferation p and death d that contsnat in time and homogeneous across the population. In this case the number of cells that have divided i times at time t is (Revy et al., 2001, Pilyugin et al., 2003, De Boer et al., 2006a)
(1) Thus, the total number of cells varies exponentially with the rate
(2) and the frequency distribution , which describes the probability that a cell pertains to the division class i at time t, is Poisson distributed with mean and variance
(3) Such models and their variants have been widely used to extract average proliferation and death rates from cell populations labeled with BrDU, D-glucose and CFSE in vitro and in vivo (e.g. (Veiga-Fernandes et al., 2000, Bonhoeffer et al., 2000, Mohri et al., 2001, Revy et al., 2001, Ribeiro et al., 2002, Asquith et al., 2006, Ganusov et al., 2005a)). When using birth-and-death processes to extract information from data obtained with DNA-labeling techniques, one must take into account the rate of cell labeling. By using data measured during and after the administration of e.g. BrDU, independent values for p and d can sometimes be obtained (Bonhoeffer et al., 2000). In the simple birth-and-death model above (equation 3) the frequency distribution of cells in the division class i at time t is independent of the death rate. Thus, the proliferation rate p can be extracted directly from CFSE data, while the death rate can be obtained by monitoring the fraction
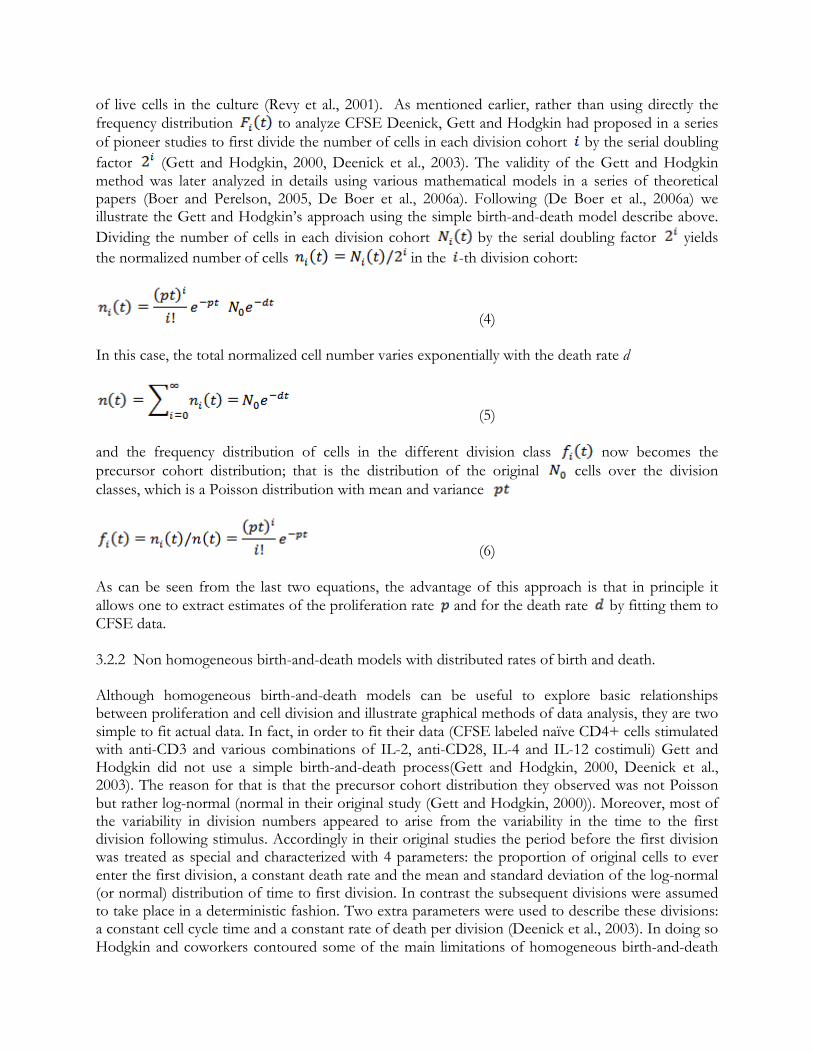
of live cells in the culture (Revy et al., 2001). As mentioned earlier, rather than using directly the frequency distribution to analyze CFSE Deenick, Gett and Hodgkin had proposed in a series of pioneer studies to first divide the number of cells in each division cohort by the serial doubling factor (Gett and Hodgkin, 2000, Deenick et al., 2003). The validity of the Gett and Hodgkin method was later analyzed in details using various mathematical models in a series of theoretical papers (Boer and Perelson, 2005, De Boer et al., 2006a). Following (De Boer et al., 2006a) we illustrate the Gett and Hodgkin’s approach using the simple birth-and-death model describe above. Dividing the number of cells in each division cohort by the serial doubling factor yields the normalized number of cells in the -th division cohort:
(4) In this case, the total normalized cell number varies exponentially with the death rate d
(5) and the frequency distribution of cells in the different division class now becomes the precursor cohort distribution; that is the distribution of the original cells over the division classes, which is a Poisson distribution with mean and variance
(6) As can be seen from the last two equations, the advantage of this approach is that in principle it allows one to extract estimates of the proliferation rate and for the death rate by fitting them to CFSE data. 3.2.2 Non homogeneous birth-and-death models with distributed rates of birth and death. Although homogeneous birth-and-death models can be useful to explore basic relationships between proliferation and cell division and illustrate graphical methods of data analysis, they are two simple to fit actual data. In fact, in order to fit their data (CFSE labeled naïve CD4+ cells stimulated with anti-CD3 and various combinations of IL-2, anti-CD28, IL-4 and IL-12 costimuli) Gett and Hodgkin did not use a simple birth-and-death process(Gett and Hodgkin, 2000, Deenick et al., 2003). The reason for that is that the precursor cohort distribution they observed was not Poisson but rather log-normal (normal in their original study (Gett and Hodgkin, 2000)). Moreover, most of the variability in division numbers appeared to arise from the variability in the time to the first division following stimulus. Accordingly in their original studies the period before the first division was treated as special and characterized with 4 parameters: the proportion of original cells to ever enter the first division, a constant death rate and the mean and standard deviation of the log-normal (or normal) distribution of time to first division. In contrast the subsequent divisions were assumed to take place in a deterministic fashion. Two extra parameters were used to describe these divisions: a constant cell cycle time and a constant rate of death per division (Deenick et al., 2003). In doing so Hodgkin and coworkers contoured some of the main limitations of homogeneous birth-and-death
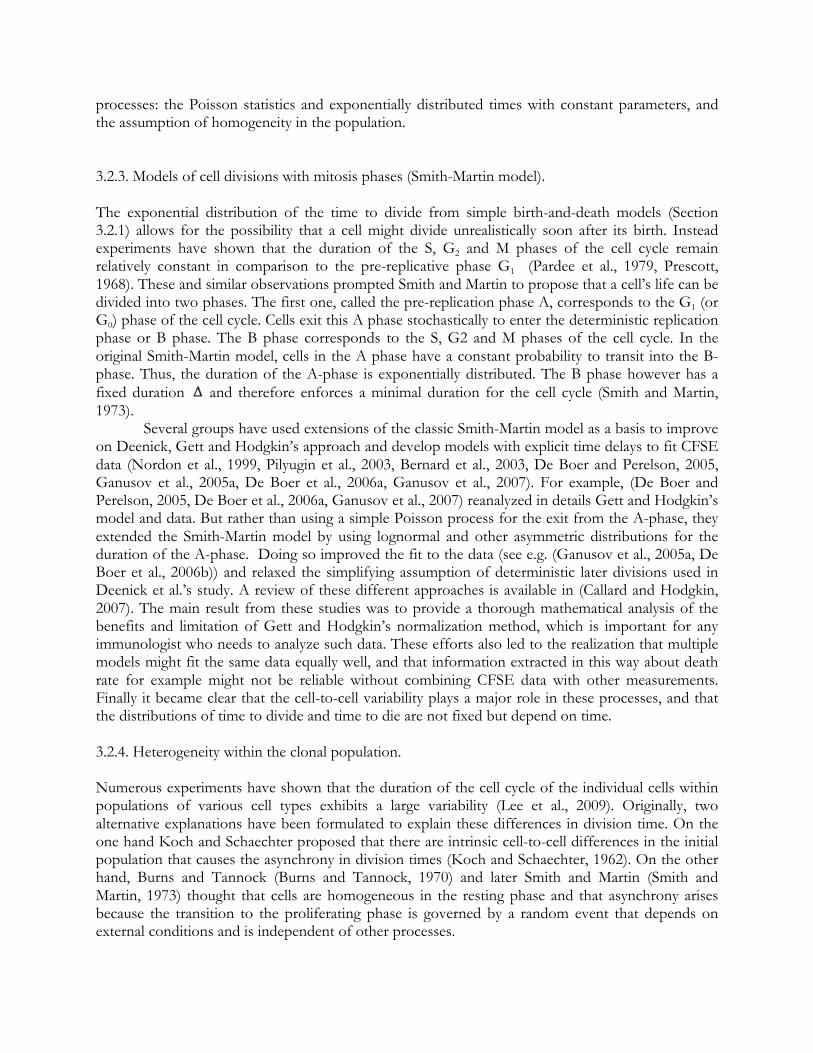
processes: the Poisson statistics and exponentially distributed times with constant parameters, and the assumption of homogeneity in the population. 3.2.3. Models of cell divisions with mitosis phases (Smith-Martin model). The exponential distribution of the time to divide from simple birth-and-death models (Section 3.2.1) allows for the possibility that a cell might divide unrealistically soon after its birth. Instead experiments have shown that the duration of the S, G2 and M phases of the cell cycle remain relatively constant in comparison to the pre-replicative phase G1 (Pardee et al., 1979, Prescott, 1968). These and similar observations prompted Smith and Martin to propose that a cell’s life can be divided into two phases. The first one, called the pre-replication phase A, corresponds to the G1 (or G0) phase of the cell cycle. Cells exit this A phase stochastically to enter the deterministic replication phase or B phase. The B phase corresponds to the S, G2 and M phases of the cell cycle. In the original Smith-Martin model, cells in the A phase have a constant probability to transit into the B-phase. Thus, the duration of the A-phase is exponentially distributed. The B phase however has a fixed duration and therefore enforces a minimal duration for the cell cycle (Smith and Martin, 1973). Several groups have used extensions of the classic Smith-Martin model as a basis to improve on Deenick, Gett and Hodgkin’s approach and develop models with explicit time delays to fit CFSE data (Nordon et al., 1999, Pilyugin et al., 2003, Bernard et al., 2003, De Boer and Perelson, 2005, Ganusov et al., 2005a, De Boer et al., 2006a, Ganusov et al., 2007). For example, (De Boer and Perelson, 2005, De Boer et al., 2006a, Ganusov et al., 2007) reanalyzed in details Gett and Hodgkin’s model and data. But rather than using a simple Poisson process for the exit from the A-phase, they extended the Smith-Martin model by using lognormal and other asymmetric distributions for the duration of the A-phase. Doing so improved the fit to the data (see e.g. (Ganusov et al., 2005a, De Boer et al., 2006b)) and relaxed the simplifying assumption of deterministic later divisions used in Deenick et al.’s study. A review of these different approaches is available in (Callard and Hodgkin, 2007). The main result from these studies was to provide a thorough mathematical analysis of the benefits and limitation of Gett and Hodgkin’s normalization method, which is important for any immunologist who needs to analyze such data. These efforts also led to the realization that multiple models might fit the same data equally well, and that information extracted in this way about death rate for example might not be reliable without combining CFSE data with other measurements. Finally it became clear that the cell-to-cell variability plays a major role in these processes, and that the distributions of time to divide and time to die are not fixed but depend on time. 3.2.4. Heterogeneity within the clonal population. Numerous experiments have shown that the duration of the cell cycle of the individual cells within populations of various cell types exhibits a large variability (Lee et al., 2009). Originally, two alternative explanations have been formulated to explain these differences in division time. On the one hand Koch and Schaechter proposed that there are intrinsic cell-to-cell differences in the initial population that causes the asynchrony in division times (Koch and Schaechter, 1962). On the other hand, Burns and Tannock (Burns and Tannock, 1970) and later Smith and Martin (Smith and Martin, 1973) thought that cells are homogeneous in the resting phase and that asynchrony arises because the transition to the proliferating phase is governed by a random event that depends on external conditions and is independent of other processes.
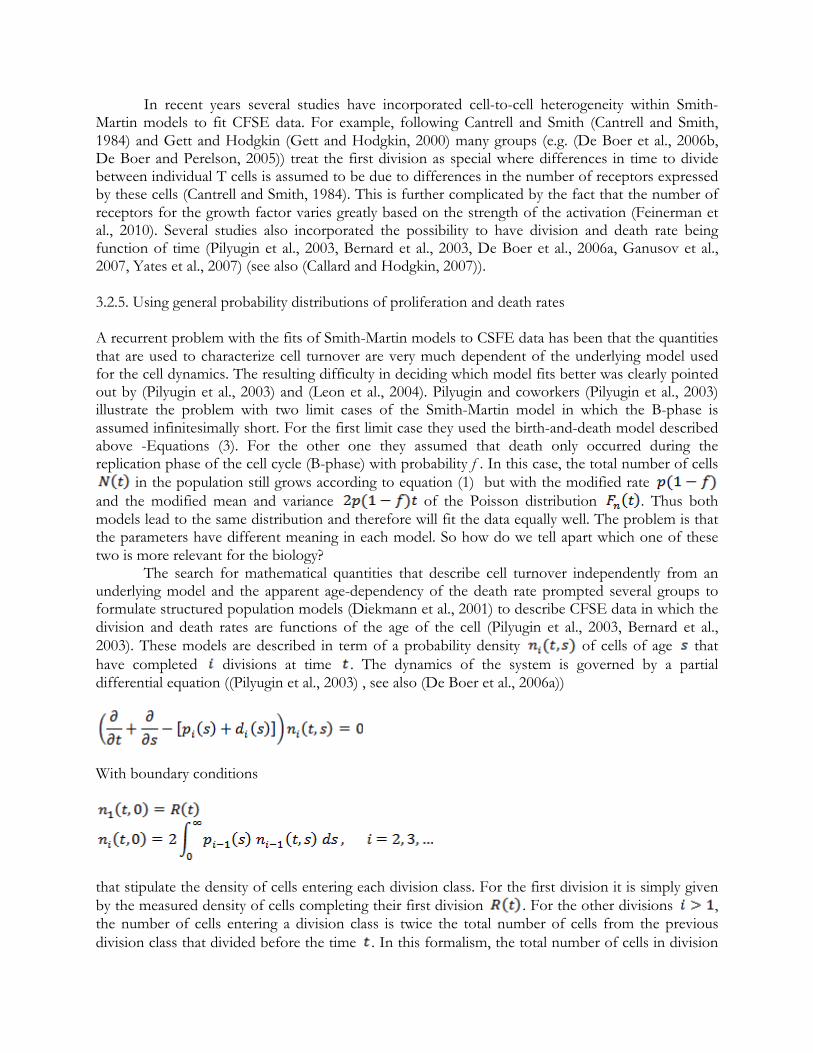
In recent years several studies have incorporated cell-to-cell heterogeneity within Smith-Martin models to fit CFSE data. For example, following Cantrell and Smith (Cantrell and Smith, 1984) and Gett and Hodgkin (Gett and Hodgkin, 2000) many groups (e.g. (De Boer et al., 2006b, De Boer and Perelson, 2005)) treat the first division as special where differences in time to divide between individual T cells is assumed to be due to differences in the number of receptors expressed by these cells (Cantrell and Smith, 1984). This is further complicated by the fact that the number of receptors for the growth factor varies greatly based on the strength of the activation (Feinerman et al., 2010). Several studies also incorporated the possibility to have division and death rate being function of time (Pilyugin et al., 2003, Bernard et al., 2003, De Boer et al., 2006a, Ganusov et al., 2007, Yates et al., 2007) (see also (Callard and Hodgkin, 2007)). 3.2.5. Using general probability distributions of proliferation and death rates A recurrent problem with the fits of Smith-Martin models to CSFE data has been that the quantities that are used to characterize cell turnover are very much dependent of the underlying model used for the cell dynamics. The resulting difficulty in deciding which model fits better was clearly pointed out by (Pilyugin et al., 2003) and (Leon et al., 2004). Pilyugin and coworkers (Pilyugin et al., 2003) illustrate the problem with two limit cases of the Smith-Martin model in which the B-phase is assumed infinitesimally short. For the first limit case they used the birth-and-death model described above -Equations (3). For the other one they assumed that death only occurred during the replication phase of the cell cycle (B-phase) with probability f . In this case, the total number of cells
in the population still grows according to equation (1) but with the modified rate and the modified mean and variance of the Poisson distribution . Thus both models lead to the same distribution and therefore will fit the data equally well. The problem is that the parameters have different meaning in each model. So how do we tell apart which one of these two is more relevant for the biology? The search for mathematical quantities that describe cell turnover independently from an underlying model and the apparent age-dependency of the death rate prompted several groups to formulate structured population models (Diekmann et al., 2001) to describe CFSE data in which the division and death rates are functions of the age of the cell (Pilyugin et al., 2003, Bernard et al., 2003). These models are described in term of a probability density of cells of age that have completed divisions at time . The dynamics of the system is governed by a partial differential equation ((Pilyugin et al., 2003) , see also (De Boer et al., 2006a))
With boundary conditions
that stipulate the density of cells entering each division class. For the first division it is simply given by the measured density of cells completing their first division . For the other divisions , the number of cells entering a division class is twice the total number of cells from the previous division class that divided before the time . In this formalism, the total number of cells in division
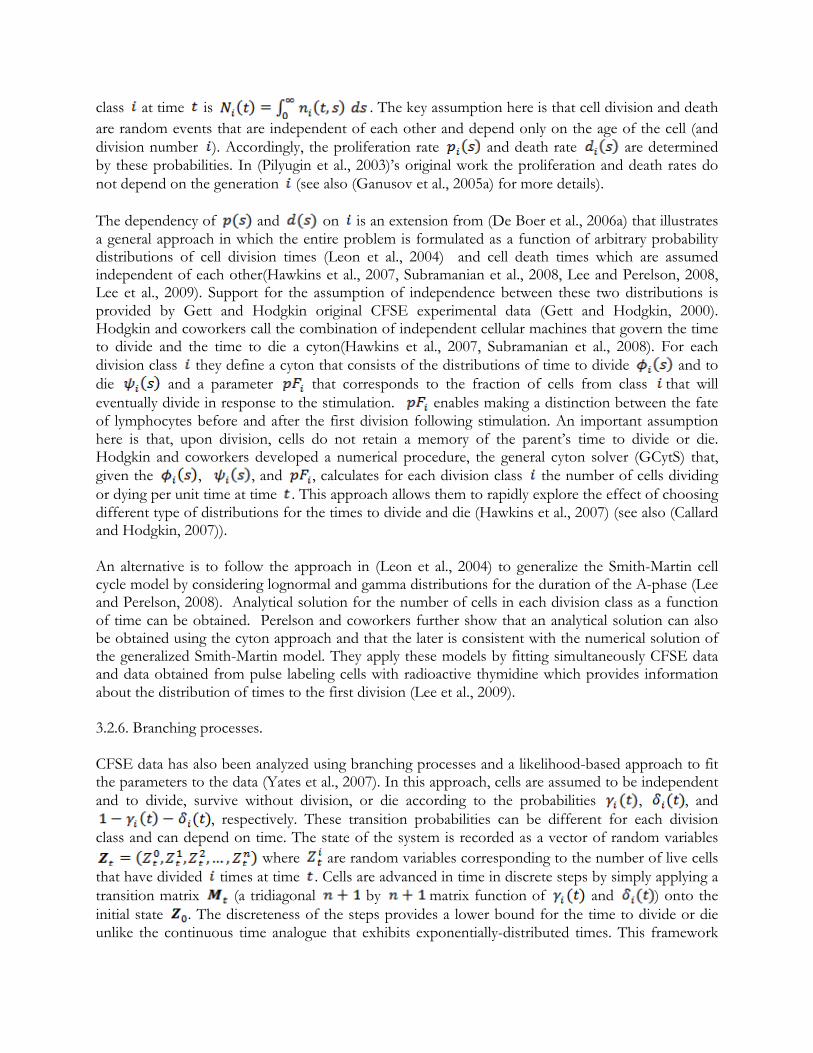
class at time is . The key assumption here is that cell division and death are random events that are independent of each other and depend only on the age of the cell (and division number ). Accordingly, the proliferation rate and death rate are determined by these probabilities. In (Pilyugin et al., 2003)’s original work the proliferation and death rates do not depend on the generation (see also (Ganusov et al., 2005a) for more details). The dependency of and on is an extension from (De Boer et al., 2006a) that illustrates a general approach in which the entire problem is formulated as a function of arbitrary probability distributions of cell division times (Leon et al., 2004) and cell death times which are assumed independent of each other(Hawkins et al., 2007, Subramanian et al., 2008, Lee and Perelson, 2008, Lee et al., 2009). Support for the assumption of independence between these two distributions is provided by Gett and Hodgkin original CFSE experimental data (Gett and Hodgkin, 2000). Hodgkin and coworkers call the combination of independent cellular machines that govern the time to divide and the time to die a cyton(Hawkins et al., 2007, Subramanian et al., 2008). For each division class they define a cyton that consists of the distributions of time to divide and to die and a parameter that corresponds to the fraction of cells from class that will eventually divide in response to the stimulation. enables making a distinction between the fate of lymphocytes before and after the first division following stimulation. An important assumption here is that, upon division, cells do not retain a memory of the parent’s time to divide or die. Hodgkin and coworkers developed a numerical procedure, the general cyton solver (GCytS) that, given the , , and , calculates for each division class the number of cells dividing or dying per unit time at time . This approach allows them to rapidly explore the effect of choosing different type of distributions for the times to divide and die (Hawkins et al., 2007) (see also (Callard and Hodgkin, 2007)). An alternative is to follow the approach in (Leon et al., 2004) to generalize the Smith-Martin cell cycle model by considering lognormal and gamma distributions for the duration of the A-phase (Lee and Perelson, 2008). Analytical solution for the number of cells in each division class as a function of time can be obtained. Perelson and coworkers further show that an analytical solution can also be obtained using the cyton approach and that the later is consistent with the numerical solution of the generalized Smith-Martin model. They apply these models by fitting simultaneously CFSE data and data obtained from pulse labeling cells with radioactive thymidine which provides information about the distribution of times to the first division (Lee et al., 2009). 3.2.6. Branching processes. CFSE data has also been analyzed using branching processes and a likelihood-based approach to fit the parameters to the data (Yates et al., 2007). In this approach, cells are assumed to be independent and to divide, survive without division, or die according to the probabilities , , and
, respectively. These transition probabilities can be different for each division class and can depend on time. The state of the system is recorded as a vector of random variables
where are random variables corresponding to the number of live cells that have divided times at time . Cells are advanced in time in discrete steps by simply applying a transition matrix (a tridiagonal by matrix function of and ) onto the initial state . The discreteness of the steps provides a lower bound for the time to divide or die unlike the continuous time analogue that exhibits exponentially-distributed times. This framework
allows calculating easily two useful quantities: the expected cell count at time is then , which in the case of constant transition probabilities simply reduces to
; and the covariant matrix of cell counts in each generation at time . Using the expectation and the covariant matrix a quasi-likelihood estimation method can be used to extract the model parameters from CFSE data. The nice thing about the method used by Yates et al. is that it immediately provides confidence intervals for the parameter values extracted from the data, which is important for discriminating between models. The branching process formalism also makes it easier to calculate higher moments of the distributions using generating functions (see (Yates et al., 2007) for more details). These properties have been used by Subramanian et al. to recast the cyton model into a branching process and extract information about the variability of the immune response to mitogenic signals (Subramanian et al., 2008). 3.2.7. Mechanistic models and Agent-based simulations. The focus of most of the models that we have described so far is to reproduce the correct statistics of death time, division time and differentiation times as a function of time and division during lymphocytes proliferation and contraction dynamics. Fitting these models to data can then provide information on the dynamics of the regulation of these processes by the cells during the immune response. A major problem, however is that multiple models can in general fit the same data. Moreover, cell division and death are modulated by intracellular mechanisms in response to external signals from self and other cells. Thus, to go further, mechanistic models must be formulated that connect the observed statistics of proliferation to molecular events and signaling. ODE models have been used for example to compare antigen-independent mechanisms of T cell regulations such as auto-regulation, para-regulation in which cell-to-cell communication occurs via cytokine signaling or via cell contact, and APC regulation via cell contact Allan, 2004 #131}. Another possibility is to use an agent-based simulation approach. Recent advances in agent-based simulation (Emonet et al., 2005, Emonet and Cluzel, 2008) and rule-based modeling of biochemical reactions (Faeder et al., 2009, Sneddon et al., 2010) is opening the possibility to connect inside of a computer intracellular molecular mechanisms to individual cells and population behavior. Agent-based modeling offers a natural approach for studying how molecular mechanisms shape a heterogeneous distribution of cell phenotypes. Agents are distinct computational objects representing individual cells or molecules whose behaviors depend on their internal states and interaction rules between them. The state of cells is determined by simple logical rules that can represent decision to divide, die etc based on external and internal states. Such approaches have been used to model complex social problems and in immunology for example to model cytotoxic T cell responses (Chao et al., 2004).
It is also possible to represent the internal biochemistry using standard ODE and stochastic solvers. This approach rapidly becomes impractical as the complexity of the intracellular systems increases due to the large combination of possible molecular interactions that need to be tracked using standard solvers (the combinatorial explosion problem (Hlavacek et al., 2006)). To solve this problem we have developed the rule and agent based simulator NFsim (Sneddon et al., 2010). For many complex systems, NFsim’s stochastic algorithm offers significant computational speedups of several orders of magnitude over standard approaches. Moreover, NFsim facilitates the coarse-graining of biological models by expressing reaction rates as arbitrary mathematical functions of the local environment or state of individual molecules. These recent developments in agent-based modeling should allow future progress in elucidating the molecular mechanisms leading to T-cell proliferation and differentiation.
3.3. What did we learn about T cell proliferation using mathematical and computational models Early experiments on cell proliferation (Smith and Martin, 1973, Shilo et al., 1979)combined with mathematical models (Koch and Schaechter, 1962, Burns and Tannock, 1970, Smith and Martin, 1973) established that cell cycle times within a population exhibit a large variability that arises mostly during the G1 phase of the cell cycle. The origin of this variability however remained subject of debate (Koch, 1980, Leon et al., 2004). In the case of T cells proliferation, the development of a method to synchronize IL-2R positive T cells by Cantrell and Smith enabled them to examine the role of IL-2 in determining T cell proliferation (Cantrell and Smith, 1984, Cantrell and Smith, 1983). The conclusion of these pioneer studies was that 3 factors are critical for T cell cycle progression: IL-2 concentration, IL-2R receptor numbers and the duration of IL-2 receptor interaction. Based on these findings Cantrell and Smith proposed that the heterogeneity in cell cycle times of T cells is the direct consequence of a lognormal variability in the expression of IL-2 receptors on the surface of these cells (Cantrell and Smith, 1984, Cantrell and Smith, 1983). Direct confirmation at the molecular level of this conjecture came with the quantitative measurement of the heterogeneity of STAT5 phosphorylation (as the signaling response triggered by IL-2 receptor engagement) based on the levels of IL-2R subunits (See cytokine signaling section above). In turns, researchers need to come to terms quantitatively with the phenotypic variability of lymphocytes (from cell signaling to cell cycle progression): this heterogeneity can be limiting when accurate self/non-self discrimination is to be enforced, but it can also be critical as a source of adaptability or diversification to match any pathogenic escape route (via mutation, relocation or others routes). CFSE enabled quantitative studies of the cell cycle progression in a population of lymphocytes (Sec 3.1). Gett and Hodgkin took advantage of this technique to analyze proliferation of naïve CD4+ cells stimulated with anti-CD3 at saturating amounts of IL-2 (Gett and Hodgkin, 2000). Confirming Cantrell and Smith earlier study they found that most of the variability in division numbers arises from the variability in the first division time. Next they asked how a T cell might integrate information from various stimuli. They stimulated T cells with various combinations of anti-CD28, IL-4 and IL-12 and fitted the data with their model (see Section 3.2.2) looking for changes in the parameter values of the model. They found that stimulation with anti-CD28 or IL-4 reduced the time to first division, but that anti-CD28 left the rate of subsequent division unchanged, whereas IL-4 accelerated the subsequent cell cycles. IL-12 had no effect. Interestingly, when IL4 and CD28 were added together their effects on division time were additive. Thus, several co-stimuli could have additive effects on T cell cycle duration ultimately leading to large differences in population sizes without invoking obligatory stimuli. These results suggested that T cells performs some sort of cellular calculus and that no stimulus is obligatory in contrast with the two-signal theory of T cell activation (Bretscher and Cohn, 1970, Bretscher, 1999, Schwartz, 1996) (reviewed in (Baxter and Hodgkin, 2002)). In a subsequent study Hodgkin and coworkers examined what happened in the presence of smaller non-saturating concentrations of IL-2 (0.6 – 50 U/ml) (Deenick et al., 2003). Fitting the new data required augmenting the original 4 parameter model with 2 new parameters and replacing the Gaussian distribution of time to first division with a log-normal distribution, consistent with Cantrell and Smith’s original experiments(Cantrell and Smith, 1984, Cantrell and Smith, 1983). The main finding was that the proportion of cells that enter the first division (first new parameter), but not their time of entry, strongly increased for increasing IL-2 concentration. The survival rate (second
new parameter) and the division rate after the first division decreased with increasing IL-2 (Deenick et al., 2003). In these studies, mathematical models played two important roles. On the one hand, they were essential to fit the data and extract biologically relevant information. On the other hand, they enabled Get and Hodgkin to quantitatively illustrate how a cellular calculus might be taking place inside individual T cells that integrate information from multiple stimuli into minute variations in their proliferation, differentiation and death rates. The cumulative effect of these small variations eventually yields important changes in the population dynamics (Germain, 2001). Gett and Hodgkin summarized this hypothesis in what they called -- the law of independence: the likelihoods to divide, survive, die or differentiate operate independently within an individual cell and can be described by probabilistic functions. The law of independence strongly contrasted with the two signal theory(Bretscher and Cohn, 1970, Bretscher, 1999) that had been dominating the field since the 1970’s (for a review see (Baxter and Hodgkin, 2002)). Hodgkin and coworker’s pioneer studies prompted several theoretical studies of the same data with increasingly refined models as well as new studies that used a similar combination of experiments, data analysis and modeling ( e.g. (Pilyugin et al., 2003, Bernard et al., 2003, De Boer and Perelson, 2005, Ganusov et al., 2005b, De Boer et al., 2006b, Ganusov et al., 2007, Yates et al., 2008, Schlub et al., 2009); see also review (Callard and Hodgkin, 2007)) . An important result that emerged from these studies was the realization that IL-2 might regulate the expansion of CD4+ T cells by modulating the death rate within the population (Ganusov et al., 2007). To arrive to this conclusion models that account for the dependency of the proliferation and death rates on the age of the cell were used (Pilyugin et al., 2003, Leon et al., 2004, Antia et al., 2005, De Boer and Perelson, 2005, De Boer et al., 2006b). Note that we are reviewing here models for T cell proliferation and death, but this framework could be applied to B cell proliferation or even proliferation of other cell types. The following picture of T cell proliferation emerges from these in vitro studies:
1. Only a subset of the original cell population enters the first division. The likelihood that a cell will enter the first division depends on various factors such as activation strength and duration, source and type of cells. Because this time before the first division appears to be different from subsequent divisions, separate models or at least model parameters must be used to describe it.
2. The main source of asynchrony in the population stems from the variability in the time to the first division which exhibits an approximate lognormal distribution. The origin of this distribution remains unclear. An attractive possibility is that it results from the lognormal distribution of IL-2 receptors expressed in populations of T cells (Cantrell and Smith, 1983, Cantrell and Smith, 1984). Interestingly, a larger IL-2 stimulus yields a larger proportion of original cells that undergo division, but does not affect the mean time to enter the first division (although it reduces the standard deviation of the distribution).
3. Following the first division, T cells undergo a finite number of divisions (~6 to 10). In each round of the cell cycle, cells go through a relatively deterministic B-phase (in the Smith-Martin sense) of replication (S, G2, M) which requires a minimum of time to complete before entering the prereplicative A-phase. Exit from the A-phase into the B-phase is stochastic with a fixed timescale.
4. In in vitro studies, the distributions of time to divide and time to die in each division class are approximately lognormal or gamma and seem to be relatively independent of each other. For these subsequent divisions, the death rate increases with the number of divisions undergone by individual cells. IL-2 does not affect much the mean division time but increases the rate of cell death with the number of division rounds.
Recent studies have highlighted how heterogeneous cellular responses can be. For example, in the case of the response to TRAIL signals (a TNF-related apoptosis-inducing ligand), hepatocarcinoma cells undergo apoptosis with varied time and frequency (Spencer et al., 2009). In the case of lymphocytes, short-term (<10min) signaling responsiveness to antigenic ligands can vary by more than 105 within a clonal population of T cells (Feinerman et al., 2008b). In this example, the origin of the variability was partly traced back to the variable levels of expression of two key signaling regulators (the coreceptor CD8 and the phosphatase SHP-1). In the context of modeling cell proliferation, these signaling heterogeneity will carry into variability in the time of first division and may shape the further proliferation and differentiation. In particular, work by the Reiner lab has demonstrated how T lymphocytes may undergo asymmetric cell division at the onset of an immune response: naïve cells generate two very different daughter cells, one stays engaged with the antigen-presenting cells and keep a large quantity of receptors engaged in the immunological synapse (e.g. TCR, CD8, LFA-1) while the second one buds off and is not endowed with large levels of activating receptors (Chang et al., 2007). These two daughter cells undergo very different fates: the first (receptor-rich) cell proliferates rapidly, gains effector function and ultimately disappear by apoptosis. The later (receptor-poor) cell is essentially quiescent, does not undergo further cell division and becomes a long-lasting memory cell. Hence, a clonal population of T cells can have very different fates and proliferation capabilities.
Most strikingly, this functional diversification may carry out for many generations, pointing out how signaling variability on short timescales may imprint T cells with inherited heterogeneity and long-term variation in fate. This will need to be documented at the molecular level, but, already, Hodgkin and colleagues have probed this functional inheritance in the case of dividing B lymphocytes: they monitor individual B cell proliferation response and demonstrated how sister B cells (i.e. cells originating from the same progenitor) are strongly correlated in their division and death rates. Hence there exist inheritable signals that shape the proliferation of lymphocytes. These new observations will need to be integrated in future models of lymphocyte proliferation.
3. Conclusion. This chapter presented different challenges for Biophysicists studying the immune system. We presented few classical problems in Immunology that would benefit from fresh approaches beyond genetics and cellular immunology. In particular, we emphasized how immunology is, at its core, a “number” game: T lymphocytes can respond to antigens with exquisite specificity despite quantitatively-minute differences, and trigger qualitatively-varied responses that are matched to the pathogenic challenges. The amplitude of lymphocyte proliferation is critical to mount an effective defense against pathogenic onslaught. As quantitative techniques are becoming more widespread, new challenges are emerging to understand the immune system. Modeling immune responses thus becomes a critical tool to account for the emergence of self-organized responses in the immune system. As pointed out by R. May (May, 2004), modeling biology benefits from our molecular understanding of the underlying nonlinearity of the system. We would like to add that the generalization of quantitative measurements in Immunology will bring the
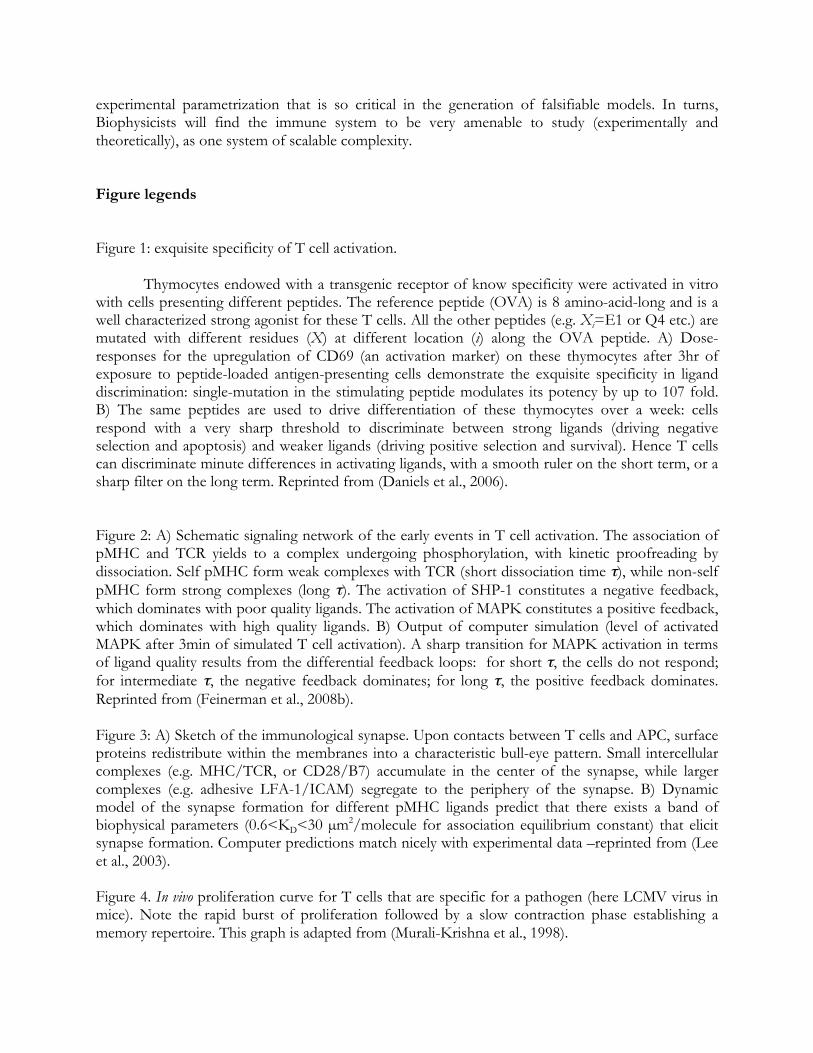
experimental parametrization that is so critical in the generation of falsifiable models. In turns, Biophysicists will find the immune system to be very amenable to study (experimentally and theoretically), as one system of scalable complexity. Figure legends Figure 1: exquisite specificity of T cell activation.
Thymocytes endowed with a transgenic receptor of know specificity were activated in vitro
with cells presenting different peptides. The reference peptide (OVA) is 8 amino-acid-long and is a well characterized strong agonist for these T cells. All the other peptides (e.g. Xi=E1 or Q4 etc.) are mutated with different residues (X) at different location (i) along the OVA peptide. A) Dose-responses for the upregulation of CD69 (an activation marker) on these thymocytes after 3hr of exposure to peptide-loaded antigen-presenting cells demonstrate the exquisite specificity in ligand discrimination: single-mutation in the stimulating peptide modulates its potency by up to 107 fold. B) The same peptides are used to drive differentiation of these thymocytes over a week: cells respond with a very sharp threshold to discriminate between strong ligands (driving negative selection and apoptosis) and weaker ligands (driving positive selection and survival). Hence T cells can discriminate minute differences in activating ligands, with a smooth ruler on the short term, or a sharp filter on the long term. Reprinted from (Daniels et al., 2006).
Figure 2: A) Schematic signaling network of the early events in T cell activation. The association of pMHC and TCR yields to a complex undergoing phosphorylation, with kinetic proofreading by dissociation. Self pMHC form weak complexes with TCR (short dissociation time τ), while non-self pMHC form strong complexes (long τ). The activation of SHP-1 constitutes a negative feedback, which dominates with poor quality ligands. The activation of MAPK constitutes a positive feedback, which dominates with high quality ligands. B) Output of computer simulation (level of activated MAPK after 3min of simulated T cell activation). A sharp transition for MAPK activation in terms of ligand quality results from the differential feedback loops: for short τ, the cells do not respond; for intermediate τ, the negative feedback dominates; for long τ, the positive feedback dominates. Reprinted from (Feinerman et al., 2008b).
Figure 3: A) Sketch of the immunological synapse. Upon contacts between T cells and APC, surface proteins redistribute within the membranes into a characteristic bull-eye pattern. Small intercellular complexes (e.g. MHC/TCR, or CD28/B7) accumulate in the center of the synapse, while larger complexes (e.g. adhesive LFA-1/ICAM) segregate to the periphery of the synapse. B) Dynamic model of the synapse formation for different pMHC ligands predict that there exists a band of biophysical parameters (0.6<KD<30 µm2/molecule for association equilibrium constant) that elicit synapse formation. Computer predictions match nicely with experimental data –reprinted from (Lee et al., 2003).
Figure 4. In vivo proliferation curve for T cells that are specific for a pathogen (here LCMV virus in mice). Note the rapid burst of proliferation followed by a slow contraction phase establishing a memory repertoire. This graph is adapted from (Murali-Krishna et al., 1998).
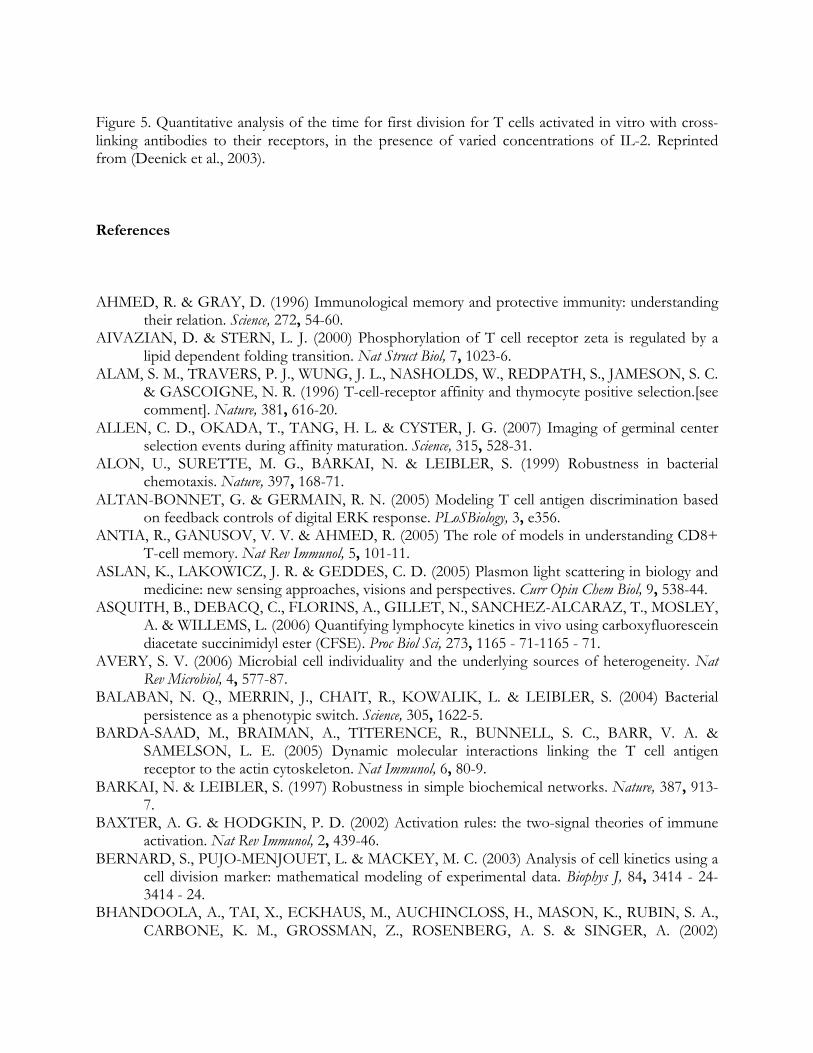
Figure 5. Quantitative analysis of the time for first division for T cells activated in vitro with cross-linking antibodies to their receptors, in the presence of varied concentrations of IL-2. Reprinted from (Deenick et al., 2003). References AHMED, R. & GRAY, D. (1996) Immunological memory and protective immunity: understanding
their relation. Science, 272, 54-60. AIVAZIAN, D. & STERN, L. J. (2000) Phosphorylation of T cell receptor zeta is regulated by a
lipid dependent folding transition. Nat Struct Biol, 7, 1023-6. ALAM, S. M., TRAVERS, P. J., WUNG, J. L., NASHOLDS, W., REDPATH, S., JAMESON, S. C.
& GASCOIGNE, N. R. (1996) T-cell-receptor affinity and thymocyte positive selection.[see comment]. Nature, 381, 616-20.
ALLEN, C. D., OKADA, T., TANG, H. L. & CYSTER, J. G. (2007) Imaging of germinal center selection events during affinity maturation. Science, 315, 528-31.
ALON, U., SURETTE, M. G., BARKAI, N. & LEIBLER, S. (1999) Robustness in bacterial chemotaxis. Nature, 397, 168-71.
ALTAN-BONNET, G. & GERMAIN, R. N. (2005) Modeling T cell antigen discrimination based on feedback controls of digital ERK response. PLoSBiology, 3, e356.
ANTIA, R., GANUSOV, V. V. & AHMED, R. (2005) The role of models in understanding CD8+ T-cell memory. Nat Rev Immunol, 5, 101-11.
ASLAN, K., LAKOWICZ, J. R. & GEDDES, C. D. (2005) Plasmon light scattering in biology and medicine: new sensing approaches, visions and perspectives. Curr Opin Chem Biol, 9, 538-44.
ASQUITH, B., DEBACQ, C., FLORINS, A., GILLET, N., SANCHEZ-ALCARAZ, T., MOSLEY, A. & WILLEMS, L. (2006) Quantifying lymphocyte kinetics in vivo using carboxyfluorescein diacetate succinimidyl ester (CFSE). Proc Biol Sci, 273, 1165 - 71-1165 - 71.
AVERY, S. V. (2006) Microbial cell individuality and the underlying sources of heterogeneity. Nat Rev Microbiol, 4, 577-87.
BALABAN, N. Q., MERRIN, J., CHAIT, R., KOWALIK, L. & LEIBLER, S. (2004) Bacterial persistence as a phenotypic switch. Science, 305, 1622-5.
BARDA-SAAD, M., BRAIMAN, A., TITERENCE, R., BUNNELL, S. C., BARR, V. A. & SAMELSON, L. E. (2005) Dynamic molecular interactions linking the T cell antigen receptor to the actin cytoskeleton. Nat Immunol, 6, 80-9.
BARKAI, N. & LEIBLER, S. (1997) Robustness in simple biochemical networks. Nature, 387, 913-7.
BAXTER, A. G. & HODGKIN, P. D. (2002) Activation rules: the two-signal theories of immune activation. Nat Rev Immunol, 2, 439-46.
BERNARD, S., PUJO-MENJOUET, L. & MACKEY, M. C. (2003) Analysis of cell kinetics using a cell division marker: mathematical modeling of experimental data. Biophys J, 84, 3414 - 24-3414 - 24.
BHANDOOLA, A., TAI, X., ECKHAUS, M., AUCHINCLOSS, H., MASON, K., RUBIN, S. A., CARBONE, K. M., GROSSMAN, Z., ROSENBERG, A. S. & SINGER, A. (2002)
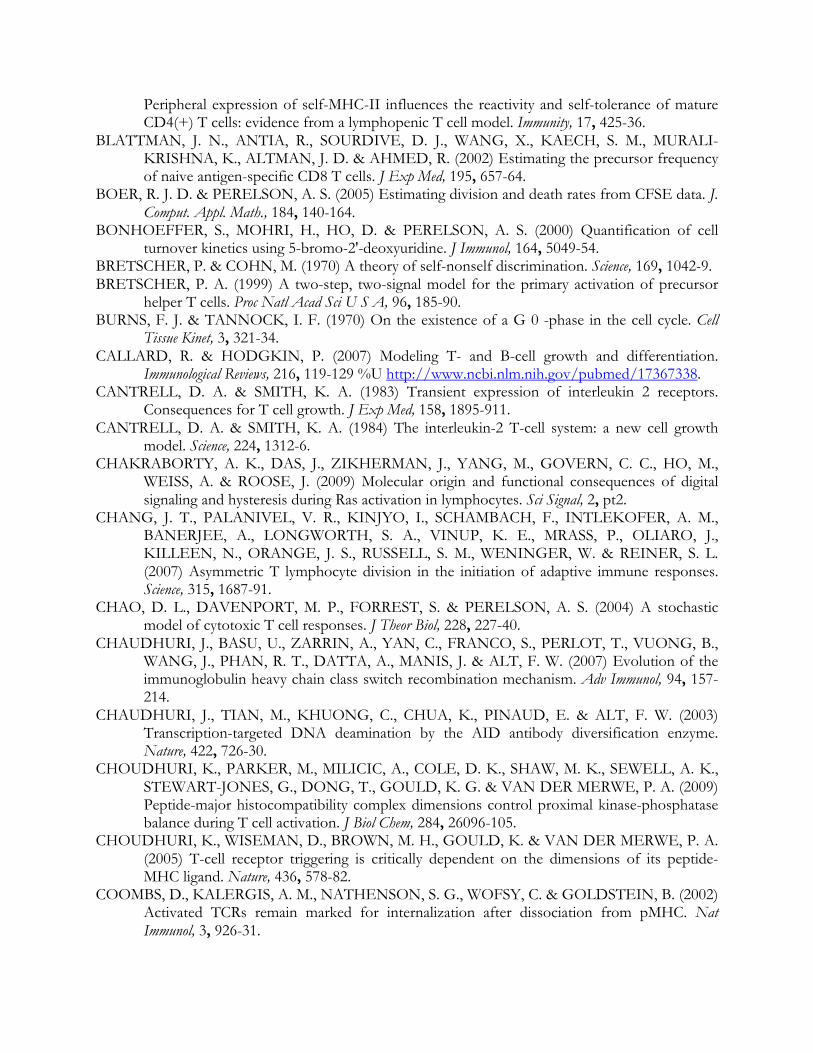
Peripheral expression of self-MHC-II influences the reactivity and self-tolerance of mature CD4(+) T cells: evidence from a lymphopenic T cell model. Immunity, 17, 425-36.
BLATTMAN, J. N., ANTIA, R., SOURDIVE, D. J., WANG, X., KAECH, S. M., MURALI-KRISHNA, K., ALTMAN, J. D. & AHMED, R. (2002) Estimating the precursor frequency of naive antigen-specific CD8 T cells. J Exp Med, 195, 657-64.
BOER, R. J. D. & PERELSON, A. S. (2005) Estimating division and death rates from CFSE data. J. Comput. Appl. Math., 184, 140-164.
BONHOEFFER, S., MOHRI, H., HO, D. & PERELSON, A. S. (2000) Quantification of cell turnover kinetics using 5-bromo-2'-deoxyuridine. J Immunol, 164, 5049-54.
BRETSCHER, P. & COHN, M. (1970) A theory of self-nonself discrimination. Science, 169, 1042-9. BRETSCHER, P. A. (1999) A two-step, two-signal model for the primary activation of precursor
helper T cells. Proc Natl Acad Sci U S A, 96, 185-90. BURNS, F. J. & TANNOCK, I. F. (1970) On the existence of a G 0 -phase in the cell cycle. Cell
Tissue Kinet, 3, 321-34. CALLARD, R. & HODGKIN, P. (2007) Modeling T- and B-cell growth and differentiation.
Immunological Reviews, 216, 119-129 %U http://www.ncbi.nlm.nih.gov/pubmed/17367338. CANTRELL, D. A. & SMITH, K. A. (1983) Transient expression of interleukin 2 receptors.
Consequences for T cell growth. J Exp Med, 158, 1895-911. CANTRELL, D. A. & SMITH, K. A. (1984) The interleukin-2 T-cell system: a new cell growth
model. Science, 224, 1312-6. CHAKRABORTY, A. K., DAS, J., ZIKHERMAN, J., YANG, M., GOVERN, C. C., HO, M.,
WEISS, A. & ROOSE, J. (2009) Molecular origin and functional consequences of digital signaling and hysteresis during Ras activation in lymphocytes. Sci Signal, 2, pt2.
CHANG, J. T., PALANIVEL, V. R., KINJYO, I., SCHAMBACH, F., INTLEKOFER, A. M., BANERJEE, A., LONGWORTH, S. A., VINUP, K. E., MRASS, P., OLIARO, J., KILLEEN, N., ORANGE, J. S., RUSSELL, S. M., WENINGER, W. & REINER, S. L. (2007) Asymmetric T lymphocyte division in the initiation of adaptive immune responses. Science, 315, 1687-91.
CHAO, D. L., DAVENPORT, M. P., FORREST, S. & PERELSON, A. S. (2004) A stochastic model of cytotoxic T cell responses. J Theor Biol, 228, 227-40.
CHAUDHURI, J., BASU, U., ZARRIN, A., YAN, C., FRANCO, S., PERLOT, T., VUONG, B., WANG, J., PHAN, R. T., DATTA, A., MANIS, J. & ALT, F. W. (2007) Evolution of the immunoglobulin heavy chain class switch recombination mechanism. Adv Immunol, 94, 157-214.
CHAUDHURI, J., TIAN, M., KHUONG, C., CHUA, K., PINAUD, E. & ALT, F. W. (2003) Transcription-targeted DNA deamination by the AID antibody diversification enzyme. Nature, 422, 726-30.
CHOUDHURI, K., PARKER, M., MILICIC, A., COLE, D. K., SHAW, M. K., SEWELL, A. K., STEWART-JONES, G., DONG, T., GOULD, K. G. & VAN DER MERWE, P. A. (2009) Peptide-major histocompatibility complex dimensions control proximal kinase-phosphatase balance during T cell activation. J Biol Chem, 284, 26096-105.
CHOUDHURI, K., WISEMAN, D., BROWN, M. H., GOULD, K. & VAN DER MERWE, P. A. (2005) T-cell receptor triggering is critically dependent on the dimensions of its peptide-MHC ligand. Nature, 436, 578-82.
COOMBS, D., KALERGIS, A. M., NATHENSON, S. G., WOFSY, C. & GOLDSTEIN, B. (2002) Activated TCRs remain marked for internalization after dissociation from pMHC. Nat Immunol, 3, 926-31.
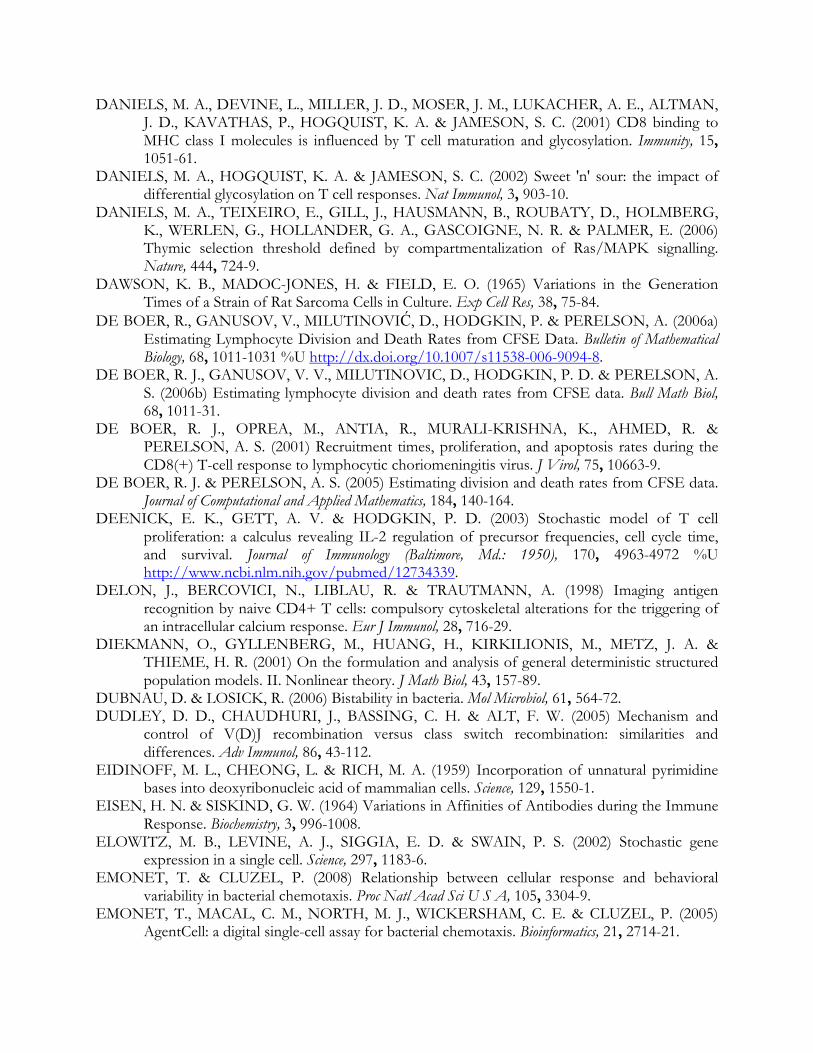
DANIELS, M. A., DEVINE, L., MILLER, J. D., MOSER, J. M., LUKACHER, A. E., ALTMAN, J. D., KAVATHAS, P., HOGQUIST, K. A. & JAMESON, S. C. (2001) CD8 binding to MHC class I molecules is influenced by T cell maturation and glycosylation. Immunity, 15, 1051-61.
DANIELS, M. A., HOGQUIST, K. A. & JAMESON, S. C. (2002) Sweet 'n' sour: the impact of differential glycosylation on T cell responses. Nat Immunol, 3, 903-10.
DANIELS, M. A., TEIXEIRO, E., GILL, J., HAUSMANN, B., ROUBATY, D., HOLMBERG, K., WERLEN, G., HOLLANDER, G. A., GASCOIGNE, N. R. & PALMER, E. (2006) Thymic selection threshold defined by compartmentalization of Ras/MAPK signalling. Nature, 444, 724-9.
DAWSON, K. B., MADOC-JONES, H. & FIELD, E. O. (1965) Variations in the Generation Times of a Strain of Rat Sarcoma Cells in Culture. Exp Cell Res, 38, 75-84.
DE BOER, R., GANUSOV, V., MILUTINOVIĆ, D., HODGKIN, P. & PERELSON, A. (2006a) Estimating Lymphocyte Division and Death Rates from CFSE Data. Bulletin of Mathematical Biology, 68, 1011-1031 %U http://dx.doi.org/10.1007/s11538-006-9094-8.
DE BOER, R. J., GANUSOV, V. V., MILUTINOVIC, D., HODGKIN, P. D. & PERELSON, A. S. (2006b) Estimating lymphocyte division and death rates from CFSE data. Bull Math Biol, 68, 1011-31.
DE BOER, R. J., OPREA, M., ANTIA, R., MURALI-KRISHNA, K., AHMED, R. & PERELSON, A. S. (2001) Recruitment times, proliferation, and apoptosis rates during the CD8(+) T-cell response to lymphocytic choriomeningitis virus. J Virol, 75, 10663-9.
DE BOER, R. J. & PERELSON, A. S. (2005) Estimating division and death rates from CFSE data. Journal of Computational and Applied Mathematics, 184, 140-164.
DEENICK, E. K., GETT, A. V. & HODGKIN, P. D. (2003) Stochastic model of T cell proliferation: a calculus revealing IL-2 regulation of precursor frequencies, cell cycle time, and survival. Journal of Immunology (Baltimore, Md.: 1950), 170, 4963-4972 %U http://www.ncbi.nlm.nih.gov/pubmed/12734339.
DELON, J., BERCOVICI, N., LIBLAU, R. & TRAUTMANN, A. (1998) Imaging antigen recognition by naive CD4+ T cells: compulsory cytoskeletal alterations for the triggering of an intracellular calcium response. Eur J Immunol, 28, 716-29.
DIEKMANN, O., GYLLENBERG, M., HUANG, H., KIRKILIONIS, M., METZ, J. A. & THIEME, H. R. (2001) On the formulation and analysis of general deterministic structured population models. II. Nonlinear theory. J Math Biol, 43, 157-89.
DUBNAU, D. & LOSICK, R. (2006) Bistability in bacteria. Mol Microbiol, 61, 564-72. DUDLEY, D. D., CHAUDHURI, J., BASSING, C. H. & ALT, F. W. (2005) Mechanism and
control of V(D)J recombination versus class switch recombination: similarities and differences. Adv Immunol, 86, 43-112.
EIDINOFF, M. L., CHEONG, L. & RICH, M. A. (1959) Incorporation of unnatural pyrimidine bases into deoxyribonucleic acid of mammalian cells. Science, 129, 1550-1.
EISEN, H. N. & SISKIND, G. W. (1964) Variations in Affinities of Antibodies during the Immune Response. Biochemistry, 3, 996-1008.
ELOWITZ, M. B., LEVINE, A. J., SIGGIA, E. D. & SWAIN, P. S. (2002) Stochastic gene expression in a single cell. Science, 297, 1183-6.
EMONET, T. & CLUZEL, P. (2008) Relationship between cellular response and behavioral variability in bacterial chemotaxis. Proc Natl Acad Sci U S A, 105, 3304-9.
EMONET, T., MACAL, C. M., NORTH, M. J., WICKERSHAM, C. E. & CLUZEL, P. (2005) AgentCell: a digital single-cell assay for bacterial chemotaxis. Bioinformatics, 21, 2714-21.
FAEDER, J. R., BLINOV, M. L. & HLAVACEK, W. S. (2009) Rule-based modeling of biochemical systems with BioNetGen. Methods Mol Biol, 500, 113-67.
FAURE, S., SALAZAR-FONTANA, L. I., SEMICHON, M., TYBULEWICZ, V. L., BISMUTH, G., TRAUTMANN, A., GERMAIN, R. N. & DELON, J. (2004) ERM proteins regulate cytoskeleton relaxation promoting T cell-APC conjugation. Nat Immunol, 5, 272-9.
FEINERMAN, O., GERMAIN, R. N. & ALTAN-BONNET, G. (2008a) Quantitative challenges in understanding ligand discrimination by αβ T cells. Molecular Immunology, 45, 619-631.
FEINERMAN, O., JENTSCH, G., SNEDDON, M., EMONET, T., K.A., S. & ALTAN-BONNET, G. (2010) Unpublished data.
FEINERMAN, O., VEIGA, J., DORFMAN, J. R., GERMAIN, R. N. & ALTAN-BONNET, G. (2008b) Variability and robustness in T cell activation from regulated heterogeneity in protein levels. Science, 321, 1081-4.
FLEIRE, S. J., GOLDMAN, J. P., CARRASCO, Y. R., WEBER, M., BRAY, D. & BATISTA, F. D. (2006) B cell ligand discrimination through a spreading and contraction response. Science, 312, 738-41.
FORSTER, I., VIEIRA, P. & RAJEWSKY, K. (1989) Flow cytometric analysis of cell proliferation dynamics in the B cell compartment of the mouse. Int Immunol, 1, 321-31.
FROESE, G. (1964) The Distribution and Interdependence of Generation Times of Hela Cells. Exp Cell Res, 35, 415-9.
GANUSOV, V. V., MILUTINOVIC, D. & DE BOER, R. J. (2007) IL-2 regulates expansion of CD4+ T cell populations by affecting cell death: insights from modeling CFSE data. J Immunol, 179, 950-7.
GANUSOV, V. V., PILYUGIN, S. S., BOER, R. J. D., MURALI-KRISHNA, K., AHMED, R. & ANTIA, R. (2005a) Quantifying cell turnover using CFSE data. Journal of Immunological Methods, 298, 183-200 %U
GANUSOV, V. V., PILYUGIN, S. S., BOER, R. J. D., MURALI-KRISHNA, K., AHMED, R. & ANTIA, R. (2005b) Quantifying cell turnover using CFSE data. Journal of Immunological Methods, 298, 183-200.
GERMAIN, R. N. (2001) The art of the probable: system control in the adaptive immune system. Science, 293, 240-5.
GETT, A. V. & HODGKIN, P. D. (2000) A cellular calculus for signal integration by T cells. Nature Immunology, 1, 239-244.
GRAKOUI, A., BROMLEY, S. K., SUMEN, C., DAVIS, M. M., SHAW, A. S., ALLEN, P. M. & DUSTIN, M. L. (1999) The immunological synapse: a molecular machine controlling T cell activation. Science, 285, 221-7.
GRATZNER, H. G. (1982) Monoclonal antibody to 5-bromo- and 5-iododeoxyuridine: A new reagent for detection of DNA replication. Science, 218, 474-5.
GROSSMAN, Z. & PAUL, W. E. (2001) Autoreactivity, dynamic tuning and selectivity. Current Opinion in Immunology, 13, 687-98.
GROSSMAN, Z. & SINGER, A. (1996) Tuning of activation thresholds explains flexibility in the selection and development of T cells in the thymus. Proceedings of the National Academy of Sciences of the United States of America, 93, 14747-52.
HALE, M. B., KRUTZIK, P. O., SAMRA, S. S., CRANE, J. M. & NOLAN, G. P. (2009) Stage dependent aberrant regulation of cytokine-STAT signaling in murine systemic lupus erythematosus. PLoS One, 4, e6756.
HAO, S. & AUGUST, A. (2005) Actin depolymerization transduces the strength of B-cell receptor stimulation. Mol Biol Cell, 16, 2275-84.
HATAYE, J., MOON, J. J., KHORUTS, A., REILLY, C. & JENKINS, M. K. (2006) Naive and memory CD4+ T cell survival controlled by clonal abundance. Science, 312, 114-6.
HAWKINS, E. D., MARKHAM, J. F., MCGUINNESS, L. P. & HODGKIN, P. D. (2009) A single-cell pedigree analysis of alternative stochastic lymphocyte fates. Proceedings of the National Academy of Sciences of the United States of America, 106, 13457-13462 %U http://www.ncbi.nlm.nih.gov/pubmed/19633185.
HAWKINS, E. D., TURNER, M. L., DOWLING, M. R., VAN GEND, C. & HODGKIN, P. D. (2007) A model of immune regulation as a consequence of randomized lymphocyte division and death times. Proceedings of the National Academy of Sciences of the United States of America, 104, 5032-5037 %U http://www.ncbi.nlm.nih.gov/pubmed/17360353.
HELLERSTEIN, M., HANLEY, M. B., CESAR, D., SILER, S., PAPAGEORGOPOULOS, C., WIEDER, E., SCHMIDT, D., HOH, R., NEESE, R., MACALLAN, D., DEEKS, S. & MCCUNE, J. M. (1999) Directly measured kinetics of circulating T lymphocytes in normal and HIV-1-infected humans. Nature Medicine, 5, 83-89.
HELLERSTEIN, M. K. (1999) Measurement of T-cell kinetics: recent methodologic advances. Immunology Today, 20, 438-441.
HELLERSTEIN, M. K. & NEESE, R. A. (1992) Mass Isotopomer Distribution Analysis - a Technique for Measuring Biosynthesis and Turnover of Polymers. American Journal of Physiology, 263, E988-E1001.
HLAVACEK, W. S., FAEDER, J. R., BLINOV, M. L., POSNER, R. G., HUCKA, M. & FONTANA, W. (2006) Rules for modeling signal-transduction systems. Sci STKE, 2006, re6.
HOFMEYR, S. A. & FORREST, S. (2000) Architecture for an artificial immune system. Evol Comput, 8, 443-73.
HOGQUIST, K. A., JAMESON, S. C., HEATH, W. R., HOWARD, J. L., BEVAN, M. J. & CARBONE, F. R. (1994) T cell receptor antagonist peptides induce positive selection. Cell, 76, 17-27.
HOGQUIST, K. A., TOMLINSON, A. J., KIEPER, W. C., MCGARGILL, M. A., HART, M. C., NAYLOR, S. & JAMESON, S. C. (1997) Identification of a naturally occurring ligand for thymic positive selection. Immunity, 6, 389-99.
HOPKINS, D. (2002) The greatest killer : smallpox in history, with a new introduction, Chicago, Chicago University Press.
HUGHES, W. L., BOND, V. P., BRECHER, G., CRONKITE, E. P., PAINTER, R. B., QUASTLER, H. & SHERMAN, F. G. (1958) Cellular Proliferation in the Mouse as Revealed by Autoradiography with Tritiated Thymidine. Proc Natl Acad Sci U S A, 44, 476-83.
HUPPA, J. B., AXMANN, M., MÖRTELMAIER, M. A., LILLEMEIER, B. F., NEWELL, E. W., BRAMESHUBER, M., KLEIN, L. O., SCHÜTZ, G. J. & DAVIS, M. M. (2010) TCR-peptide-MHC interactions in situ show accelerated kinetics and increased affinity. Nature, 463, 963-7.
HUSE, M., LILLEMEIER, B. F., KUHNS, M. S., CHEN, D. S. & DAVIS, M. M. (2006) T cells use two directionally distinct pathways for cytokine secretion. Nat Immunol, 7, 247-55.
IRISH, J. M., HOVLAND, R., KRUTZIK, P. O., PEREZ, O. D., BRUSERUD, O., GJERTSEN, B. T. & NOLAN, G. P. (2004a) Single cell profiling of potentiated phospho-protein networks in cancer cells. Cell, 118, 217-28.
IRISH, J. M., HOVLAND, R., KRUTZIK, P. O., PEREZ, O. D., BRUSERUD, Ø., GJERTSEN, B. T. & NOLAN, G. P. (2004b) Single Cell Profiling of Potentiated Phospho-Protein
Networks in Cancer Cells. Cell, 118, 217-228 %U http://www.cell.com/retrieve/pii/S0092867404006282.
IRVINE, D. J., PURBHOO, M. A., KROGSGAARD, M. & DAVIS, M. M. (2002) Direct observation of ligand recognition by T cells. Nature, 419, 845-9.
JAMESON, S. C., HOGQUIST, K. A. & BEVAN, M. J. (1995) Positive selection of thymocytes. Annu Rev Immunol, 13, 93-126.
JANEWAY, C. A., JR. (1989) Approaching the asymptote? Evolution and revolution in immunology. Cold Spring Harb Symp Quant Biol, 54 Pt 1, 1-13.
JANEWAY, C. A., JR. & MEDZHITOV, R. (2002) Innate immune recognition. Annu Rev Immunol, 20, 197-216.
KAERN, M., ELSTON, T. C., BLAKE, W. J. & COLLINS, J. J. (2005) Stochasticity in gene expression: from theories to phenotypes. Nat Rev Genet, 6, 451-64.
KERSH, E. N., SHAW, A. S. & ALLEN, P. M. (1998) Fidelity of T Cell Activation Through Multistep T Cell Receptor ${$zeta$}$? Phosphorylation. Science, 281, 572.
KOCH, A. L. (1980) Does the variability of the cell cycle result from one or many chance events? Nature, 286, 80-2.
KOCH, A. L. & SCHAECHTER, M. (1962) A model for statistics of the cell division process. J Gen Microbiol, 29, 435-54.
KOLLMANN, M., LOVDOK, L., BARTHOLOME, K., TIMMER, J. & SOURJIK, V. (2005) Design principles of a bacterial signalling network. Nature, 438, 504-7.
KOROBKOVA, E., EMONET, T., VILAR, J. M., SHIMIZU, T. S. & CLUZEL, P. (2004) From molecular noise to behavioural variability in a single bacterium. Nature, 428, 574-8.
KROGSGAARD, M., LI, Q. J., SUMEN, C., HUPPA, J. B., HUSE, M. & DAVIS, M. M. (2005) Agonist/endogenous peptide-MHC heterodimers drive T cell activation and sensitivity. Nature, 434, 238-43.
KROGSGAARD, M., PRADO, N., ADAMS, E. J., HE, X. L., CHOW, D. C., WILSON, D. B., GARCIA, K. C. & DAVIS, M. M. (2003) Evidence that structural rearrangements and/or flexibility during TCR binding can contribute to T cell activation. Molecular Cell, 12, 1367-78.
KUSSELL, E., KISHONY, R., BALABAN, N. Q. & LEIBLER, S. (2005) Bacterial persistence: a model of survival in changing environments. Genetics, 169, 1807-14.
KUSSELL, E. & LEIBLER, S. (2005) Phenotypic diversity, population growth, and information in fluctuating environments. Science, 309, 2075-8.
LANDAU, L., LIFCHITZ, E. & PITAYEVSKI, L. (1978) Physique statistique: théorie de l'état condensé, Moscow, Éditions Mir.
LANSBURY, P. T., JR. & CAUGHEY, B. (1995) The chemistry of scrapie infection: implications of the 'ice 9' metaphor. Chem Biol, 2, 1-5.
LEE, H. Y., HAWKINS, E., ZAND, M. S., MOSMANN, T., WU, H., HODGKIN, P. D. & PERELSON, A. S. (2009) Interpreting CFSE obtained division histories of B cells in vitro with Smith-Martin and cyton type models. Bull Math Biol, 71, 1649-70.
LEE, H. Y. & PERELSON, A. S. (2008) Modeling T cell proliferation and death in vitro based on labeling data: generalizations of the Smith-Martin cell cycle model. Bulletin of Mathematical Biology, 70, 21-44 %U http://www.ncbi.nlm.nih.gov/pubmed/17701260.
LEE, K. H., DINNER, A. R., TU, C., CAMPI, G., RAYCHAUDHURI, S., VARMA, R., SIMS, T. N., BURACK, W. R., WU, H., WANG, J., KANAGAWA, O., MARKIEWICZ, M., ALLEN, P. M., DUSTIN, M. L., CHAKRABORTY, A. K. & SHAW, A. S. (2003) The immunological synapse balances T cell receptor signaling and degradation.[see comment]. Science, 302, 1218-22.
LEE, S. J., HORI, Y., GROVES, J. T., DUSTIN, M. L. & CHAKRABORTY, A. K. (2002) Correlation of a dynamic model for immunological synapse formation with effector functions: two pathways to synapse formation. Trends Immunol, 23, 492-9.
LEON, K., FARO, J. & CARNEIRO, J. (2004) A general mathematical framework to model generation structure in a population of asynchronously dividing cells. J Theor Biol, 229, 455-76.
LI, Q. J., CHAU, J., EBERT, P. J., SYLVESTER, G., MIN, H., LIU, G., BRAICH, R., MANOHARAN, M., SOUTSCHEK, J., SKARE, P., KLEIN, L. O., DAVIS, M. M. & CHEN, C. Z. (2007) miR-181a is an intrinsic modulator of T cell sensitivity and selection. Cell, 129, 147-61.
LI, Q. J., DINNER, A. R., QI, S., IRVINE, D. J., HUPPA, J. B., DAVIS, M. M. & CHAKRABORTY, A. K. (2004) CD4 enhances T cell sensitivity to antigen by coordinating Lck accumulation at the immunological synapse.[see comment]. Nature Immunology, 5, 791-9.
LIPNIACKI, T., HAT, B., FAEDER, J. R. & HLAVACEK, W. S. (2008) Stochastic effects and bistability in T cell receptor signaling. J Theor Biol, 254, 110-22.
LOSICK, R. & DESPLAN, C. (2008) Stochasticity and cell fate. Science, 320, 65-8. LOVDOK, L., BENTELE, K., VLADIMIROV, N., MULLER, A., POP, F. S., LEBIEDZ, D.,
KOLLMANN, M. & SOURJIK, V. (2009) Role of translational coupling in robustness of bacterial chemotaxis pathway. PLoS Biol, 7, e1000171.
LOVDOK, L., KOLLMANN, M. & SOURJIK, V. (2007) Co-expression of signaling proteins improves robustness of the bacterial chemotaxis pathway. J Biotechnol, 129, 173-80.
LUCAS, B., STEFANOVA, I., YASUTOMO, K., DAUTIGNY, N. & GERMAIN, R. N. (1999) Divergent changes in the sensitivity of maturing T cells to structurally related ligands underlies formation of a useful T cell repertoire. Immunity, 10, 367-76.
LYONS, A. B. (2000) Analysing cell division in vivo and in vitro using flow cytometric measurement of CFSE dye dilution. Journal of Immunological Methods, 243, 147-154 %U http://www.sciencedirect.com/science?_ob=ArticleURL&_udi=B6T2Y-415R2T2-D&_user=10&_rdoc=1&_fmt=&_orig=search&_sort=d&_docanchor=&view=c&_searchStrId=1108723969&_rerunOrigin=scholar.google&_acct=C000050221&_version=1&_urlVersion=0&_userid=10&md5=71878a9e9539e4276c03b27f197a4878.
LYONS, A. B. & PARISH, C. R. (1994) Determination of lymphocyte division by flow cytometry. J Immunol Methods, 171, 131-7.
MACALLAN, D. C., FULLERTON, C. A., NEESE, R. A., HADDOCK, K., PARK, S. S. & HELLERSTEIN, M. K. (1998) Measurement of cell proliferation by labeling of DNA with stable isotope-labeled glucose: Studies in vitro, in animals, and in humans. Proceedings of the National Academy of Sciences of the United States of America, 95, 708-713.
MADRENAS, J., CHAU, L. A., SMITH, J., BLUESTONE, J. A. & GERMAIN, R. N. (1997) The efficiency of CD4 recruitment to ligand-engaged TCR controls the agonist/partial agonist properties of peptide-MHC molecule ligands. Journal of Experimental Medicine, 185, 219-29.
MARIN, G. & BENDER, M. A. (1966) Radiation-induced mammalian cell death: lapse-time cinemicrographic observations. Exp Cell Res, 43, 413-23.
MATZINGER, P. (2007) Friendly and dangerous signals: is the tissue in control? Nat Immunol, 8, 11-3.
MAY, R. M. (2004) Uses and abuses of mathematics in biology. Science, 303, 790-3. MCKEITHAN, T. W. (1995) Kinetic proofreading in T-cell receptor signal transduction. Proceedings
of the National Academy of Sciences, 92, 5042. MEDZHITOV, R. (2009) Approaching the asymptote: 20 years later. Immunity, 30, 766-75.
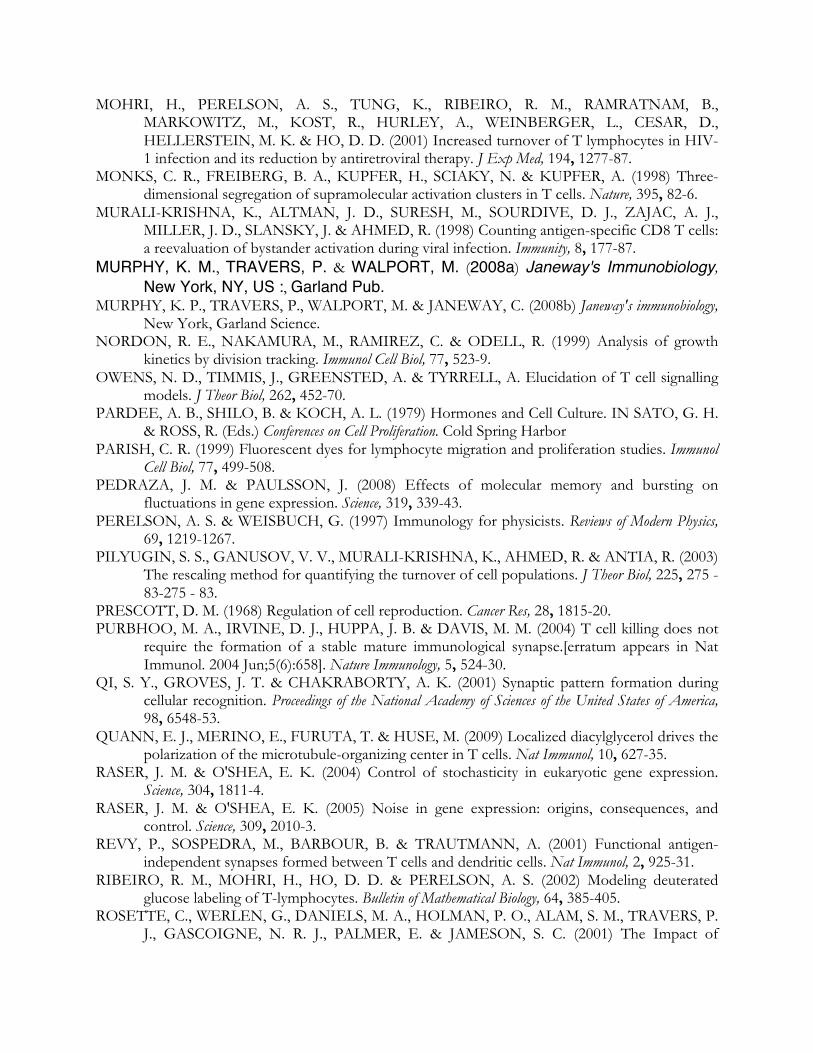
MOHRI, H., PERELSON, A. S., TUNG, K., RIBEIRO, R. M., RAMRATNAM, B., MARKOWITZ, M., KOST, R., HURLEY, A., WEINBERGER, L., CESAR, D., HELLERSTEIN, M. K. & HO, D. D. (2001) Increased turnover of T lymphocytes in HIV-1 infection and its reduction by antiretroviral therapy. J Exp Med, 194, 1277-87.
MONKS, C. R., FREIBERG, B. A., KUPFER, H., SCIAKY, N. & KUPFER, A. (1998) Three-dimensional segregation of supramolecular activation clusters in T cells. Nature, 395, 82-6.
MURALI-KRISHNA, K., ALTMAN, J. D., SURESH, M., SOURDIVE, D. J., ZAJAC, A. J., MILLER, J. D., SLANSKY, J. & AHMED, R. (1998) Counting antigen-specific CD8 T cells: a reevaluation of bystander activation during viral infection. Immunity, 8, 177-87.
MURPHY, K. M., TRAVERS, P. & WALPORT, M. (2008a) Janeway's Immunobiology, New York, NY, US :, Garland Pub.
MURPHY, K. P., TRAVERS, P., WALPORT, M. & JANEWAY, C. (2008b) Janeway's immunobiology, New York, Garland Science.
NORDON, R. E., NAKAMURA, M., RAMIREZ, C. & ODELL, R. (1999) Analysis of growth kinetics by division tracking. Immunol Cell Biol, 77, 523-9.
OWENS, N. D., TIMMIS, J., GREENSTED, A. & TYRRELL, A. Elucidation of T cell signalling models. J Theor Biol, 262, 452-70.
PARDEE, A. B., SHILO, B. & KOCH, A. L. (1979) Hormones and Cell Culture. IN SATO, G. H. & ROSS, R. (Eds.) Conferences on Cell Proliferation. Cold Spring Harbor
PARISH, C. R. (1999) Fluorescent dyes for lymphocyte migration and proliferation studies. Immunol Cell Biol, 77, 499-508.
PEDRAZA, J. M. & PAULSSON, J. (2008) Effects of molecular memory and bursting on fluctuations in gene expression. Science, 319, 339-43.
PERELSON, A. S. & WEISBUCH, G. (1997) Immunology for physicists. Reviews of Modern Physics, 69, 1219-1267.
PILYUGIN, S. S., GANUSOV, V. V., MURALI-KRISHNA, K., AHMED, R. & ANTIA, R. (2003) The rescaling method for quantifying the turnover of cell populations. J Theor Biol, 225, 275 - 83-275 - 83.
PRESCOTT, D. M. (1968) Regulation of cell reproduction. Cancer Res, 28, 1815-20. PURBHOO, M. A., IRVINE, D. J., HUPPA, J. B. & DAVIS, M. M. (2004) T cell killing does not
require the formation of a stable mature immunological synapse.[erratum appears in Nat Immunol. 2004 Jun;5(6):658]. Nature Immunology, 5, 524-30.
QI, S. Y., GROVES, J. T. & CHAKRABORTY, A. K. (2001) Synaptic pattern formation during cellular recognition. Proceedings of the National Academy of Sciences of the United States of America, 98, 6548-53.
QUANN, E. J., MERINO, E., FURUTA, T. & HUSE, M. (2009) Localized diacylglycerol drives the polarization of the microtubule-organizing center in T cells. Nat Immunol, 10, 627-35.
RASER, J. M. & O'SHEA, E. K. (2004) Control of stochasticity in eukaryotic gene expression. Science, 304, 1811-4.
RASER, J. M. & O'SHEA, E. K. (2005) Noise in gene expression: origins, consequences, and control. Science, 309, 2010-3.
REVY, P., SOSPEDRA, M., BARBOUR, B. & TRAUTMANN, A. (2001) Functional antigen-independent synapses formed between T cells and dendritic cells. Nat Immunol, 2, 925-31.
RIBEIRO, R. M., MOHRI, H., HO, D. D. & PERELSON, A. S. (2002) Modeling deuterated glucose labeling of T-lymphocytes. Bulletin of Mathematical Biology, 64, 385-405.
ROSETTE, C., WERLEN, G., DANIELS, M. A., HOLMAN, P. O., ALAM, S. M., TRAVERS, P. J., GASCOIGNE, N. R. J., PALMER, E. & JAMESON, S. C. (2001) The Impact of
Duration versus Extent of TCR Occupancy on T Cell Activation A Revision of the Kinetic Proofreading Model. Immunity, 15, 59–70.
SAKAGUCHI, S. (2004) Naturally arising CD4+ regulatory t cells for immunologic self-tolerance and negative control of immune responses. Annu Rev Immunol, 22, 531-62.
SANTOS, S. D., VERVEER, P. J. & BASTIAENS, P. I. (2007) Growth factor-induced MAPK network topology shapes Erk response determining PC-12 cell fate. Nat Cell Biol, 9, 324-30.
SASAGAWA, S., OZAKI, Y., FUJITA, K. & KURODA, S. (2005) Prediction and validation of the distinct dynamics of transient and sustained ERK activation. Nat Cell Biol, 7, 365-73.
SAVAGE, P. A., BONIFACE, J. J. & DAVIS, M. M. (1999) A kinetic basis for T cell receptor repertoire selection during an immune response. Immunity, 10, 485-92.
SAVAGE, P. A. & DAVIS, M. M. (2001) A kinetic window constricts the T cell receptor repertoire in the thymus. Immunity, 14, 243-52.
SCHLUB, T. E., VENTURI, V., KEDZIERSKA, K., WELLARD, C., DOHERTY, P. C., TURNER, S. J., RIBEIRO, R. M., HODGKIN, P. D. & DAVENPORT, M. P. (2009) Division-linked differentiation can account for CD8+ T-cell phenotype in vivo. Eur J Immunol, 39, 67-77.
SCHWARTZ, R. H. (1996) Models of T cell anergy: is there a common molecular mechanism? J Exp Med, 184, 1-8.
SEMINARIO, M. C. & BUNNELL, S. C. (2008) Signal initiation in T-cell receptor microclusters. Immunol Rev, 221, 90-106.
SHILO, B., RIDDLE, V. G. & PARDEE, A. B. (1979) Protein turnover and cell-cycle initiation in yeast. Exp Cell Res, 123, 221-7.
SIGAL, A., MILO, R., COHEN, A., GEVA-ZATORSKY, N., KLEIN, Y., LIRON, Y., ROSENFELD, N., DANON, T., PERZOV, N. & ALON, U. (2006) Variability and memory of protein levels in human cells. Nature, 444, 643-6.
SILVERSTEIN, A. M. (2001) A History of Immunology, Academic Press. SINGH, N. J., CHEN, C. & SCHWARTZ, R. H. (2006) The impact of T cell intrinsic antigen
adaptation on peripheral immune tolerance. PLoS Biol, 4, e340. SINGH, N. J. & SCHWARTZ, R. H. (2006) Primer: mechanisms of immunologic tolerance. Nat
Clin Pract Rheumatol, 2, 44-52. SMITH, J. A. & MARTIN, L. (1973) Do cells cycle? Proc Natl Acad Sci U S A, 70, 1263-7. SNEDDON, M. W., FAEDER, J. R. & EMONET, T. (2010) Efficient modeling, simulation and
coarse-graining of complex biochemical pathways with NFsim. . (submitted), http://emonet.biology.yale.edu/nfsim.
SPENCER, S. L., GAUDET, S., ALBECK, J. G., BURKE, J. M. & SORGER, P. K. (2009) Non-genetic origins of cell-to-cell variability in TRAIL-induced apoptosis. Nature, 459, 428-32.
SPUDICH, J. L. & KOSHLAND, D. E., JR. (1976) Non-genetic individuality: chance in the single cell. Nature, 262, 467-71.
STARR, T. K., JAMESON, S. C. & HOGQUIST, K. A. (2003) Positive and negative selection of T cells. Annu Rev Immunol, 21, 139-76.
STEFANOVA, I., HEMMER, B., VERGELLI, M., MARTIN, R., BIDDISON, W. E. & GERMAIN, R. N. (2003) TCR ligand discrimination is enforced by competing ERK positive and SHP-1 negative feedback pathways.[see comment]. Nature Immunology, 4, 248-54.
SUBRAMANIAN, V. G., DUFFY, K. R., TURNER, M. L. & HODGKIN, P. D. (2008) Determining the expected variability of immune responses using the cyton model. J Math Biol, 56, 861-92.
SUEL, G. M., KULKARNI, R. P., DWORKIN, J., GARCIA-OJALVO, J. & ELOWITZ, M. B. (2007) Tunability and noise dependence in differentiation dynamics. Science, 315, 1716-9.
SYKULEV, Y., JOO, M., VTURINA, I., TSOMIDES, T. J. & EISEN, H. N. (1996) Evidence that a single peptide-MHC complex on a target cell can elicit a cytolytic T cell response. Immunity, 4, 565-71.
TARANTOLA, A. (2005) Inverse problem theory and methods for model parameter estimation, Philadelphia, PA, Society for Industrial and Applied Mathematics.
TARANTOLA, A. (2006) Popper, Bayes and the inverse problem. Nature Physics, 2, 492-494. TEH, H. S., MOTYKA, B. & TEH, S. J. (1997) Influence of the affinity of selecting ligands on T
cell positive and negative selection and the functional maturity of the positively selected T cells. Crit Rev Immunol, 17, 399-410.
TEH, H. S., MOTYKA, B. & TEH, S. J. (1998) Positive selection of thymocytes expressing the same TCR by different MHC ligands results in the production of functionally distinct thymocytes distinguished by differential expression of the heat stable antigen. J Immunol, 160, 718-27.
TENG, G. & PAPAVASILIOU, F. N. (2007) Immunoglobulin somatic hypermutation. Annu Rev Genet, 41, 107-20.
THIEL, A., SCHEFFOLD, A. & RADBRUCH, A. (2004) Antigen-specific cytometry--new tools arrived! Clin Immunol, 111, 155-61.
VALITUTTI, S., DESSING, M., AKTORIES, K., GALLATI, H. & LANZAVECCHIA, A. (1995) Sustained signaling leading to T cell activation results from prolonged T cell receptor occupancy. Role of T cell actin cytoskeleton. J Exp Med, 181, 577-84.
VEIGA-FERNANDES, H., WALTER, U., BOURGEOIS, C., MCLEAN, A. & ROCHA, B. (2000) Response of naive and memory CD8+ T cells to antigen stimulation in vivo. Nat Immunol, 1, 47 - 53-47 - 53.
WERLEN, G. & PALMER, E. (2002) The T-cell receptor signalosome: a dynamic structure with expanding complexity. Current Opinion in Immunology, 14, 299-305.
WESTON, S. A. & PARISH, C. R. (1990) New fluorescent dyes for lymphocyte migration studies. Analysis by flow cytometry and fluorescence microscopy. J Immunol Methods, 133, 87-97.
WONG, P., BARTON, G. M., FORBUSH, K. A. & RUDENSKY, A. Y. (2001) Dynamic tuning of T cell reactivity by self-peptide-major histocompatibility complex ligands. J Exp Med, 193, 1179-87.
YASUTOMO, K., LUCAS, B. & GERMAIN, R. N. (2000) TCR signaling for initiation and completion of thymocyte positive selection has distinct requirements for ligand quality and presenting cell type. J Immunol, 165, 3015-22.
YATES, A., CHAN, C., STRID, J., MOON, S., CALLARD, R., GEORGE, A. J. & STARK, J. (2007) Reconstruction of cell population dynamics using CFSE. BMC Bioinformatics, 8, 196.
YATES, A., SAINI, M., MATHIOT, A. & SEDDON, B. (2008) Mathematical modeling reveals the biological program regulating lymphopenia-induced proliferation. J Immunol, 180, 1414-22.
YI, T. M., HUANG, Y., SIMON, M. I. & DOYLE, J. (2000) Robust perfect adaptation in bacterial chemotaxis through integral feedback control. Proc Natl Acad Sci U S A, 97, 4649-53.
ZINKERNAGEL, R. M., BACHMANN, M. F., KUNDIG, T. M., OEHEN, S., PIRCHET, H. & HENGARTNER, H. (1996) On immunological memory. Annu Rev Immunol, 14, 333-67.

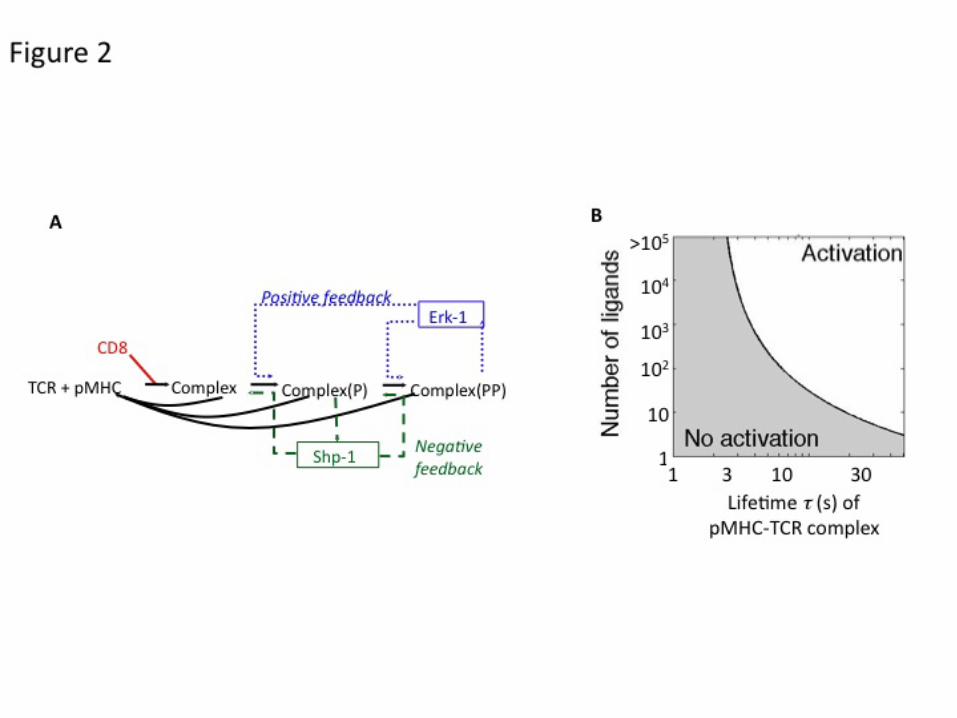
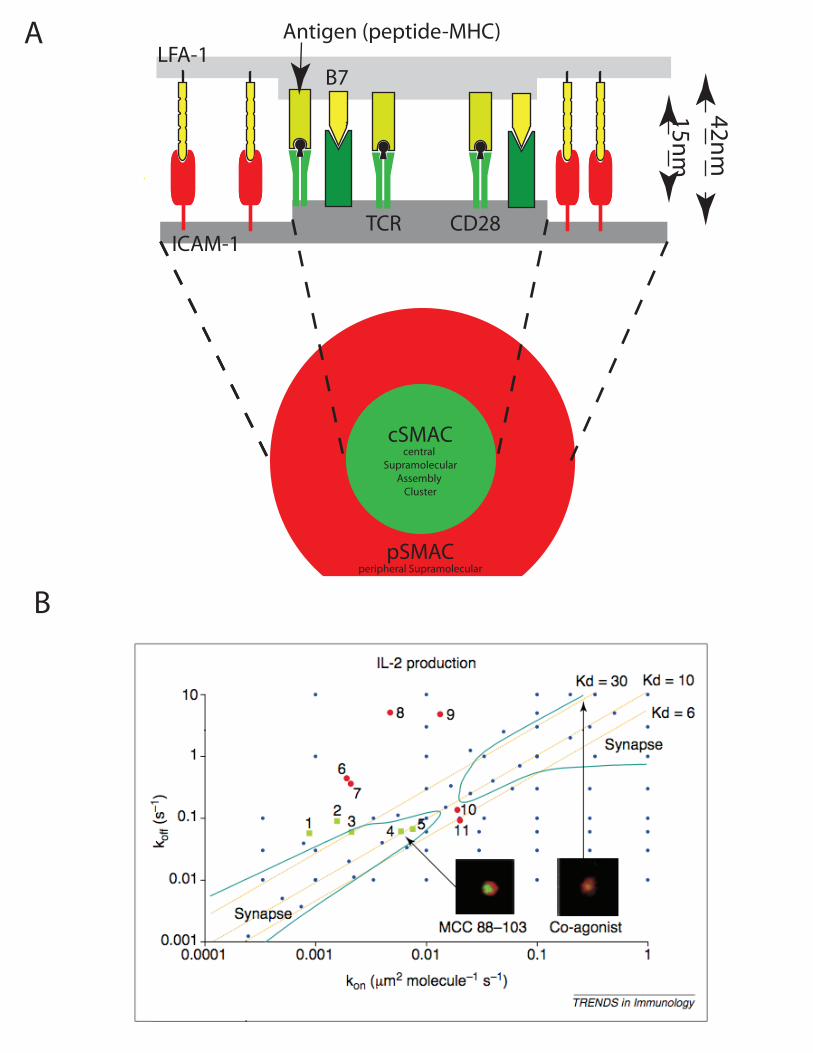
Antigen (peptide-MHC)
B7
cSMACcentral
SupramolecularAssembly
Cluster
pSMACperipheral Supramolecular
Assembly Cluster
LFA-1
TCR CD28ICAM-1
15nm
42nm
A
B
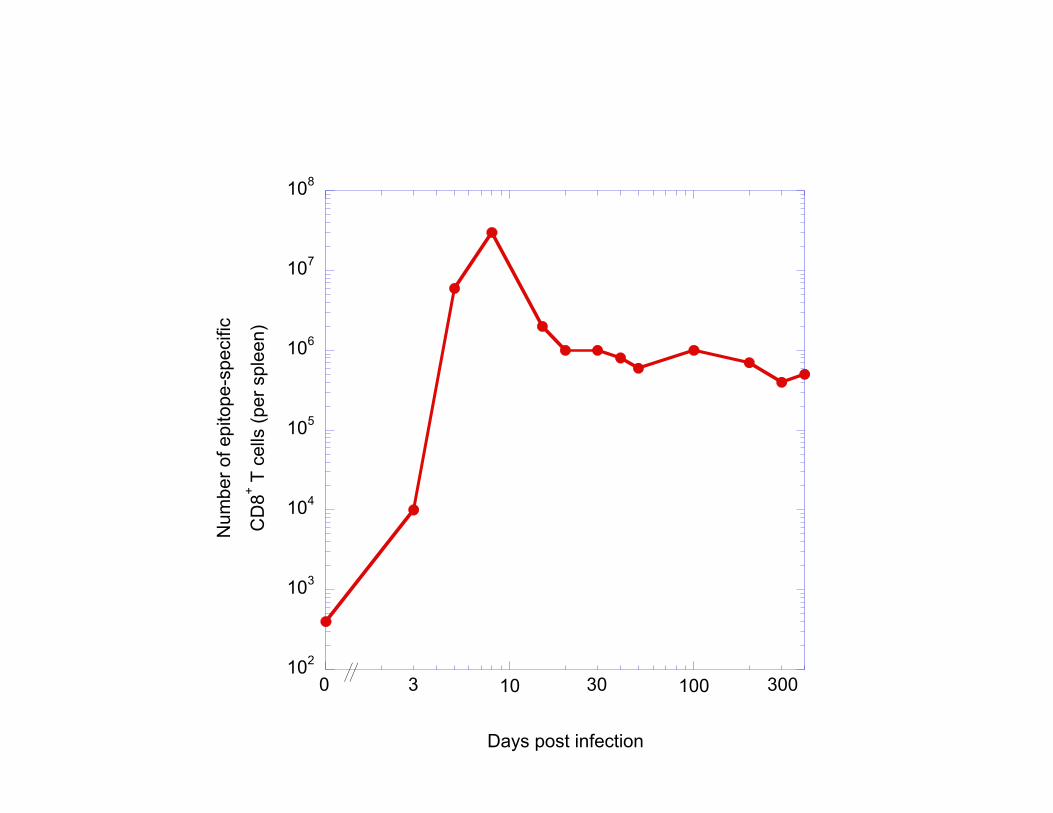
102
103
104
105
106
107
108
10 100
Num
ber o
f epi
tope
-spe
cific
CD
8+ T c
ells
(per
spl
een)
Days post infection
0 3 30 300
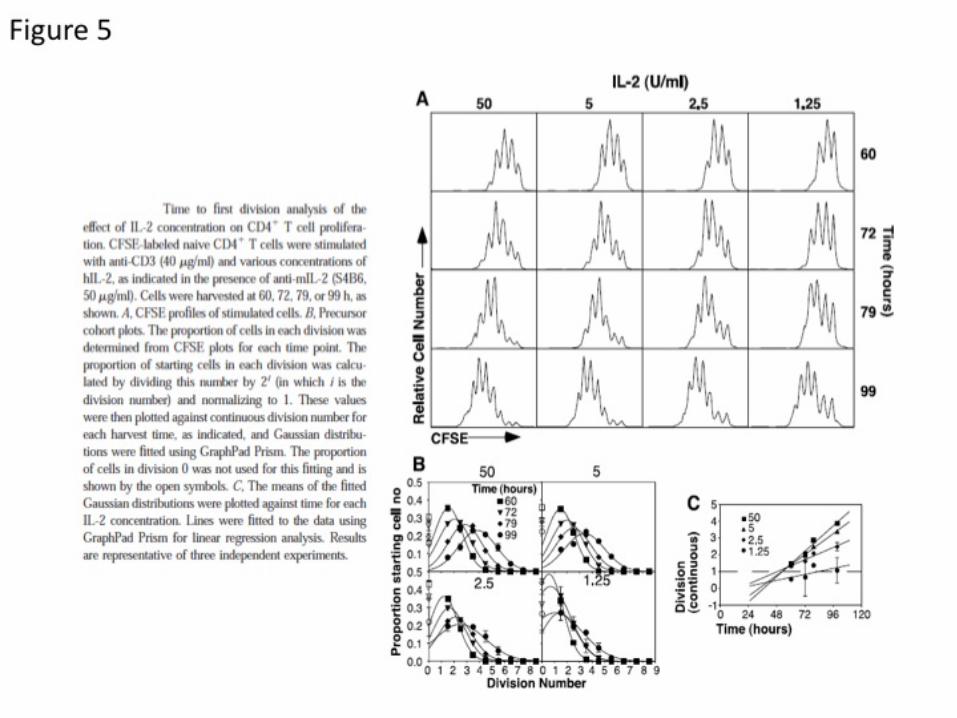


![(20100401)Stryker Spin Boldak Report Min[1]](https://img.pdfslide.us/doc/110x75/577d38691a28ab3a6b97c90a/20100401stryker-spin-boldak-report-min1.jpg)