Embed Size (px)
Citation preview

2006 Elections: Maryland and Anne Arundel County
By Dan Nataf, Ph.D.Director, Center for the Study of Local Issues
Anne Arundel Community Collegewww2.aacc.edu/csli
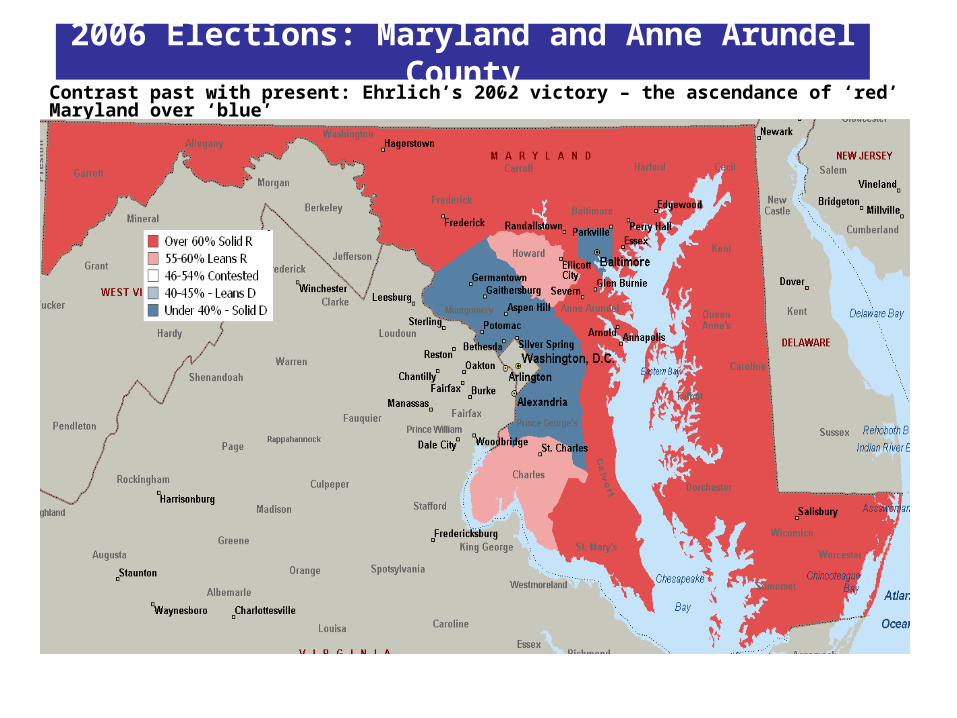
Contrast past with present: Ehrlich’s 2002 victory – the ascendance of ‘red’ Maryland over ‘blue’
2006 Elections: Maryland and Anne Arundel County
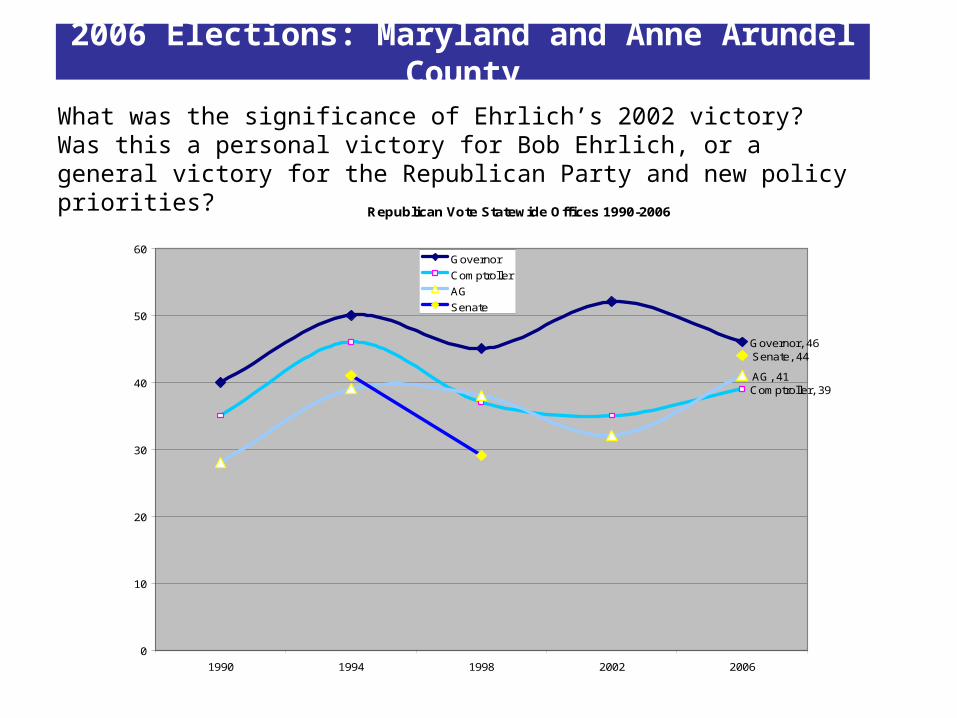
What was the significance of Ehrlich’s 2002 victory? Was this a personal victory for Bob Ehrlich, or a general victory for the Republican Party and new policy priorities?
Republican Vote Statewide Offices 1990-2006
Governor, 46
Comptroller, 39AG, 41
Senate, 44
0
10
20
30
40
50
60
1990 1994 1998 2002 2006
Governor
Comptroller
AG
Senate
2006 Elections: Maryland and Anne Arundel County
2006 Elections: Maryland and Anne Arundel County
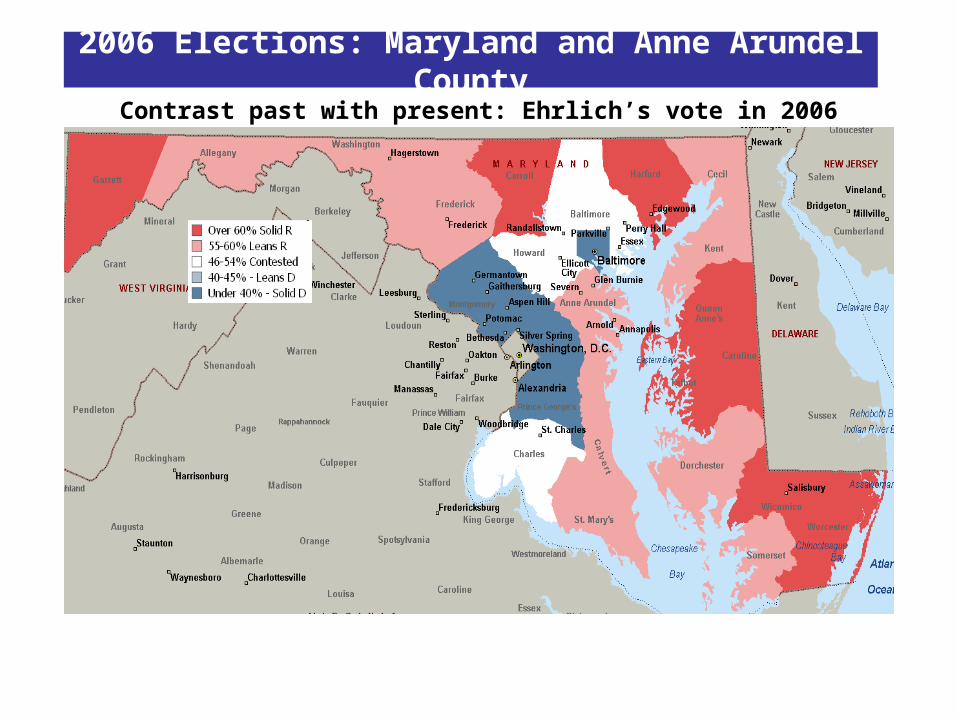
Contrast past with present: Ehrlich’s vote in 2006
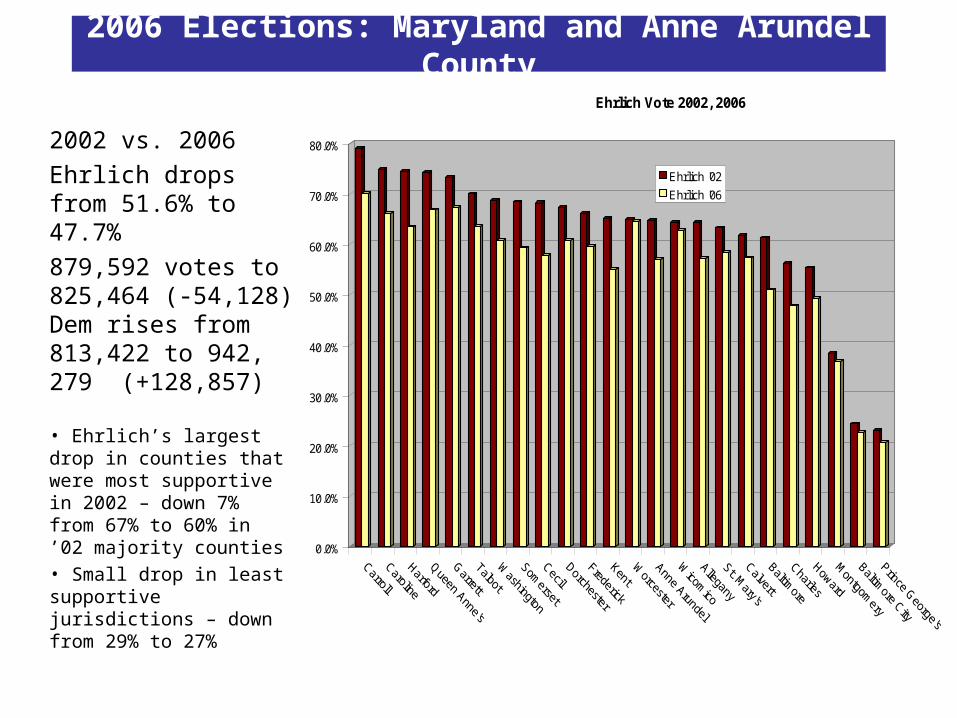
2002 vs. 2006
Ehrlich drops from 51.6% to 47.7%
879,592 votes to 825,464 (-54,128)Dem rises from 813,422 to 942, 279 (+128,857)
• Ehrlich’s largest drop in counties that were most supportive in 2002 – down 7% from 67% to 60% in ’02 majority counties• Small drop in least supportive jurisdictions – down from 29% to 27%
0.0%
10.0%
20.0%
30.0%
40.0%
50.0%
60.0%
70.0%
80.0%
Ehrlich Vote 2002, 2006
Ehrlich '02
Ehrlich '06
2006 Elections: Maryland and Anne Arundel County
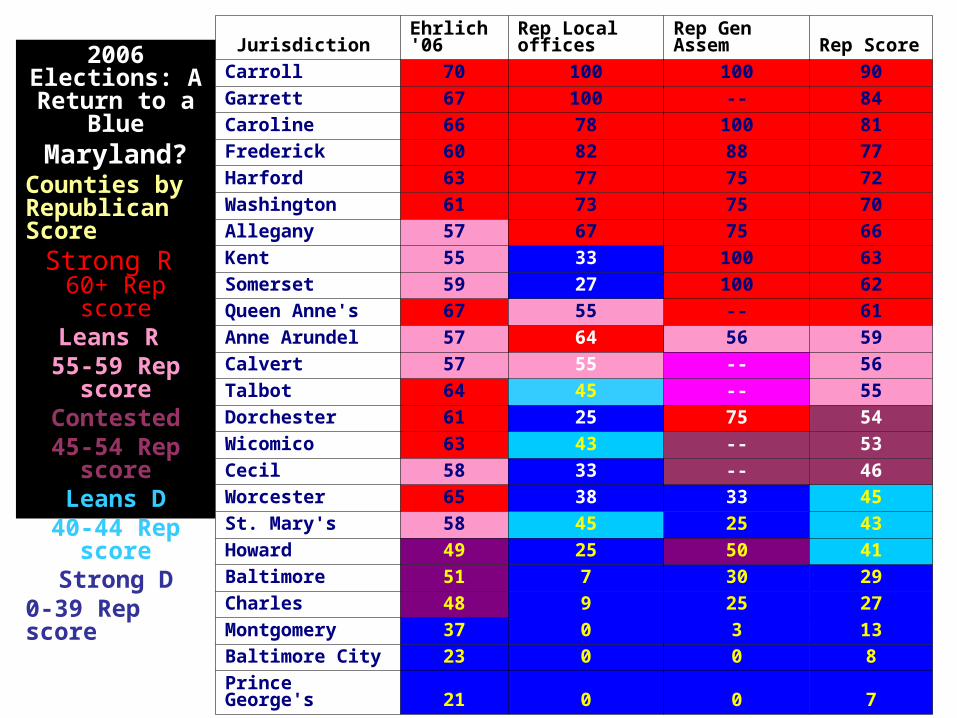
2006 Elections: A Return to a
BlueMaryland?
Counties by Republican Score
Strong R 60+ Rep score
Leans R 55-59 Rep
scoreContested45-54 Rep
scoreLeans D
40-44 Rep score
Strong D0-39 Rep score
JurisdictionEhrlich '06
Rep Local offices
Rep Gen Assem Rep Score
Carroll 70 100 100 90
Garrett 67 100 -- 84
Caroline 66 78 100 81
Frederick 60 82 88 77
Harford 63 77 75 72
Washington 61 73 75 70
Allegany 57 67 75 66
Kent 55 33 100 63
Somerset 59 27 100 62
Queen Anne's 67 55 -- 61
Anne Arundel 57 64 56 59
Calvert 57 55 -- 56
Talbot 64 45 -- 55
Dorchester 61 25 75 54
Wicomico 63 43 -- 53
Cecil 58 33 -- 46
Worcester 65 38 33 45
St. Mary's 58 45 25 43
Howard 49 25 50 41
Baltimore 51 7 30 29
Charles 48 9 25 27
Montgomery 37 0 3 13
Baltimore City 23 0 0 8
Prince George's 21 0 0 7
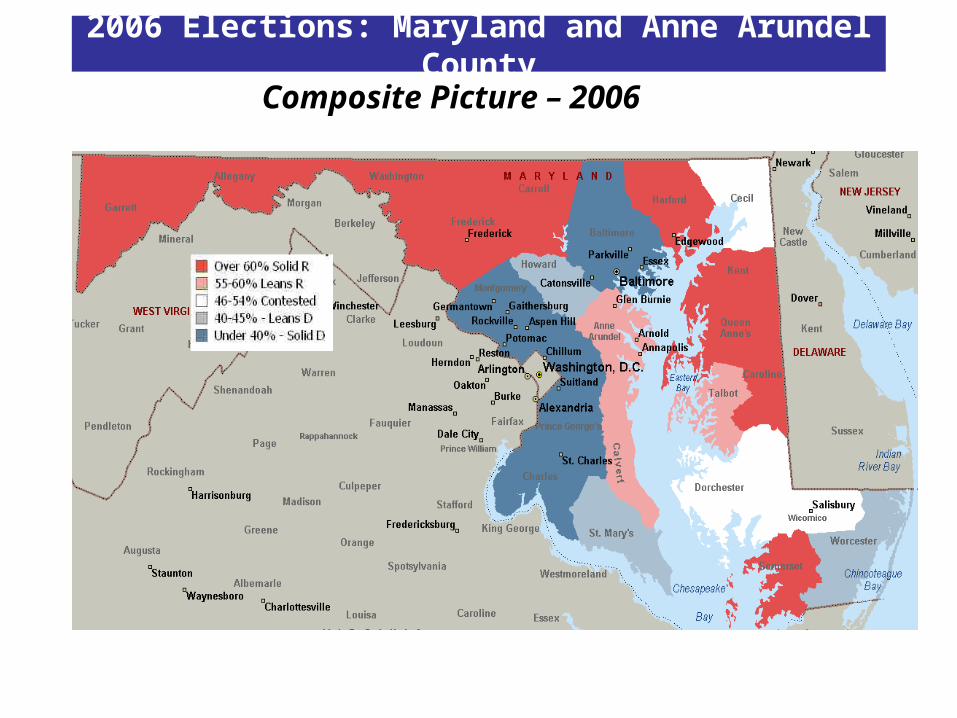
Composite Picture – 2006
2006 Elections: Maryland and Anne Arundel County
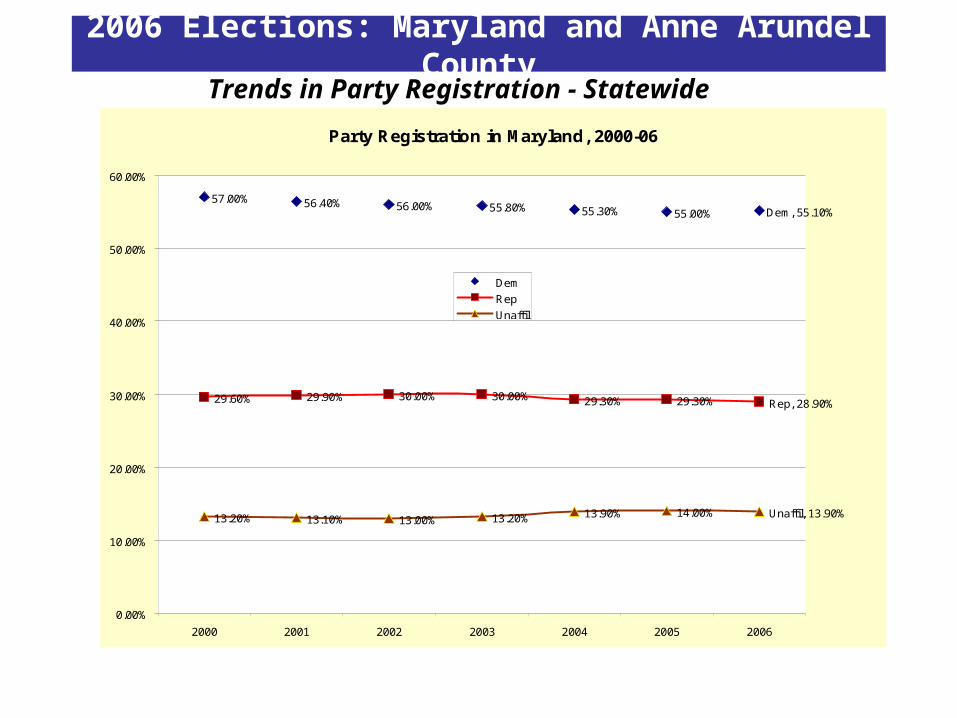
Party Registration in Maryland, 2000-06
57.00% 56.40% 56.00% 55.80% 55.30% 55.00%
29.60% 29.90% 30.00% 30.00% 29.30% 29.30%
13.20% 13.10% 13.00% 13.20% 13.90% 14.00%
Dem, 55.10%
Rep, 28.90%
Unaffil, 13.90%
0.00%
10.00%
20.00%
30.00%
40.00%
50.00%
60.00%
2000 2001 2002 2003 2004 2005 2006
Dem
Rep
Unaffil
Trends in Party Registration - Statewide
2006 Elections: Maryland and Anne Arundel County
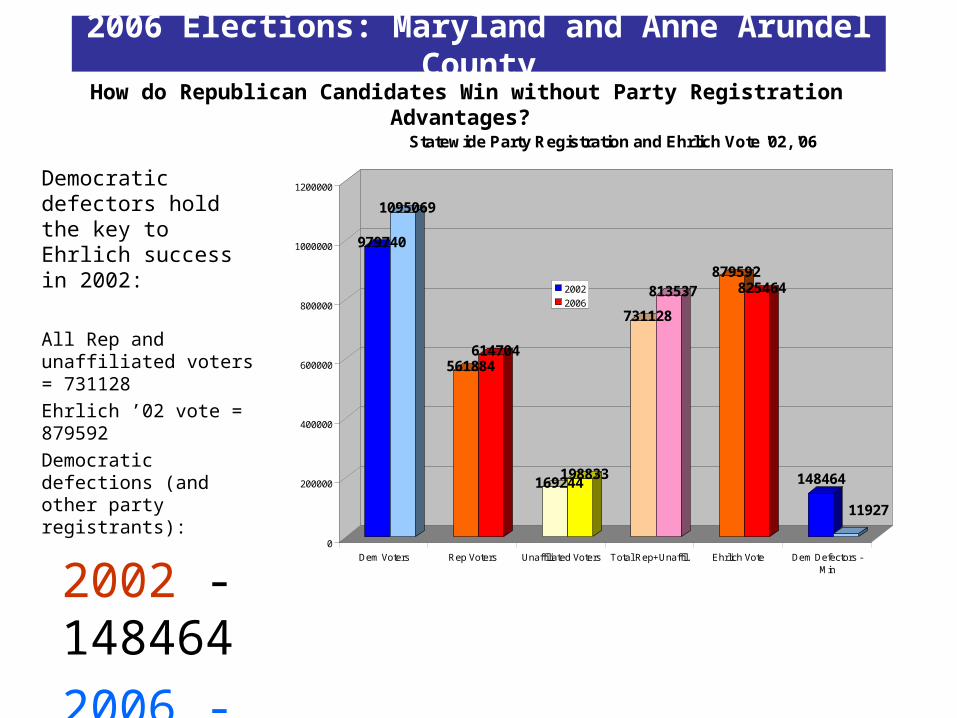
How do Republican Candidates Win without Party Registration Advantages?
Democratic defectors hold the key to Ehrlich success in 2002:
All Rep and unaffiliated voters = 731128
Ehrlich ’02 vote = 879592
Democratic defections (and other party registrants):
2002 -148464
2006 - 11927
979740
1095069
561884614704
169244198833
731128
813537879592
825464
148464
11927
0
200000
400000
600000
800000
1000000
1200000
Dem Voters Rep Voters Unaffiliated Voters Total Rep+Unaffil. Ehrlich Vote Dem Defectors -Min
Statewide Party Registration and Ehrlich Vote '02, '06
2002
2006
2006 Elections: Maryland and Anne Arundel County

2006 Elections: Maryland and Anne Arundel County
Anne Arundel Only Results
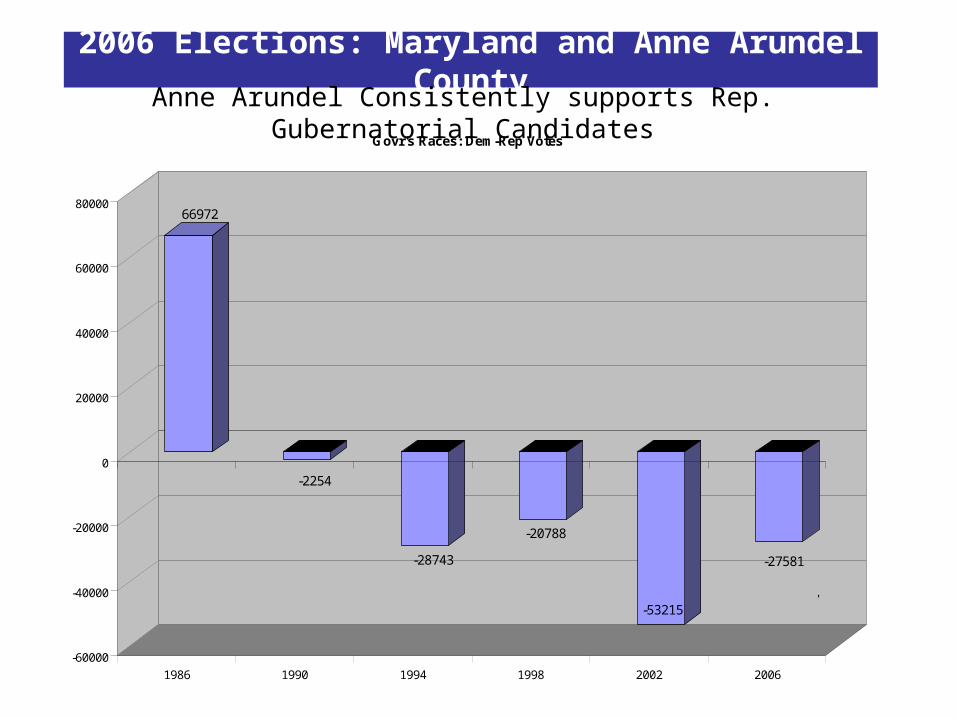
66972
-2254
-28743
-20788
-53215
-27581
-60000
-40000
-20000
0
20000
40000
60000
80000
1986 1990 1994 1998 2002 2006
Govr's Races: Dem-Rep Votes
Schaeffer vs. Mooney83%, 17%
Schaeffer vs. Shepard, 49%, 51%
Glendening vs. Sauerbrey, 40%, 60%
Glendening vs. Sauerbrey, 43%, 57%
Townsend vs Ehrlich, 35%, 65% O'Malley vs.
Ehrlich, 42%, 57%
2006 Elections: Maryland and Anne Arundel County
Anne Arundel Consistently supports Rep. Gubernatorial Candidates
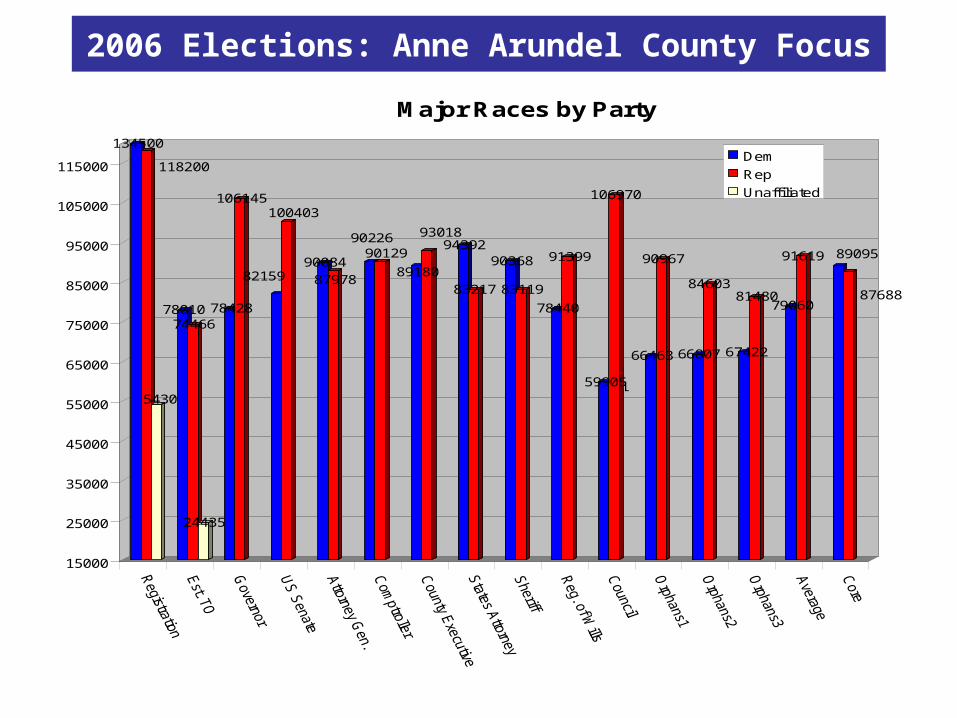
2006 Elections: Anne Arundel County Focus
134500
118200
54300
7801074466
24435
78428
106145
82159
100403
9008487978
9022690129
89180
9301894392
83217
90368
83119
78440
91399
59905
106970
66463
90967
66807
84603
67422
8148079060
91619 89095
87688
15000
25000
35000
45000
55000
65000
75000
85000
95000
105000
115000
Major Races by Party
Dem
Rep
Unaffiliated
Anne Arundel
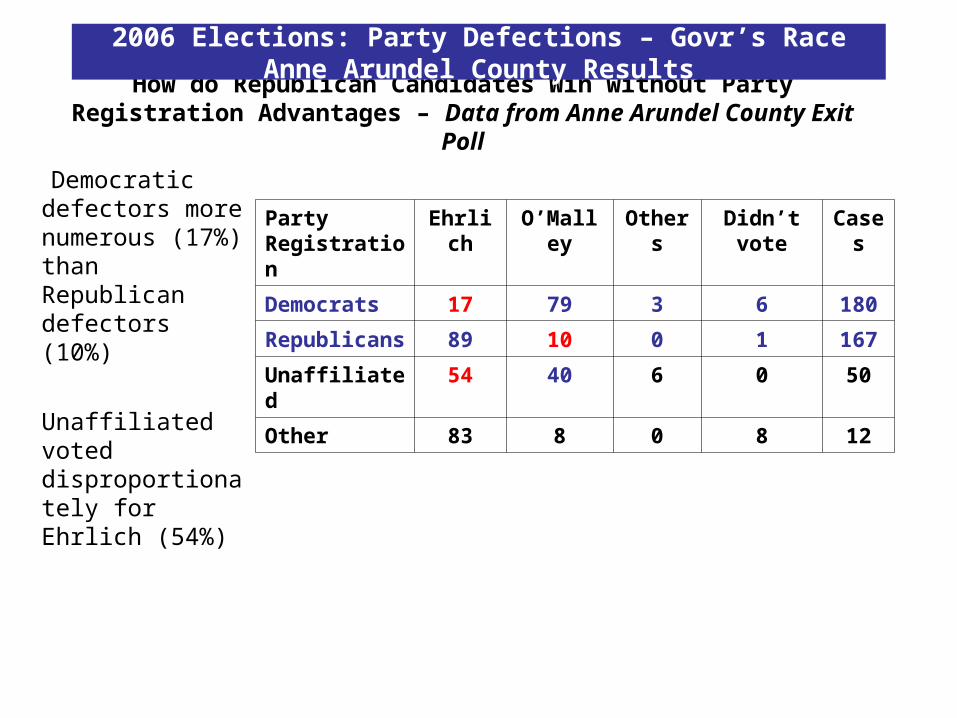
How do Republican Candidates Win without Party Registration Advantages – Data from Anne Arundel County Exit Poll
Democratic defectors more numerous (17%) than Republican defectors (10%)
Unaffiliated voted disproportionately for Ehrlich (54%)
Party Registration
Ehrlich O’Malley Others Didn’t vote
Cases
Democrats 17 79 3 6 180
Republicans 89 10 0 1 167
Unaffiliated 54 40 6 0 50
Other 83 8 0 8 12
2006 Elections: Party Defections – Govr’s Race Anne Arundel County Results
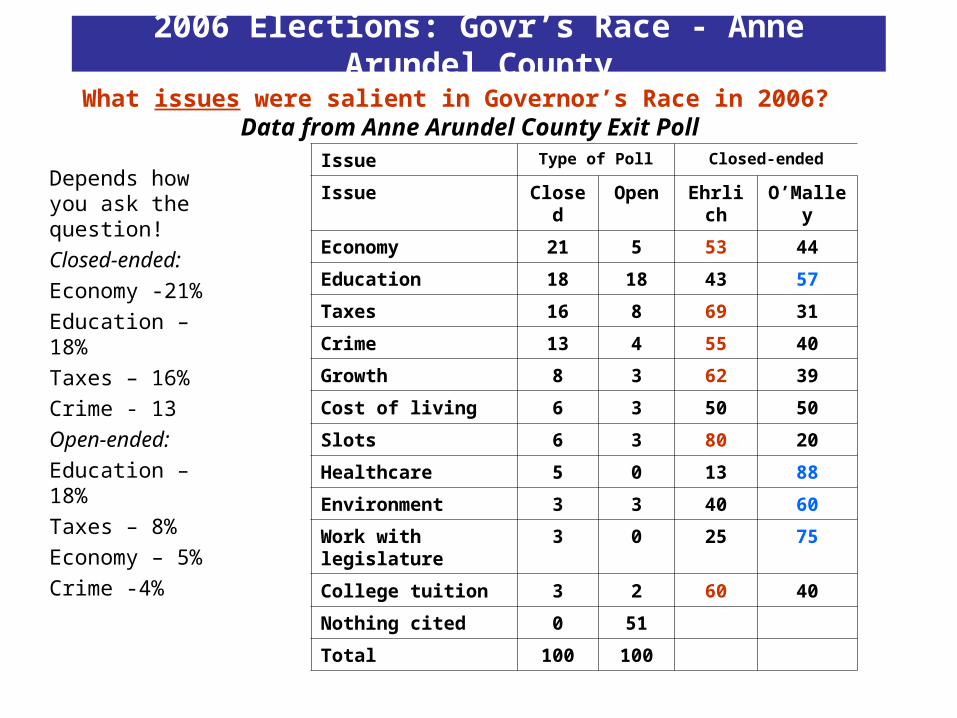
What issues were salient in Governor’s Race in 2006? Data from Anne Arundel County Exit Poll
Depends how you ask the question!
Closed-ended:
Economy -21%
Education – 18%
Taxes – 16%
Crime - 13
Open-ended:
Education – 18%
Taxes – 8%
Economy – 5%
Crime -4%
Issue Type of Poll Closed-ended
Issue Closed Open Ehrlich O’Malley
Economy 21 5 53 44
Education 18 18 43 57
Taxes 16 8 69 31
Crime 13 4 55 40
Growth 8 3 62 39
Cost of living 6 3 50 50
Slots 6 3 80 20
Healthcare 5 0 13 88
Environment 3 3 40 60
Work with legislature
3 0 25 75
College tuition 3 2 60 40
Nothing cited 0 51
Total 100 100
2006 Elections: Govr’s Race - Anne Arundel County
Type of Survey Closed-ended
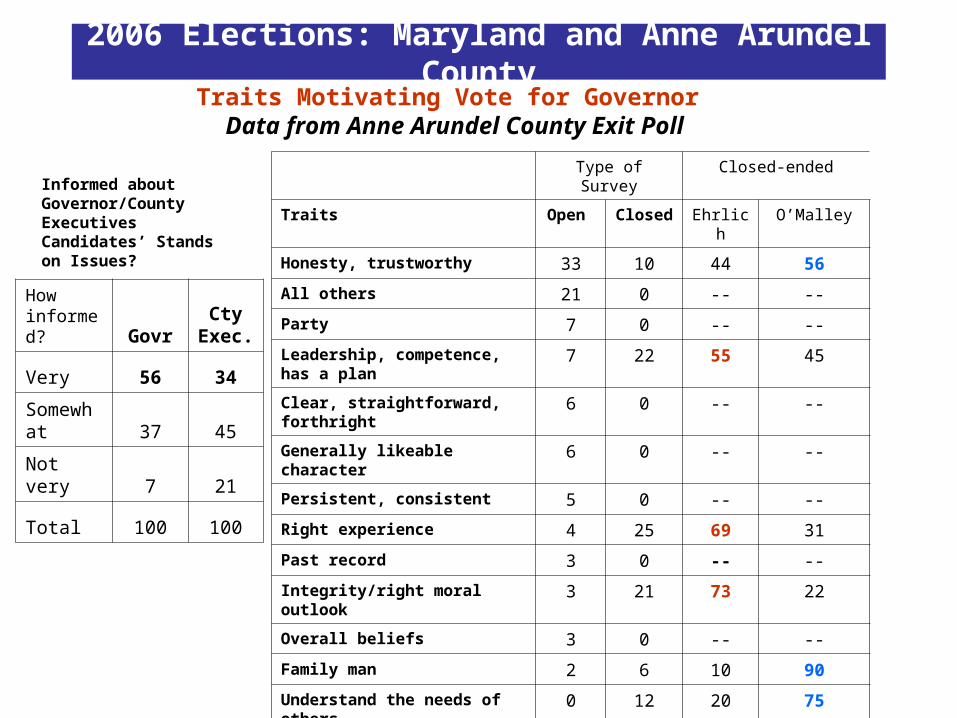
Traits Open Closed Ehrlich O’Malley
Honesty, trustworthy 33 10 44 56
All others 21 0 -- --
Party 7 0 -- --
Leadership, competence, has a plan 7 22 55 45
Clear, straightforward, forthright 6 0 -- --
Generally likeable character 6 0 -- --
Persistent, consistent 5 0 -- --
Right experience 4 25 69 31
Past record 3 0 -- --
Integrity/right moral outlook 3 21 73 22
Overall beliefs 3 0 -- --
Family man 2 6 10 90
Understand the needs of others 0 12 20 75
Works well with others 0 4 14 86
Total 100 100
Traits Motivating Vote for Governor Data from Anne Arundel County Exit Poll
2006 Elections: Maryland and Anne Arundel County
Informed about Governor/County Executives Candidates’ Stands on Issues?
How informed? Govr
Cty Exec.
Very 56 34
Somewhat 37 45
Not very 7 21
Total 100 100
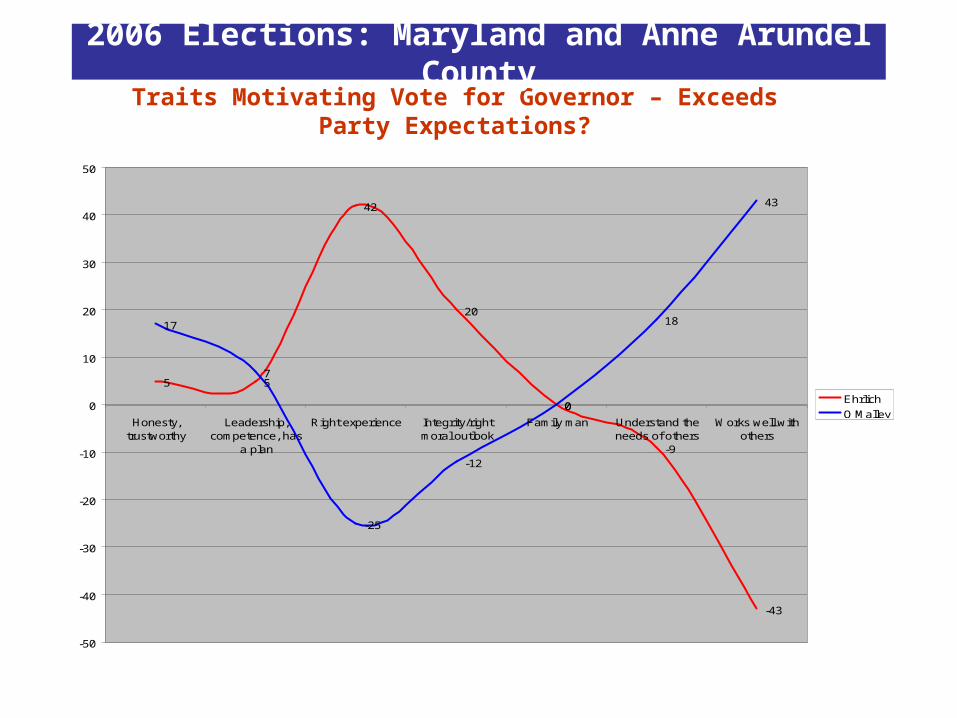
Traits Motivating Vote for Governor – Exceeds Party Expectations?
2006 Elections: Maryland and Anne Arundel County
5 5
42
20
0
-9
-43
17
7
-25
-12
0
18
43
-50
-40
-30
-20
-10
0
10
20
30
40
50
Honesty,trustworthy
Leadership,competence, has
a plan
Right experience Integrity/rightmoral outlook
Family man Understand theneeds of others
Works well withothers
Ehrlich
O'Malley
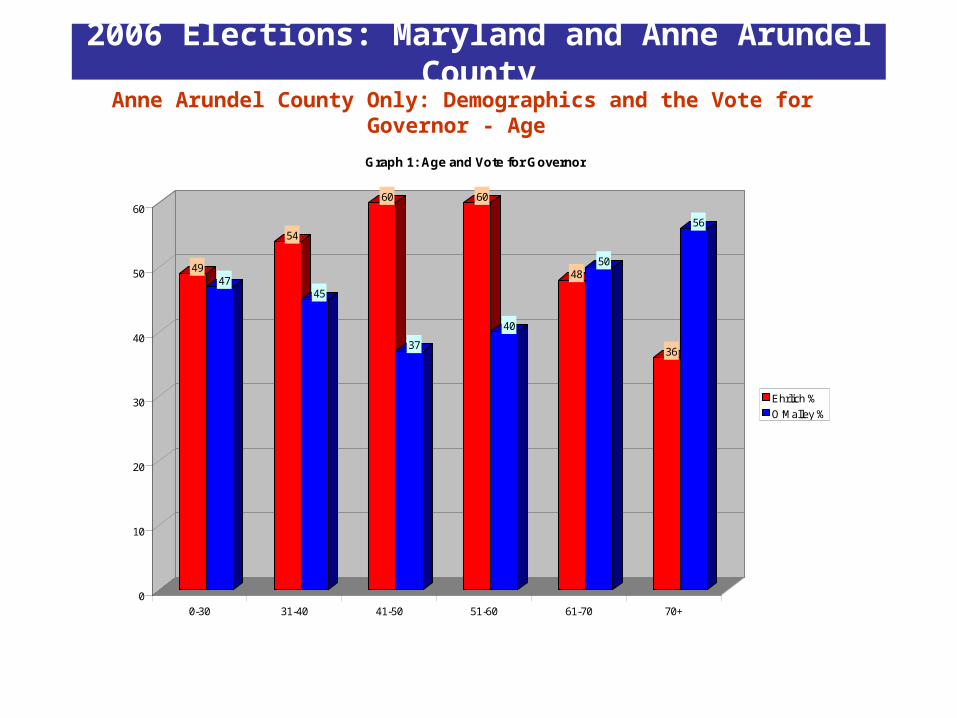
4947
54
45
60
37
60
40
4850
36
56
0
10
20
30
40
50
60
0-30 31-40 41-50 51-60 61-70 70+
Graph 1: Age and Vote for Governor
Ehrlich %
O’Malley %
2006 Elections: Maryland and Anne Arundel County
Anne Arundel County Only: Demographics and the Vote for Governor - Age
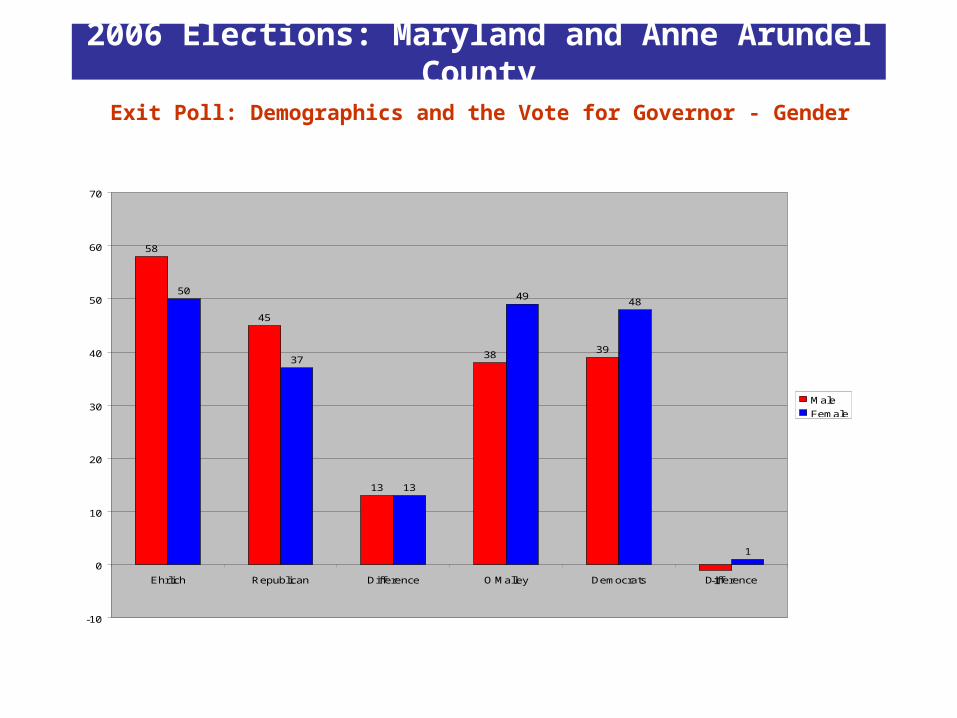
2006 Elections: Maryland and Anne Arundel County
Exit Poll: Demographics and the Vote for Governor - Gender
58
45
13
38 39
-1
50
37
13
4948
1
-10
0
10
20
30
40
50
60
70
Ehrlich Republican Difference O'Malley Democrats Difference
Male
Female
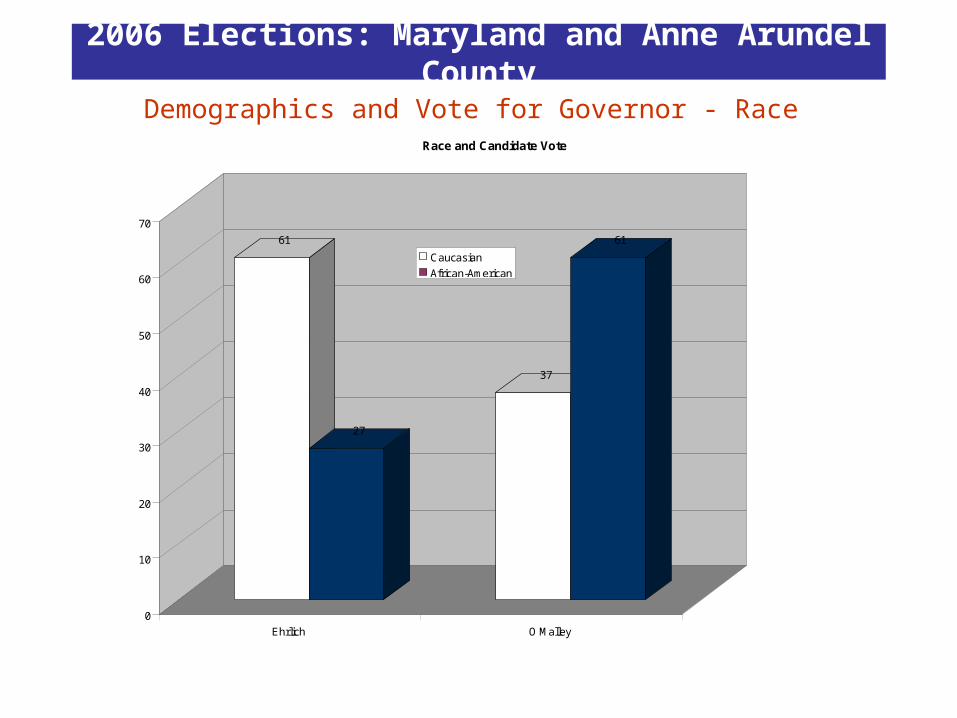
Demographics and Vote for Governor - Race
27
61
67
37
0
10
20
30
40
50
60
70
Ehrlich % O’Malley %
Graph 2: Race and Governor Vote
African-Americans
Caucasians
61
27
37
61
0
10
20
30
40
50
60
70
Ehrlich O'Malley
Race and Candidate Vote
Caucasian
African-American
2006 Elections: Maryland and Anne Arundel County
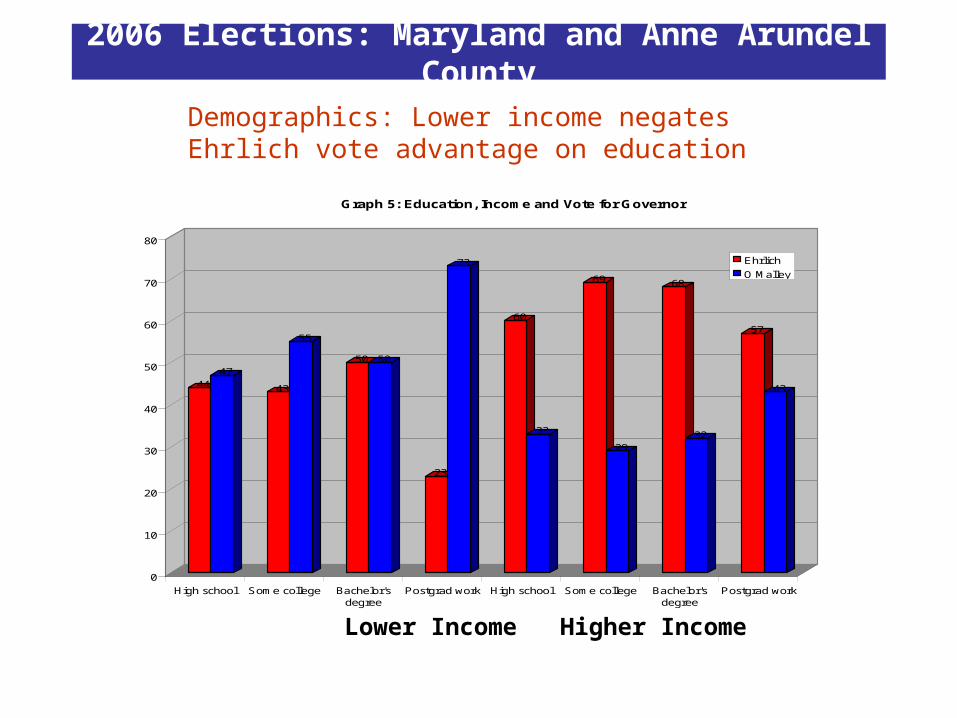
Demographics: Lower income negates Ehrlich vote advantage on education
4447
43
55
50 50
23
73
60
33
69
29
68
32
57
43
0
10
20
30
40
50
60
70
80
High school Some college Bachelor'sdegree
Postgrad work High school Some college Bachelor'sdegree
Postgrad work
Graph 5: Education, Income and Vote for Governor
Ehrlich
O'Malley
Lower Income Higher Income
2006 Elections: Maryland and Anne Arundel County
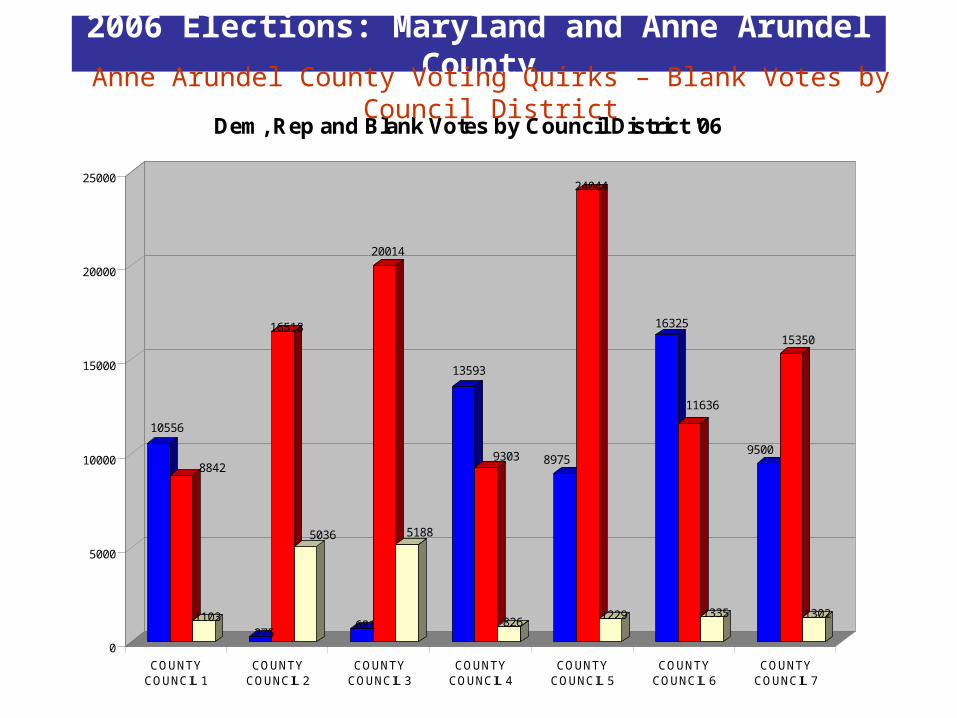
10556
8842
1103275
16518
5036
681
20014
5188
13593
9303
826
8975
24044
1229
16325
11636
1335
9500
15350
1302
0
5000
10000
15000
20000
25000
COUNTYCOUNCIL 1
COUNTYCOUNCIL 2
COUNTYCOUNCIL 3
COUNTYCOUNCIL 4
COUNTYCOUNCIL 5
COUNTYCOUNCIL 6
COUNTYCOUNCIL 7
Dem, Rep and Blank Votes by Council District '06
2006 Elections: Maryland and Anne Arundel County
Anne Arundel County Voting Quirks – Blank Votes by Council District
2006 Elections: Maryland and Anne Arundel County
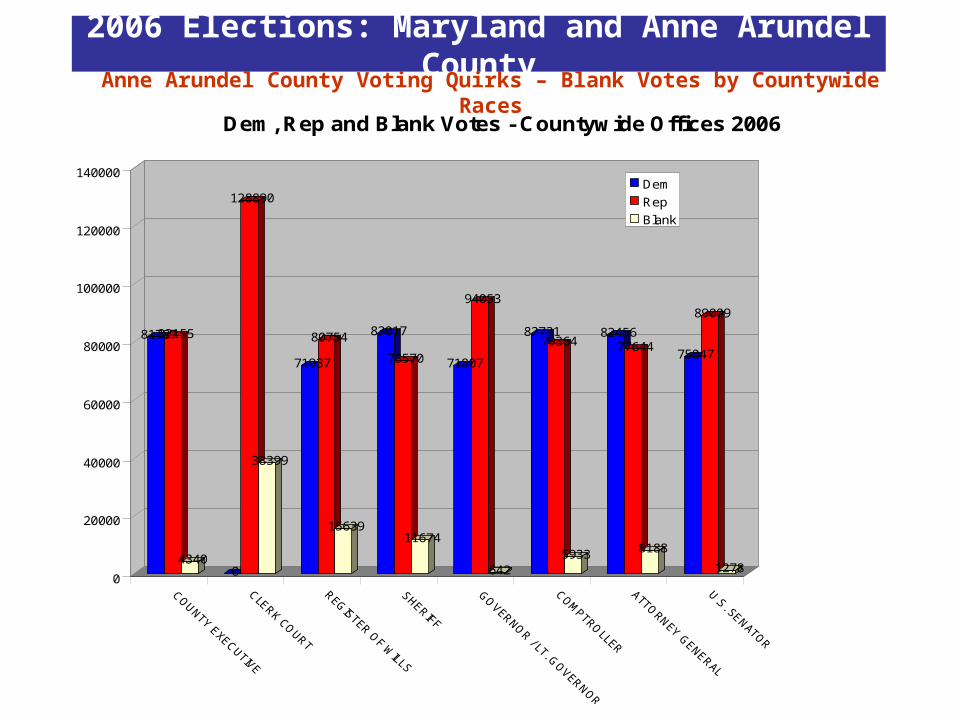
8178782155
43400
128890
38399
71937
80754
15639
83017
73570
11674
71807
94053
642
8273179364
5933
8245677644
8188
75047
89009
12780
20000
40000
60000
80000
100000
120000
140000
Dem, Rep and Blank Votes - Countywide Offices 2006
Dem
Rep
Blank
Anne Arundel County Voting Quirks – Blank Votes by Countywide Races
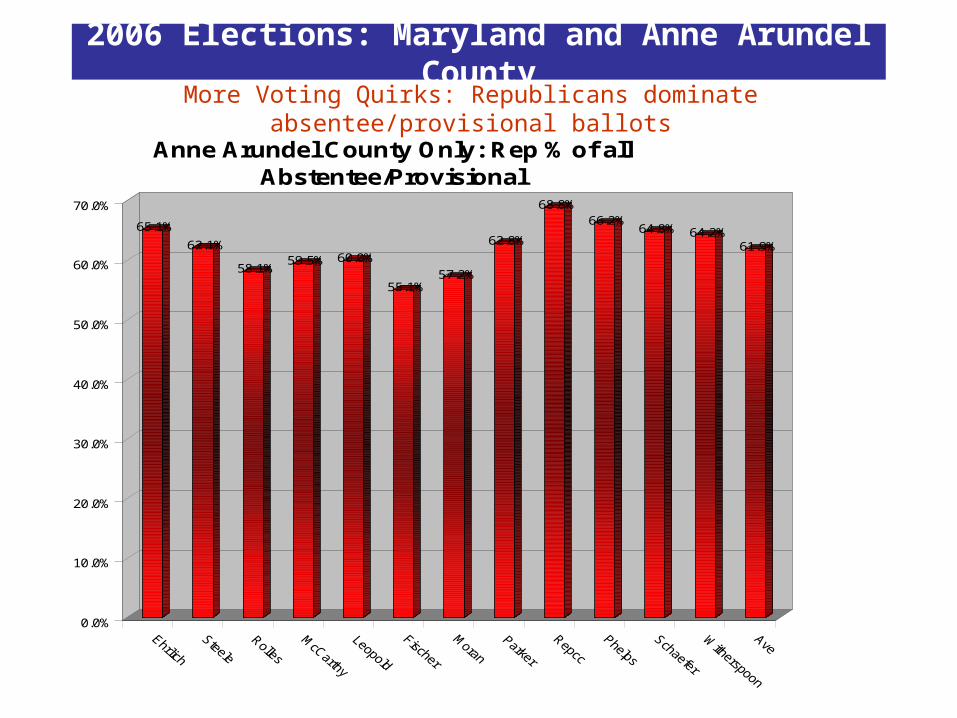
65.1%
62.1%
58.1%59.5% 60.0%
55.1%57.2%
62.8%
68.8%66.2%
64.8% 64.2%61.9%
0.0%
10.0%
20.0%
30.0%
40.0%
50.0%
60.0%
70.0%
Anne Arundel County Only: Rep % of all Abstentee/Provisional
2006 Elections: Maryland and Anne Arundel County
More Voting Quirks: Republicans dominate absentee/provisional ballots
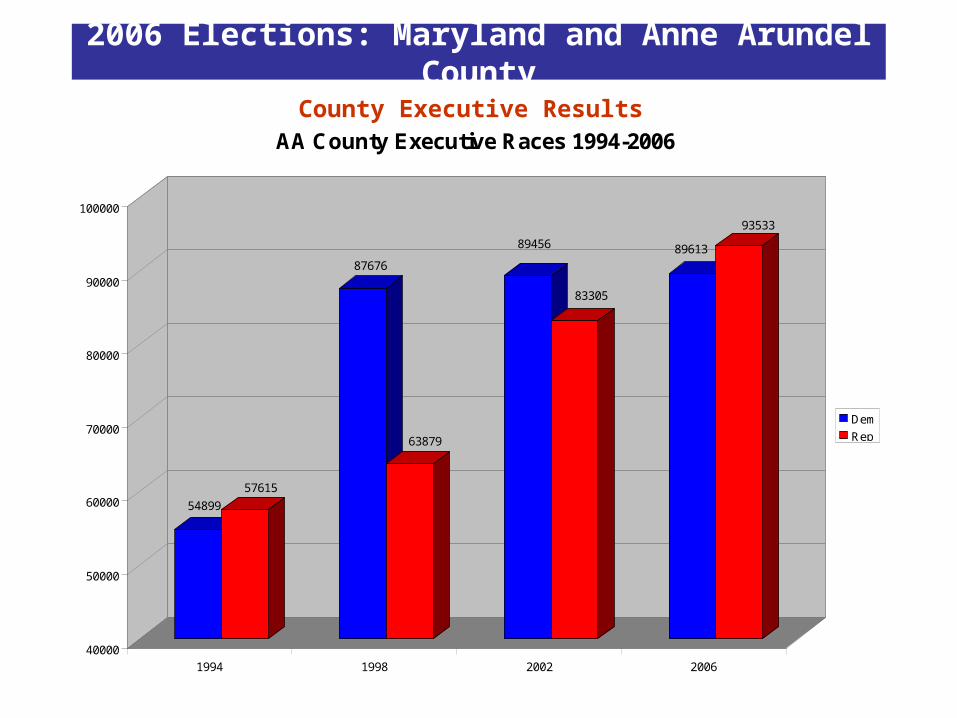
54899
57615
87676
63879
89456
83305
89613
93533
40000
50000
60000
70000
80000
90000
100000
1994 1998 2002 2006
AA County Executive Races 1994-2006
Dem
Rep
2006 Elections: Maryland and Anne Arundel County
County Executive Results
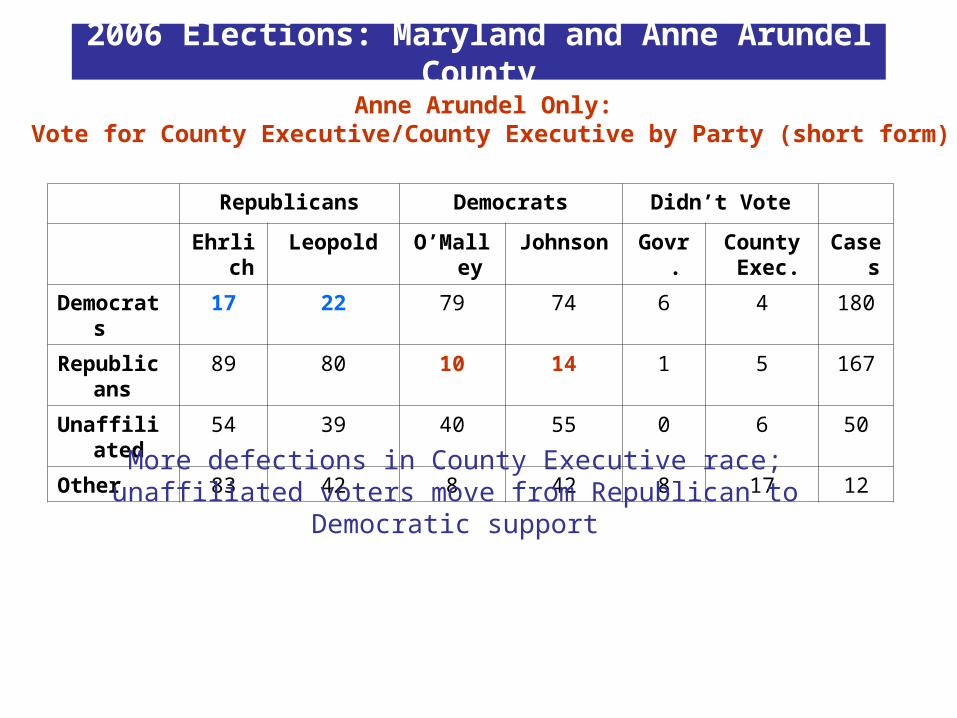
Anne Arundel Only: Vote for County Executive/County Executive by Party (short form)
Republicans Democrats Didn’t Vote
Ehrlich Leopold O’Malley Johnson Govr. County Exec.
Cases
Democrats 17 22 79 74 6 4 180
Republicans 89 80 10 14 1 5 167
Unaffiliated 54 39 40 55 0 6 50
Other 83 42 8 42 8 17 12
2006 Elections: Maryland and Anne Arundel County
More defections in County Executive race; unaffiliated voters move from Republican to Democratic support
7
-7
0-2
-11
11
-24
27
6
-20
-12
8
-12
9
-30
-20
-10
0
10
20
30
StrongDemocrat
WeakDemocrat
IndependentDemocrat
UnaffiliatedIndependent
IndependentRepublican
WeakRepublican
StrongRepublican
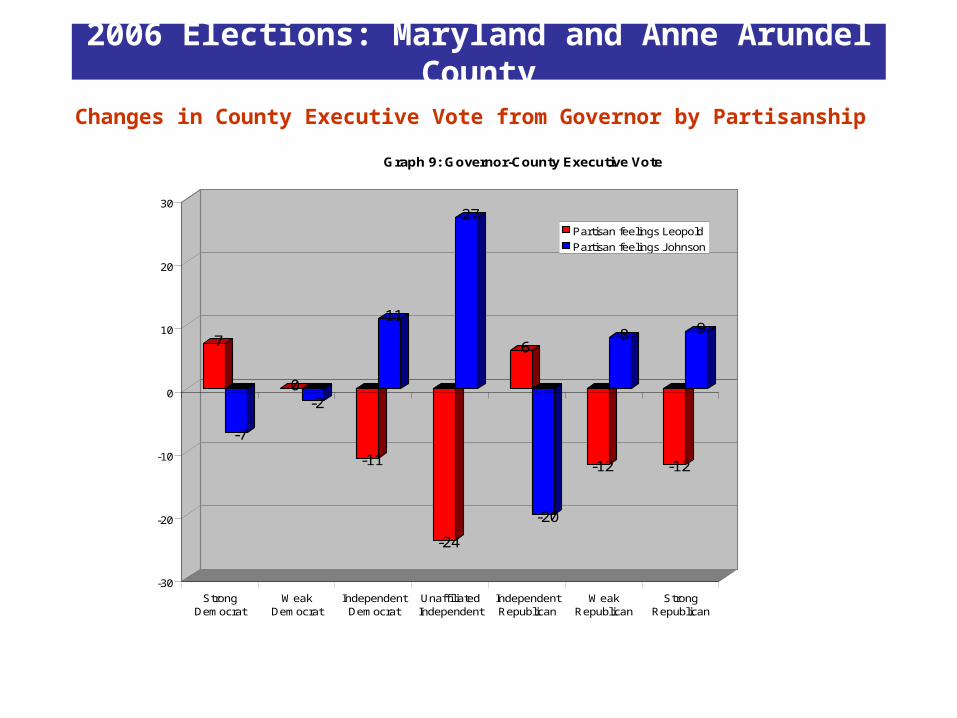
Graph 9: Governor-County Executive Vote
Partisan feelings Leopold
Partisan feelings Johnson
2006 Elections: Maryland and Anne Arundel County
Changes in County Executive Vote from Governor by Partisanship
2859
2392
18411632
488
-443
-2241
2924
20721631
-119
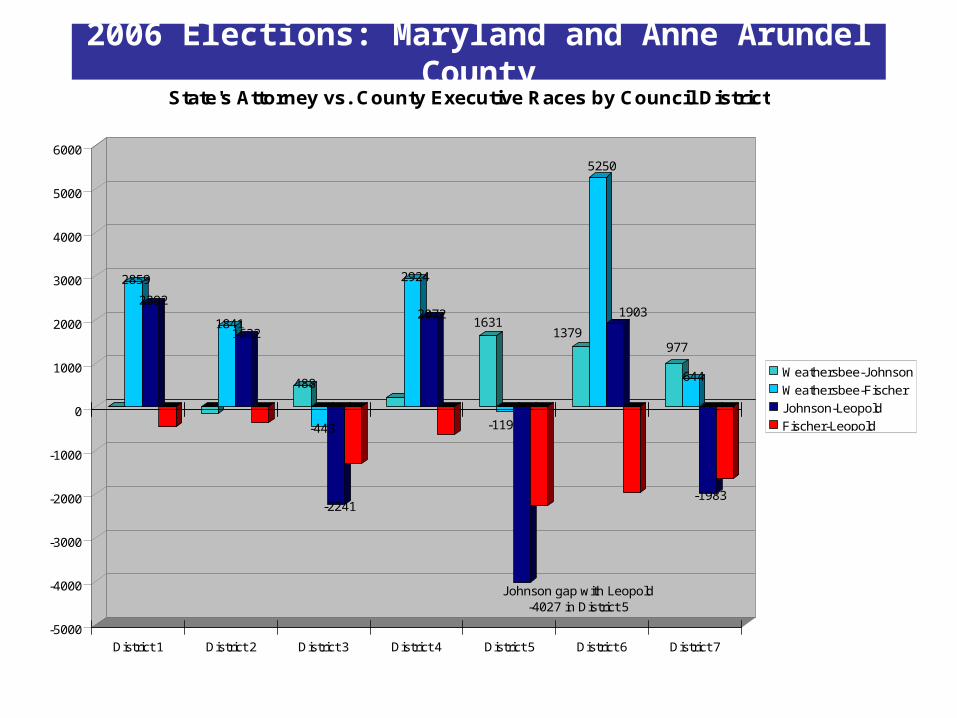
Johnson gap with Leopold-4027 in District 5
1379
5250
1903
977
644
-1983
-5000
-4000
-3000
-2000
-1000
0
1000
2000
3000
4000
5000
6000
District 1 District 2 District 3 District 4 District 5 District 6 District 7
State's Attorney vs. County Executive Races by Council District
Weathersbee-Johnson
Weathersbee-Fischer
Johnson-Leopold
Fischer-Leopold
2006 Elections: Maryland and Anne Arundel County
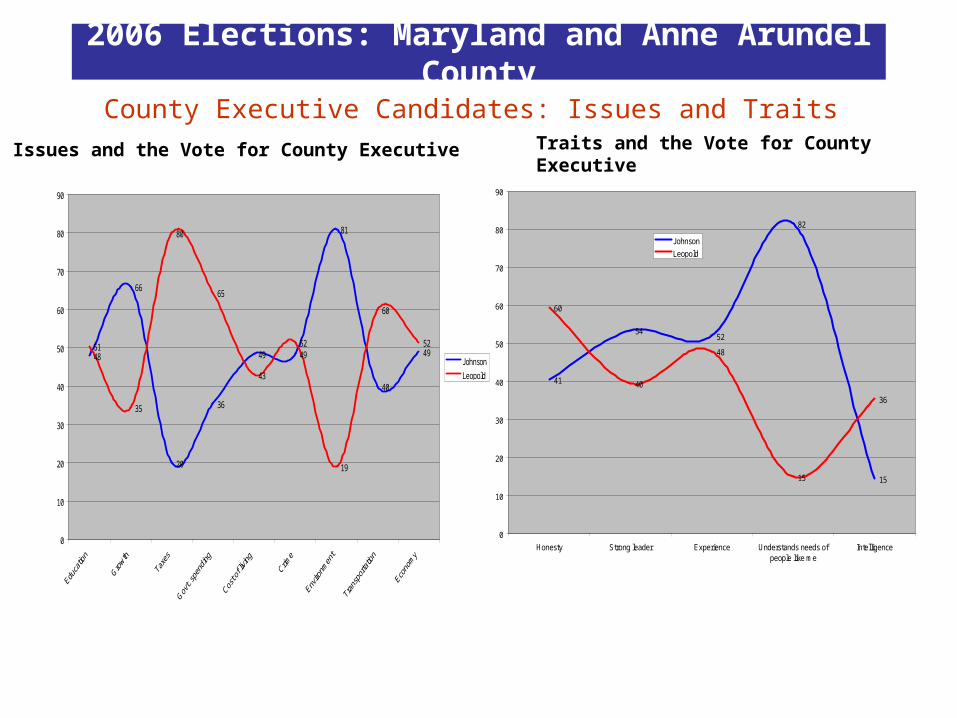
County Executive Candidates: Issues and Traits
48
66
20
36
49 49
81
40
4951
35
80
65
43
52
19
60
52
0
10
20
30
40
50
60
70
80
90
Johnson
Leopold41
5452
82
15
60
40
48
15
36
0
10
20
30
40
50
60
70
80
90
Honesty Strong leader Experience Understands needs ofpeople like me
Intelligence
Johnson
Leopold
Traits and the Vote for County Executive Issues and the Vote for County Executive
2006 Elections: Maryland and Anne Arundel County

-6
-1
-9
-12
6
-8
-7
6
-3
-2
0
-3
3
-1
0
10
-2
0
-15
-10
-5
0
5
10
0-30 31-40 41-50 51-60 61-70 71+
Graph 10: Changes in Support by Age Group
Leopold
Johnson
No Vote
Age/Education and County Executive Vote vs. Governor Vote
-2
5
6
-8
5 5
-4
1
4
-3
1
3
-8
-6
-4
-2
0
2
4
6
High school Some college Bachelor’s degree Postgraduate work
Graph 12: Change in Vote for County Executive vs. Governor
Leopold
Johnson
No Vote
2006 Elections: Maryland and Anne Arundel County
County Executive Vote and Demographics
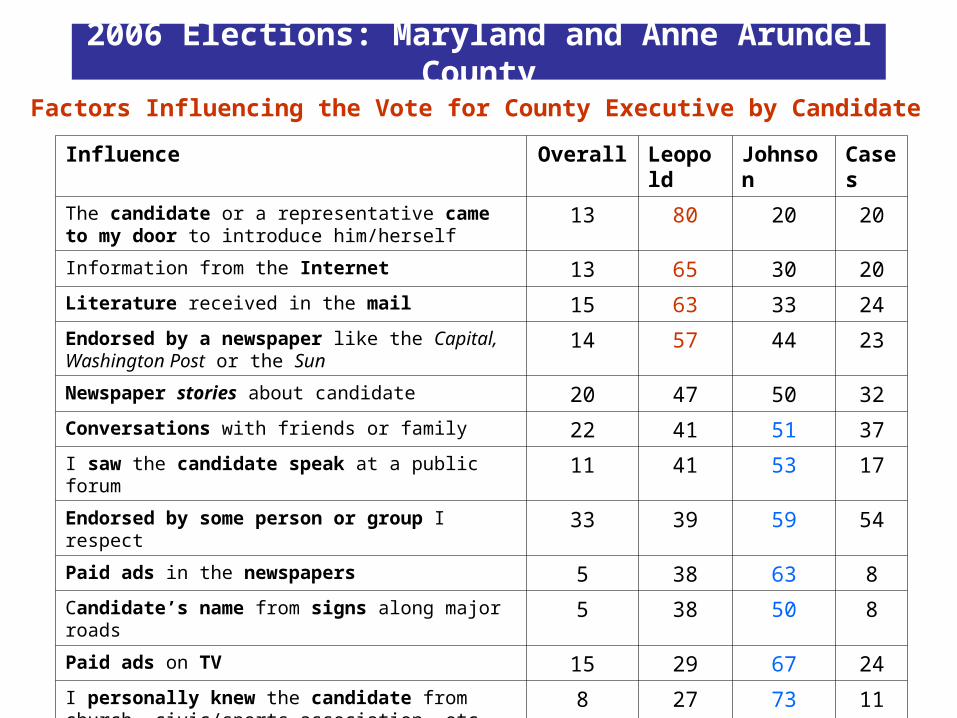
Factors Influencing the Vote for County Executive by Candidate
Influence Overall Leopold Johnson Cases
The candidate or a representative came to my door to introduce him/herself
13 80 20 20
Information from the Internet 13 65 30 20
Literature received in the mail 15 63 33 24
Endorsed by a newspaper like the Capital, Washington Post or the Sun
14 57 44 23
Newspaper stories about candidate 20 47 50 32
Conversations with friends or family 22 41 51 37
I saw the candidate speak at a public forum 11 41 53 17
Endorsed by some person or group I respect 33 39 59 54
Paid ads in the newspapers 5 38 63 8
Candidate’s name from signs along major roads 5 38 50 8
Paid ads on TV 15 29 67 24
I personally knew the candidate from church, civic/sports association, etc.
8 27 73 11
2006 Elections: Maryland and Anne Arundel County
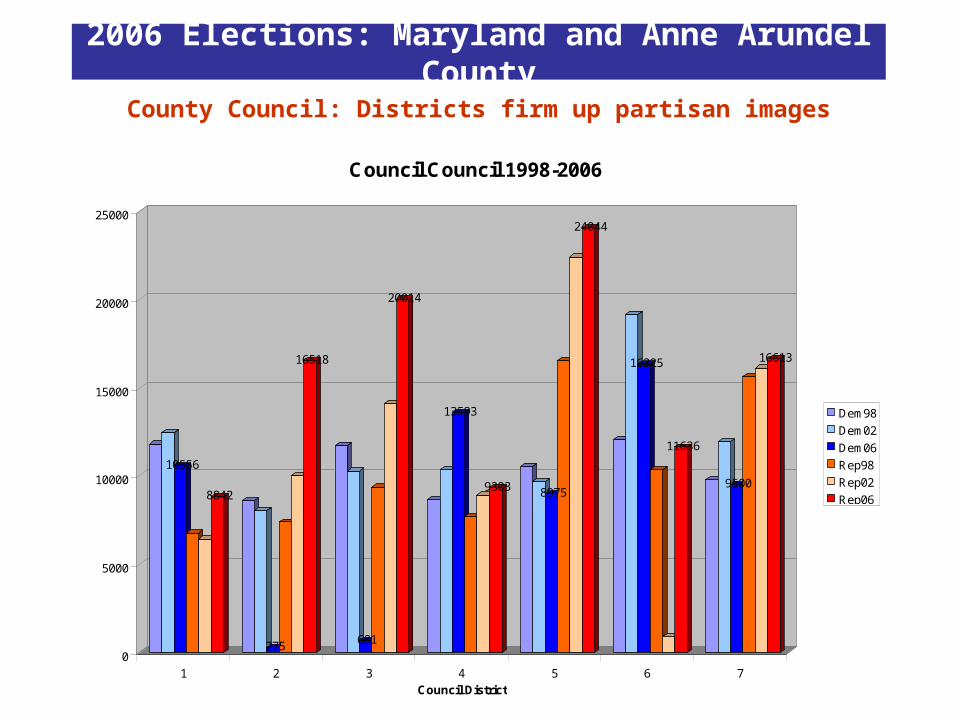
10556
8842
275
16518
681
20014
13593
9303 8975
24044
16325
11636
9500
16613
0
5000
10000
15000
20000
25000
1 2 3 4 5 6 7Council District
Council Council 1998-2006
Dem98
Dem02
Dem06
Rep98
Rep02
Rep06
County Council: Districts firm up partisan images
2006 Elections: Maryland and Anne Arundel County
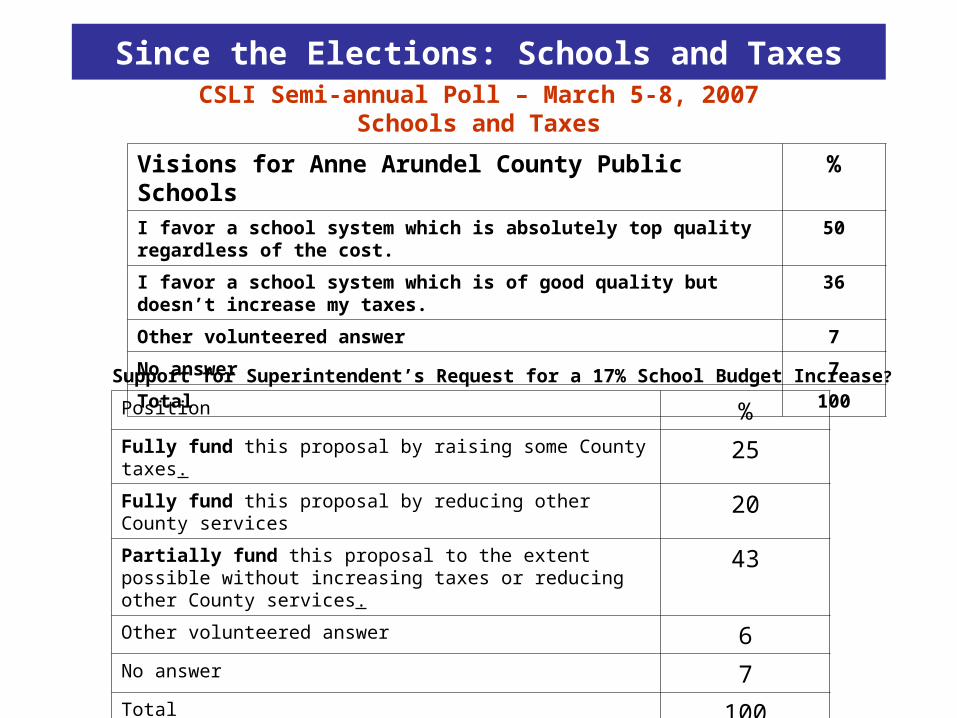
CSLI Semi-annual Poll – March 5-8, 2007Schools and Taxes
Since the Elections: Schools and Taxes
Visions for Anne Arundel County Public Schools %
I favor a school system which is absolutely top quality regardless of the cost. 50
I favor a school system which is of good quality but doesn’t increase my taxes. 36
Other volunteered answer 7
No answer 7
Total 100
Support for Superintendent’s Request for a 17% School Budget Increase?
Position %
Fully fund this proposal by raising some County taxes. 25
Fully fund this proposal by reducing other County services 20
Partially fund this proposal to the extent possible without increasing taxes or reducing other County services.
43
Other volunteered answer 6
No answer 7
Total 100
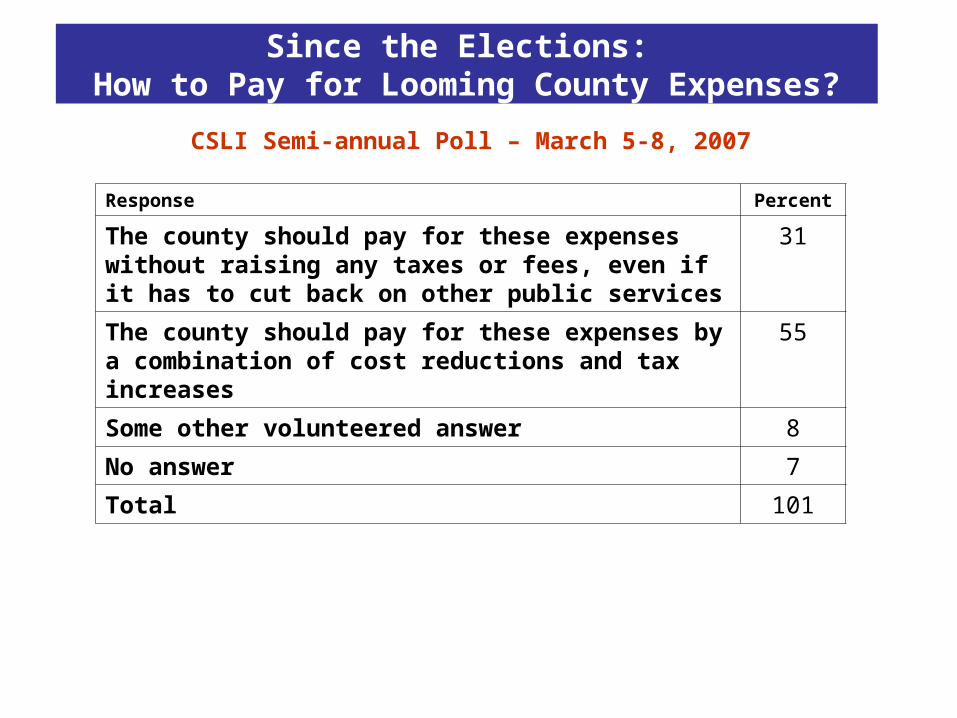
CSLI Semi-annual Poll – March 5-8, 2007
Since the Elections: How to Pay for Looming County Expenses?
Response Percent
The county should pay for these expenses without raising any taxes or fees, even if it has to cut back on other public services
31
The county should pay for these expenses by a combination of cost reductions and tax increases
55
Some other volunteered answer 8
No answer 7
Total 101
CSLI Semi-annual Poll – March 5-8, 2007
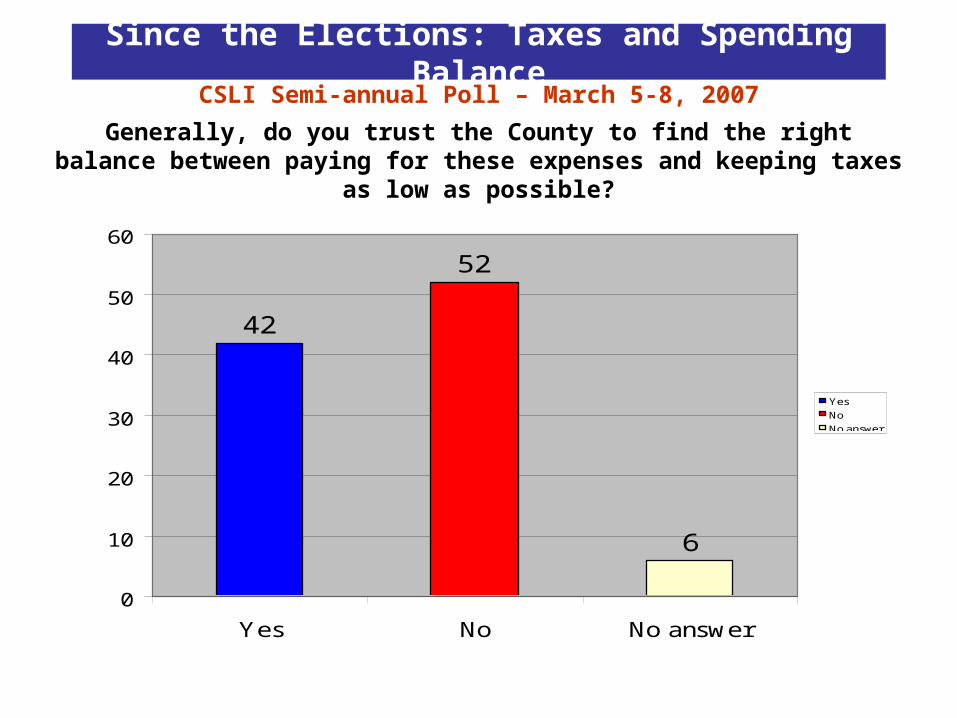
Since the Elections: Taxes and Spending Balance
Generally, do you trust the County to find the right balance between paying for these expenses and keeping taxes as low as possible?
42
52
6
0
10
20
30
40
50
60
Yes No No answer
YesNoNo answer
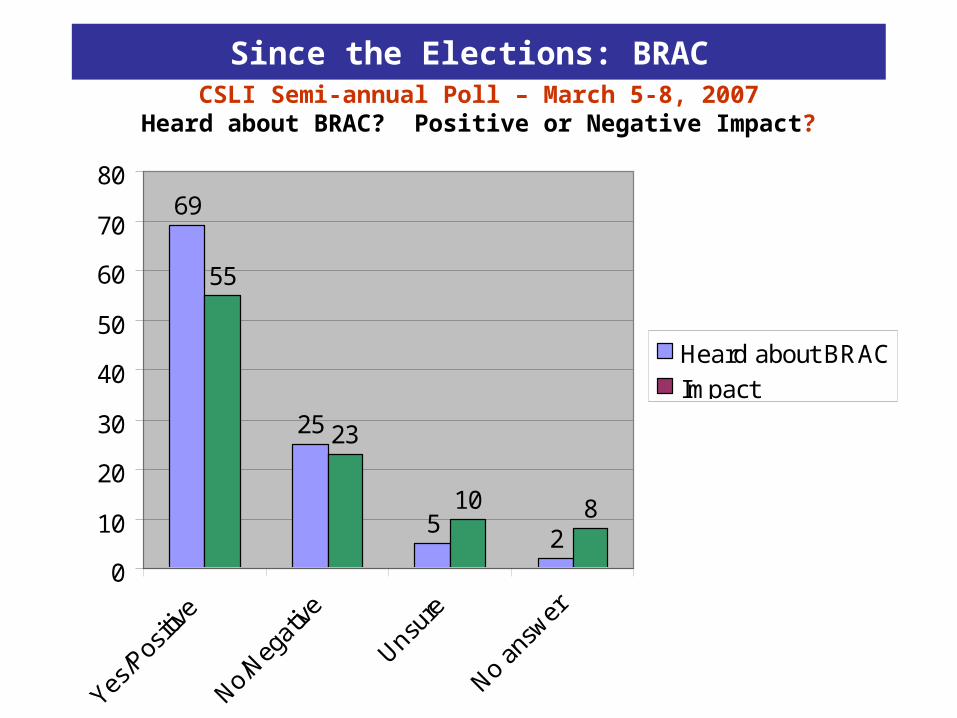
CSLI Semi-annual Poll – March 5-8, 2007Heard about BRAC? Positive or Negative Impact?
Since the Elections: BRAC
69
25
52
55
23
10 8
0
10
20
30
40
50
60
70
80
Yes/P
ositiv
e
No/Neg
ative
Unsure
No ans
wer
Heard about BRAC
Impact
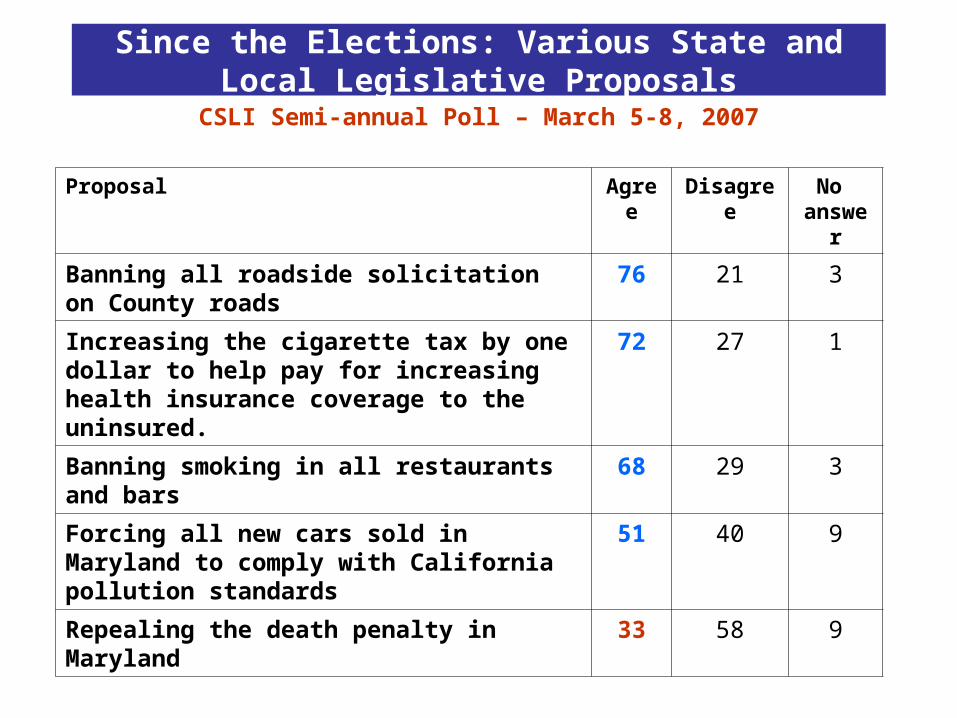
CSLI Semi-annual Poll – March 5-8, 2007
Since the Elections: Various State and Local Legislative Proposals
Proposal Agree Disagree No answer
Banning all roadside solicitation on County roads 76 21 3
Increasing the cigarette tax by one dollar to help pay for increasing health insurance coverage to the uninsured.
72 27 1
Banning smoking in all restaurants and bars 68 29 3
Forcing all new cars sold in Maryland to comply with California pollution standards
51 40 9
Repealing the death penalty in Maryland 33 58 9
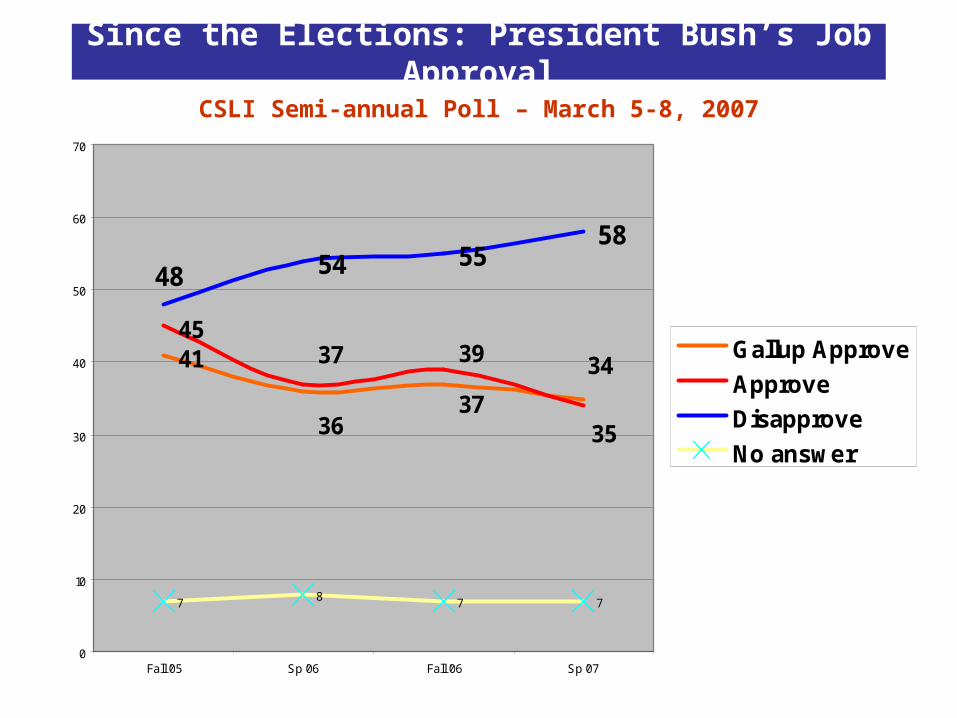
CSLI Semi-annual Poll – March 5-8, 2007
Since the Elections: President Bush’s Job Approval
4145
54 5558
7 8 7 7
3537
36
3437 39
48
0
10
20
30
40
50
60
70
Fall '05 Sp '06 Fall '06 Sp '07
Gallup Approve
Approve
Disapprove
No answer