Embed Size (px)
Citation preview

Conclusions
FINAL Prioritization of Marine Shorelines of WRIA 9 May 2006 WRIA 9 Technical Committee 70 030239‐01
6 CONCLUSIONS
The habitat function model provided a useful tool for discovering an assortment of actions with
the potential to make the largest improvements in habitat function for juvenile salmonids in the
project area. However, even at the subarea scale, only a portion of the opportunities to improve
habitat function could be included. The priority recommendations presented in this report
represent the best opportunities given the decision system selected for the project, and are
representative of several other opportunities that may be available, but offer somewhat smaller
potential benefits.
These recommendations have value because they represent an interpretation of current habitat
function in the project area, as well as the restoration, rehabilitation, and substitution potential.
The recommendations reflect the mosaic of shoreline uses represented in the project area,
ranging from particular actions that may be taken in a specific location, to the consideration of
actions that may occur over a long stretch of shoreline. Because of multiple shoreline uses,
some recommendations were more opportunistic than others, owing to ownership and urban
constraints that occur there, while the implementation of others may be part of strategic actions
targeting specific habitat goals. In either case, the opportunities identified in this report have a
solid justification for restoring habitat function for salmonids migrating through the WRIA 9
marine nearshore.

References
FINAL Prioritization of Marine Shorelines of WRIA 9 May 2006 WRIA 9 Technical Committee 71 030239‐01
7 REFERENCES
Aitkin, J. K. 1998. The importance of estuarine habitats to anadromous salmonids of the Pacific
Northwest: a literature review. U.S. Fish and Wildlife Service, Olympia, Washington.
Anchor Environmental, L.L.C. (Anchor). 2004. Marine Shoreline Inventory Report, WRIA 9.
Prepared for Seattle Public Utilities, WRIA 9. March 2004.
Anchor and Natural Resources Consultants (NRC). 2005. Evaluation and Assessment of
Hatchery and Wild Salmon Interactions in WRIA 9. Prepared for WRIA 9 Steering
Committee. November 2005.
Beamer, E., A. McBride, R. Henderson, and K. Wolf. 2003. The importance of non‐natal pocket
estuaries in Skagit Bay to wild chinook salmon: an emerging priority for restoration.
Skagit System Cooperative Research Department, La Conner, WA 98257‐0368.
Beamish, R. J., and C. Mahnken. 1998. Natural regulation of the abundance of coho and other
species of Pacific salmon according to a critical size and critical period hypothesis.
NPAFC Doc. No. 319. 26p.
Brennan, J.S., K.F. Higgins, J.R. Cordell, and V.A. Stamatiou. 2004. Juvenile Salmon
Composition, Timing, Distribution, and Diet in Marine Nearshore Waters of Central
Puget Sound, 2001‐2002. King County Department of Natural Resources and Parks,
Seattle, WA. 164 pp.
Duffy, E.J. 2003. Early marine distribution and trophic interactions of juvenile salmon in Puget
Sound. M.S. Thesis, August 2003. University of Washington School of Aquatic and
Fishery Sciences.
Goetz, F.A. and E. Jeanes. 2004. Bull Trout in the Nearshore – Preliminary Draft. Prepared by
U.S. Army Corps of Engineers, Seattle District. June 2004.
Hargreaves, B.N. 1997. Early ocean survival of salmon off British Columbia and impacts of the
1983 and 1991‐95 El Nino events. In Estuarine and ocean survival of Northeastern Pacific

References
FINAL Prioritization of Marine Shorelines of WRIA 9 May 2006 WRIA 9 Technical Committee 72 030239‐01
salmon: Proceedings of the workshop, Edited by Emmett, R.L., and M.H. Schiewe.
NMFS‐NWFSC‐29.
Healey, M.C. 1982. Juvenile Pacific Salmon in estuaries: the life support system. Pages 315‐341
in Kennedy, V. S. editor. Estuarine comparison, Academic Press, New York, New York.
Hirschi, R., T. Doty, A. Keller, and T. Labbe. 2003. Juvenile salmonid use of tidal creek and
independent marsh environments in north Hood Canal: summary of first year findings.
Port Gamble S’Klallam Tribe Natural Resources.
Holtby, L.B., B.C. Anderson, and R.K. Kadowaki. 1990. Importance of smolt size and early
ocean growth to interannual variability in marine survival of coho salmon
(Oncorhynchus kisutch). Can. J. Fish. Aquat. Sci. 47(11): 2181‐2194.
Johannessen, J., A. MacLennan, and A. McBride. 2005. Inventory and Assessment of Current
and Historic Beach Feeding Sources/Erosion and Accretion Areas for the Marine
Shorelines of Water Resource Inventory Areas 8 and 9. Prepared for The WRIA 9
Steering Committee and King County Department of Natural Resources and Parks.
Prepared by Coastal Geologic Services Inc., Bellingham, WA. December 2005.
Kerwin, J. and T.S. Nelson (Eds.). 2000. Habitat Limiting Factors and Reconnaissance
Assessment Report, Green/Duwamish and Central Puget Sound Watersheds (WRIA 9
and Vashon Island). Washington Conservation Commission and the King County
Department of Natural Resources. December 2000.
Murphy, M.L., H.W. Jaenicke, and E.V. Jr. Farley. 1998. The importance of early marine growth
to interannual variability in production of southeastern Alaska pink salmon. NPAFC
Tech. Rep. pp. 18‐19.
Nelson, T., G. Ruggerone, H. Kim, R. Schaefer, and M. Boles. 2004. Draft – Juvenile Chinook
migration, growth and habitat use in the Lower Green River, Duwamish River and
Nearshore of Elliott Bay, 2001‐2003. Prepared by King County Department of Natural
Resources and Parks, Water and Land Resources Division.

References
FINAL Prioritization of Marine Shorelines of WRIA 9 May 2006 WRIA 9 Technical Committee 73 030239‐01
Puget Sound Technical Recovery Team (Puget Sound TRT). 2003. Integrated Recovery
Planning for Listed Salmon: Technical Guidance for Watershed Groups in Puget Sound.
Shared Strategy. 2005. Regional Nearshore and Marine Aspects of Salmon Recovery in Puget
Sound. Compiled and edited by Scott Redmond, Doug Myers, and Dan Averill – Puget
Sound Action Team. From contributions by the editors and Kurt Fresh and Bill Graeber,
NOAA Fisheries. Delivered to Shared Strategy for Puget Sound for inclusion in their
regional salmon recovery plan. June 28, 2005.
Simenstad, C.A. 1983. The ecology of estuarine channels of the Pacific Northwest coast: A
community profile. FWS/OBS‐83/05. U.S. Fish and Wildlife Service, Olympia, WA.
Simenstad, C. A., K. L. Fresh, and E. O. Salo. 1982. The role of Puget Sound and Washington
coastal estuaries in the life history of Pacific salmon: An unappreciated function. In: V.S.
Kennedy [ed] Estuarine Comparisons. pp.343‐365. Academic Press, Toronto.
Simenstad, C.A., and J.R. Cordell. 2000. Ecological assessment criteria for restoring
anadromous salmon habitat in Pacific Northwest estuaries. Ecological Engineering
15:283‐302.
Sogard, S.M. 1997. Size‐selective mortality in the juvenile stage of teleost fishes: A review.
Bulletin of Marine Science. 60(3): 1129‐1157.
Tovey, C.P. 1999. The relationship between marine survival rates of Robertson Creek chinook
salmon (Oncorhynchus tshawytscha) and their first marine year lengths and growth rates.
M.S. thesis, U. British Columbia. 114 pp.
Washington Department of Fisheries (WDF) et al. 1993. 1992 Washington State Salmon and
Steelhead Stock Inventory, appendix one Puget Sound stocks. Prepared by Washington
Department of Fisheries, Washington Department of Wildlife, and Western Washington
Treaty Indian Tribes, Olympia, Washington.

References
FINAL Prioritization of Marine Shorelines of WRIA 9 May 2006 WRIA 9 Technical Committee 74 030239‐01
Washington Department of Fish and Wildlife (WDFW). 1998. 1998 Washington Salmonid Stock
Inventory, Appendix Bull Trout and Dolly Varden. Prepared by Washington
Department of Fish and Wildlife, Olympia, WA.
WDFW. 2000. 2000 Washington Salmonid Stock Inventory, Appendix Coastal Cutthroat Trout.
Prepared by Washington Department of Fish and Wildlife, Olympia, WA.
WDFW. 2002. Washington State Salmon and Steelhead Stock Inventory. Prepared by
Washington Department of Fish and Wildlife, Olympia, Washington. Available at
SalmonScape at: https://fortress.wa.gov/dfw/salmonscape/ .
WDFW. 2003. Priority Habitats and Species Report. WDFW Office, Olympia, Washington.
Washington Department of Natural Resources (WDNR). 2001. The Washington State
ShoreZone Inventory. Washington Department of Natural Resources Nearshore Habitat
Program. Available at http://www2.wadnr.gov/nearshore/data/. Olympia, WA.
Washington Trout. 2001. Water Type and Stream Mouth Assessment. Vashon Island. June/July
2001. Information available at:
http://www.washingtontrout.org/Vashon/Vashon2001/VashonTitle.shtml .
Water Resource Inventory Area 8 (WRIA 8). 2005. Final Lake Washington Cedar/Sammamish
Watershed (WRIA 8) Chinook Salmon Conservation Plan. July 2005.
Water Resource Inventory Area 9 and King County (WRIA 9 and KC). 2004. Draft WRIA 9
Strategic Assessment Report – Scientific Foundation for Salmonid Habitat Conservation.
Prepared for Water Resource Inventory Area 9 Steering Committee. June 2004.
WRIA 9. 2005. Salmon Habitat Plan: Making our Watershed Fit for a King. Green/Duwamish
and Central Puget Sound Watershed, Water Resource Inventory Area 9. August 2005.

References
FINAL Prioritization of Marine Shorelines of WRIA 9 May 2006 WRIA 9 Technical Committee 75 030239‐01
Williams, G.D. and R.M. Thom. 2001. White Paper: Marine and Estuarine Shoreline
Modification Issues. Submitted to Washington Department of Fish and Wildlife,
Washington Department of Ecology, and Washington Department of Transportation.
Williams, G.D., R.M. Thom, J.E. Starkes, and 14 authors. 2001. Reconnaissance Assessment of
the State of the Nearshore Ecosystem: Eastern Shore of Central Puget Sound, Including
Vashon and Maury Islands (WRIAs 8 and 9). J.S. Brennan, Editor. Report prepared for
King County Department of Natural Resources, Seattle, Washington.

APPENDIX A
FIELD DATA COLLECTION REPORT
Table of Contents
Appendix A of Prioritization of Marine Shorelines of WRIA 9 May 2006 Field Data Collection Report A‐i 030239‐01
1 FIELD DATA COLLECTION ............................................................................................................ 1 1.1 Data Collection Area.................................................................................................................. 1 1.2 Methods....................................................................................................................................... 1 1.2.1 Boat Survey ......................................................................................................................... 1 1.2.2 Decision Rules .................................................................................................................... 3 1.2.2.1 Armoring and Change in Armoring Elevation.......................................................... 3 1.2.2.2 Groins............................................................................................................................... 8 1.2.2.3 Marshes.......................................................................................................................... 11
1.3 Results and Use of Data .......................................................................................................... 12
2 REFERENCES .................................................................................................................................... 16 List of Tables Table A‐1 Data Dictionary Used for Field Data Collection
List of Maps Map A‐1 Shoreline Armor
Map A‐2 Marshes and Stream Mouths
Map A‐3 Groins, Marine Rails, Ramps

Field Data Collection
Appendix A of Prioritization of Marine Shorelines of WRIA 9 May 2006 Field Data Collection Report A‐1 030239‐01
1 FIELD DATA COLLECTION
An identification and prioritization of areas for conservation, restoration, and rehabilitation of
juvenile salmonid habitat was performed for the City of Seattle (City) and Water Resource
Inventory Area 9 (WRIA 9) (see main report, titled Prioritization of Marine Shorelines of Water
Resource Inventory Area 9 for Juvenile Salmonid Habitat Protection and Restoration). The
prioritization was completed using a Geographic Information System (GIS)‐based habitat
model. To support this work, a field data collection effort was employed for certain habitat
attributes that could not be mapped to sufficient resolution by a previous effort in aerial photo
interpretation (Anchor 2004). This appendix presents methods for this effort; resulting data
were used in the habitat function model and the prioritization of habitats as described in the
main report.
1.1 Data Collection Area
The area for field data collection encompassed the entire project area, including the marine
shoreline of Seattle and WRIA 9 (see Map 1, main report). This comprised approximately 90
miles of shoreline, including the entire marine shorelines of the municipalities of Seattle
(south of Discovery Point), Burien, Normandy Park, Des Moines, and Federal Way; and the
marine shorelines of Vashon and Maury Islands.
1.2 Methods
In this field effort, new data were collected and existing data were refined. New data were
collected for habitat features that were either unknown (e.g., groins and marshes) or for
which there was insufficient detail following the photo interpretation. “Point” data (single
points) were collected for groins and marshes, and “line” data (continuous feature) were
collected for shoreline armoring (toe of armoring above, at, or below Ordinary High Water
[OHW]).
1.2.1 Boat Survey
Field data collection was completed by proceeding by small boat along the shoreline of
the project area, typically in 3 to 4 feet water depth, and collecting location data at points
(for groins and marshes) or at line breaks (for shoreline armoring). A laptop loaded
with with GIS data layers was used aboard the boat to confirm boat location as well as to
groundtruth existing habitat data with observed habitat features. Collected data were

Field Data Collection
Appendix A of Prioritization of Marine Shorelines of WRIA 9 May 2006 Field Data Collection Report A‐2 030239‐01
noted in a logbook and input to a project‐specific data dictionary in a differential Global
Positioning System (DGPS) datalogger (Table A‐1).
Table A-1
Data Dictionary Used for Field Data Collection
Feature Attributes of Feature GPS point feature Type (in a pipe, armored, or natural) Distance (feet)
Stream Mouth
Bearing (magnetic) GPS point feature Dominant vegetation (text notes – e.g., saltgrass) Distance (feet) Associated shoreform (text notes – e.g., spit or delta)
Marsh Point
Bearing (magnetic) GPS line feature Armor type/elevation (no armor, armor below OHW, armor above OHW, armor at OHW) Distance (feet)
Shoreline Armor
Bearing (magnetic) Photo Point GPS point feature
GPS point feature Correction number Change To: (insert correct data) Distance (feet)
Data Correction
Bearing (magnetic)
For shoreline armoring, line breaks were recorded for armoring that spanned 50 or more
(estimated) continuous feet of shoreline. For example, if the toe of a stretch of armoring
was below OHW and adjacent to this there was a different section of armoring with a
toe above OHW, a GPS break point was recorded at the point that the above‐OHW
armoring began. A GPS point was recorded when the boat was approximately
perpendicular to the shoreline at the ‘new’ section of armoring (distance and bearing
offsets recorded).
In addition to collecting new information, the field survey ground‐truthed data for
habitat features that were previously characterized in the photo interpretation. On the
boat, the GIS data layers were compared with field conditions and errors in
characterization were corrected. For example, if an object was previously characterized
in the photo interpretation as a boat ramp, but during the field survey, it was recognized

Field Data Collection
Appendix A of Prioritization of Marine Shorelines of WRIA 9 May 2006 Field Data Collection Report A‐3 030239‐01
as a small dock, a GPS location was recorded and the correction was noted. Notes and
GPS locations were also recorded for stream mouths that were observed in the field but
not present on existing GIS stream data layers. Also, certain areas that were identified
as “difficult to interpret” in the previous photo interpretation were visited and
characterized.
During the field survey, certain shoreline features were observed that did not fit the data
collection categories; these were noted as Unidentified Feature Objects (UFOs). While
these features did not fit the shoreline categories being specifically noted in the field
survey, the field team included these for completeness of shoreline information in the
project area. These constituted unusual configurations of shoreline features such as
shoreline armoring, overwater cover, beach structures, marine rails, and boat lifts. In
these cases, a GPS location was recorded and a photo was taken of the area. Locations
and photos of the UFOs can be viewed further in the GIS layers (Appendix B of the main
report).
1.2.2 Decision Rules
In most cases, characteristics of habitat features were immediately obvious to the field
crew (i.e., armoring above OHW was visually obvious as armoring above OHW), but
some features required interpretation. For example, some stretches of the shoreline
exhibited rock piles that could be called armoring, and some shorelines exhibited very
short stretches of armoring that did not justify a separate line break. The following
sections, pictures, and captions describe the rules used for these habitat features and
cases.
1.2.2.1 Armoring and Change in Armoring Elevation
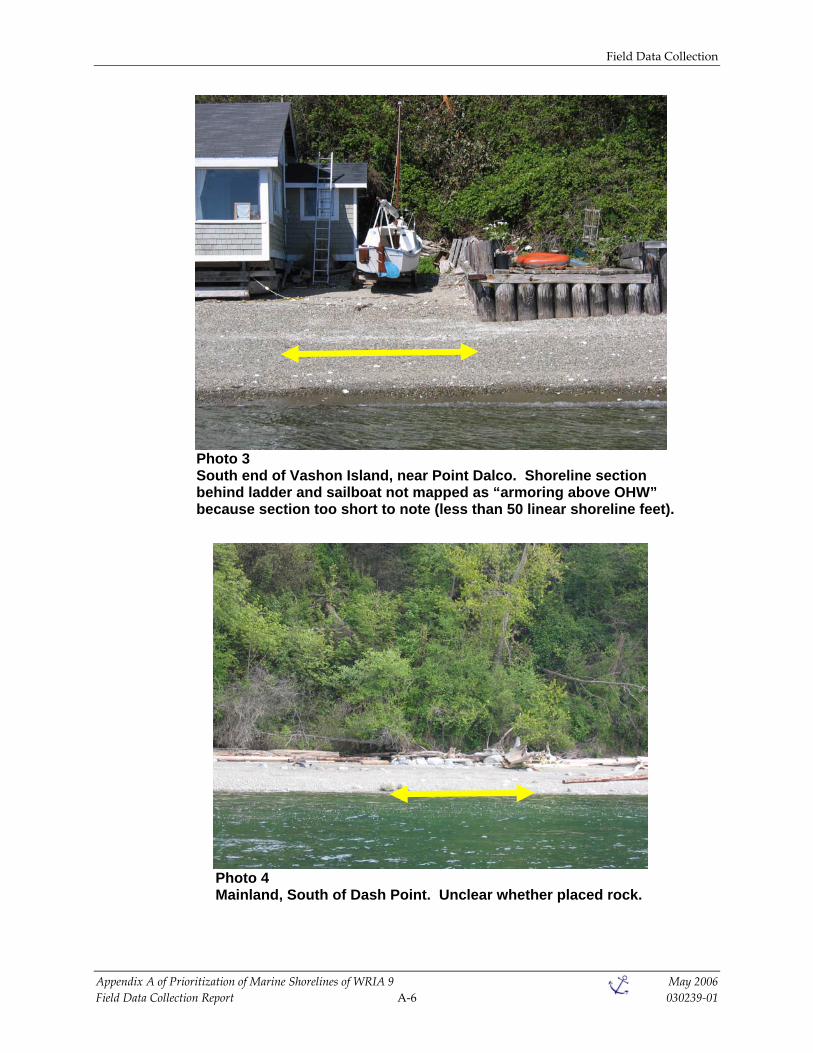
Armoring was not mapped as such if it covered less than 50 linear feet of the
shoreline (e.g., Photo 1). In instances of uncertainty whether armoring spanned at
least 50 feet, the break location was always collected (as opposed to not collecting a
break location). Changes in armoring elevation were not mapped if armoring
covered less than 50 linear feet of the shoreline (e.g., Photos 2 and 3). In instances of
uncertainty whether the change in armoring elevation spanned at least 50 feet, the
break location was always collected (as opposed to not collecting a break location).

Field Data Collection
Appendix A of Prioritization of Marine Shorelines of WRIA 9 May 2006 Field Data Collection Report A‐4 030239‐01
Rock armoring was not mapped as such if it was visually uncertain whether the rock
was placed rock (and not part of a failing upland wall or naturally occurring boulder
pile) (e.g., Photo 4). Piles of wood scraps or derelict wood building remnants were
not mapped as armor (e.g., Photo 5), and piles with no bulkhead behind them were
not mapped as armor (e.g., Photo 6).
Photo 1 Mainland, South of Des Moines Marina. Unarmored section (approximately 10 feet) too short to map.

Field Data Collection
Appendix A of Prioritization of Marine Shorelines of WRIA 9 May 2006 Field Data Collection Report A‐5 030239‐01
Photo 2 Mainland near Normandy Beach Park. Break in “armoring below OHW” to “armoring above OHW” was mapped because stretch of shoreline with change in armoring elevation is approximately at least 50 linear shoreline feet in length.
Field Data Collection
Appendix A of Prioritization of Marine Shorelines of WRIA 9 May 2006 Field Data Collection Report A‐6 030239‐01
Photo 3 South end of Vashon Island, near Point Dalco. Shoreline section behind ladder and sailboat not mapped as “armoring above OHW” because section too short to note (less than 50 linear shoreline feet).
Photo 4 Mainland, South of Dash Point. Unclear whether placed rock.

Field Data Collection
Appendix A of Prioritization of Marine Shorelines of WRIA 9 May 2006 Field Data Collection Report A‐7 030239‐01
Photo 5 West side of Maury Island, Northeast of Dockton. Debris on shore not mapped as armor.
Photo 6 West side of Vashon Island, near Sandford Point. Piles with no bulkhead behind them not mapped as armor.

Field Data Collection
Appendix A of Prioritization of Marine Shorelines of WRIA 9 May 2006 Field Data Collection Report A‐8 030239‐01
1.2.2.2 Groins
During the field survey, groins were defined broadly so as to capture the function
and intent of groin‐like structures in the project area. Groins were mapped as
follows: cross‐shore structures appearing to be groins that were impeding or not
impeding sediment on one side; or cross‐shore structures not intended to be groins
that were impeding sediment on one side. For the purpose of the habitat model,
groins were grouped into categories of “effective” if impeding sediment or “not
effective” if not impeding sediment (e.g., Photos 7 through 9) based on field
conditions. Concrete stairs in general showed little to no evidence of sediment
impediment and thus for the purposes of the model were not mapped as groins (e.g.,
Photo 10).
Photo 7 Vashon Island, North end of Quartermaster Harbor. The buttress-like features shown were characterized as “not effective” groins.

Field Data Collection
Appendix A of Prioritization of Marine Shorelines of WRIA 9 May 2006 Field Data Collection Report A‐9 030239‐01
Photo 8 East side Vashon Island, North of Point Beals. The failed rock groins shown were characterized as “not effective” groins.

Field Data Collection
Appendix A of Prioritization of Marine Shorelines of WRIA 9 May 2006 Field Data Collection Report A‐10 030239‐01
Photo 9 Vashon Island, west side of Quartermaster Harbor. The big rock pile shown was characterized as a “not effective” groin.

Field Data Collection
Appendix A of Prioritization of Marine Shorelines of WRIA 9 May 2006 Field Data Collection Report A‐11 030239‐01
Photo 10 West side of Maury Island, near Manzanita. Concrete stairs in intertidal not mapped as groins.
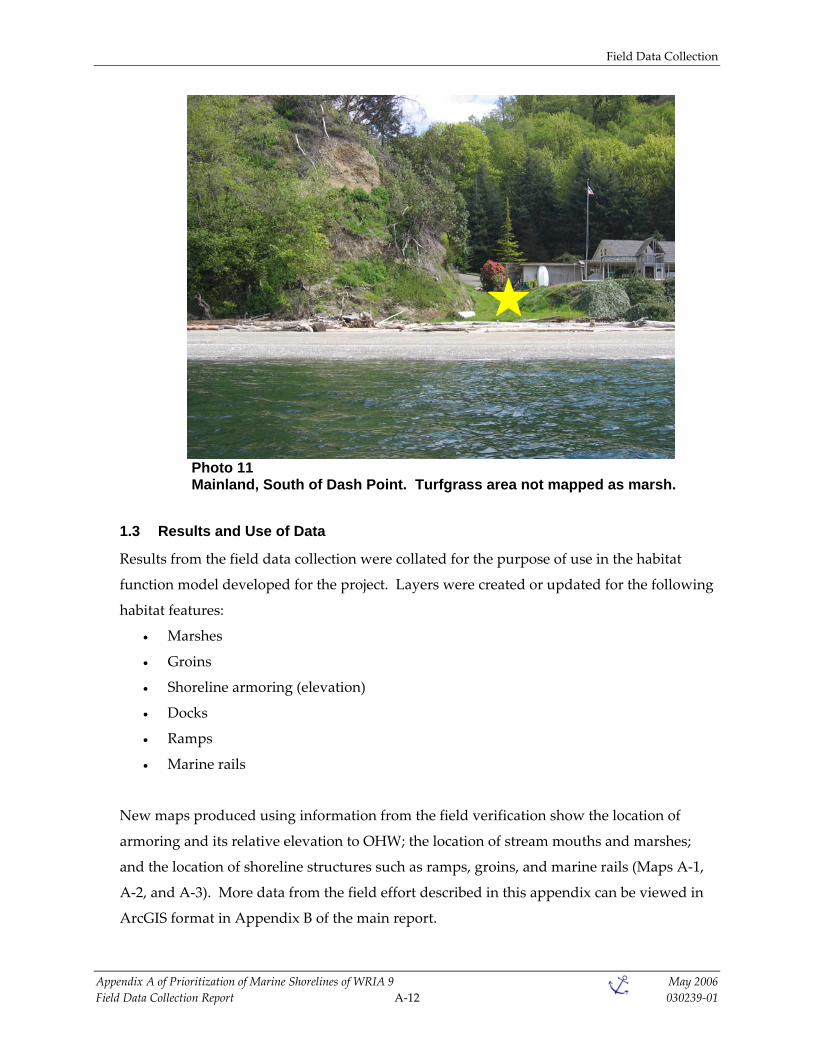
1.2.2.3 Marshes
Some areas in the field survey contained shoreline vegetation that appeared to be
marsh on aerial photos, but upon closer inspection were comprised of turfgrass
growing close to shore. These areas were not mapped, absent marsh vegetation (e.g.,
Photo 11).
Field Data Collection
Appendix A of Prioritization of Marine Shorelines of WRIA 9 May 2006 Field Data Collection Report A‐12 030239‐01
Photo 11 Mainland, South of Dash Point. Turfgrass area not mapped as marsh.
1.3 Results and Use of Data
Results from the field data collection were collated for the purpose of use in the habitat
function model developed for the project. Layers were created or updated for the following
habitat features:
• Marshes
• Groins
• Shoreline armoring (elevation)
• Docks
• Ramps
• Marine rails
New maps produced using information from the field verification show the location of
armoring and its relative elevation to OHW; the location of stream mouths and marshes;
and the location of shoreline structures such as ramps, groins, and marine rails (Maps A‐1,
A‐2, and A‐3). More data from the field effort described in this appendix can be viewed in
ArcGIS format in Appendix B of the main report.
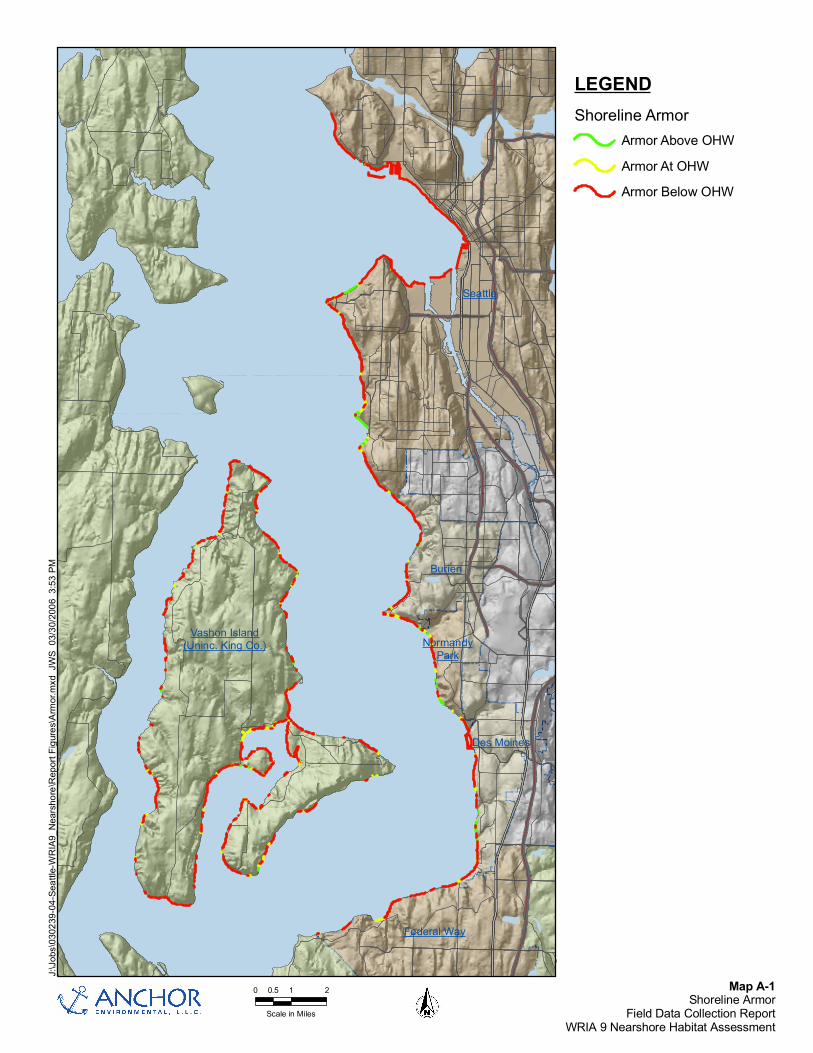
Map A-1Shoreline Armor
Field Data Collection ReportWRIA 9 Nearshore Habitat Assessment
0 1 20.5
Scale in Miles
Vashon Island(Uninc. King Co.)
Seattle
Burien
Federal Way
Des Moines
NormandyPark
J:\Jo
bs\03
0239
-04-S
eattle
-WRI
A9_N
earsh
ore\R
eport
Figu
res\A
rmor.
mxd
JWS
03/30
/2006
3:53
PM
LEGENDShoreline Armor
Armor Above OHWArmor At OHWArmor Below OHW
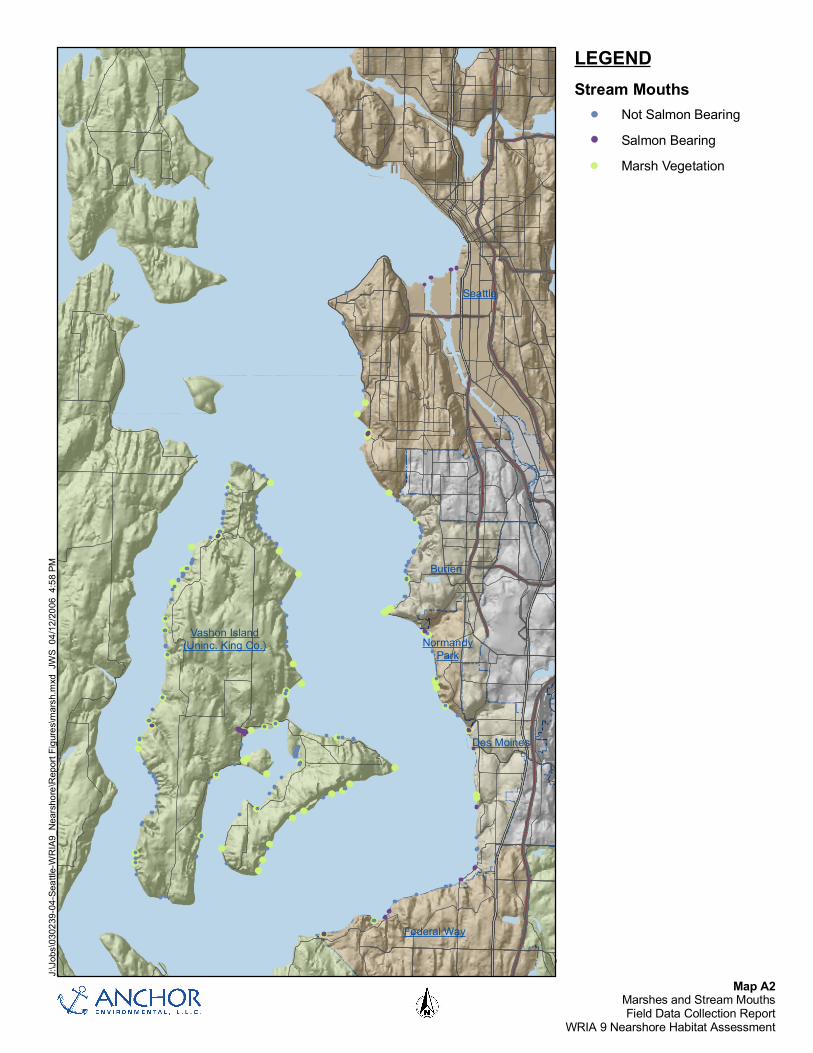
Map A2Marshes and Stream MouthsField Data Collection Report
WRIA 9 Nearshore Habitat Assessment
Vashon Island(Uninc. King Co.)
Seattle
Burien
Federal Way
Des Moines
NormandyPark
J:\Jo
bs\03
0239
-04-S
eattle
-WRI
A9_N
earsh
ore\R
eport
Figu
res\m
arsh.m
xd J
WS
04/12
/2006
4:58
PMLEGENDStream Mouths
Not Salmon BearingSalmon BearingMarsh Vegetation
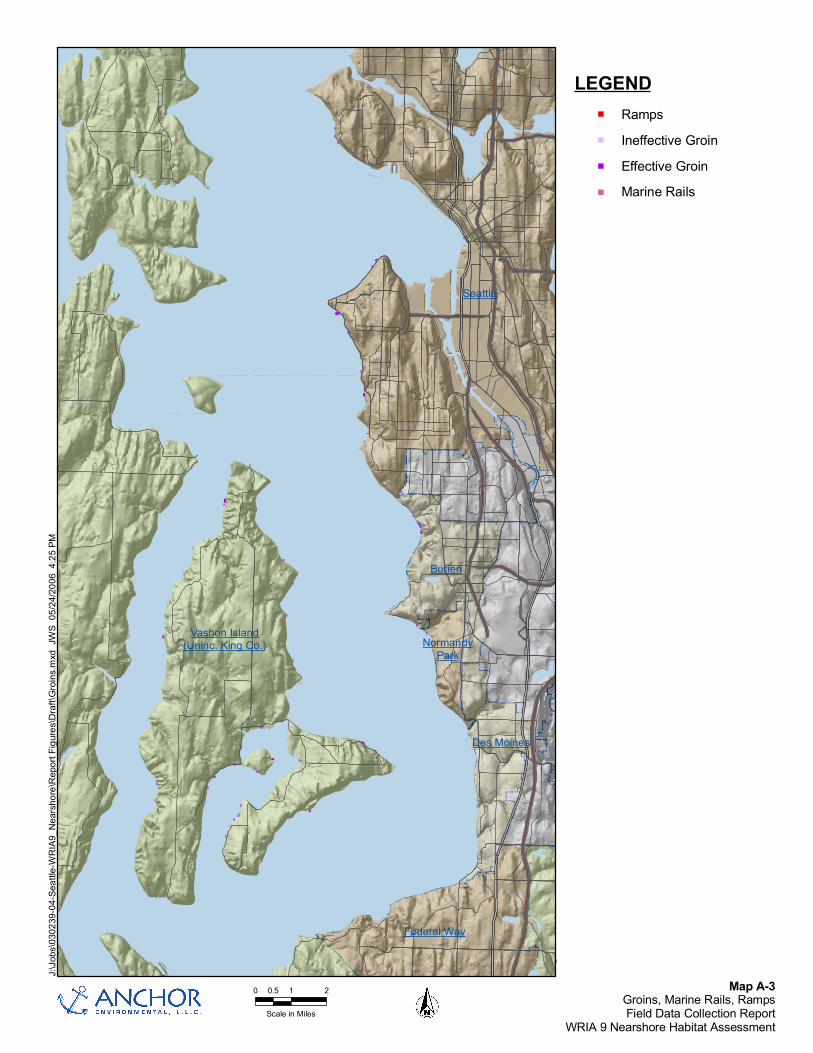
Map A-3Groins, Marine Rails, RampsField Data Collection Report
WRIA 9 Nearshore Habitat Assessment
0 1 20.5
Scale in Miles
Vashon Island(Uninc. King Co.)
Seattle
Burien
Federal Way
Des Moines
NormandyPark
J:\Jo
bs\03
0239
-04-S
eattle
-WRI
A9_N
earsh
ore\R
eport
Figu
res\D
raft\G
roins
.mxd
JW
S 05
/24/20
06 4
:25 PM
LEGENDRampsIneffective GroinEffective GroinMarine Rails

Field Data Collection
Appendix A of Prioritization of Marine Shorelines of WRIA 9 May 2006 Field Data Collection Report A‐16 030239‐01
2 REFERENCES
Anchor Environmental, L.L.C. (Anchor). 2004. Marine Shoreline Inventory Report, WRIA 9.
Prepared for Seattle Public Utilities, WRIA 9. March 2004.

APPENDIX B
FINAL GIS DATA LAYERS (DATA CD)

APPENDIX C
SCORING SYSTEM FOR HABITAT FUNCTION MODEL
Table of Contents
Appendix C of Prioritization of Marine Shorelines of WRIA 9 May 2006 Scoring System for Habitat Function Model C‐i 030239‐01
1 INTRODUCTION................................................................................................................................ 1
2 MODEL FRAMEWORK ..................................................................................................................... 2
3 HABITAT FUNCTION MODEL SCORING SYSTEM ................................................................... 5
4 RATIONALE FOR THE SCORING SYSTEM.................................................................................. 9 4.1 Sediment Supply Shoretype ..................................................................................................... 9 4.2 Obstructions to Longshore Sediment Transport ................................................................... 9 4.3 Aquatic Vegetation .................................................................................................................. 10 4.4 Forage Fish Spawning ............................................................................................................. 10 4.5 Beach Width.............................................................................................................................. 11 4.6 Armor Elevation....................................................................................................................... 11 4.7 Overwater Structures............................................................................................................... 11 4.8 Riparian Vegetation ................................................................................................................. 12 4.9 Marshes...................................................................................................................................... 12
5 REFERENCES .................................................................................................................................... 13 List of Tables Table C‐1 Data Used in the Evaluation of the Ecological Function of Habitats
Table C‐2 Scoring System of Habitat Function Model

Introduction
Appendix C of Prioritization of Marine Shorelines of WRIA 9 May 2006 Scoring System for Habitat Function Model C‐1 030239‐01
1 INTRODUCTION
This appendix presents the scoring system of a habitat function model used to characterize
marine nearshore shoreline reaches in Water Resource Inventory Area 9 (the Green/Duwamish
Watershed; WRIA 9). The habitat function model was one tool used to identify priority areas
for conservation, restoration, rehabilitation, and substitution of habitat for juvenile salmonids
(see main report, titled Prioritization of Marine Shorelines of Water Resource Inventory Area 9 for
Juvenile Salmonid Habitat Protection and Restoration).
The scoring system was developed by the project team with collaboration of scientists from
multiple entities in WRIA 9 to quantify the relative contribution (beneficial or adverse) of each
habitat feature to the overall ecological function of the shoreline for juvenile salmonids. Scores
were assigned relative to one another based on scientific literature pertaining to nearshore
processes and biological research.
Model Framework
Appendix C of Prioritization of Marine Shorelines of WRIA 9 May 2006 Scoring System for Habitat Function Model C‐2 030239‐01
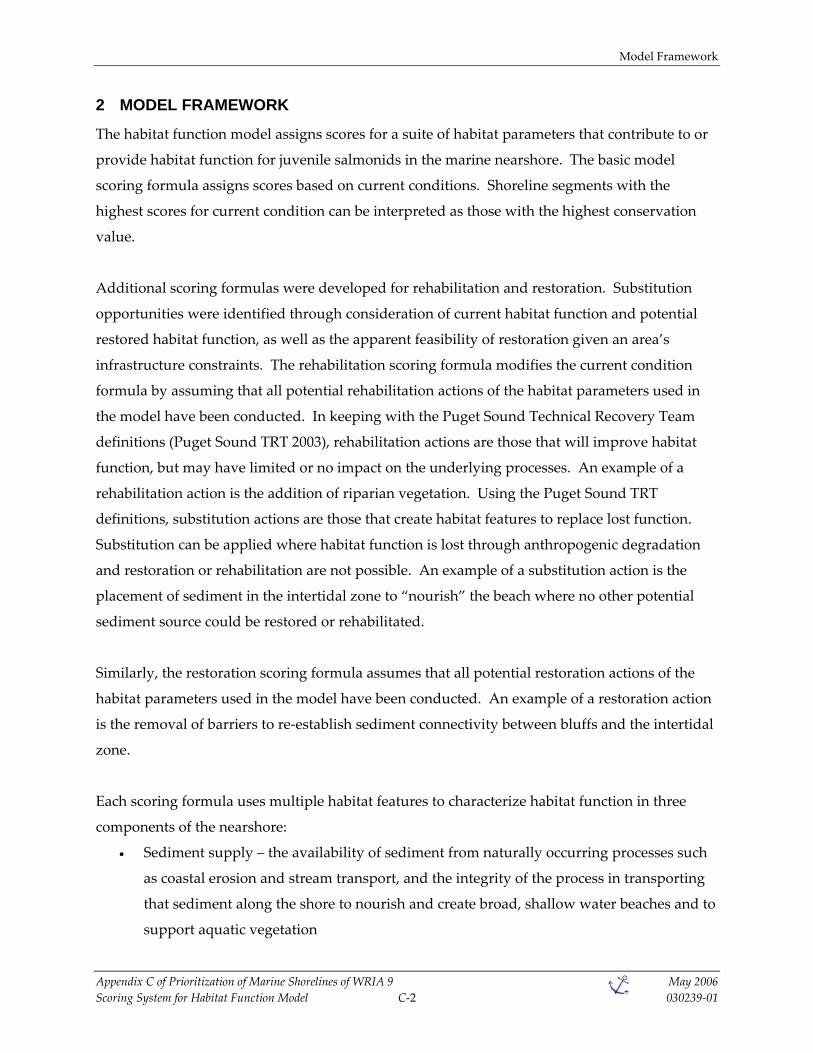
2 MODEL FRAMEWORK
The habitat function model assigns scores for a suite of habitat parameters that contribute to or
provide habitat function for juvenile salmonids in the marine nearshore. The basic model
scoring formula assigns scores based on current conditions. Shoreline segments with the
highest scores for current condition can be interpreted as those with the highest conservation
value.
Additional scoring formulas were developed for rehabilitation and restoration. Substitution
opportunities were identified through consideration of current habitat function and potential
restored habitat function, as well as the apparent feasibility of restoration given an area’s
infrastructure constraints. The rehabilitation scoring formula modifies the current condition
formula by assuming that all potential rehabilitation actions of the habitat parameters used in
the model have been conducted. In keeping with the Puget Sound Technical Recovery Team
definitions (Puget Sound TRT 2003), rehabilitation actions are those that will improve habitat
function, but may have limited or no impact on the underlying processes. An example of a
rehabilitation action is the addition of riparian vegetation. Using the Puget Sound TRT
definitions, substitution actions are those that create habitat features to replace lost function.
Substitution can be applied where habitat function is lost through anthropogenic degradation
and restoration or rehabilitation are not possible. An example of a substitution action is the
placement of sediment in the intertidal zone to “nourish” the beach where no other potential
sediment source could be restored or rehabilitated.
Similarly, the restoration scoring formula assumes that all potential restoration actions of the
habitat parameters used in the model have been conducted. An example of a restoration action
is the removal of barriers to re‐establish sediment connectivity between bluffs and the intertidal
zone.
Each scoring formula uses multiple habitat features to characterize habitat function in three
components of the nearshore:
• Sediment supply – the availability of sediment from naturally occurring processes such
as coastal erosion and stream transport, and the integrity of the process in transporting
that sediment along the shore to nourish and create broad, shallow water beaches and to
support aquatic vegetation

Model Framework
Appendix C of Prioritization of Marine Shorelines of WRIA 9 May 2006 Scoring System for Habitat Function Model C‐3 030239‐01
• Migration corridor – the quality and continuity of the shallow subtidal and intertidal
corridor used by juvenile salmon to migrate along the shore, including the ability of the
corridor to provide refuge from high energy conditions and predators
• Riparian corridor – the quality of the riparian corridor as it influences the availability of
terrestrial or freshwater prey resources and organic matter from the vegetative canopy,
and as it provides shade (cover from predators and protection for spawning forage fish)
The habitat features used in this evaluation were selected for their contribution to providing or
affecting one or more of the essential ecological functions for juvenile salmonids (see main
report). Table C‐1 identifies the habitat features and descriptors used to characterize the three
nearshore components. Data sources were selected for their ability to provide coverage of the
entire study area and to describe the structure and process of the nearshore habitat in terms of
the ecological function that habitat provides to juvenile salmon.
Data were input into the model and snapped to the topology of the Mean Higher High Water
line of the shoreline modified from the ShoreZone Inventory of Washington (WDNR 2001).
Discrete shoreline segments were created by inserting a line break at the point that any feature
or attribute of the data changed. Each shoreline segment was given a discrete score for current
habitat function. The resulting output was a single polyline shapefile with segments of varying
lengths and current function scores, each of which represented a homogeneous condition in
relation to all the data describing that segment’s habitat function.

Model Framework
Appendix C of Prioritization of Marine Shorelines of WRIA 9 May 2006 Scoring System for Habitat Function Model C‐4 030239‐01
Table C-1 Data Used in the Evaluation of the Ecological Function of Habitats
Nearshore
Component Habitat Feature Habitat Feature Descriptor Data Source
Shore type (including consideration of shoreline armoring [e.g., bulkheads, rock riprap, and seawalls])
Sediment process shore type
Johannessen et al. (2005) with additional armor
information from Anchor (2004)
Sediment Supply
Obstructions to longshore sediment transport
Presence of groins, boat ramps, and marine rails
Anchor (Appendix A, main report)
Aquatic vegetation Presence of eelgrass, macroalgae, or kelp ShoreZone (WDNR 2001)
Forage fish spawning Documented forage fish spawning
Priority Habitats and Species Data (provided by King County, 2003, from
WDFW 2003) Beach width Intertidal beach slope ShoreZone (WDNR 2001)
Shoreline armor in intertidal zone Shoreline armor toe depth Anchor (Appendix A, main
report)
Migration Corridor
Overwater structures Presence of piers, docks, or houses over the water Anchor (2004)
Riparian vegetation
Condition of riparian vegetation, including
vegetation type, location, and continuity
Anchor (2004)
Marshes Presence of supratidal salt marsh
Anchor (Appendix A, main report) Riparian
Corridor
Stream mouths
Location and condition (e.g., piped, armored, unarmored) of stream mouths and use of
stream for spawning by anadromous salmonids
King County (2004), Johannessen et al. (2005), Washington Trout (2001), Anchor (Appendix A, main
report)

Habitat Function Model Scoring System
Appendix C of Prioritization of Marine Shorelines of WRIA 9 May 2006 Scoring System for Habitat Function Model C‐5 030239‐01
3 HABITAT FUNCTION MODEL SCORING SYSTEM
Table C‐2 presents the scoring system used to characterize current conditions, rehabilitated
conditions, and restored conditions. The rehabilitation scoring formula assumes that the
following improvements can be made:
• Obstructions to longshore transport (groins, boatramps, and marine rails) are removed1
• Shoreline armoring elevation is improved such that armoring currently below ordinary
high water (OHW) is moved to OHW and armoring at OHW is moved above OHW
• Overwater structures (docks, piers, and houses) are removed
• Riparian vegetation is improved to provide patchy trees adjacent to the intertidal zone,
if current conditions provide less function
• Stream mouth conditions are improved such that currently piped stream mouths are
daylighted to become armored and currently armored stream mouths become
unarmored
The restoration scoring formula assumes that the following improvements can be made:
• Sediment supply connectivity is restored through removal of shoreline armor and
historic shoretypes are re‐established
• Obstructions to longshore transport (groins, boatramps, and marine rails) are removed
• Overwater structures (docks, piers, and houses) are removed
• Riparian vegetation is improved to provide continuous trees adjacent to and
overhanging the intertidal zone with large woody debris (LWD) across the intertidal
zone in all areas
• All stream mouth modifications (pipes and armoring) are removed
• Marsh conditions are improved from patchy to continuous
Rehabilitation potential was calculated for each segment as the difference between the
rehabilitation score and the current function score. Similarly, restoration potential was
calculated for each segment as the difference between the restoration score and the current
function score.
1 In general, marine rails in the nearshore can be designed to minimize impacts to longshore sediment transport and reflected wave energy (and can more easily be designed to do so than boat ramps). However, in a rehabilitation scenario, the recommendation includes removing marine rails because of their presence as a physical structure in the nearshore and their general potential to impede sediment.

Habitat Function Model Scoring System
Appendix C of Prioritization of Marine Shorelines of WRIA 9 May 2006 Scoring System for Habitat Function Model C‐6 030239‐01
Table C-2 Scoring System of Habitat Function Model
Nearshore
Component Current Conditions Rehabilitated Conditions Restored Conditions
Formula Shoretype * (1 - Obstructions to longshore transport) Current Shoretype per Johannessen et
al. (2005) FBE = 35 FB = 30 AS = 15 TA = 5
NAD = 0 MOD = 0
and if Anchor (2004) armoring.shp indicates armor is present then MOD
score applied
Current Shoretype per Johannessen et al. (2005) FBE = 35 FB = 30 AS = 15 TA = 5
NAD = 0 MOD = 0
and if Anchor (2004) armoring.shp indicates armor is present then MOD
score applied
Historic Shoretype per Johannessen et al. (2005) FBE = 35 FB = 30 AS = 15 TA = 5
PFB = 5 NFB = 5 NAD = 0
Sediment
Supply Contributing
Habitat Features Obstructions within 0.6 miles downdrift
per Anchor (2004) and Anchor (Appendix A, main report)
Number of effective groins + (0.5 * number of ineffective groins, boat ramps,
marine rails) none = 0.0 1 to 5 = 0.1
5 or more = 0.2
Assumes all groins, boat ramps, and marine rails have been removed, so
score = 0.0
Assumes all groins, boat ramps, and marine rails have been removed, so
score = 0.0

Habitat Function Model Scoring System
Appendix C of Prioritization of Marine Shorelines of WRIA 9 May 2006 Scoring System for Habitat Function Model C‐7 030239‐01
Nearshore Component
Current Conditions Rehabilitated Conditions Restored Conditions
Formula Aquatic vegetation + Forage fish + (Beach width * (1 – (Armor elevation + Overwater structures))) Aquatic vegetation score is highest
single value of the following per WDNR (2001):
Eelgrass continuous = 15 Eelgrass patchy = 10
Macroalgae (CHB, GCA, MAC, NER, RED, SAR, SBR) continuous = 10
Macroalgae patchy = 5 Ulva continuous = 5
Ulva patchy = 2
Score is highest single value of the following per WNDR (2001):
Eelgrass continuous = 15 Eelgrass patchy = 10
Macroalgae (CHB, GCA, MAC, NER, RED, SAR, SBR) continuous = 10
Macroalgae patchy = 5 Ulva continuous = 5
Ulva patchy = 2
Score is highest single value of the following per WNDR (2001):
Eelgrass continuous = 15 Eelgrass patchy = 10
Macroalgae (CHB, GCA, MAC, NER, RED, SAR, SBR) continuous = 10
Macroalgae patchy = 5 Ulva continuous = 5
Ulva patchy = 2
Forage fish per WDFW (2003) Spawning documented = 5
No spawning documented = 0
Forage fish per WDFW (2003) Spawning documented = 5
No spawning documented = 0
Forage fish per WDFW (2003) Spawning documented = 5
No spawning documented = 0 Beach slope per WDNR (2001)
Slope less than 5o (BC_Class 24, 26, 28, or 29) = 10
Slope more than 5o (BC_Class 22, 25, 27, or 30) = 9
Man made (BC_Class 32 or 33) = 2
Beach slope per WDNR (2001) Slope less than 5o (BC_Class 24, 26, 28,
or 29) = 10 Slope more than 5o (BC_Class 22, 25,
27, or 30) = 9 Man made (BC_Class 32 or 33) = 2
Beach slope per WDNR (2001) Slope less than 5o (BC_Class 24, 26, 28,
or 29) = 10 Slope more than 5o (BC_Class 22, 25,
27, or 30) = 9 Man made (BC_Class 32 or 33) = 2
Current armor elevation per Anchor (Appendix A, main report)
No armor or elevation above OHW = 0.0 At OHW = 0.1
Below OHW = 0.3
Current armor elevation per Anchor (Appendix A, main report)
No armor or elevation above OHW = 0.0 Assumes armor currently at OHW is moved above OHW, so score = 0.0
Assumes armor currently below OHW is move to at OHW, so score = 0.1
Current armor elevation per Anchor (Appendix A, main report)
Assumes all armor is removed, so score = 0.0
Migration Corridor
Contributing Habitat
Features
Current overwater structures per Anchor (2004)
None present = 0.0 Present with total width < 20 ft = 0.2 Present with total width ≥ 20 ft = 0.4
Assumes all overwater structures are removed, so score = 0.0
Assumes all overwater structures are removed, so score = 0.0

Habitat Function Model Scoring System
Appendix C of Prioritization of Marine Shorelines of WRIA 9 May 2006 Scoring System for Habitat Function Model C‐8 030239‐01
Nearshore Component
Current Conditions Rehabilitated Conditions Restored Conditions
Formula Riparian vegetation + Marsh + (Streams * (1 - stream mouth condition))
Riparian vegetation per Anchor (2004) sum of the following
Type: trees = 3, shrubs = 1, grass = 0 Proximity to intertidal: adjacent =1,
separated = 0 Overhanging intertidal: yes = 2, no = 0
Density: continuous = 2, patchy = 1 LWD: yes = 2, no = 0
Riparian vegetation per Anchor (2004) sum of the following
Assumes areas with current riparian vegetation other than trees are improved
to having patchy trees adjacent to the intertidal, so score = 5
Areas with current riparian vegetation of continuous trees adjacent to intertidal
would still receive a score = 6 Overhanging intertidal: yes = 2, no = 0
LWD: yes = 2, no = 0
Riparian vegetation per Anchor (2004) sum of the following
Assumes all areas are improved to provide continuous trees adjacent to and
overhanging the intertidal zone and having LWD, so score = 10
Marshes per Anchor (Appendix A, main report)
Continuous marsh at AS = 10 Continuous marsh not at AS = 5
Patchy marsh at AS = 5 Patchy marsh not at AS = 2
No marsh = 0
Marshes per Anchor (Appendix A, main report)
Continuous marsh at AS = 10 Continuous marsh not at AS = 5
Patchy marsh at AS = 5 Patchy marsh not at AS = 2
No marsh = 0
Marshes per Anchor (Appendix A, main report)
Assumes all marshes become continuous, so current condition Continuous marsh at accretion
shoreform (AS) = 10 Continuous marsh not at AS = 5
Patchy marsh at AS = 10 Patchy marsh not at AS = 5
No marsh = 0 Stream mouths per Anchor (Appendix A,
main report) Salmon stream within 100 feet = 10
Non-salmon stream within 25 feet = 2
Stream mouths per Anchor (Appendix A, main report)
Salmon stream within 100 feet = 10 Non-salmon stream within 25 feet = 2
Stream mouths per Anchor (Appendix A, main report)
Salmon stream within 100 feet = 10 Non-salmon stream within 25 feet = 2
Riparian Contributing Habitat
Features
Stream mouth condition per King County (2004), Johannessen et al. (2005), Washington Trout (2001), Anchor
(Appendix A, this volume) Unarmored = 0.0
Armored = 0.3 Piped = 0.9
Stream mouth condition per King County (2004), Johannessen et al. (2005), Washington Trout (2001), Anchor
(Appendix A, this volume) Assumes currently armored stream
mouths are improved to be unarmored, so score = 0.0
Assumes currently piped streams are improved to be only armored, so score =
0.3
Assumes all stream mouths are improved to be unarmored, so score =
0.0
FBE = feeder bluff exceptional PFB = potential feeder bluff RED = Gigartina-Odonthalia-Prionitis-Polysiphonia and others FB = feeder bluff NFB = not feeder bluff SAR = Sargassum AS = accretion shoreform CHB = chocolate browns SBR = soft browns TA = transition area GCA = Gracilaria NAD = no appreciable drift MAC = Macrocystis MOD = modified NER = Nereocystis (kelp)

Rationale for the Scoring System
Appendix C of Prioritization of Marine Shorelines of WRIA 9 May 2006 Scoring System for Habitat Function Model C‐9 030239‐01
4 RATIONALE FOR THE SCORING SYSTEM
This section describes the information used to determine which habitat features to use in the
model and the justification for the scoring system. It is important to note that habitat feature
selection also required the availability of a consistent dataset for the entire project area.
4.1 Sediment Supply Shoretype
The introduction, movement, and deposition of sediment to the marine nearshore of Puget
Sound is a major habitat‐forming and habitat sustaining process (Shared Strategy 2005). A
key source of sediment to the intertidal zone is through the natural erosion of bluffs.
Through the movement of sediment along a beach in sectors called drift cells, a sediment
source area (feeder bluff) can provide sediment that feeds the beach over many miles.
Shoreline armoring, such as bulkheads, disconnects potential sediment sources from the
intertidal zone and through the interruption of the sediment supply can impact beach
function over many miles (depending on the size of the drift cell).
The scoring system was developed to emphasize the importance of feeder bluffs as sediment
sources and add even greater importance to areas identified by Johannessen et al. (2005) as
exceptional feeder bluffs. Accretion shoreforms that are the landform created by the
sediment deposition at the downdrift end of a drift cell were given a moderate score. Large,
intact accretion shoreforms can provide lagoons and pocket estuaries that provide high
quality habitat for juvenile salmon rearing (Hirschi et al. 2003; Beamer et al. 2003). Modified
shorelines disconnect shorelines or provide altered transport or depositional conditions, so
no score was assigned.
4.2 Obstructions to Longshore Sediment Transport
Shoreline alterations that obstruct the movement of sediment along the beach can impact the
supply of sediment to downdrift areas (Ecology 2006). Alterations, such as groins, are
intentionally built to restrict sediment movement. The interruption of sediment transport is
an indirect effect of shoreline alterations such as boat ramps and groins, and to a lesser
degree, marine rails.
The range of impact that groins may have is estimated at 0.6 mile (1 kilometer); that is, a
groin within 0.6 miles downdrift of a sediment supply was considered to reduce the

Rationale for the Scoring System
Appendix C of Prioritization of Marine Shorelines of WRIA 9 May 2006 Scoring System for Habitat Function Model C‐10 030239‐01
sediment supply’s contribution to nearshore habitat function. This distance was estimated
using best professional judgment as to a reasonable length of shoreline that may be affected
by the presence of a groin located “updrift” in the drift cell.
4.3 Aquatic Vegetation
The importance of eelgrass in the marine nearshore is well documented (e.g., Simenstad et
al. 1982; Thom 1985; Williams et al. 2001). Eelgrass productivity exceeds that of most other
aquatic vegetation, and the organic carbon produced by eelgrass is particularly important in
driving the nearshore food web (Williams et al. 2001). Eelgrass also provides vertical
structure that can provide predator refuge for juvenile salmonids.
Other types of aquatic vegetation, such as macroalgae and kelp, can provide similar
functions. Kelp and macroalgae support productive prey communities for juvenile
salmonids by providing material for grazing by epibenthic prey communities (Northcote et
al. 1979; Healey 1982; Brennan et al. 2004). Intertidal vegetation also provides vertical
structure that can provide predator refuge for juvenile salmonids. Juvenile chum have been
observed using vegetation as a refuge from predators (Tompkins and Leving 1991).
The many types of kelp and macroalgae found in the project area were grouped together
because there was not sufficient information to differentiate between the values of the
vegetation types for juvenile salmonids. Ulva was excluded from this group of kelp and
macroalgae and not scored in the model because it was ubiquitous in the project area and
would therefore decrease the contribution of the aquatic vegetation parameter to habitat
function. The potential negative effects of an overabundance of Ulva, such as changes to
benthic macroinvertebrate communities and prevention of larval settlement (Frankenstein
2000), also were considered in excluding it from the scoring system.
4.4 Forage Fish Spawning
The importance of forage fish in the diets of juvenile salmonids is well documented (e.g.,
Bargmann 1998; Healey 1980). However, much of the forage fish spawning survey data in
the Washington Department of Fish and Wildlife (WDFW) database is approximately 30
years old and may no longer be applicable. The questionable quality of the existing
database was the basis for assigning a lower score to the presence of forage fish spawning
compared to other parameters in the model.

Rationale for the Scoring System
Appendix C of Prioritization of Marine Shorelines of WRIA 9 May 2006 Scoring System for Habitat Function Model C‐11 030239‐01
4.5 Beach Width
Beach width and beach slope affect the area of the highly productive intertidal and shallow
subtidal elevations that provide food and shelter for juvenile salmon. Areas with less than
5° slope were assigned a slightly higher score than areas with greater than 5° slope to
account for the larger amount of shallow water habitat available in the lower gradient
beaches. Man‐made areas are those with no natural substrate in the intertidal zone, and
were typically dredged areas providing steep intertidal slopes and little intertidal habitat.
4.6 Armor Elevation
Shoreline structures that encroach upon the intertidal zone can impede forage fish access to
the upper intertidal beach elevations where they spawn, thus limiting food resource
availability for juvenile salmonids. In addition, shoreline armoring restricts juvenile
salmonid access to gently sloping upper intertidal beach habitats that larger predators
cannot access. These shoreline structures force juvenile salmonids to move along shorelines
in deeper areas than they ideally would, and where they may be more vulnerable to
predation (Thom et al. 1994; Pentec 1997). Even in areas where the shoreline armoring does
not encroach across the entire upper intertidal zone, the structures tend to reflect wave
energy, which causes scour of smaller substrate sizes utilized by forage fish and exacerbates
the interruption to sediment transport caused by the structures (Williams and Thom 2001).
4.7 Overwater Structures
Overwater structures, such as docks, can have negative behavioral effects on juvenile
salmonids that interrupt their migration and movements along the shoreline (Salo et al.
1980; Pentec 1997; Simenstad et al. 1999; Thom et al. 2006). Overwater structures can also
reduce prey availability through the negative impacts on vegetation caused by the lack of
light (Penttila and Doty 1990; Fresh et al. 1995; Olson et al. 1996; Haas et al. 2002). The
location and width of overwater structures was determined by snapping the polygon shape
of each structure to the shoreline. Portions of the shoreline that were intersected by the
snapped polygon were considered to have overwater structure, the length of the
intersection was considered to be the width of the overwater structure.

Rationale for the Scoring System
Appendix C of Prioritization of Marine Shorelines of WRIA 9 May 2006 Scoring System for Habitat Function Model C‐12 030239‐01
4.8 Riparian Vegetation
Riparian vegetation provides the most direct link between terrestrial and aquatic ecosystems
(Spence et al. 1996; Levings and Jameson 2001). Riparian vegetation, especially overhanging
portions, is an important source for terrestrial input of organic matter and nutrients (Spence
et al. 1996; Maser and Sedell 1994; Williams et al. 2001; Brennan et al. 2004; Brennan and
Culverwell 2004).
Overhanging riparian vegetation can limit the vulnerability of juvenile salmonids to bird
predators by providing shallow areas where flying birds cannot see them. Shallow water
areas with cover also provide refuge habitat from larger fish predators.
4.9 Marshes
Juvenile salmonids have been documented to extensively use marsh areas (Simenstad et al.
1982; Healey 1980 and 1982; Levy and Northcote 1981). Marsh habitats are high functioning
areas that support primary productivity, the detrital food web, and juvenile salmonid prey
production (Levings et al. 1991; Williams et al. 2001).
Juvenile salmonids can utilize marsh habitats as refuge from predators. The smaller fish can
move among the marsh vegetation better than their larger potential predators. Simenstad et
al. (1999) noted that juvenile salmon in the nearshore prefer to migrate along the edges of
refugia.

References
Appendix C of Prioritization of Marine Shorelines of WRIA 9 May 2006 Scoring System for Habitat Function Model C‐13 030239‐01
5 REFERENCES
Anchor Environmental, L.L.C. (Anchor). 2004. Marine Shoreline Inventory Report, WRIA 9.
Prepared for Seattle Public Utilities, WRIA 9. March 2004.
Bargmann, G. 1998. Forage Fish Management Plan. Washington Department of Fish and
Wildlife. 65pp.
Beamer, E., A. McBride, R. Henderson, and K. Wolf. 2003. The importance of non‐natal pocket
estuaries in Skagit Bay to wild chinook salmon: an emerging priority for restoration.
Skagit System Cooperative Research Department, La Conner, WA 98257‐0368.
Brennan, J.S., and H. Culverwell. 2004. Marine Riparian: An Assessment of Riparian Functions
in Marine Ecosystems. Published by Washington Sea Grant Program. Seattle, WA.
Brennan, J.S., K.F. Higgins, J.R. Cordell, and V.A. Stamatiou. 2004. Juvenile Salmon
Composition, Timing, Distribution, and Diet in Marine Nearshore Waters of Central
Puget Sound, 2001‐2002. King County Department of Natural Resources and Parks,
Seattle, WA. 164 pp.
Frankenstein, G. 2000. Blooms of Ulvoids in Puget Sound. Prepared for the Puget Sound
Water Quality Action Team. November 2000.
Fresh, K.L., B. Williams, and D. Penttila. 1995. Overwater structures and impacts on eelgrass
(Zostera marina) in Puget Sound, Washington. Pages 537‐577 in Puget Sound Research
’95 Proceedings. Puget Sound Water Quality Authority, Olympia, Washington.
Haas, M.E., C.A. Simenstad, J.R. Cordell, D.A. Beauchamp, and B.S. Miller. 2002. Effects of Large
Overwater Structures on Epibenthic Juvenile Salmon Prey Assemblages in Puget Sound,
Washington. Technical Report T1803‐30, School of Aquatic and Fishery Sciences,
University of Washington. Prepared for Washington State department of Transportation
(WSDOT).

References
Appendix C of Prioritization of Marine Shorelines of WRIA 9 May 2006 Scoring System for Habitat Function Model C‐14 030239‐01
Healey, M.C. 1980. Utilization of the Nanaimo River estuary by juvenile chinook salmon,
Oncorhynchus tshawytscha. Fish. Bull. 77(3): 653‐668.
Healey, M.C. 1982. Juvenile Pacific Salmon in estuaries: the life support system. Pages 315‐341
in Kennedy, V. S. editor. Estuarine comparison, Academic Press, New York, New York.
Hirschi, R., T. Doty, A. Keller, and T. Labbe. 2003. Juvenile salmonid use of tidal creek and
independent marsh environments in north Hood Canal: summary of first year findings.
Port Gamble S’Klallam Tribe Natural Resources.
Johannessen, J., A. MacLennan, and A. McBride. 2005. Inventory and Assessment of Current
and Historic Beach Feeding Sources/Erosion and Accretion areas for the Marine
Shorelines of Water Resource Inventory Areas 8 and 9. Prepared for The WRIA 9
Steering Committee and King County Department of Natural Resources and Parks.
Prepared by Coastal Geologic Services Inc., Bellingham, WA. December 2005.
King County. 2004. King County GIS Data, CD#3, Standard Data, Shapefile Format, Issued
March 2004.
Levings. C.D., K. Conlin and B. Raymond. 1991. Intertidal habitats used by juvenile Pacific
salmon rearing in the north arm of the Fraser River estuary. Marine Pollution Bulletin,
Volume 22, No 1 pp 20‐26.
Levings, C. and G. Jamieson. 2001. Marine and estuarine riparian habitats and their role in
coastal ecosystems, Pacific region. Canadian Science Advisory Secretariat, Research
Document 2001/109. 41pp.
Levy, T. A. and T.G. Northcote. 1981. The distribution and abundance of juvenile salmon in
marsh habitats of the Fraser River Estuary. University of British Columbia, Westwater
Research Center, Technical Report 25, Vancouver, British Columbia.
Maser, C. and J.R. Sedell. 1994. From the forest to the sea, the ecology of wood in streams,
river, estuaries, and oceans. St. Lucie Press, Delray Beach, Florida.

References
Appendix C of Prioritization of Marine Shorelines of WRIA 9 May 2006 Scoring System for Habitat Function Model C‐15 030239‐01
Northcote, T.G., N.T. Johnston and K. Tsumura. 1979. Feeding relationships and food web
structure of Lower Framer River fishes. Technical Report No. 16. Vancouver: Westwater
Research Centre, University of British Columbia
Novotny, V., and H. Olem. 1994. Water Quality: Prevention, Identification, and Management
of Diffuse Pollution. Van Nostrand Reinhold. New York, NY.
Olson, A.M., S. D. Visconty, and C. M. Sweeny. 1996. A new approach to modeling the shade
cast by overwater structures. Abstract for the Pacific Estuarine Research Society 19th
Annual Meeting. Washington Department of Ecology, Olympia, WA.
Pentec. 1997. Movement of juvenile salmon through industrialized areas of Everett Harbor.
Prepared for the Port of Everett, Washington. Prepared by Pentec Environmental,
Edmonds, WA.
Penttila D. and D. Doty. 1990. Results of 1989 eelgrass shading studies in Puget Sound.
Progress Report. Marine Fish Habitat Investigation Division, Washington Department
of Fish and Wildlife. Olympia, Washington.
Puget Sound Technical Recovery Team (Puget Sound TRT). 2003. Integrated Recovery
Planning for Listed Salon: Technical Guidance for Watershed Groups in Puget Sound.
Salo, E.O., N.J. Bax, T.E. Prinslow, C.J. Whitmus, B.P. Snyder, and C.A. Simenstad. 1980. The
effects of construction of naval facilitied on the outmigration of juvenile salmonids from
Hood Canal, Washington. Final Rep., Fish. Res. Inst., University of Washington, Seattle,
WA. FRI‐UW‐8006. 159 pp.
Shared Strategy. 2005. Redman, S., D. Myers, and D. Averill. Regional Nearshore and Marine
Aspects of Salmon Recovery in Puget Sound. Delivered to Shared Strategy for Puget
Sound for inclusion in their regional salmon recovery plan. June 28, 2005.

References
Appendix C of Prioritization of Marine Shorelines of WRIA 9 May 2006 Scoring System for Habitat Function Model C‐16 030239‐01
Simenstad, C. A., B. S. Miller, C.F. Nyblade, K. Thornburgh, and L.J. Bledsoe. 1999. Impacts of
ferry terminals on juvenile salmon migration along Puget Sound shorelines, phase I,
synthesis of state knowledge. Prepared for the Washington State Transportation
Commission, Research Project T99903, Task A2, Olympia.
Simenstad, C. A., K. L. Fresh, and E. O. Salo. 1982. The role of Puget Sound and Washington
coastal estuaries in the life history of Pacific salmon: An unappreciated function. In: V.S.
Kennedy [ed] Estuarine Comparisons. pp.343‐365. Academic Press, Toronto.
Spence, B. C., G. A. Lomnicky, R. M. Hughes, and R. P. Novitzki. 1996. An ecosystem approach
to salmonid conservation. TR‐4501‐96‐6057. ManTech Environmental Research Services
Corp., Corvallis, OR.
Thom, R. M. 1985. An oceanographic analysis of odorous beach conditions in Fauntleroy Cove,
West Seattle. Report submitted to the City of Seattle.
Thom, R. M., D. K. Shreffler, and K. B. Macdonald. 1994. Shoreline armoring effects on coastal
ecology and biological resources in Puget Sound. Coastal Erosion Management Studies,
Volume 7. Shorelands and Coastal Zone Management Program, Washington
Department of Ecology, Olympia, Washington.
Thom, R.M., G.D. Williams, and seven authors. 2006. Impacts of Ferry Terminals and Ferry
Operations on Juvenile Salmon Migrating Along Puget Sound Shorelines. Prepared for
the Washington State Department of Transportation. Prepared by Battelle Memorial
Institute Pacific Northwest Division (PNWD‐3647). March 2006.
Tompkins, A. and C.D. Leving. 1991. Interspecific interactions affecting the survival of chum
salmon fry. P. 29‐36. In: Proceedings 1991 Pink and Chum Workshop, Parksville, B.C.
February 27‐March 1, 1991. Department of Fisheries and Oceans and Pacific Salmon
Commission, Vancouver, B.C.
Washington Department of Fish and Wildlife (WDFW). 2003. Priority Habitats and Species
Report. WDFW Office, Olympia, Washington.
References
Appendix C of Prioritization of Marine Shorelines of WRIA 9 May 2006 Scoring System for Habitat Function Model C‐17 030239‐01
Washington Department of Natural Resources (WDNR). 2001. Nearshore Habitat Program.
The Washington State ShoreZone Inventory. CD‐ROM. Olympia, WA. Available at
http://www2.wadnr.gov/nearshore/data/ .
Washington State Department of Ecology (Ecology). 2006. Shoreline Inventory Analysis on the
Shoreline Management Act website.
http://www.ecy.wa.gov/programs/sea/sma/st_guide/SMP/inven_analysis/analysis/eco_f
unctions/marine/types/all_m_shore_types.html. Washington Department of Ecology.
Washington Trout. 2001. Water Type and Stream Mouth Assessment. Vashon Island. June/July
2001. Information available at:
http://www.washingtontrout.org/Vashon/Vashon2001/VashonTitle.shtml .
Williams, G.D., R.M. Thom, J.E. Starkes, and 14 authors. 2001. Reconnaissance Assessment of
the State of the Nearshore Ecosystem: Eastern Shore of Central Puget Sound, Including
Vashon and Maury Islands (WRIAs 8 and 9). J.S. Brennan, Editor. Report prepared for
King County Department of Natural Resources, Seattle, Washington.
Williams, G.D. and R.M. Thom. 2001. White Paper: Marine and Estuarine Shoreline
Modification Issues. Submitted to Washington Department of Fish and Wildlife,
Washington Department of Ecology, and Washington Department of Transportation.