Embed Size (px)
Citation preview
Wise, S. W., Jr., Schlich, R., et al., 1992Proceedings of the Ocean Drilling Program, Scientific Results, Vol. 120
15. HIGH SOUTHERN LATITUDE MAGNETOSTRATIGRAPHY AND ROCK MAGNETICPROPERTIES OF SEDIMENTS FROM SITES 747, 749, AND 7511
Franz Heider,23 Beate Leitner,3 arid Hiroo Inokuchi4
ABSTRACT
The magnetostratigraphy of Sites 747, 749, and 751 of Leg 120 that was established by shipboard measurementswas extended and confirmed. Five hundred and eighty sediment cubes were stepwise demagnetized with alternatingfields to determine their characteristic remanence. We obtained a rather complete magnetostratigraphy from theOligocene to the Pliocene for the nannofossil oozes of Site 747. Alternating-field demagnetization experiments onlaboratory-induced magnetization, hysteresis measurements, and low-temperature experiments showed that themagnetic carriers are single-domain and small pseudo-single-domain (titano)magnetite particles. A fraction of theseFe-Ti oxides seems to reside as microlites in the vitric volcanic ash particles that were enriched in the magneticseparates. The natural remanent magnetizations seem to be of detrital origin with small Fe-Ti oxide grains in thevolcanic glass particles as carriers of the stable paleomagnetic signal.
INTRODUCTION
The objective of Ocean Drilling Program (ODP) Leg 120was to investigate the origin and tectonic history of theKerguelen Plateau in the South Indian Ocean. The magneto-stratigraphy of the cored sediments was determined so that wecould accurately date the biostratigraphic events. One aim ofour study was to contribute to a combined magnetobiostratig-raphy in high southern latitudes (Harwood et al., this volume;Berggren et al., this volume). In this paper we present resultsobtained from the single sediment samples of Sites 747, 749,and 751. The results from Sites 748 and 750 are describedelsewhere (Inokuchi et al., this volume). The cores describedhere were recovered with the advanced hydraulic piston corer(APC) and the extended core barrel (XCB). The best paleo-magnetic results were obtained on the generally well-pre-served APC cores, as was previously found by Sager (1988).
During Leg 120 a preliminary magnetostratigraphy wasdetermined with the cryogenic magnetometer on the JOIDESResolution using split 1.5-m-long sections of the core. Theshipboard magnetometer worked extremely well, comparedwith previous legs, and a record of declination, inclination,and intensity of magnetization was obtained from all undis-turbed cores. Nevertheless, the maximum alternating field(AF) that was available for demagnetization of the coresduring the cruise was 9 mT. We had previously noticed thatthe magnetostratigraphic record became more similar to thestandard polarity reversal sequence following removal of anormal overprint with the available 9-mT AF treatment(Schlich, Wise, et al., 1989). The question remained whetherthe 9-mT AF demagnetization was sufficient to isolate thecharacteristic inclinations, especially since some inclinationsmeasured on board the ship were much shallower than the 72°expected for the high-latitude location.
1 Wise, S. W., Jr., Schlich, R., 1992. Proc. ODP, Sci. Results, 120: CollegeStation, TX (Ocean Drilling Program).
Geophysics Laboratory, Department of Physics, University of Toronto,Toronto, Ontario, M5S 1A7, Canada.
3 Institut für Allgemeine und Angewandte Geophysik, Ludwig-Maximilians-Universitàt, Theresienstrasse 41, 8 München 2, Federal Republic of Germany.
4 Department of Earth Sciences, Faculty of Science, Kobe University,Kobe 657, Japan.
The aim of the land-based measurements was to test thevalidity of the preliminary magnetostratigraphy from the shipand to fill in gaps that still existed in our record. Rockmagnetic measurements were done on the sediments to char-acterize the magnetic remanence carriers. Biogenic single-domain (SD) magnetite has been found as the carrier ofmagnetization in detritus-poor pelagic sediments (Petersen etal., 1986). The sediments used for the magnetostratigraphywere mainly of pelagic origin and consisted of nannofossil,foraminiferal, and diatom ooze. Mainly carbonate-rich sedi-ments were encountered because all sites were in 2100-mwater depth well above the calcium carbonate compensationdepth (CCD). Rock magnetic investigations were conductedto determine the magnetic domain state of the samples.
In addition to biogenic SD magnetite, we investigated therole of vitric volcanic ash particles as carriers of stablemagnetization. We follow the nomenclature for detrital rema-nent magnetizations (DRM) suggested in the review on sedi-mentary magnetism by Verosub (1977). A depositional DRMis a magnetization acquired by magnetic grains in the Earth'sfield while settling in water and on first contact with thesediment. A postdepositional DRM is formed after depositionwhen the magnetic particles are surrounded by sediment.
METHODSSamples were taken with standard ODP cubes (7 cm3)
during the cruise. On average we obtained two samples per1.5-m section of the core, when the sediment was not dis-turbed. Cubes were pressed into the sampling half of the corewith the arrow on the plastic cube pointing in the upcoredirection. The harder sediments were precut with a sharpstainless steel spatula before sampling with a plastic cube.
The paleomagnetic measurements were carried out in thePaleomagnetism Laboratory of the Universitàt München witha two-axis cryogenic magnetometer. Magnetizations as weakas 3 10~5 A/m could be measured on the single samples withthis magnetometer. All samples were stepwise AF-demagne-tized in three directions. Approximately 580 samples fromHoles 747A-747C, 749B, and 751A were AF-demagnetized inat least five steps up to 60 mT in order to isolate theircharacteristic remanence components.
The declinations of the single samples have no meaningbecause the cores were not oriented with respect to azimuth.
225
F. HEIDER, B. LEITNER, H. INOKUCHI
-20
- 1 . 5 -
- 1 . 0 -
- 0 . 5 -
0 -
0.5 -
1.0-
1.5-
2 . 0 -
2 . 5 -
3.0
-Z.N
W
-2 .0 -1.5 -1.0 -0.5I
0.5
20 (mA/m)
- 1.5
- 1.0
-0 .5
- 0
- - 0 . 5
- -1 .0
- -1 .5
^ - 2 . 0
- - 2 . 5
-3.0
1.0 1.5 2.0 2.5 3.0 • Positive inclinationa Negative inclination
20Peak alternating field (mT)
80
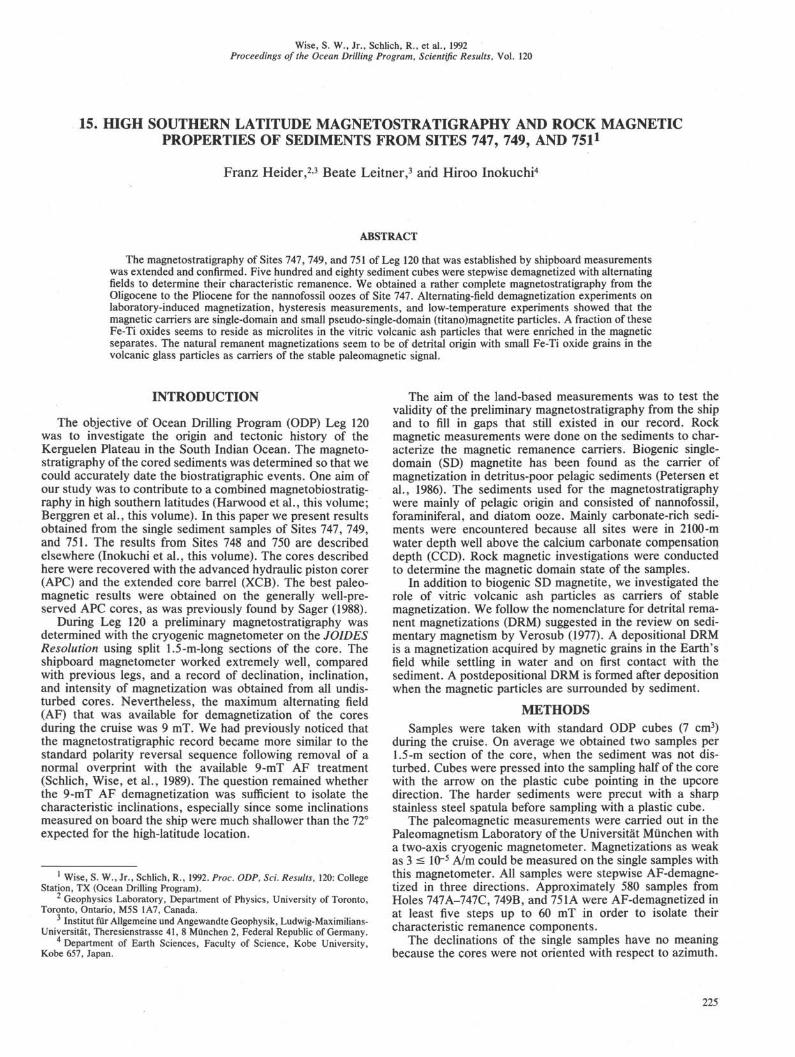
Figure 1. Vector projections (Zijderveld diagrams), stereographic projections, and intensity decay curves during alternating field demagnetizationof natural remanent magnetizations. A. Sample 120-747A-7H-3, 112-114 cm, with an initial soft magnetization and shallow characteristicinclination of 22°. B. Sample 120-751-15H-5, 120-122 cm, with high coercivity values (MDF = 48 mT) and a characteristic inclination of 38°.
The characteristic inclination of each sample was determinedfrom straight line segments of the AF-demagnetization data invector projections (Zijderveld plot) (Fig. 1). Results fromsamples with unstable magnetization (e.g., switching polarityof inclination) or from low intensity of magnetization (<310~5 A/m) were discarded. Only samples with more or lessstable inclinations were considered suitable for the magneto-stratigraphic purposes. Median destructive fields (MDF) weredetermined from decay curves of magnetization intensity vs.peak alternating field (Fig. 1). No MDF could be determinedfor a few samples when the magnetization had not decreasedto 50% at 60-mT AF treatment or when an anhystereticremanent magnetization (ARM) was induced at high alternat-ing fields.
It was generally found that parts of the core that were tooweakly magnetized to be measured with the pass-throughcryogenic magnetometer on board the JOIDES Resolutionwere also too weakly magnetized for measurements on land.The higher sensitivity of the cryogenic magnetometer on landwas offset by the smaller sample volumes (7 cm3) comparedwith the larger split halves of the cores measured on the ship.
Eleven sediment samples were selected from differentlithotypes and sub-bottom depths from Sites 747 and 751 fordetailed rock magnetic studies. Differences in hardness of theAF demagnetization curves of the natural remanent magneti-zation (NRM) were used as a selection criterion. These
sediment cubes were given anhysteretic remanent magnetiza-tion (ARM) and isothermal remanent magnetization (IRM),which were measured with a Digico spinner magnetometer.Hysteresis parameters were measured with a very sensitivemagnetic translation balance in a high field solenoid (Hmax =300 mT) that was recently developed by von Dobeneck.Following the magnetic measurements on the 11 samples,magnetic separates were obtained with a liquid extractiontechnique (von Dobeneck et al., 1987) from the sedimentcubes that contained sufficient magnetic material. The mag-netic extracts were investigated by X-ray diffraction (XRD),energy dispersive X-ray analysis, and scanning and transmis-sion electron microscopy (SEM and TEM) as well as beingused for Curie temperature determinations.
MAGNETOSTRATIGRAPHY
Site 747Site 747 lies between the northern and southern Kerguelen
Plateau at about 55° southern latitude. For a description of thelithologic and biostratigraphic units the reader is referred tothe corresponding articles in Schlich, Wise, et al. (1989) and inthis volume. The magnetostratigraphic record determinedfrom the shipboard inclination data (stars) and the character-istic inclinations of single sample cubes (circles) is shown inFigure 2. Negative inclinations (I) correspond to normal
226
MAGNETOSTRATIGRAPHY AND ROCK MAGNETIC PROPERTIES
B10
8 -
6 -
4 -
2 -
0 -
2 -
4 -
6 -
-ZN
W-
-0.08
-0.06
-0.04
-H.E
8 I i i i i i i i T T • i ' i ' i • i • 1 - o o β
-0.08 -0.06 -0.04 -0.02 0 0.02 0.04 0.06 0.08 0.10
•0.10(mA/m)
-0.02
- 0
II
1h-0.02 •* f
--0.04
--0.06
80
Peak alternating field (mT)
Figure 1 (continued).
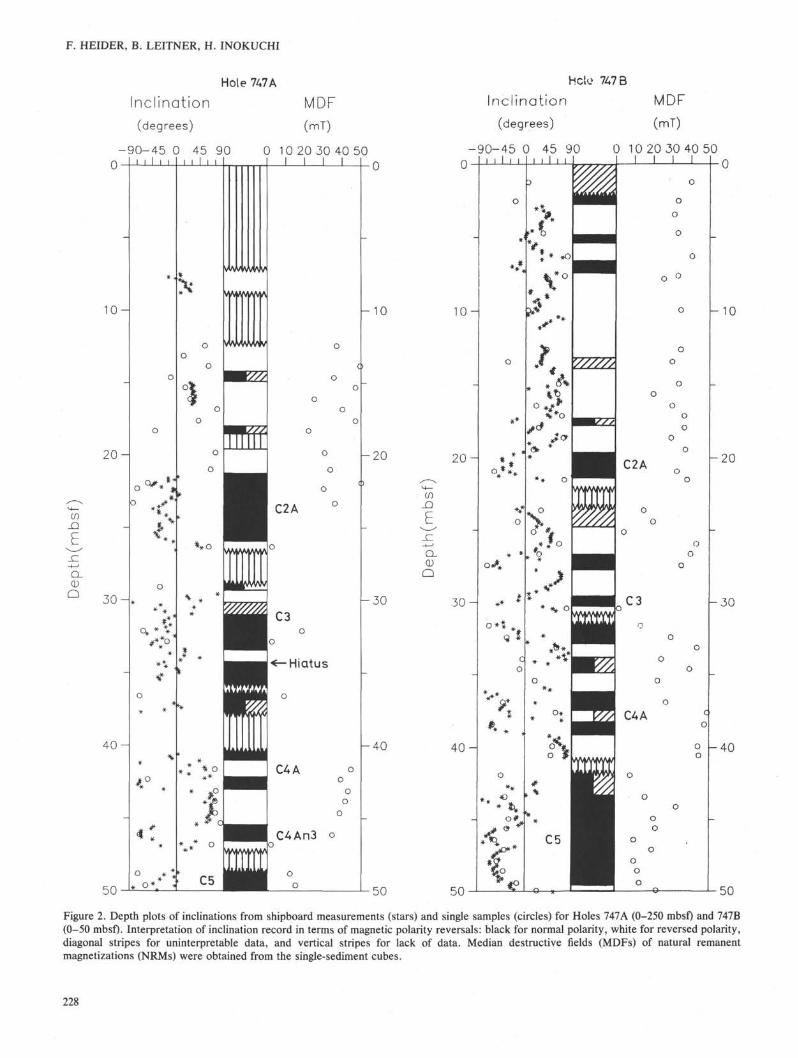
polarity of the earth's magnetic field, and positive inclinationsto reversed polarity. It is evident from the inclination data inFigure 2 that the inclinations from separate samples confirm inmost cases the results obtained during Leg 120. An interpre-tation of the inclination record in terms of normal and re-versed polarity is shown by black and white colors, respec-tively, in the column between the inclination and the MDF(Fig. 2). Magnetic polarity chrons could be identified bycorrelating our results to a standard magnetic time scale(Berggren et al., 1985) and by considering biostratigraphicresults (see Harwood et al., this volume; Berggren et al., thisvolume).
In addition to the magnetostratigraphy presented in theProceedings of the Ocean Drilling Program, Initial Reports,Volume 120 (Schlich, Wise, et al., 1989), we obtained thefollowing new results. The top of Subchron C2A (Gauss) isobserved at Holes 747A and 747B at 21.5 and 19.6 m belowseafloor (mbsf), respectively. The top of the Cochiti (ChronC3) in Hole 747B is pinned down by single sample results at26.8 mbsf. The hiatus that occurs at 34.3 mbsf in Hole 747Aseems to cut the lower part of Chron C3 (the normal polarityof the Gilbert). Therefore, the hiatus can be inferred to start atabout 4.5 m.y. It is evident from the position of Subchron C4Athat the sub-bottom depth at Hole 747 A can differ by as muchas 4 m from the depth found for Hole 747B.
The top of Chron C5 around 48 mbsf at Hole 747A is notknown, but the top of the short normal period (C4AN3) aboveChron 5 is found at 45.5 mbsf. The bottom of Chron C5, which
11• Positive inclination
o Negative inclination
was previously thought to occur at 52.5 mbsf in Hole 747A, isnow uncertain. The results from the single specimens contra-dict the measurements from the ship between 52.5 and 55mbsf, and it is possible that Chron C5 continues down to atleast 55 mbsf in Hole 747A. In Hole 747B we confirmed atransition from normal to reversed polarity at 50 mbsf thatmay represent the bottom of Chron C5.
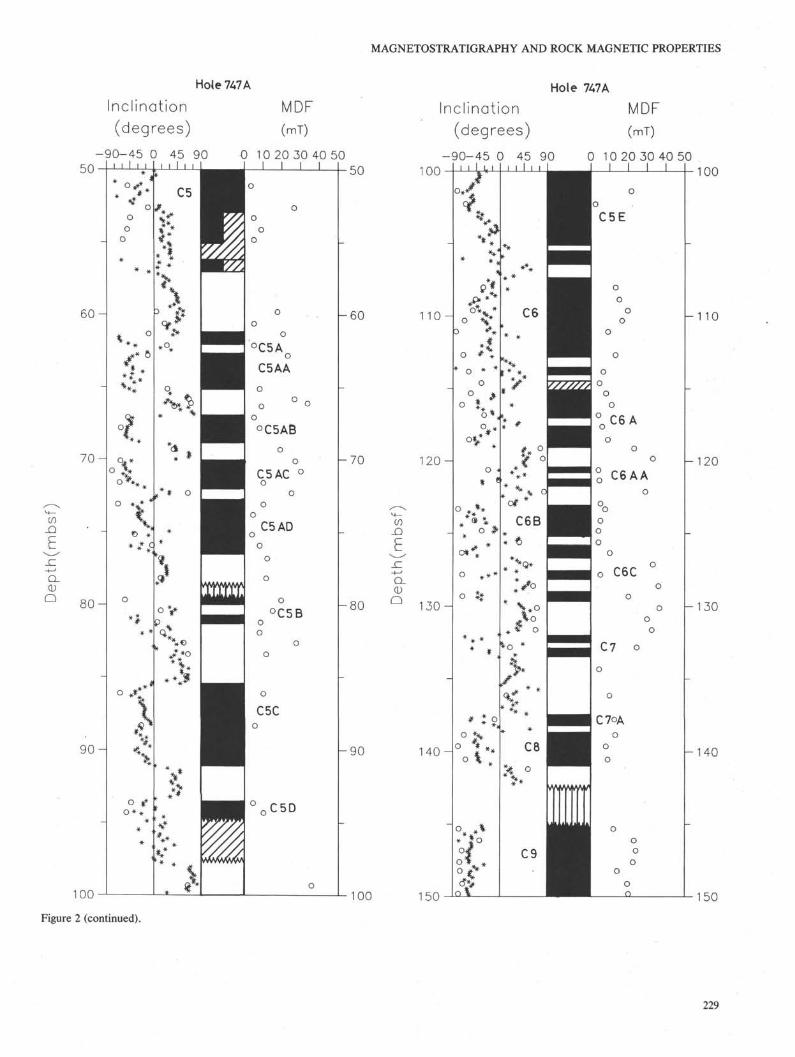
The preliminary magnetostratigraphy (Schlich, Wise, etal., 1989) had to be reinterpreted between 62 and 77 mbsfbased on stable isotope data of Wright and Miller (thisvolume). Based on a maximum in δ 1 8θ at 70 mbsf at Site 747the reversed interval there is interpreted as C5ABR and thesubsequent normal intervals are reinterpreted accordingly(Wright and Miller, this volume). The normal polarity intervalbetween 70 and 72 mbsf is now C5AC and the next normal isC5AD. The two normal intervals of Chrons C5A and C5AAare linked together. The two normal intervals of Chron C5Bshifted slightly upward compared with the shipboard results.
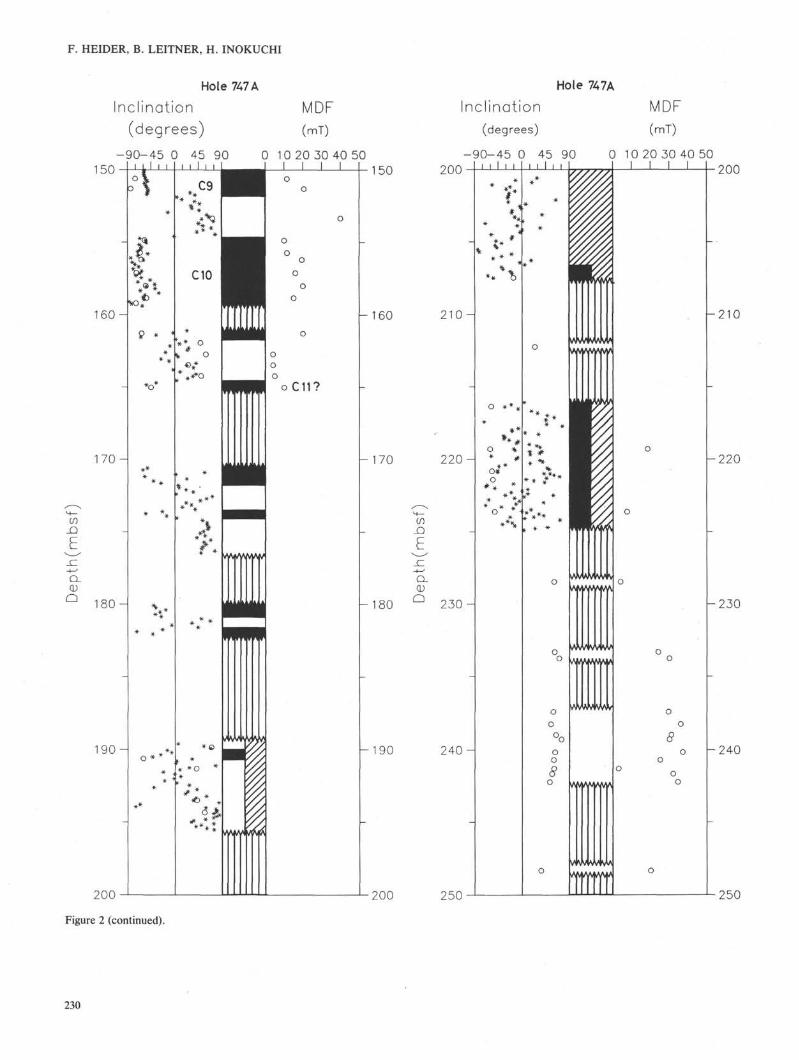
The beginning of Chron C5D is found at 93.5 mbsf in Hole747A. At 120.6 mbsf we identified the second normal polarityinterval of Chron C6AA, which was not clearly recognizablefrom the shipboard data. The reversal sequence between 123and 161 mbsf was easily identified as Subchrons C6B throughChron C10. Coring with the APC stopped at 151.5 mbsf wherethe lithology changed from nannofossil ooze (Subunit IIA) tonannofossil chalk (Subunit HB). Additional data place thebottom of Chron C10 at 161.5 mbsf. There is a major hiatusbelow 170 mbsf. The top of a normal subchron, which may be
227
F. HEIDER, B. LEITNER, H. INOKUCHI
Hole 747 A
Inclination MDF
(degrees) (mT)
if)_Q
_C
CDQ
-90-45 0 45 90Q I I I I I I I I I I I I
0 10 20 30 40 50I I I I
1 0 - - 1 0
20
hole 7A7B
Inclination
(degrees)
-90-45 0 45 90i i I i i
MDF
(mT)
0 10 20 30 40 50
1 0 -
2 0 -
a.0)
a
3 0 -
4 0 -
50
o * *
o
77/77/
%*o
- 1 0
* *
C2A- 2 0
o **
JC3
msm
CA A
C5
ooo
- 3 0
- 4 0
50
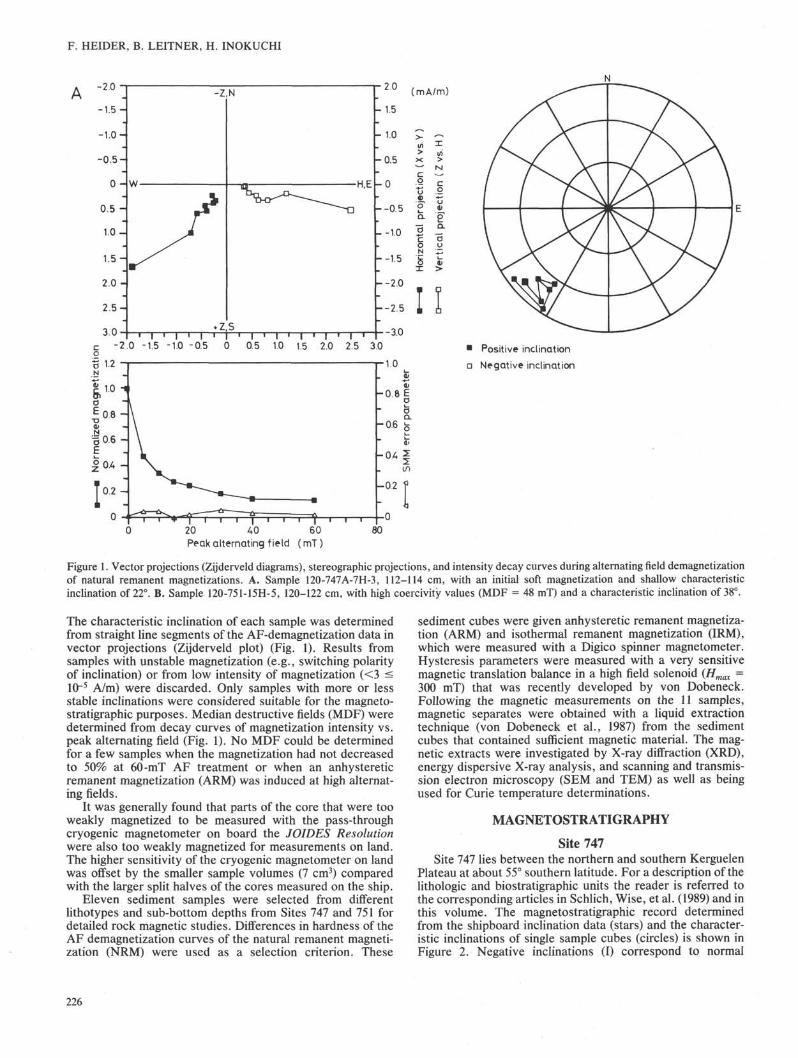
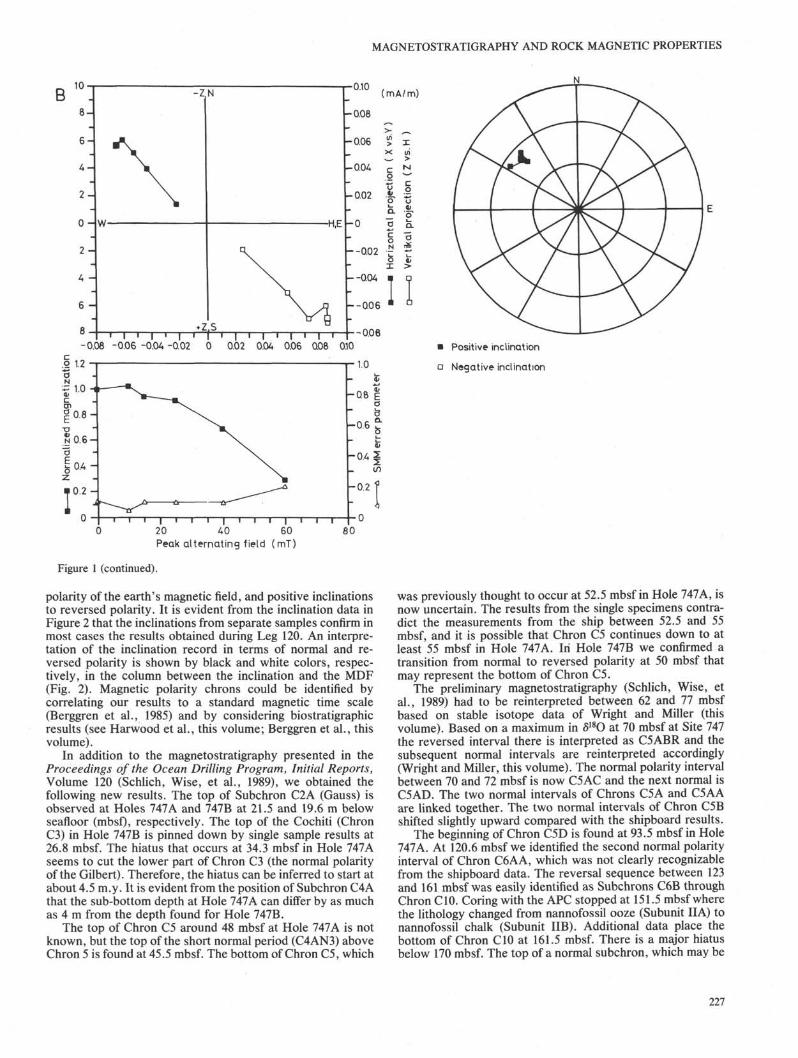
Figure 2. Depth plots of inclinations from shipboard measurements (stars) and single samples (circles) for Holes 747A (0-250 mbsf) and 747B(0-50 mbsf). InteΦretation of inclination record in terms of magnetic polarity reversals: black for normal polarity, white for reversed polarity,diagonal stripes for uninteΦretable data, and vertical stripes for lack of data. Median destructive fields (MDFs) of natural remanentmagnetizations (NRMs) were obtained from the single-sediment cubes.
228
MAGNETOSTRATIGRAPHY AND ROCK MAGNETIC PROPERTIES
Hole 7A7A
Inclination
(degrees)
50
60 -H
7 0 -
9 0 -
100
MDF
(mT)
- 9 0 - 4 5 0 45 90 0 10 20 30 40 50Mill
* |
>7'"oo
oo
** *
o
* *
** *
o *** *
t> *
o
•I* *
**4
o f» •
*
1 1»
\ λ
A*
^>:
•
IP
51fflffl1
I I I
C5AD
C5D
- 6 0
- 7 0
50
- 8 0
100
Q_CD
Q
Hole 747A
Inclination
(degrees)
-90-45 0 45 90100
1 1 0 —
1 2 0 -
1 3 0 -
1 4 0 -
150
MDF
(mT)
0 10 20 30 40 50100
- 1 10
-120
-130
-140
150
Figure 2 (continued).
229
F. HEIDER, B. LEITNER, H. INOKUCHI
Hole7A7A
Inclination(degrees)
-90-45 0 45 90150
160-
170-
oo
CD
o 180-
190-
MDF
(mT)
0 1 0 20 30 40 50
200
Figure 2 (continued).
150
-160
-170
-180
-190
200
Inclination(degrees)
Hole 7A7A
MDF(mT)
-90-45 0 45 90200
2 1 0 -
220 -\
Q_
Q 2 3 0 -
240
250
o **.
o ** #
oro
**\
j j0 10 20 30 40 50
I I I I
oo°coo
200
-210
220
-230
-240
250
230
MAGNETOSTRATIGRAPHY AND ROCK MAGNETIC PROPERTIES
Chron CH, lies at 165 mbsf. The only difficulty is that thereversed interval between our proposed Chrons CIO and CHis too short, compared with the standard reversal sequence. Anormal-reversed-normal sequence is also found at Hole 747Cbetween 160 and 165 mbsf. By comparing these results withthe same depth interval in Hole 747A, the normals may betentatively interpreted as the bottom of Chron CIO and the topof Chron CH. The magnetostratigraphy between 170.5 and181.5 mbsf (Subunit HC) cannot be considered as reliable asthis nannofossil chalk was highly bioturbated. Neither couldany useful information be obtained from the Maestrichtianvolcaniclastic rocks between 181.4 and 197.2 mbsf. Thereseems to be part of a normal interval from 216 to 225 mbsf,which will require biostratigraphic control to identify.
It is clear from the above that the best paleomagneticresults were obtained from the nannofossil oozes recoveredby APC coring. The quality of the magnetostratigraphy de-clined rapidly when XCB coring was used for the hardersedimentary sequences. The characteristic inclinations ob-tained from the single sediment cubes after AF demagnetiza-tion were generally steeper than the inclinations measuredafter 9-mT AF treatment during Leg 120. One explanation isthat AF demagnetization on the ship was not sufficient toisolate the characteristic remanence and their inclinations.The second more likely explanation is that an inclination erroroccurred when the sediments were compacted as they dried inthe plastic sample cubes, even during storage in the refriger-ator. One would obtain a flattened magnetization as a result ofsediment compaction in the horizontally stored cube, whichhad been pressed into a vertical cut through the core. Oneresult of drying in the sample cube is a steeper inclination.
The highest median destructive fields (25-45 mT) weremeasured on NRMs from the first 42 mbsf. This may be aresult of a higher SD particle content in the top 42 m of thesediment column in Holes 747A and 747B. We saw a decreasein magnetic intensity from 20 to 2 mA/m between 40 and 50mbsf, which may be associated with a dissolution of the smallmagnetic particles (Karlin and Levi, 1985). Below 50 mbsf theMDF values are generally lower (around 10-25 mT) until theyincrease again below 232 mbsf. We will investigate howrepresentative these MDF values of the NRM are for theensemble of magnetic particles within one sample in a latersection dealing with rock magnetic properties.
Site 749The AF demagnetization experiments of single samples
from Hole 749B confirmed the results obtained on boardJOIDES Resolution between 8 and 16 mbsf. No additionalinformation could be obtained for the magnetostratigraphyfrom discrete sample measurements at this site.
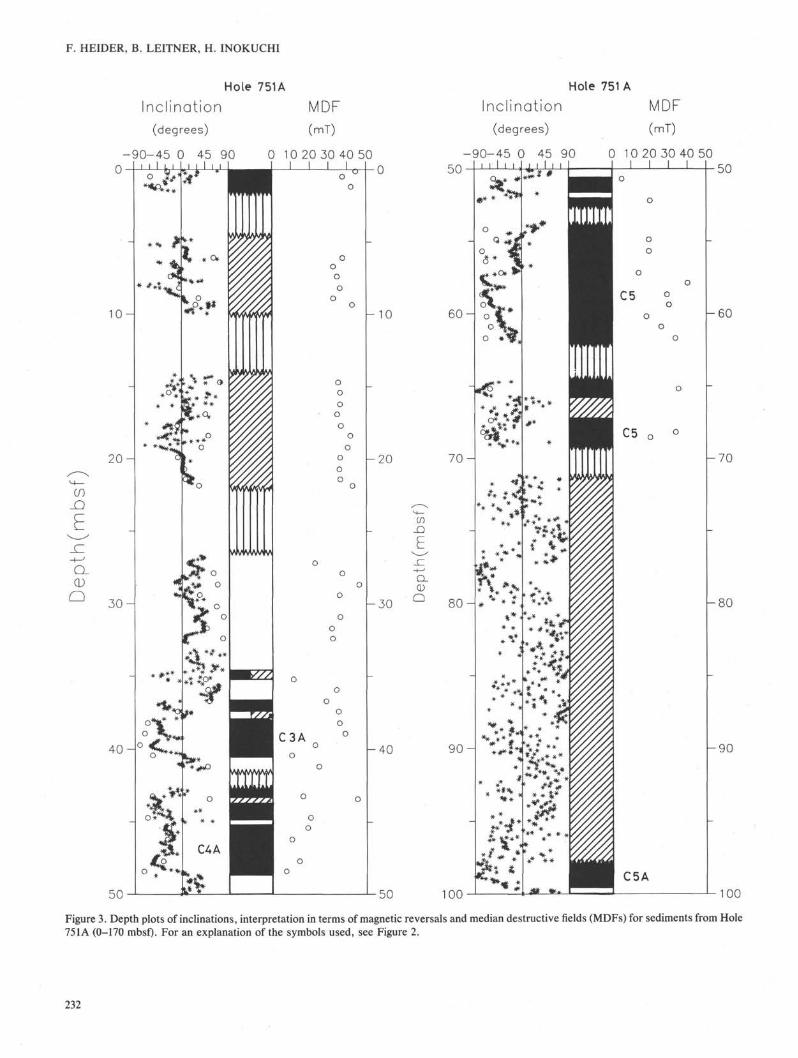
Site 751Hole 751A was drilled in the Raggatt Basin on the Southern
Kerguelen Plateau (58°S). The top 1.5 mbsf of Hole 751A havenormal magnetic polarity (Fig. 3). The inclinations of thesection between 1.5 and 26.7 mbsf could not be interpretedsince they were generally too shallow or missing. Part of theseuninterpretable data can possibly be explained by core distur-bance caused by porcellanitic chert pieces found between 10and 25 mbsf (Schlich, Wise, et al., 1989). The chert piecesresult from a layer of chert that shattered during drilling. Themedian destructive fields between 0 and about 40 mbsf wereconsistently high around 38 mT. These high MDFs correlatewell with lithologic Unit I which consists mainly of diatomooze. In lithologic Unit II (40.1-166.2 mbsf), nannofossil oozepredominates, and there is a noticeable drop in MDF to <20mT below 40.1 mbsf. This drop in MDF between 40 and 60
mbsf suggests a different magnetic mineralogy on the top ofUnit II.
From the biostratigraphic information presently available,we interpreted the normal interval between 36.7 and 40.1 mbsftentatively as part of Subchron C3A using the last appearancedatum of C i. triangularis, etc. (D. Lazarus, pers. comm.,1989). There should be a hiatus (5.75-8.0 m.y.) between 40.2and 42.7 mbsf inferred from biostratigraphic results (Schlich,Wise, et al., 1989) and therefore Chron C4 is missing. An evenlonger hiatus, also with Chron C4 missing, was observed inHole 747A (see Fig. 2). We interpret the normal intervalbetween 44 and 48.4 mbsf as part of Subchron C4A. The shortreversed interval at 51.7 mbsf is best correlated to the shortreversed period above Chron C5. The normal of Chron C5stretches from 51.7 mbsf down to at least 69.2 mbsf. Between71 and 98 mbsf the magnetization intensity measurements ofsingle samples were too low to give any interpretable results.
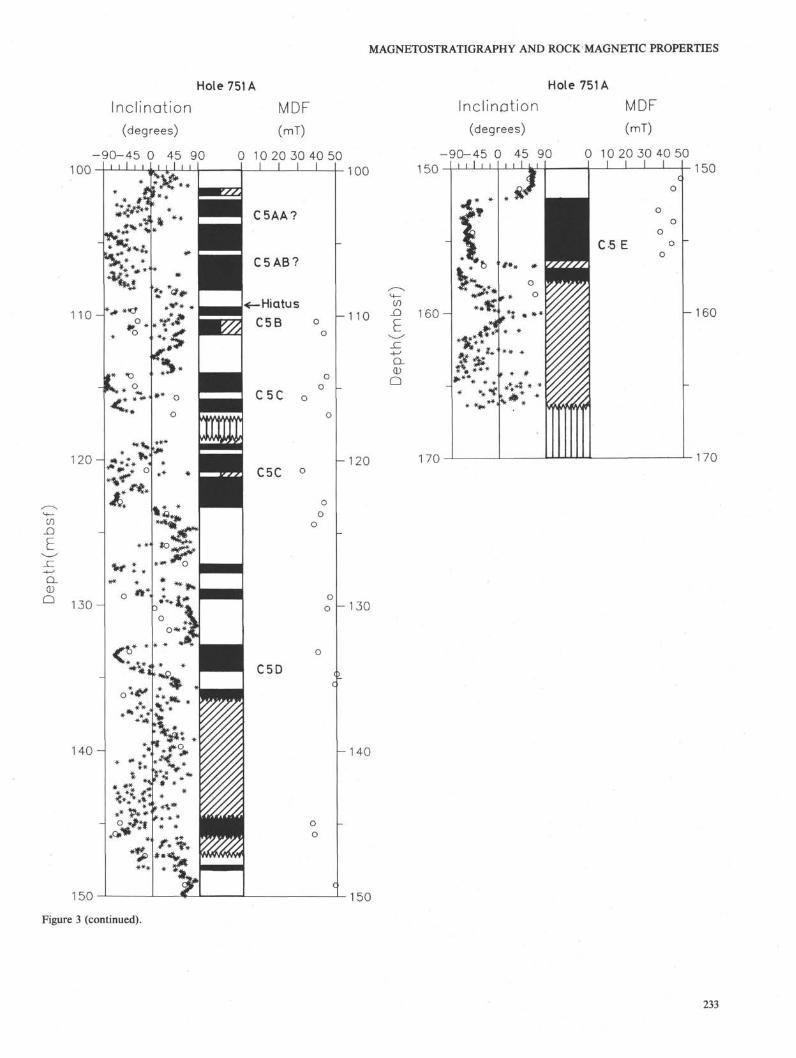
The incomplete normal interval above 99.3 mbsf could bepart of Chron C5A. It is difficult to interpret the inclinationsbetween 100 and 110 mbsf because of the low intensities ofmagnetization and the present lack of biostratigraphic infor-mation. The hiatus that was suggested in the sedimentationrate curve (Schlich, Wise, et al., 1989) occurs at about 110mbsf, as there is a change in magnetization intensity by abouta factor of 15. A change in foraminiferal faunas places theunconformity at 109.2 mbsf (W. A. Berggren, pers. comm.,1989). The short normals between 110 and 112 mbsf may beSubchron C5B. We propose that Subchron C5C lies between114.1 and 123.3 mbsf. If Chron C5D starts at 132.8 mbsf, thenthere are two short normal intervals at 127.5 and 129.0 mbsfthat are not found on the geomagnetic polarity time scale (e.g.,Berggren et al., 1985). The normal between 132.8 and 134.8mbsf is too short to represent the complete Chron C5D at asedimentation rate of about 20 m/m.y. Therefore, the end ofthe normal of Subchron C5D may not be reached yet at 136mbsf, The top of Subchron C5E lies at 152.1 mbsf, as reportedin the initial report (Schlich, Wise, et al., 1989). The MDFs ofthe NRMs of separate samples between 110 and 157 mbsfwere consistently high, ranging from 35 to 50 mT. A rockmagnetic investigation in a later section of this paper willcharacterize the domain state of the magnetic minerals.
Comparison of Paleomagnetic ParametersHistograms were prepared of NRM intensity, characteris-
tic inclination and declination, initial susceptibility, and me-dian destructive field of NRM for the investigated singlesamples. The distribution of NRM intensities for all samplesfrom Hole 747A (Fig. 4) is centered on 1 mA/m well above thenoise level (0.03 mA/m) of the magnetometer. The samplesfrom Hole 751A (Fig. 5) show one peak in NRM intensity at0.6 mA/m and a second peak at 0.02 mA/m below thesensitivity of the magnetometer. The characteristic inclina-tions in Holes 747A and 751A show bimodal distributions withmaxima around +65° and -65°, which is slightly lower than theinclination of 72° expected for the present latitude of the sites.The inclinations of the single samples at both sites were onaverage about 15° steeper than the inclinations measured onthe ship. One possible explanation is that higher AF demag-netization levels on land were required to isolate the charac-teristic remanence, which is shallower than the inclinationexpected at the site, assuming a geocentric axial dipole field.An inclination error (shallowing) is usually not found indeep-sea sediments that are thought to carry postdepositionalDRMs (Verosub, 1977). A second explanation for the steeperinclinations in the single samples could be the compaction ofthe sediment in the horizontally stored plastic cubes, whichleads to higher inclination values (see Site 747).
231
F. HEIDER, B. LEITNER, H. INOKUCHI
01_ Q
CDQ
HoleInclination
(degrees)
-90-45 0 45 90
751A
0 10
MDF(mT)
20 30
1 0 -
oo
a.a)Q
Hole 751 A
Inclination MDF(degrees) (m~0
-90-45 0 45 90 0 10 20 30 40 50i i I i i J j i I i i
9 0 -
100 100
Figure 3751A CO-
Depth plots of inclinations, interpretation in terms of magnetic reversals and median destructive fields (MDFs) for sediments from Hole170 mbsf). For an explanation of the symbols used, see Figure 2.
232
MAGNETOSTRATIGRAPHY AND ROCK MAGNETIC PROPERTIES
Hole 751A
Inclination(degrees)
-90-45 0 45 90100
110 —
1 2 0 -
E
CL
(DQ
130-
140-
150
MDF(mT)
0 10 20 30 40 50I J I I 100
120
-130
Hole 751A
150
Inclination(degrees)
-90-45 0 45 90i i I i i
-110 -9 1 ( 3 ° -
0
- 140
150
170
*#*
MDF
(mT)
0 1 0 20 30 40 50I I I I
C-5 E
150
-160
70
Figure 3 (continued).
233
F. HEIDER, B. LEITNER, H. INOKUCHI
30
-60 -30 0 30Inclination (degrees)
60 90
COQ)
Q_
Eoo ΔV
Site 747N=139
10 15 20 25 30 35 40 45 50MDF (mT)
30oo0)CL
Eσ ?o00 Z U
E
Site 747N= 157
0 30 60 90 120 150 180 210 240 270 300 330 360Declination (degrees)
4000
CL
E30σoo
^0 20:
£10ZS
Site 747
0:0.001 0.01 0.1
Intensity/mA/m
10 100
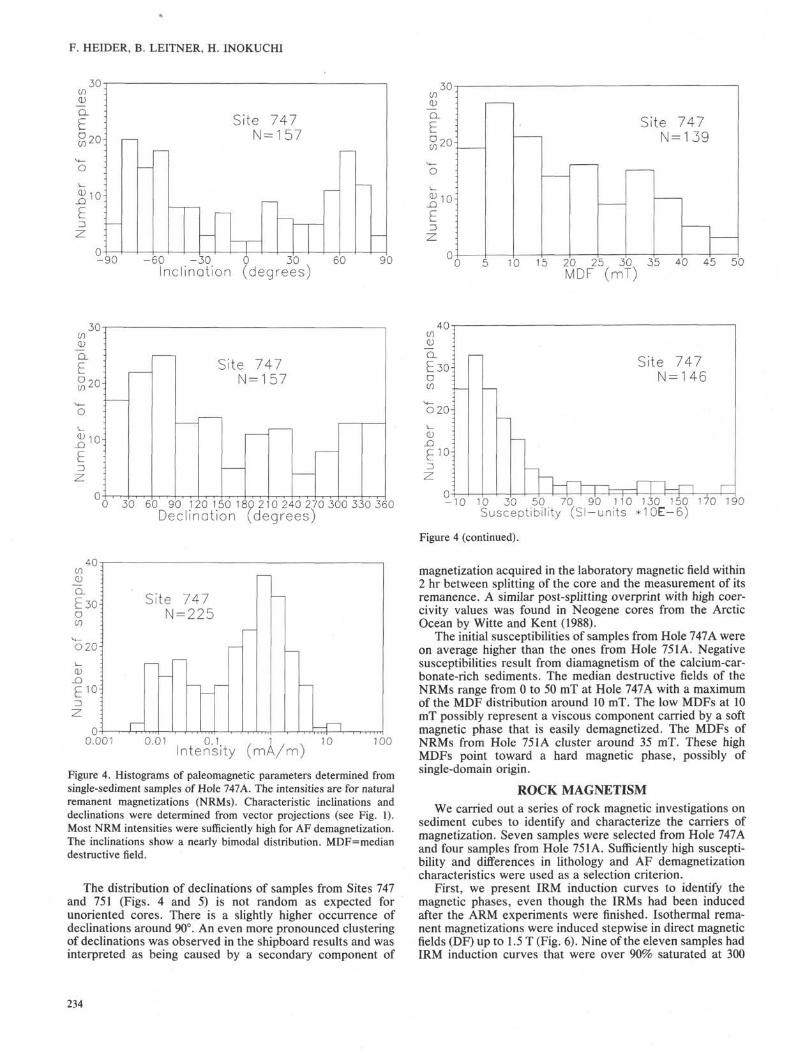
Figure 4. Histograms of paleomagnetic parameters determined fromsingle-sediment samples of Hole 747A. The intensities are for naturalremanent magnetizations (NRMs). Characteristic inclinations anddeclinations were determined from vector projections (see Fig. 1).Most NRM intensities were sufficiently high for AF demagnetization.The inclinations show a nearly bimodal distribution. MDF=mediandestructive field.
The distribution of declinations of samples from Sites 747and 751 (Figs. 4 and 5) is not random as expected forunoriented cores. There is a slightly higher occurrence ofdeclinations around 90°. An even more pronounced clusteringof declinations was observed in the shipboard results and wasinterpreted as being caused by a secondary component of
40oo
Q_£30O
00
^0 20^1
CD
_Q
E 1 013
Site 747N=146
-10 10 3'0 50 70 90 110 130 150 170 190S u s c e p t i b i l i t y (SI —units *10E—6)
Figure 4 (continued).
magnetization acquired in the laboratory magnetic field within2 hr between splitting of the core and the measurement of itsremanence. A similar post-splitting overprint with high coer-civity values was found in Neogene cores from the ArcticOcean by Witte and Kent (1988).
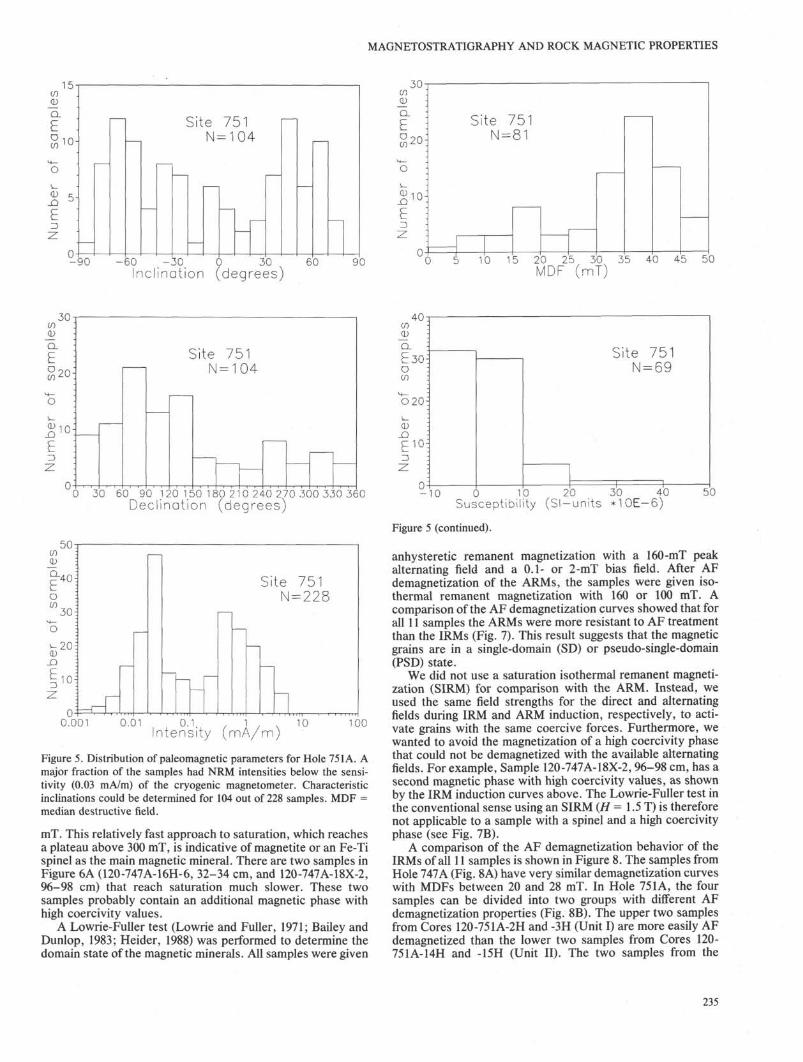
The initial susceptibilities of samples from Hole 747A wereon average higher than the ones from Hole 751 A. Negativesusceptibilities result from diamagnetism of the calcium-car-bonate-rich sediments. The median destructive fields of theNRMs range from 0 to 50 mT at Hole 747A with a maximumof the MDF distribution around 10 mT. The low MDFs at 10mT possibly represent a viscous component carried by a softmagnetic phase that is easily demagnetized. The MDFs ofNRMs from Hole 751A cluster around 35 mT. These highMDFs point toward a hard magnetic phase, possibly ofsingle-domain origin.
ROCK MAGNETISM
We carried out a series of rock magnetic investigations onsediment cubes to identify and characterize the carriers ofmagnetization. Seven samples were selected from Hole 747Aand four samples from Hole 751A. Sufficiently high suscepti-bility and differences in lithology and AF demagnetizationcharacteristics were used as a selection criterion.
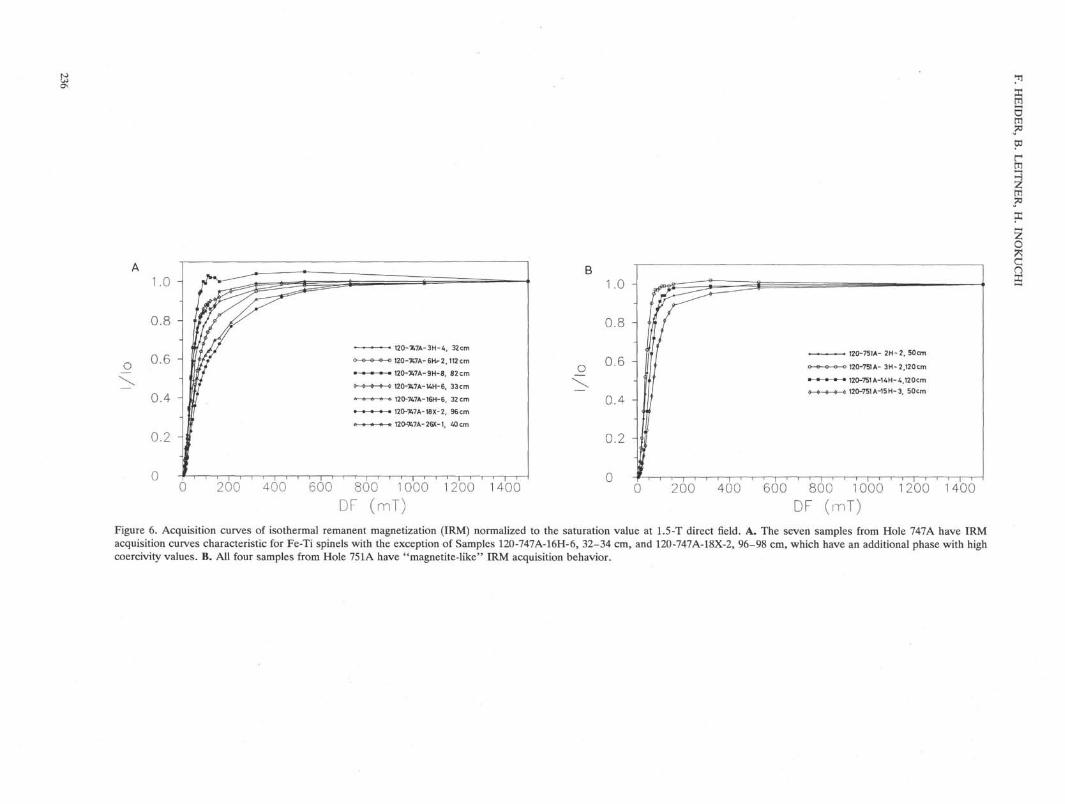
First, we present IRM induction curves to identify themagnetic phases, even though the IRMs had been inducedafter the ARM experiments were finished. Isothermal rema-nent magnetizations were induced stepwise in direct magneticfields (DF) up to 1.5 T (Fig. 6). Nine of the eleven samples hadIRM induction curves that were over 90% saturated at 300
234
MAGNETOSTRATIGRAPHY AND ROCK MAGNETIC PROPERTIES
-60 -30 0 30Inclination (degrees)
60 90 5 10 15 20 25 30 35MDF (mT)
40 45 50
30
CL
20-
10-
0 30
Site 751N=104
60 90 120 150 180 210 240 270 300 330 360Declination (degrees)
50π
0.001 100
Figure 5. Distribution of paleomagnetic parameters for Hole 751 A. Amajor fraction of the samples had NRM intensities below the sensi-tivity (0.03 mA/m) of the cryogenic magnetometer. Characteristicinclinations could be determined for 104 out of 228 samples. MDF =median destructive field.
mT. This relatively fast approach to saturation, which reachesa plateau above 300 mT, is indicative of magnetite or an Fe-Tispinel as the main magnetic mineral. There are two samples inFigure 6A (120-747A-16H-6, 32-34 cm, and 120-747A-18X-2,96-98 cm) that reach saturation much slower. These twosamples probably contain an additional magnetic phase withhigh coercivity values.
A Lowrie-Fuller test (Lowrie and Fuller, 1971; Bailey andDunlop, 1983; Heider, 1988) was performed to determine thedomain state of the magnetic minerals. All samples were given
- 1 0 0 10Susceptibility
20 30 40(Sl-units *10E-6)
5 0
Figure 5 (continued).
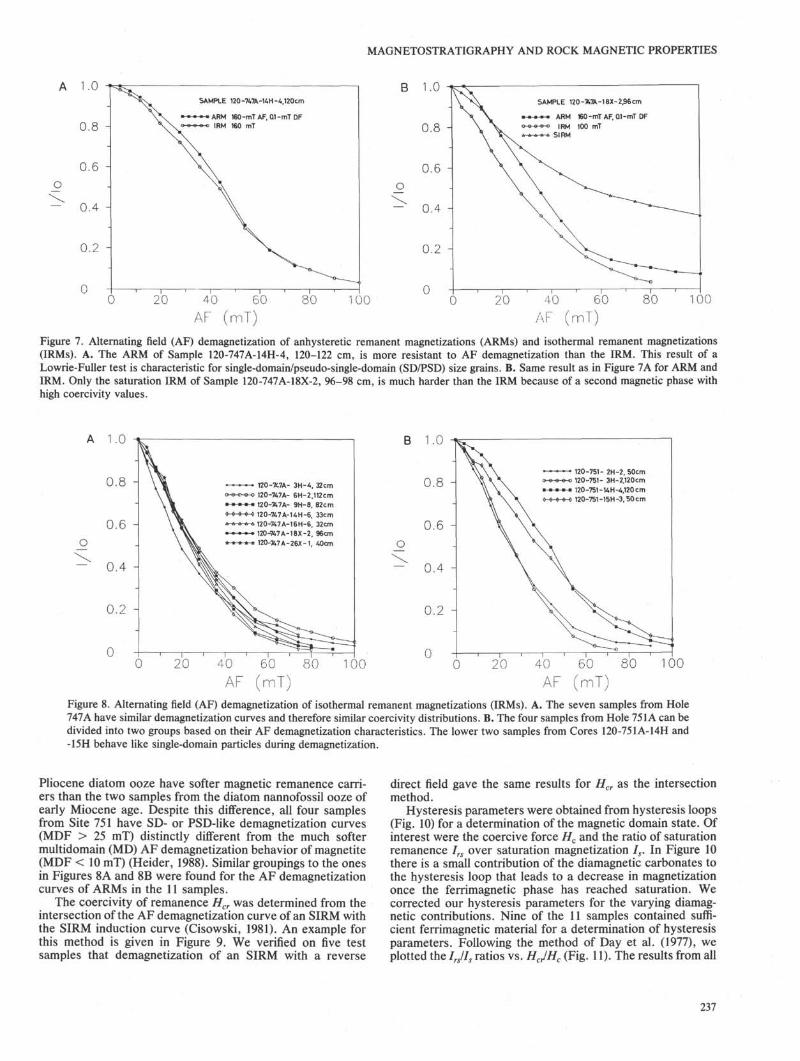
anhysteretic remanent magnetization with a 160-mT peakalternating field and a 0.1- or 2-mT bias field. After AFdemagnetization of the ARMs, the samples were given iso-thermal remanent magnetization with 160 or 100 mT. Acomparison of the AF demagnetization curves showed that forall 11 samples the ARMs were more resistant to AF treatmentthan the IRMs (Fig. 7). This result suggests that the magneticgrains are in a single-domain (SD) or pseudo-single-domain(PSD) state.
We did not use a saturation isothermal remanent magneti-zation (SIRM) for comparison with the ARM. Instead, weused the same field strengths for the direct and alternatingfields during IRM and ARM induction, respectively, to acti-vate grains with the same coercive forces. Furthermore, wewanted to avoid the magnetization of a high coercivity phasethat could not be demagnetized with the available alternatingfields. For example, Sample 120-747A-18X-2, 96-98 cm, has asecond magnetic phase with high coercivity values, as shownby the IRM induction curves above. The Lowrie-Fuller test inthe conventional sense using an SIRM (H = 1.5 T) is thereforenot applicable to a sample with a spinel and a high coercivityphase (see Fig. 7B).
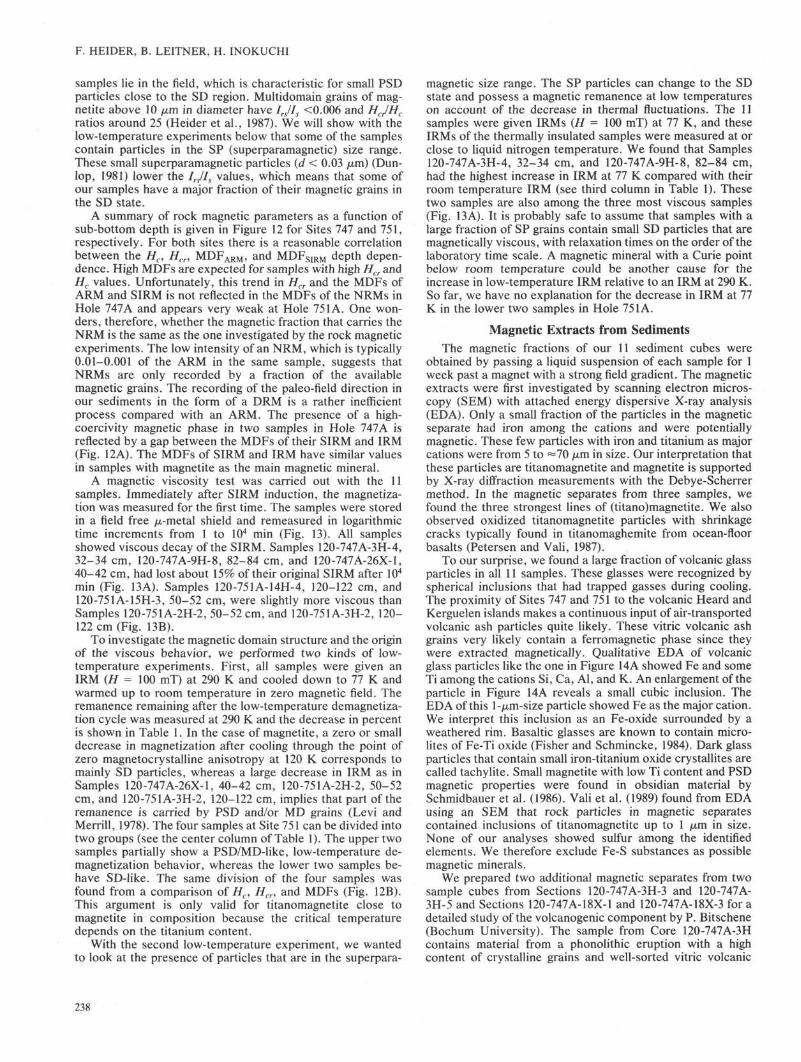
A comparison of the AF demagnetization behavior of theIRMs of all 11 samples is shown in Figure 8. The samples fromHole 747A (Fig. 8A) have very similar demagnetization curveswith MDFs between 20 and 28 mT. In Hole 751A, the foursamples can be divided into two groups with different AFdemagnetization properties (Fig. 8B). The upper two samplesfrom Cores 120-751A-2H and -3H (Unit I) are more easily AFdemagnetized than the lower two samples from Cores 120-751A-14H and -15H (Unit II). The two samples from the
235
o
120-H7A-3H-4, 32cm
120-WA-6H^2.112cm
120-747A-9H-8, 82 cm
120-747A-1AH-6, 33 cm
120-747A-16H-6, 32 cm
120-747A-18X-2, 96cm
120-747A-26X-1, 40 cm
o
200 400 600
DF1000
mT)1200 1400
120-751A- 2 H - 2 . 50cm
' 120-751A- 3H-2,120cm1 120-751A-UH-4,120cm
i 120-751A-15H-3, 50cm
200 400 600 1000 1200 1400DF (mT)
Figure 6. Acquisition curves of isothermal remanent magnetization (IRM) normalized to the saturation value at 1.5-T direct field. A. The seven samples from Hole 747A have IRMacquisition curves characteristic for Fe-Ti spinels with the exception of Samples 120-747A-16H-6, 32-34 cm, and 120-747A-18X-2, 96-98 cm, which have an additional phase with highcoercivity values. B. All four samples from Hole 751A have "magnetite-like" IRM acquisition behavior.
MAGNETOSTRATIGRAPHY AND ROCK MAGNETIC PROPERTIES
A 1.0
o
0.2 -
SAMPLE 120-747A-UH-4,120cm
• ARM 160-mT AF, 01 -mT DFIRM 160 mT
B 1.0SAMPLE 120-X7A-18X-2,96cm
ARM 160-mT AF, 0.1-mT DFIRM 100 mT
SIRM
80 100 40 60AF (mT)
100
Figure 7. Alternating field (AF) demagnetization of anhysteretic remanent magnetizations (ARMs) and isothermal remanent magnetizations(IRMs). A. The ARM of Sample 120-747A-14H-4, 120-122 cm, is more resistant to AF demagnetization than the IRM. This result of aLowrie-Fuller test is characteristic for single-domain/pseudo-single-domain (SD/PSD) size grains. B. Same result as in Figure 7A for ARM andIRM. Only the saturation IRM of Sample 120-747A-18X-2, 96-98 cm, is much harder than the IRM because of a second magnetic phase withhigh coercivity values.
A 1.0
o
0.8 A
0.6 A
0.4 A
0.2 -I
• » < « 120-X7A- 3H-4, 32cmo o » o o 120-747A- 6H-2,112cm"-* - • - * - • 120-747A- 9H-8, 82cm0 0 0 ' 0 120-747A-UH-6, 33cm& " » * * 120-747A-16H-6, 32cm• 120-747A-18X-2, 96cm
120-747A-26X-1, 40cm
20 40Af
60'm~T
B 1.0
o
80 100
120-751- 2H-2, 50cm120-751- 3H-2,120cm120-751-14H-4,120cm120-751-15H-3, 50 cm
0.4 A
0 .2 A
40 60AF (mT)
100
Figure 8. Alternating field (AF) demagnetization of isothermal remanent magnetizations (IRMs). A. The seven samples from Hole747A have similar demagnetization curves and therefore similar coercivity distributions. B. The four samples from Hole 751A can bedivided into two groups based on their AF demagnetization characteristics. The lower two samples from Cores 120-751A-14H and-15H behave like single-domain particles during demagnetization.
Pliocene diatom ooze have softer magnetic remanence carri-ers than the two samples from the diatom nannofossil ooze ofearly Miocene age. Despite this difference, all four samplesfrom Site 751 have SD- or PSD-like demagnetization curves(MDF > 25 mT) distinctly different from the much softermultidomain (MD) AF demagnetization behavior of magnetite(MDF < 10 mT) (Heider, 1988). Similar groupings to the onesin Figures 8A and 8B were found for the AF demagnetizationcurves of ARMs in the 11 samples.
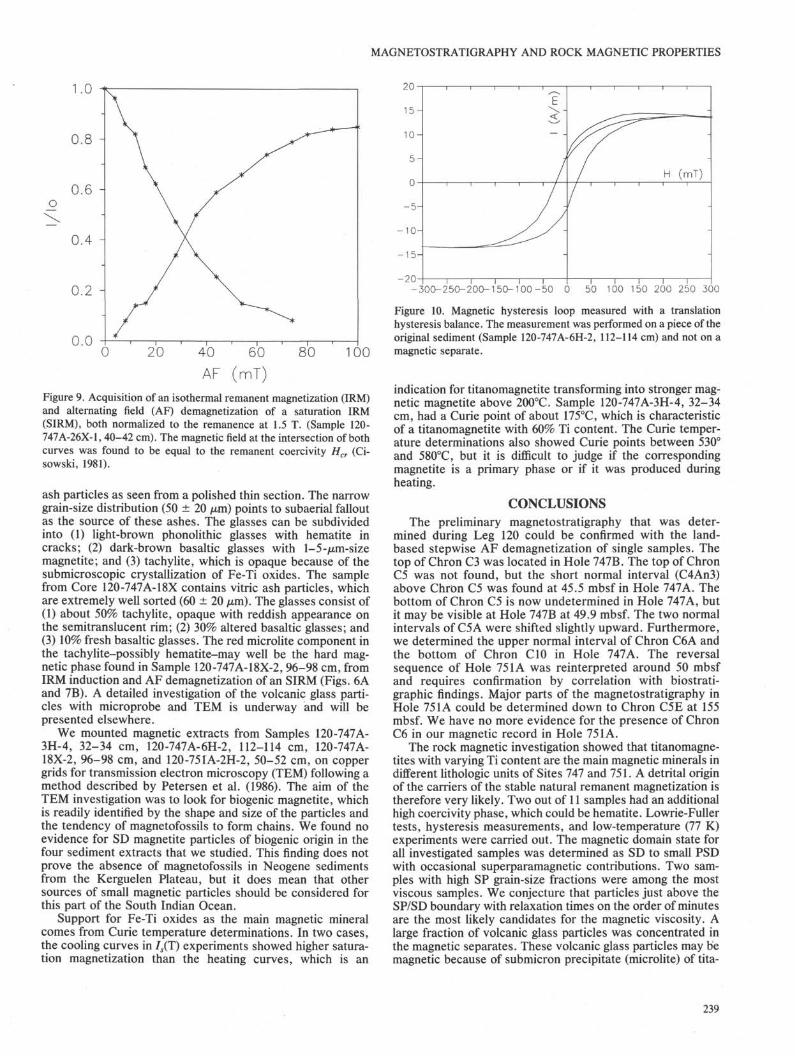
The coercivity of remanence Hcr was determined from theintersection of the AF demagnetization curve of an SIRM withthe SIRM induction curve (Cisowski, 1981). An example forthis method is given in Figure 9. We verified on five testsamples that demagnetization of an SIRM with a reverse
direct field gave the same results for Hcr as the intersectionmethod.
Hysteresis parameters were obtained from hysteresis loops(Fig. 10) for a determination of the magnetic domain state. Ofinterest were the coercive force Hc and the ratio of saturationremanence /„ over saturation magnetization Is. In Figure 10there is a small contribution of the diamagnetic carbonates tothe hysteresis loop that leads to a decrease in magnetizationonce the ferrimagnetic phase has reached saturation. Wecorrected our hysteresis parameters for the varying diamag-netic contributions. Nine of the 11 samples contained suffi-cient ferrimagnetic material for a determination of hysteresisparameters. Following the method of Day et al. (1977), weplotted the IrJIs ratios vs. HJHC (Fig. 11). The results from all
237
F. HEIDER, B. LEITNER, H. INOKUCHI
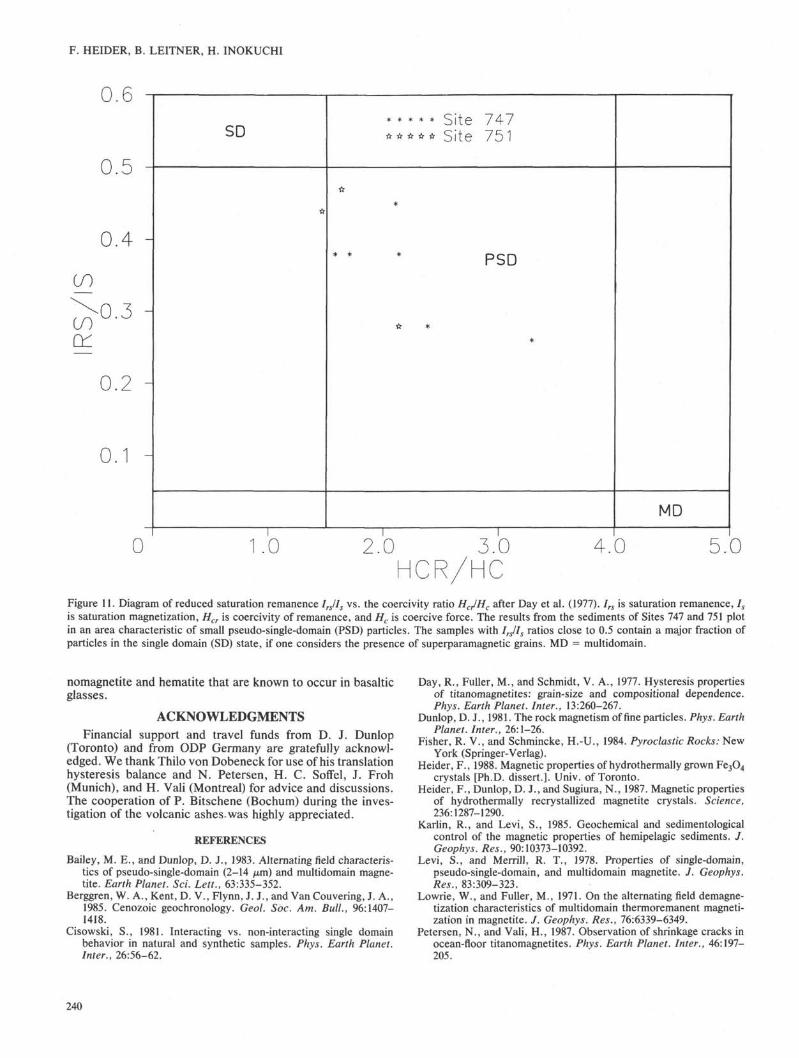
samples lie in the field, which is characteristic for small PSDparticles close to the SD region. Multidomain grains of mag-netite above 10 µm in diameter have IJIS <0.006 and HJHCratios around 25 (Heider et al., 1987). We will show with thelow-temperature experiments below that some of the samplescontain particles in the SP (superparamagnetic) size range.These small superparamagnetic particles (d < 0.03 µm) (Dun-lop, 1981) lower the IJIS values, which means that some ofour samples have a major fraction of their magnetic grains inthe SD state.
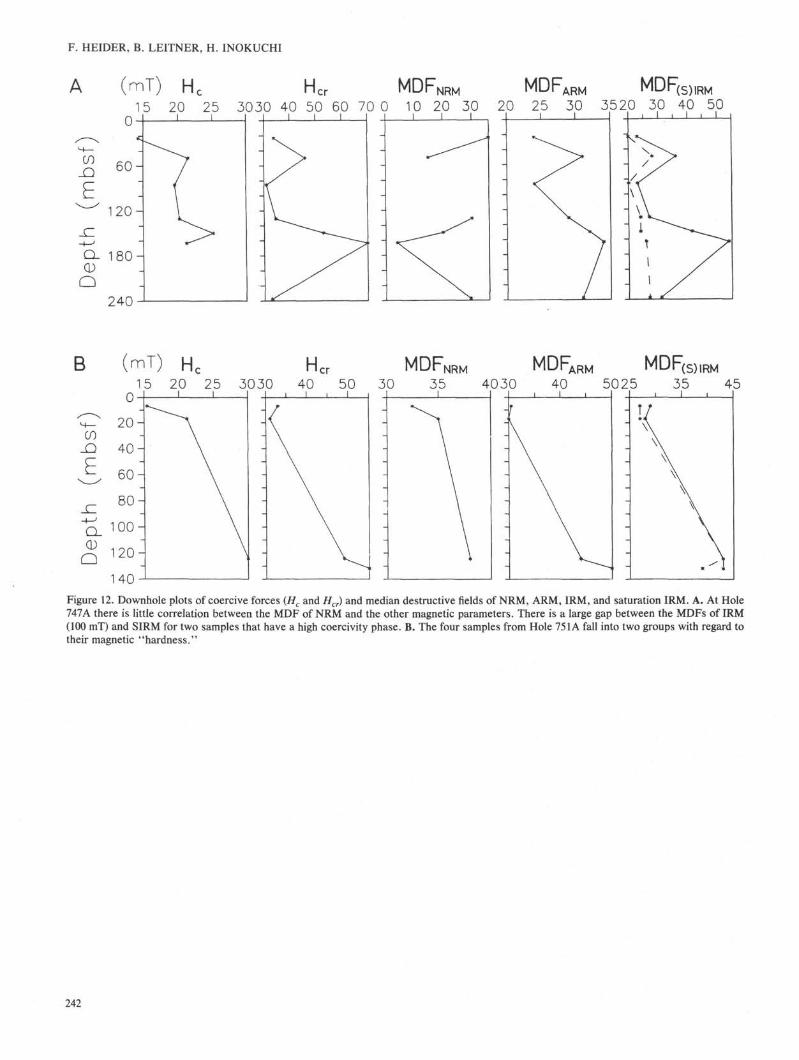
A summary of rock magnetic parameters as a function ofsub-bottom depth is given in Figure 12 for Sites 747 and 751,respectively. For both sites there is a reasonable correlationbetween the Hc, Hcn MDFARM, and MDFSJRM depth depen-dence. High MDFs are expected for samples with high Hcr andHc values. Unfortunately, this trend in Hcr and the MDFs ofARM and SIRM is not reflected in the MDFs of the NRMs inHole 747A and appears very weak at Hole 751 A. One won-ders, therefore, whether the magnetic fraction that carries theNRM is the same as the one investigated by the rock magneticexperiments. The low intensity of an NRM, which is typically0.01-0.001 of the ARM in the same sample, suggests thatNRMs are only recorded by a fraction of the availablemagnetic grains. The recording of the paleo-field direction inour sediments in the form of a DRM is a rather inefficientprocess compared with an ARM. The presence of a high-coercivity magnetic phase in two samples in Hole 747A isreflected by a gap between the MDFs of their SIRM and IRM(Fig. 12A). The MDFs of SIRM and IRM have similar valuesin samples with magnetite as the main magnetic mineral.
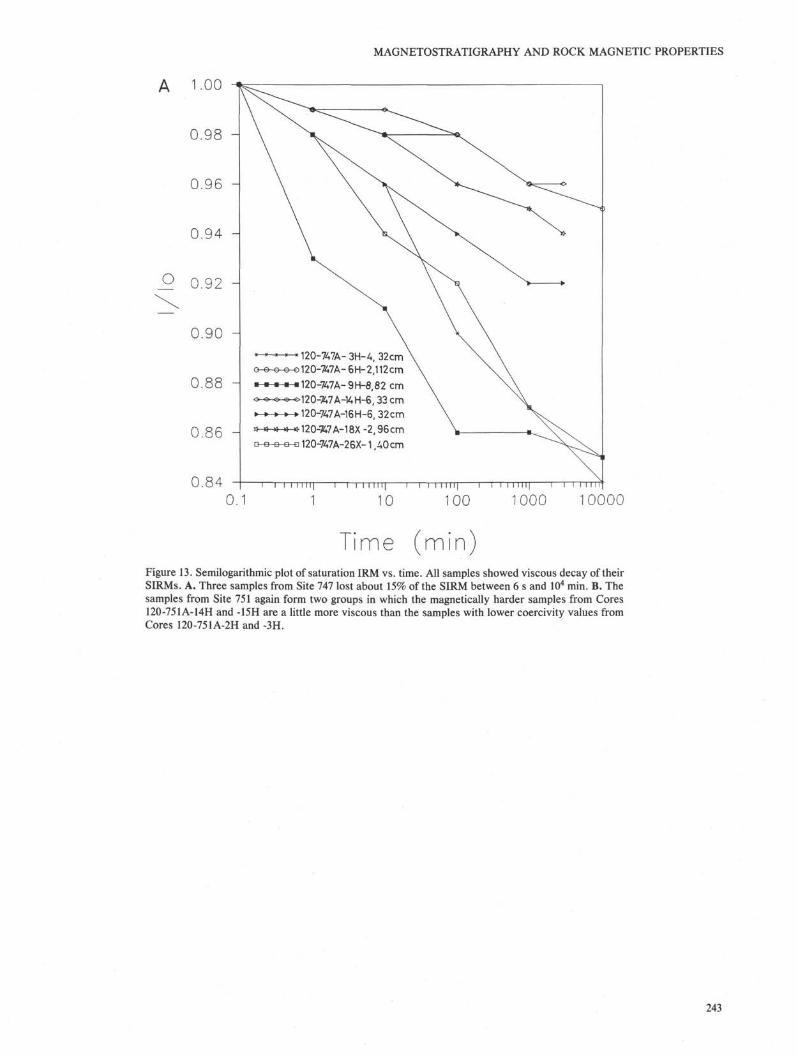
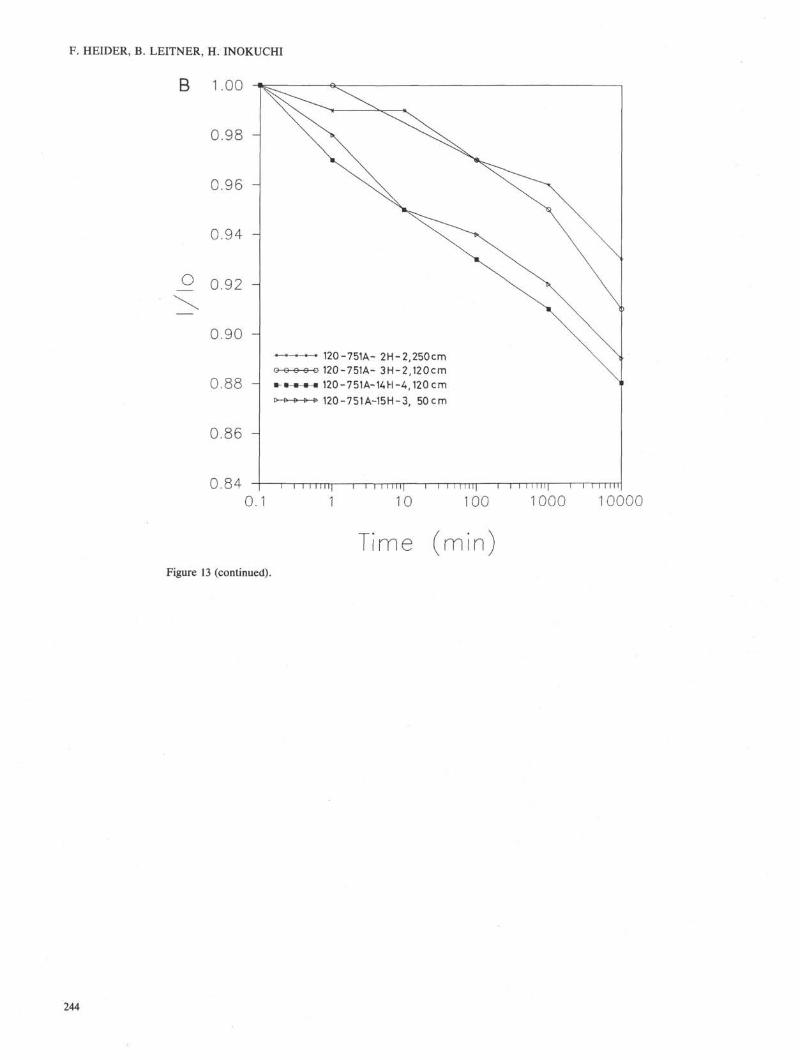
A magnetic viscosity test was carried out with the 11samples. Immediately after SIRM induction, the magnetiza-tion was measured for the first time. The samples were storedin a field free µ-metal shield and remeasured in logarithmictime increments from 1 to I04 min (Fig. 13). All samplesshowed viscous decay of the SIRM. Samples 120-747A-3H-4,32-34 cm, 120-747A-9H-8, 82-84 cm, and 120-747A-26X-1,40-42 cm, had lost about 15% of their original SIRM after I04
min (Fig. 13A). Samples 120-751A-14H-4, 120-122 cm, and120-751A-15H-3, 50-52 cm, were slightly more viscous thanSamples 120-751A-2H-2, 50-52 cm, and 120-751A-3H-2, 120-122 cm (Fig. 13B).
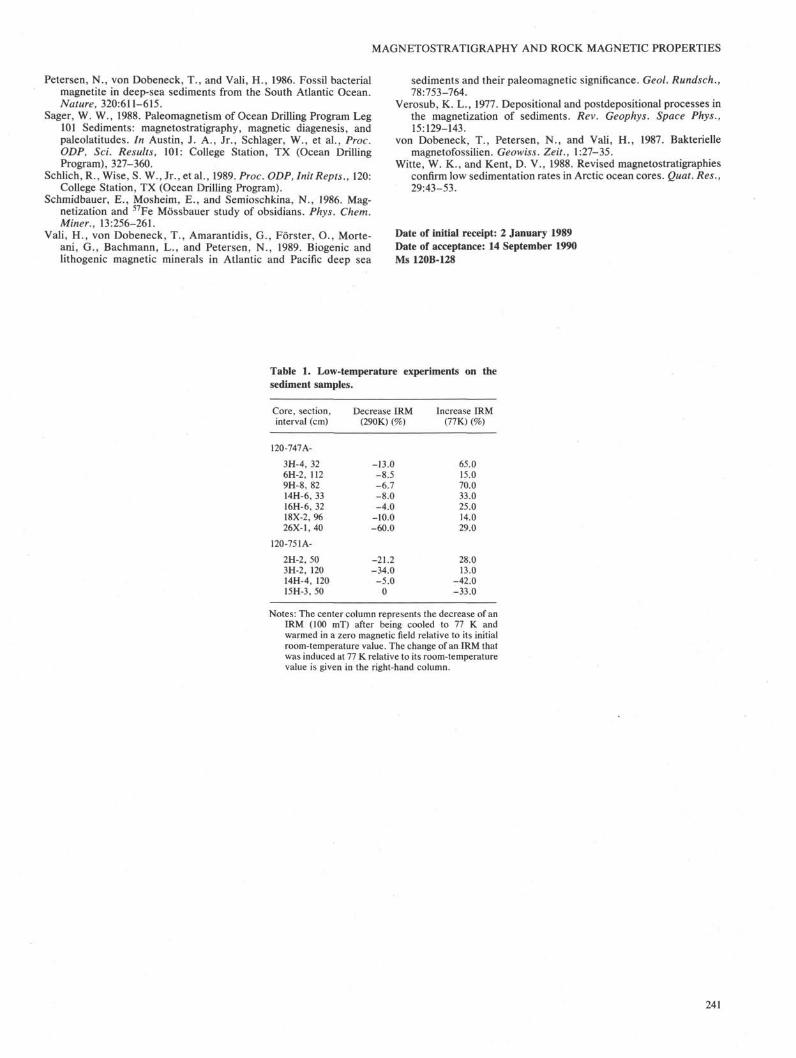
To investigate the magnetic domain structure and the originof the viscous behavior, we performed two kinds of low-temperature experiments. First, all samples were given anIRM (H = 100 mT) at 290 K and cooled down to 77 K andwarmed up to room temperature in zero magnetic field. Theremanence remaining after the low-temperature demagnetiza-tion cycle was measured at 290 K and the decrease in percentis shown in Table 1. In the case of magnetite, a zero or smalldecrease in magnetization after cooling through the point ofzero magnetocrystalline anisotropy at 120 K corresponds tomainly SD particles, whereas a large decrease in IRM as inSamples 120-747A-26X-1, 40-42 cm, 120-751A-2H-2, 50-52cm, and 120-751A-3H-2, 120-122 cm, implies that part of theremanence is carried by PSD and/or MD grains (Levi andMerrill, 1978). The four samples at Site 751 can be divided intotwo groups (see the center column of Table 1). The upper twosamples partially show a PSD/MD-like, low-temperature de-magnetization behavior, whereas the lower two samples be-have SD-like. The same division of the four samples wasfound from a comparison of Hc, Hcr, and MDFs (Fig. 12B).This argument is only valid for titanomagnetite close tomagnetite in composition because the critical temperaturedepends on the titanium content.
With the second low-temperature experiment, we wantedto look at the presence of particles that are in the superpara-
magnetic size range. The SP particles can change to the SDstate and possess a magnetic remanence at low temperatureson account of the decrease in thermal fluctuations. The 11samples were given IRMs (H - 100 mT) at 77 K, and theseIRMs of the thermally insulated samples were measured at orclose to liquid nitrogen temperature. We found that Samples120-747A-3H-4, 32-34 cm, and 120-747A-9H-8, 82-84 cm,had the highest increase in IRM at 77 K compared with theirroom temperature IRM (see third column in Table 1). Thesetwo samples are also among the three most viscous samples(Fig. 13A). It is probably safe to assume that samples with alarge fraction of SP grains contain small SD particles that aremagnetically viscous, with relaxation times on the order of thelaboratory time scale. A magnetic mineral with a Curie pointbelow room temperature could be another cause for theincrease in low-temperature IRM relative to an IRM at 290 K.So far, we have no explanation for the decrease in IRM at 77K in the lower two samples in Hole 751 A.
Magnetic Extracts from SedimentsThe magnetic fractions of our 11 sediment cubes were
obtained by passing a liquid suspension of each sample for 1week past a magnet with a strong field gradient. The magneticextracts were first investigated by scanning electron micros-copy (SEM) with attached energy dispersive X-ray analysis(EDA). Only a small fraction of the particles in the magneticseparate had iron among the cations and were potentiallymagnetic. These few particles with iron and titanium as majorcations were from 5 to 70 µm in size. Our interpretation thatthese particles are titanomagnetite and magnetite is supportedby X-ray diffraction measurements with the Debye-Scherrermethod. In the magnetic separates from three samples, wefound the three strongest lines of (titano)magnetite. We alsoobserved oxidized titanomagnetite particles with shrinkagecracks typically found in titanomaghemite from ocean-floorbasalts (Petersen and Vali, 1987).
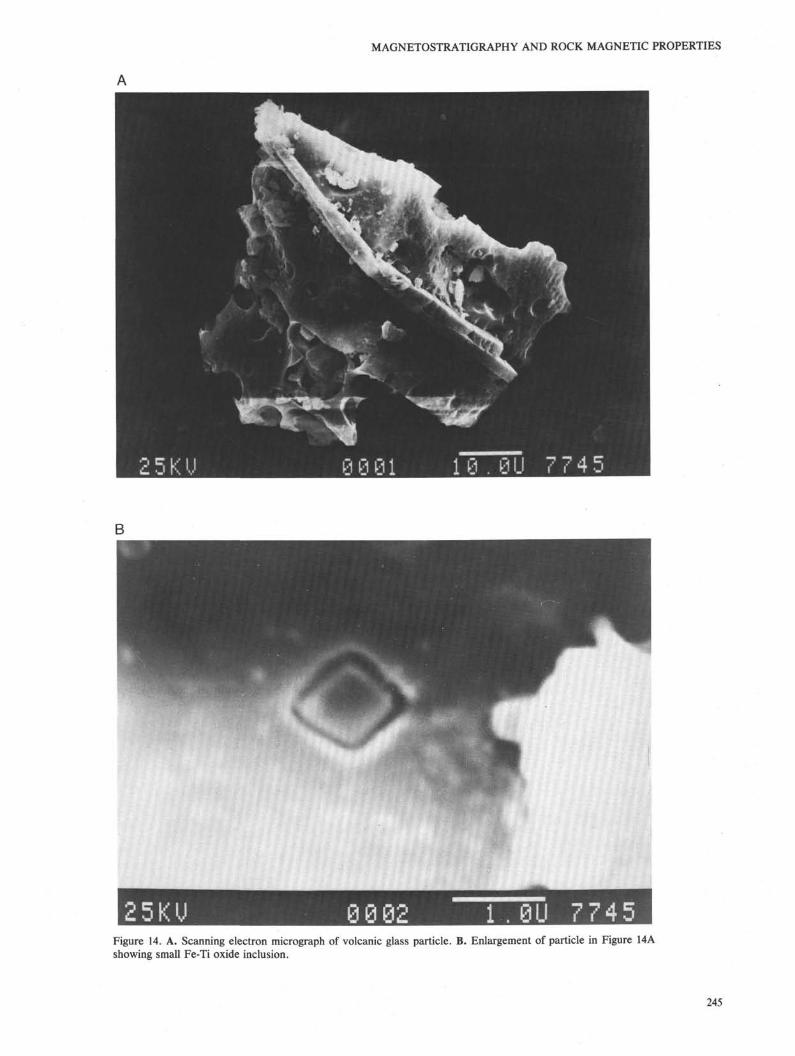
To our surprise, we found a large fraction of volcanic glassparticles in all 11 samples. These glasses were recognized byspherical inclusions that had trapped gasses during cooling.The proximity of Sites 747 and 751 to the volcanic Heard andKerguelen islands makes a continuous input of air-transportedvolcanic ash particles quite likely. These vitric volcanic ashgrains very likely contain a ferromagnetic phase since theywere extracted magnetically. Qualitative EDA of volcanicglass particles like the one in Figure 14A showed Fe and someTi among the cations Si, Ca, Al, and K. An enlargement of theparticle in Figure 14A reveals a small cubic inclusion. TheEDA of this 1-µm-size particle showed Fe as the major cation.We interpret this inclusion as an Fe-oxide surrounded by aweathered rim. Basaltic glasses are known to contain micro-lites of Fe-Ti oxide (Fisher and Schmincke, 1984). Dark glassparticles that contain small iron-titanium oxide crystallites arecalled tachylite. Small magnetite with low Ti content and PSDmagnetic properties were found in obsidian material bySchmidbauer et al. (1986). Vali et al. (1989) found from EDAusing an SEM that rock particles in magnetic separatescontained inclusions of titanomagnetite up to 1 µm in size.None of our analyses showed sulfur among the identifiedelements. We therefore exclude Fe-S substances as possiblemagnetic minerals.
We prepared two additional magnetic separates from twosample cubes from Sections 120-747A-3H-3 and 120-747A-3H-5 and Sections 120-747A-18X-1 and 120-747A-18X-3 foradetailed study of the volcanogenic component by P. Bitschene(Bochum University). The sample from Core 120-747A-3Hcontains material from a phonolithic eruption with a highcontent of crystalline grains and well-sorted vitric volcanic
MAGNETOSTRATIGRAPHY AND ROCK MAGNETIC PROPERTIES
O
1.0 1*
0.8 -
0.6 -
0.4 -
0.2 -
0.080 100
AF (mT)Figure 9. Acquisition of an isothermal remanent magnetization (IRM)and alternating field (AF) demagnetization of a saturation IRM(SIRM), both normalized to the remanence at 1.5 T. (Sample 120-747A-26X-1, 40-42 cm). The magnetic field at the intersection of bothcurves was found to be equal to the remanent coercivity Hcr (Ci-sowski, 1981).
ash particles as seen from a polished thin section. The narrowgrain-size distribution (50 ± 20 µm) points to subaerial falloutas the source of these ashes. The glasses can be subdividedinto (1) light-brown phonolithic glasses with hematite incracks; (2) dark-brown basaltic glasses with 1-5-µm-sizemagnetite; and (3) tachylite, which is opaque because of thesubmicroscopic crystallization of Fe-Ti oxides. The samplefrom Core 120-747A-18X contains vitric ash particles, whichare extremely well sorted (60 ± 20 µm). The glasses consist of(1) about 50% tachylite, opaque with reddish appearance onthe semitranslucent rim; (2) 30% altered basaltic glasses; and(3) 10% fresh basaltic glasses. The red microlite component inthe tachylite-possibly hematite-may well be the hard mag-netic phase found in Sample 120-747A-18X-2, 96-98 cm, fromIRM induction and AF demagnetization of an SIRM (Figs. 6Aand 7B). A detailed investigation of the volcanic glass parti-cles with microprobe and TEM is underway and will bepresented elsewhere.
We mounted magnetic extracts from Samples 120-747A-3H-4, 32-34 cm, 120-747A-6H-2, 112-114 cm, 120-747A-18X-2, 96-98 cm, and 120-751A-2H-2, 50-52 cm, on coppergrids for transmission electron microscopy (TEM) following amethod described by Petersen et al. (1986). The aim of theTEM investigation was to look for biogenic magnetite, whichis readily identified by the shape and size of the particles andthe tendency of magnetofossils to form chains. We found noevidence for SD magnetite particles of biogenic origin in thefour sediment extracts that we studied. This finding does notprove the absence of magnetofossils in Neogene sedimentsfrom the Kerguelen Plateau, but it does mean that othersources of small magnetic particles should be considered forthis part of the South Indian Ocean.
Support for Fe-Ti oxides as the main magnetic mineralcomes from Curie temperature determinations. In two cases,the cooling curves in IS(T) experiments showed higher satura-tion magnetization than the heating curves, which is an
-10-
-15-
-20^200-150-100-50 100 150 200 250 300
Figure 10. Magnetic hysteresis loop measured with a translationhysteresis balance. The measurement was performed on a piece of theoriginal sediment (Sample 120-747A-6H-2, 112-114 cm) and not on amagnetic separate.
indication for titanomagnetite transforming into stronger mag-netic magnetite above 200°C. Sample 120-747A-3H-4, 32-34cm, had a Curie point of about 175°C, which is characteristicof a titanomagnetite with 60% Ti content. The Curie temper-ature determinations also showed Curie points between 530°and 580°C, but it is difficult to judge if the correspondingmagnetite is a primary phase or if it was produced duringheating.
CONCLUSIONSThe preliminary magnetostratigraphy that was deter-
mined during Leg 120 could be confirmed with the land-based stepwise AF demagnetization of single samples. Thetop of Chron C3 was located in Hole 747B. The top of ChronC5 was not found, but the short normal interval (C4An3)above Chron C5 was found at 45.5 mbsf in Hole 747A. Thebottom of Chron C5 is now undetermined in Hole 747A, butit may be visible at Hole 747B at 49.9 mbsf. The two normalintervals of C5A were shifted slightly upward. Furthermore,we determined the upper normal interval of Chron C6A andthe bottom of Chron C10 in Hole 747A. The reversalsequence of Hole 751A was reinterpreted around 50 mbsfand requires confirmation by correlation with biostrati-graphic findings. Major parts of the magnetostratigraphy inHole 751A could be determined down to Chron C5E at 155mbsf. We have no more evidence for the presence of ChronC6 in our magnetic record in Hole 751A.
The rock magnetic investigation showed that titanomagne-tites with varying Ti content are the main magnetic minerals indifferent lithologic units of Sites 747 and 751. A detrital originof the carriers of the stable natural remanent magnetization istherefore very likely. Two out of 11 samples had an additionalhigh coercivity phase, which could be hematite. Lowrie-Fullertests, hysteresis measurements, and low-temperature (77 K)experiments were carried out. The magnetic domain state forall investigated samples was determined as SD to small PSDwith occasional superparamagnetic contributions. Two sam-ples with high SP grain-size fractions were among the mostviscous samples. We conjecture that particles just above theSP/SD boundary with relaxation times on the order of minutesare the most likely candidates for the magnetic viscosity. Alarge fraction of volcanic glass particles was concentrated inthe magnetic separates. These volcanic glass particles may bemagnetic because of submicron precipitate (microlite) of tita-
239
F. HEIDER, B. LEITNER, H. INOKUCHI
00
\COen
n Ru. o
0.4 -
0.3 -
0.2 -
0.1 -
SD
*
* * * * * Site 747* * * * * ^ I T ^ / ^ Iv r w w w w O I L " / J I
*
PSD
* **
i i
MD
0 1.0 2.0HCR
4.0 5.0
Figure 11. Diagram of reduced saturation remanence IJIS vs. the coercivity ratio HcrIHc after Day et al. (1977). /„ is saturation remanence, Is
is saturation magnetization, Hcr is coercivity of remanence, and Hc is coercive force. The results from the sediments of Sites 747 and 751 plotin an area characteristic of small pseudo-single-domain (PSD) particles. The samples with IrJIs ratios close to 0.5 contain a major fraction ofparticles in the single domain (SD) state, if one considers the presence of superparamagnetic grains. MD = multidomain.
nomagnetite and hematite that are known to occur in basalticglasses.
ACKNOWLEDGMENTS
Financial support and travel funds from D. J. Dunlop(Toronto) and from ODP Germany are gratefully acknowl-edged. We thank Thilo von Dobeneck for use of his translationhysteresis balance and N. Petersen, H. C. Soffel, J. Froh(Munich), and H. Vali (Montreal) for advice and discussions.The cooperation of P. Bitschene (Bochum) during the inves-tigation of the volcanic ashes-was highly appreciated.
REFERENCES
Bailey, M. E., and Dunlop, D. J., 1983. Alternating field characteris-tics of pseudo-single-domain (2-14 µm) and multidomain magne-tite. Earth Planet. Sci. Lett., 63:335-352.
Berggren, W. A., Kent, D. V., Flynn, J. J., and Van Couvering, J. A.,1985. Cenozoic geochronology. Geol. Soc. Am. Bull., 96:1407-1418.
Cisowski, S., 1981. Interacting vs. non-interacting single domainbehavior in natural and synthetic samples. Phys. Earth Planet.Inter., 26:56-62.
Day, R., Fuller, M., and Schmidt, V. A., 1977. Hysteresis propertiesof titanomagnetites: grain-size and compositional dependence.Phys. Earth Planet. Inter., 13:260-267.
Dunlop, D. J., 1981. The rock magnetism of fine particles. Phys. EarthPlanet. Inter., 26:1-26.
Fisher, R. V., and Schmincke, H.-U., 1984. Pyroclastic Rocks: NewYork (Springer-Verlag).
Heider, F., 1988. Magnetic properties of hydrothermally grown Fe3O4crystals [Ph.D. dissert.]. Univ. of Toronto.
Heider, F., Dunlop, D. J., and Sugiura, N., 1987. Magnetic propertiesof hydrothermally recrystallized magnetite crystals. Science,236:1287-1290.
Karlin, R., and Levi, S., 1985. Geochemical and sedimentologicalcontrol of the magnetic properties of hemipelagic sediments. J.Geophys. Res., 90:10373-10392.
Levi, S., and Merrill, R. T., 1978. Properties of single-domain,pseudo-single-domain, and multidomain magnetite. J. Geophys.Res., 83:309-323.
Lowrie, W., and Fuller, M., 1971. On the alternating field demagne-tization characteristics of multidomain thermoremanent magneti-zation in magnetite. / . Geophys. Res., 76:6339-6349.
Petersen, N., and Vali, H., 1987. Observation of shrinkage cracks inocean-floor titanomagnetites. Phys. Earth Planet. Inter., 46:197-205.
240
MAGNETOSTRATIGRAPHY AND ROCK MAGNETIC PROPERTIES
Petersen, N., von Dobeneck, T., and Vali, H., 1986. Fossil bacterialmagnetite in deep-sea sediments from the South Atlantic Ocean.Nature, 320:611-615.
Sager, W. W., 1988. Paleomagnetism of Ocean Drilling Program Leg101 Sediments: magnetostratigraphy, magnetic diagenesis, andpaleolatitudes. In Austin, J. A., Jr., Schlager, W., et al., Proc.ODP, Sci. Results, 101: College Station, TX (Ocean DrillingProgram), 327-360.
Schlich, R., Wise, S. W., Jr., et al., 1989. Proc. ODP, InitRepts., 120:College Station, TX (Ocean Drilling Program).
Schmidbauer, E., Mosheim, E., and Semioschkina, N., 1986. Mag-netization and 57Fe Mössbauer study of obsidians. Phys. Chem.Miner., 13:256-261.
Vali, H., von Dobeneck, T., Amarantidis, G., Förster, O., Morte-ani, G., Bachmann, L., and Petersen, N., 1989. Biogenic andlithogenic magnetic minerals in Atlantic and Pacific deep sea
sediments and their paleomagnetic significance. Geol. Rundsch.,78:753-764.
Verosub, K. L., 1977. Depositional and postdepositional processes inthe magnetization of sediments. Rev. Geophys. Space Phys.,15:129-143.
von Dobeneck, T., Petersen, N., and Vali, H., 1987. Bakteriellemagnetofossilien. Geowiss. Zeit., 1:27-35.
Witte, W. K., and Kent, D. V., 1988. Revised magnetostratigraphiesconfirm low sedimentation rates in Arctic ocean cores. Quat. Res.,29:43-53.
Date of initial receipt: 2 January 1989Date of acceptance: 14 September 1990Ms 120B-128
Table 1. Low-temperature experiments on thesediment samples.
Core, section,interval (cm)
120-747A-
3H-4, 326H-2, 1129H-8, 8214H-6, 3316H-6, 3218X-2, 9626X-1, 40
120-751A-
2H-2, 503H-2, 12014H-4, 12015H-3, 50
Decrease IRM(290K) (%)
-13.0-8.5-6.7-8.0-4.0
-10.0-60.0
-21.2-34.0-5.0
0
Increase IRM(77K) (%)
65.015.070.033.025.014.029.0
28.013.0
-42.0-33.0
Notes: The center column represents the decrease of anIRM (100 mT) after being cooled to 77 K andwarmed in a zero magnetic field relative to its initialroom-temperature value. The change of an IRM thatwas induced at 77 K relative to its room-temperaturevalue is given in the right-hand column.
241
F. HEIDER, B. LEITNER, H. INOKUCHI
Hc Her MDFNRM MDFARM MDF,(S)IRM15 20 25 3030 40 50 60 70 0 10 20 30 20 25 30 3520 30 40 50
B mT) H, H MDFf MDR MDR15 20 25 3030
Figure 12. Downhole plots of coercive forces (Hc and Hcr) and median destructive fields of NRM, ARM, IRM, and saturation IRM. A. At Hole747A there is little correlation between the MDF of NRM and the other magnetic parameters. There is a large gap between the MDFs of IRM(100 mT) and SIRM for two samples that have a high coercivity phase. B. The four samples from Hole 751A fall into two groups with regard totheir magnetic "hardness."
242
MAGNETOSTRATIGRAPHY AND ROCK MAGNETIC PROPERTIES
A 1.00
0.98 -
0.96 -
120-7A7A120-7U7A120-747A120-X7A120-7A7A120-TtfA120-7A7A
• 3H-4, 32cm6H-2,112cm
•9H-8,82cm•14H-6,33cm16H-6, 32cm18X-2,96cm26X-1,40cm
0.840000
Time (minFigure 13. Semilogarithmic plot of saturation IRM vs. time. All samples showed viscous decay of theirSIRMs. A. Three samples from Site 747 lost about 15% of the SIRM between 6 s and I04 min. B. Thesamples from Site 751 again form two groups in which the magnetically harder samples from Cores120-751A-14H and -15H are a little more viscous than the samples with lower coercivity values fromCores 120-751A-2H and -3H.
243
F. HEIDER, B. LEITNER, H. INOKUCHI
B 1.00
120-751A- 2H-2,250cm120-751A- 3H-2,120cm120-751A-14H-4,120cm120-751A-15H-3, 50cm
0.84 1 I I I I I I l| I I I I I I I 11 I I I I I I I 11 I I I I I I I 11 I 111
1 10 100 1000 10000
Time (minFigure 13 (continued).
244
MAGNETOSTRATIGRAPHY AND ROCK MAGNETIC PROPERTIES
25KU 0002 i .011 7745Figure 14. A. Scanning electron micrograph of volcanic glass particle. B. Enlargement of particle in Figure 14Ashowing small Fe-Ti oxide inclusion.
245