Embed Size (px)
Citation preview
ORIGINAL PAPER
Petrogenesis of lamprophyre and associated diabase dykes in WadiMandar-Um Adawi area, South Sinai, Egypt
Waheed I. Elwan1& Shehta E. Abd Allah1
Received: 3 November 2017 /Accepted: 1 May 2018 /Published online: 10 May 2018# Saudi Society for Geosciences 2018
AbstractThe mafic dykes in Wadi Mandar-Wadi Um Adawi area are as follows: (1) calc-alkaline lamprophyre (i.e., kersantite andspessartite), (2) diabase, and (3) alkaline lamprophyre (i.e., camptonite). The field relations reveal that the emplacement ofcalc-alkaline lamprophyres preceded the diabase dykes, while alkaline lamprophyres emplaced later than the diabase dykes.Calc-alkaline are basaltic andesite, basaltic trachyandesite to basalt, while the diabase dykes and alkaline lamprophyres arebasaltic in composition. These dykes are characterized by metaluminous character. Calc-alkaline lamprophyres and diabasedykes show transitional affinity from calc-alkaline to alkaline, while the alkaline lamprophyres exhibit more strong alkalinecharacter. The mafic dykes were crystallized under temperature 1100–1150 °C and pressure 3–5 kbars in a high oxygen fugacityconditions. Fe-Ti oxides in the dykes are represented by ilmenite and Ti-magnetite. The chemistry of the sulfides hosted in thosemafic dykes suggests a magmatic-hydrothermal origin for these minerals. The geochemical behavior of high field strengthelements and large ion lithophile elements in these dykes excludes the derivation of diabase or alkaline lamprophyre either bypartial melting or fractional crystallization from calc-alkaline lamprophyre. The parental magmatic sources of the studied dykeswere generated from crustal material with addition of mantle-derived melt during the post-collisional stage. The mafic dykes inWadiMandar-Wadi UmAdawi area were generated from different magmatic sources by partial melting and subsequent fractionalcrystallization. In addition, the crustal contamination/assimilation process has a prominent role in the magmatic evolution ofdiabase and alkaline lamprophyre dykes.
Keywords Lamprophyre . Diabase . South Sinai . Arabo-Nubian shield
Introduction
One of the main characteristic features of the southern Sinaimassif, as in many other parts of Arabo-Nubian Shield, is theunusual density of dykes including lamprophyre as minor in-trusions. The dyke system in Sinai is thought to be part of thePrecambrian basement, which include from oldest to youn-gest: (1) island arc calc-alkaline granitoids (820–740 Ma;Bentor 1985; Stern and Hedge 1985; Moghazi 1999), (2)syn-collision medium to high-K calc-alkaline granitoids(670–635 Ma; Greenberg 1981; Moghazi 2002;), (3) post-collision alkaline granitoids (640–610 Ma; Jarrar et al. 2003,
2008), (4) dykes and veins, and (5) within-plate alkaline andperalkaline granites (600–550 Ma; Liégeois 1998). Eyal andEyal (1987) recognized three different episodes of dyke em-placements in Sinai and Eastern Desert: (1) a metamorphosedsyn-tectonic dykes (800–650 Ma); (2) unmetamorphosedpost-orogenic dykes (591–459 Ma; Halpern and Tristan1981; Stern and Manton 1987; Stern and Voegeli 1987;Schandelmeier et al. 1994); and (3) Neogene dykes (30–12 Ma; Meneisy 1990; Camp and Roobol 1992), which arerelated to Red Sea rift system. Many workers consider that thedykes in the Egyptian basement reflect a transitional periodfrom compressional subduction to extension-relatedmagmatism (Abdel-Rahman 1996; Mohamed et al. 2000).Shafranek (1978) described the following sequence of dykesin southeastern Sinai: (1) spessartite dykes trending NNE, (2)kersantite and spessartite dykes trending ENE, (3) diabasedykes trending NE-SW, (4) camptonite dykes trending NNE,and (5) diabase dykes trending WNW. Kabesh et al. (1978)related the calc-alkaline lamprophyre (CAL) and alkaline
* Waheed I. [email protected]
1 Geology Department, Faculty of Science, Zagazig University,Zagazig, Sharkia 4459, Egypt
Arabian Journal of Geosciences (2018) 11: 223https://doi.org/10.1007/s12517-018-3585-4
lamprophyre (AL) to the same magmatic source, whileLehmann (1977) and Basta et al. (1985) supposed that theyare totally unrelated. This paper presents new geological data,mineral chemistry, and new geochemical data that allow amuch broader perspective for the lamprophyre and diabasedykes at Wadi Um Adawi-Wadi Mandar area, southeasternSinai.
Geological setting
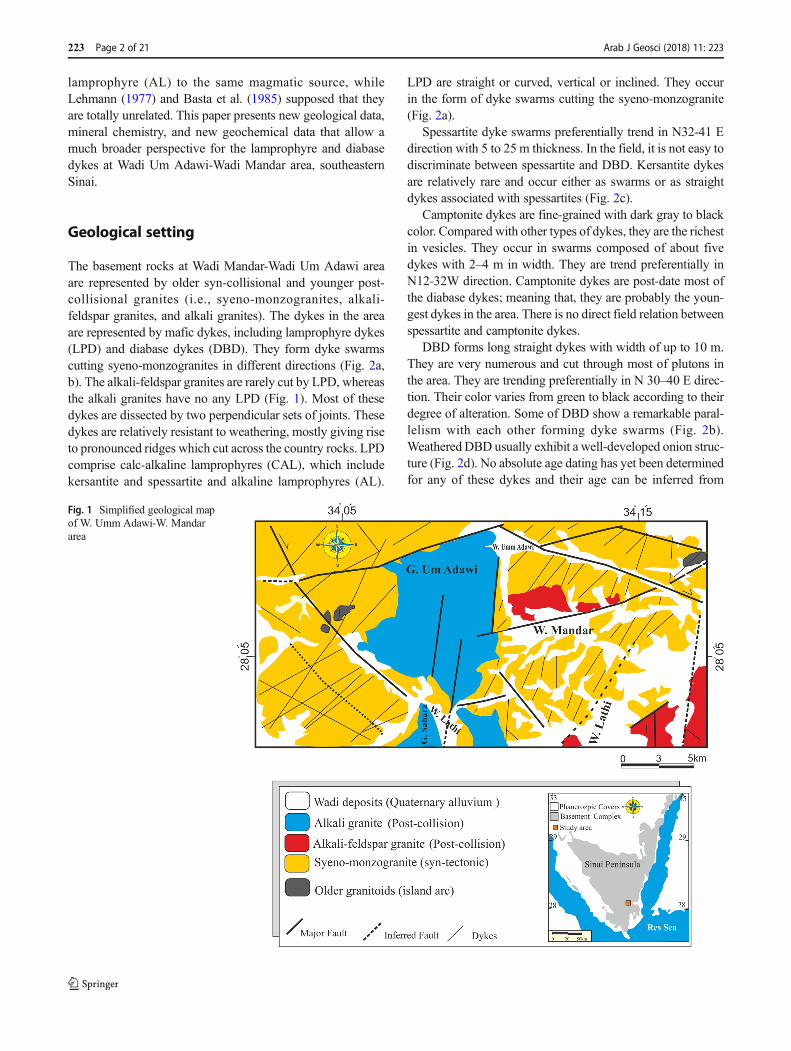
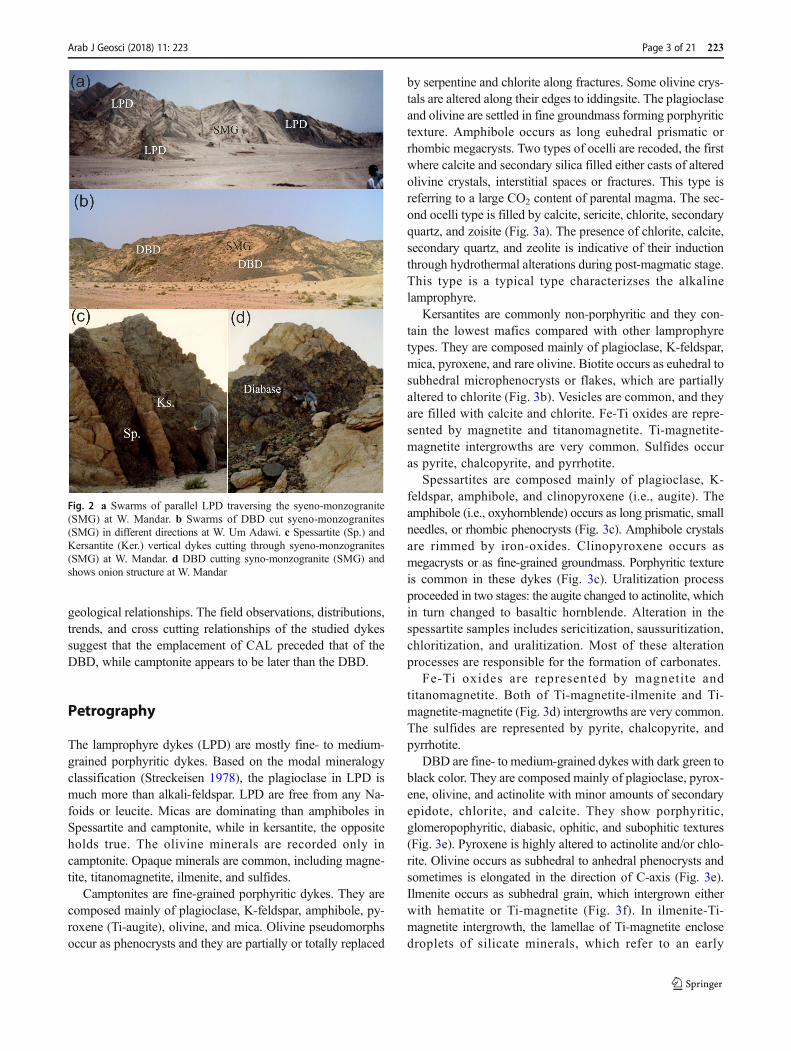
The basement rocks at Wadi Mandar-Wadi Um Adawi areaare represented by older syn-collisional and younger post-collisional granites (i.e., syeno-monzogranites, alkali-feldspar granites, and alkali granites). The dykes in the areaare represented by mafic dykes, including lamprophyre dykes(LPD) and diabase dykes (DBD). They form dyke swarmscutting syeno-monzogranites in different directions (Fig. 2a,b). The alkali-feldspar granites are rarely cut by LPD, whereasthe alkali granites have no any LPD (Fig. 1). Most of thesedykes are dissected by two perpendicular sets of joints. Thesedykes are relatively resistant to weathering, mostly giving riseto pronounced ridges which cut across the country rocks. LPDcomprise calc-alkaline lamprophyres (CAL), which includekersantite and spessartite and alkaline lamprophyres (AL).
LPD are straight or curved, vertical or inclined. They occurin the form of dyke swarms cutting the syeno-monzogranite(Fig. 2a).
Spessartite dyke swarms preferentially trend in N32-41 Edirection with 5 to 25 m thickness. In the field, it is not easy todiscriminate between spessartite and DBD. Kersantite dykesare relatively rare and occur either as swarms or as straightdykes associated with spessartites (Fig. 2c).
Camptonite dykes are fine-grained with dark gray to blackcolor. Compared with other types of dykes, they are the richestin vesicles. They occur in swarms composed of about fivedykes with 2–4 m in width. They are trend preferentially inN12-32W direction. Camptonite dykes are post-date most ofthe diabase dykes; meaning that, they are probably the youn-gest dykes in the area. There is no direct field relation betweenspessartite and camptonite dykes.
DBD forms long straight dykes with width of up to 10 m.They are very numerous and cut through most of plutons inthe area. They are trending preferentially in N 30–40 E direc-tion. Their color varies from green to black according to theirdegree of alteration. Some of DBD show a remarkable paral-lelism with each other forming dyke swarms (Fig. 2b).Weathered DBD usually exhibit a well-developed onion struc-ture (Fig. 2d). No absolute age dating has yet been determinedfor any of these dykes and their age can be inferred from
Fig. 1 Simplified geological mapof W. Umm Adawi-W. Mandararea
223 Page 2 of 21 Arab J Geosci (2018) 11: 223
geological relationships. The field observations, distributions,trends, and cross cutting relationships of the studied dykessuggest that the emplacement of CAL preceded that of theDBD, while camptonite appears to be later than the DBD.
Petrography
The lamprophyre dykes (LPD) are mostly fine- to medium-grained porphyritic dykes. Based on the modal mineralogyclassification (Streckeisen 1978), the plagioclase in LPD ismuch more than alkali-feldspar. LPD are free from any Na-foids or leucite. Micas are dominating than amphiboles inSpessartite and camptonite, while in kersantite, the oppositeholds true. The olivine minerals are recorded only incamptonite. Opaque minerals are common, including magne-tite, titanomagnetite, ilmenite, and sulfides.
Camptonites are fine-grained porphyritic dykes. They arecomposed mainly of plagioclase, K-feldspar, amphibole, py-roxene (Ti-augite), olivine, and mica. Olivine pseudomorphsoccur as phenocrysts and they are partially or totally replaced
by serpentine and chlorite along fractures. Some olivine crys-tals are altered along their edges to iddingsite. The plagioclaseand olivine are settled in fine groundmass forming porphyritictexture. Amphibole occurs as long euhedral prismatic orrhombic megacrysts. Two types of ocelli are recoded, the firstwhere calcite and secondary silica filled either casts of alteredolivine crystals, interstitial spaces or fractures. This type isreferring to a large CO2 content of parental magma. The sec-ond ocelli type is filled by calcite, sericite, chlorite, secondaryquartz, and zoisite (Fig. 3a). The presence of chlorite, calcite,secondary quartz, and zeolite is indicative of their inductionthrough hydrothermal alterations during post-magmatic stage.This type is a typical type characterizses the alkalinelamprophyre.
Kersantites are commonly non-porphyritic and they con-tain the lowest mafics compared with other lamprophyretypes. They are composed mainly of plagioclase, K-feldspar,mica, pyroxene, and rare olivine. Biotite occurs as euhedral tosubhedral microphenocrysts or flakes, which are partiallyaltered to chlorite (Fig. 3b). Vesicles are common, and theyare filled with calcite and chlorite. Fe-Ti oxides are repre-sented by magnetite and titanomagnetite. Ti-magnetite-magnetite intergrowths are very common. Sulfides occuras pyrite, chalcopyrite, and pyrrhotite.
Spessartites are composed mainly of plagioclase, K-feldspar, amphibole, and clinopyroxene (i.e., augite). Theamphibole (i.e., oxyhornblende) occurs as long prismatic, smallneedles, or rhombic phenocrysts (Fig. 3c). Amphibole crystalsare rimmed by iron-oxides. Clinopyroxene occurs asmegacrysts or as fine-grained groundmass. Porphyritic textureis common in these dykes (Fig. 3c). Uralitization processproceeded in two stages: the augite changed to actinolite, whichin turn changed to basaltic hornblende. Alteration in thespessartite samples includes sericitization, saussuritization,chloritization, and uralitization. Most of these alterationprocesses are responsible for the formation of carbonates.
Fe-Ti oxides are represented by magnetite andtitanomagnetite. Both of Ti-magnetite-ilmenite and Ti-magnetite-magnetite (Fig. 3d) intergrowths are very common.The sulfides are represented by pyrite, chalcopyrite, andpyrrhotite.
DBD are fine- to medium-grained dykes with dark green toblack color. They are composed mainly of plagioclase, pyrox-ene, olivine, and actinolite with minor amounts of secondaryepidote, chlorite, and calcite. They show porphyritic,glomeropophyritic, diabasic, ophitic, and subophitic textures(Fig. 3e). Pyroxene is highly altered to actinolite and/or chlo-rite. Olivine occurs as subhedral to anhedral phenocrysts andsometimes is elongated in the direction of C-axis (Fig. 3e).Ilmenite occurs as subhedral grain, which intergrown eitherwith hematite or Ti-magnetite (Fig. 3f). In ilmenite-Ti-magnetite intergrowth, the lamellae of Ti-magnetite enclosedroplets of silicate minerals, which refer to an early
Fig. 2 a Swarms of parallel LPD traversing the syeno-monzogranite(SMG) at W. Mandar. b Swarms of DBD cut syeno-monzogranites(SMG) in different directions at W. Um Adawi. c Spessartite (Sp.) andKersantite (Ker.) vertical dykes cutting through syeno-monzogranites(SMG) at W. Mandar. d DBD cutting syno-monzogranite (SMG) andshows onion structure at W. Mandar
Arab J Geosci (2018) 11: 223 Page 3 of 21 223
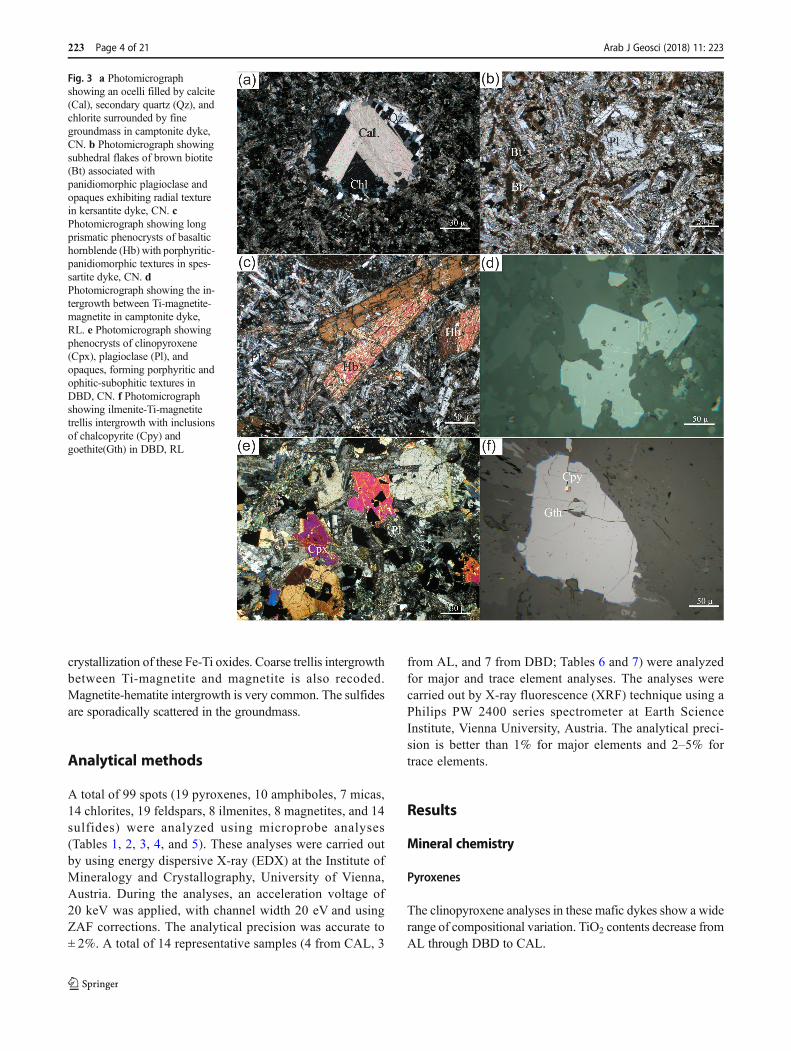
crystallization of these Fe-Ti oxides. Coarse trellis intergrowthbetween Ti-magnetite and magnetite is also recoded.Magnetite-hematite intergrowth is very common. The sulfidesare sporadically scattered in the groundmass.
Analytical methods
A total of 99 spots (19 pyroxenes, 10 amphiboles, 7 micas,14 chlorites, 19 feldspars, 8 ilmenites, 8 magnetites, and 14sulfides) were analyzed using microprobe analyses(Tables 1, 2, 3, 4, and 5). These analyses were carried outby using energy dispersive X-ray (EDX) at the Institute ofMineralogy and Crystallography, University of Vienna,Austria. During the analyses, an acceleration voltage of20 keV was applied, with channel width 20 eV and usingZAF corrections. The analytical precision was accurate to± 2%. A total of 14 representative samples (4 from CAL, 3
from AL, and 7 from DBD; Tables 6 and 7) were analyzedfor major and trace element analyses. The analyses werecarried out by X-ray fluorescence (XRF) technique using aPhilips PW 2400 series spectrometer at Earth ScienceInstitute, Vienna University, Austria. The analytical preci-sion is better than 1% for major elements and 2–5% fortrace elements.
Results
Mineral chemistry
Pyroxenes
The clinopyroxene analyses in these mafic dykes show a widerange of compositional variation. TiO2 contents decrease fromAL through DBD to CAL.
Fig. 3 a Photomicrographshowing an ocelli filled by calcite(Cal), secondary quartz (Qz), andchlorite surrounded by finegroundmass in camptonite dyke,CN. b Photomicrograph showingsubhedral flakes of brown biotite(Bt) associated withpanidiomorphic plagioclase andopaques exhibiting radial texturein kersantite dyke, CN. cPhotomicrograph showing longprismatic phenocrysts of basaltichornblende (Hb) with porphyritic-panidiomorphic textures in spes-sartite dyke, CN. dPhotomicrograph showing the in-tergrowth between Ti-magnetite-magnetite in camptonite dyke,RL. e Photomicrograph showingphenocrysts of clinopyroxene(Cpx), plagioclase (Pl), andopaques, forming porphyritic andophitic-subophitic textures inDBD, CN. f Photomicrographshowing ilmenite-Ti-magnetitetrellis intergrowth with inclusionsof chalcopyrite (Cpy) andgoethite(Gth) in DBD, RL
223 Page 4 of 21 Arab J Geosci (2018) 11: 223
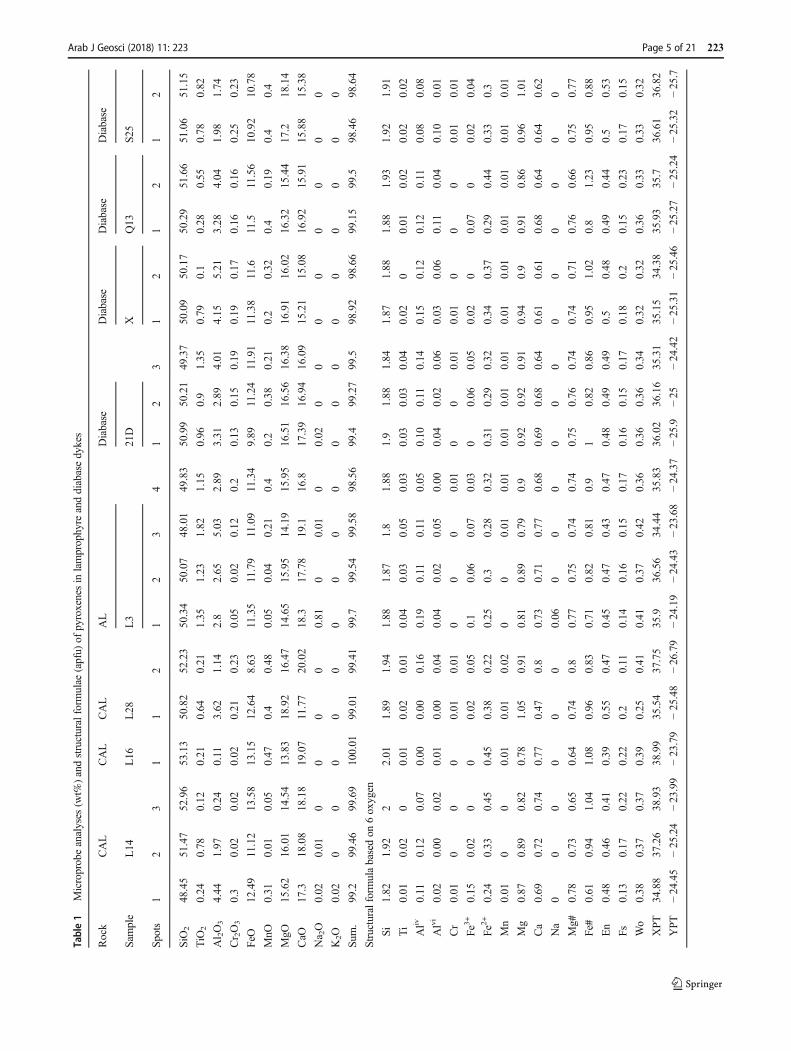
Table1
Microprobeanalyses
(wt%
)andstructuralform
ulae
(apfu)
ofpyroxenesin
lamprophyre
anddiabasedykes
Rock
CAL
CAL
CAL
AL
Diabase
Diabase
Diabase
Diabase
Sample
L14
L16
L28
L3
21D
XQ13
S25
Spots
12
31
12
12
34
12
31
21
21
2
SiO
248.45
51.47
52.96
53.13
50.82
52.23
50.34
50.07
48.01
49.83
50.99
50.21
49.37
50.09
50.17
50.29
51.66
51.06
51.15
TiO
20.24
0.78
0.12
0.21
0.64
0.21
1.35
1.23
1.82
1.15
0.96
0.9
1.35
0.79
0.1
0.28
0.55
0.78
0.82
Al 2O3
4.44
1.97
0.24
0.11
3.62
1.14
2.8
2.65
5.03
2.89
3.31
2.89
4.01
4.15
5.21
3.28
4.04
1.98
1.74
Cr 2O3
0.3
0.02
0.02
0.02
0.21
0.23
0.05
0.02
0.12
0.2
0.13
0.15
0.19
0.19
0.17
0.16
0.16
0.25
0.23
FeO
12.49
11.12
13.58
13.15
12.64
8.63
11.35
11.79
11.09
11.34
9.89
11.24
11.91
11.38
11.6
11.5
11.56
10.92
10.78
MnO
0.31
0.01
0.05
0.47
0.4
0.48
0.05
0.04
0.21
0.4
0.2
0.38
0.21
0.2
0.32
0.4
0.19
0.4
0.4
MgO
15.62
16.01
14.54
13.83
18.92
16.47
14.65
15.95
14.19
15.95
16.51
16.56
16.38
16.91
16.02
16.32
15.44
17.2
18.14
CaO
17.3
18.08
18.18
19.07
11.77
20.02
18.3
17.78
19.1
16.8
17.39
16.94
16.09
15.21
15.08
16.92
15.91
15.88
15.38
Na 2O
0.02
0.01
00
00
0.81
00.01
00.02
00
00
00
00
K2O
0.02
00
00
00
00
00
00
00
00
00
Sum.
99.2
99.46
99.69
100.01
99.01
99.41
99.7
99.54
99.58
98.56
99.4
99.27
99.5
98.92
98.66
99.15
99.5
98.46
98.64
Structuralform
ulabasedon
6oxygen
Si1.82
1.92
22.01
1.89
1.94
1.88
1.87
1.8
1.88
1.9
1.88
1.84
1.87
1.88
1.88
1.93
1.92
1.91
Ti
0.01
0.02
00.01
0.02
0.01
0.04
0.03
0.05
0.03
0.03
0.03
0.04
0.02
00.01
0.02
0.02
0.02
Aliv
0.11
0.12
0.07
0.00
0.00
0.16
0.19
0.11
0.11
0.05
0.10
0.11
0.14
0.15
0.12
0.12
0.11
0.08
0.08
Alvi
0.02
0.00
0.02
0.01
0.00
0.04
0.04
0.02
0.05
0.00
0.04
0.02
0.06
0.03
0.06
0.11
0.04
0.10
0.01
Cr
0.01
00
00.01
0.01
00
00.01
00
0.01
0.01
00
00.01
0.01
Fe3+
0.15
0.02
00
0.02
0.05
0.1
0.06
0.07
0.03
00.06
0.05
0.02
00.07
00.02
0.04
Fe2+
0.24
0.33
0.45
0.45
0.38
0.22
0.25
0.3
0.28
0.32
0.31
0.29
0.32
0.34
0.37
0.29
0.44
0.33
0.3
Mn
0.01
00
0.01
0.01
0.02
00
0.01
0.01
0.01
0.01
0.01
0.01
0.01
0.01
0.01
0.01
0.01
Mg
0.87
0.89
0.82
0.78
1.05
0.91
0.81
0.89
0.79
0.9
0.92
0.92
0.91
0.94
0.9
0.91
0.86
0.96
1.01
Ca
0.69
0.72
0.74
0.77
0.47
0.8
0.73
0.71
0.77
0.68
0.69
0.68
0.64
0.61
0.61
0.68
0.64
0.64
0.62
Na
00
00
00
0.06
00
00
00
00
00
00
Mg#
0.78
0.73
0.65
0.64
0.74
0.8
0.77
0.75
0.74
0.74
0.75
0.76
0.74
0.74
0.71
0.76
0.66
0.75
0.77
Fe#
0.61
0.94
1.04
1.08
0.96
0.83
0.71
0.82
0.81
0.9
10.82
0.86
0.95
1.02
0.8
1.23
0.95
0.88
En
0.48
0.46
0.41
0.39
0.55
0.47
0.45
0.47
0.43
0.47
0.48
0.49
0.49
0.5
0.48
0.49
0.44
0.5
0.53
Fs0.13
0.17
0.22
0.22
0.2
0.11
0.14
0.16
0.15
0.17
0.16
0.15
0.17
0.18
0.2
0.15
0.23
0.17
0.15
Wo
0.38
0.37
0.37
0.39
0.25
0.41
0.41
0.37
0.42
0.36
0.36
0.36
0.34
0.32
0.32
0.36
0.33
0.33
0.32
XPT
34.88
37.26
38.93
38.99
35.54
37.75
35.9
36.56
34.44
35.83
36.02
36.16
35.31
35.15
34.38
35.93
35.7
36.61
36.82
YPT
−24.45
−25.24
−23.99
−23.79
−25.48
−26.79
−24.19
−24.43
−23.68
−24.37
−25.9
−25
−24.42
−25.31
−25.46
−25.27
−25.24
−25.32
−25.7
Arab J Geosci (2018) 11: 223 Page 5 of 21 223
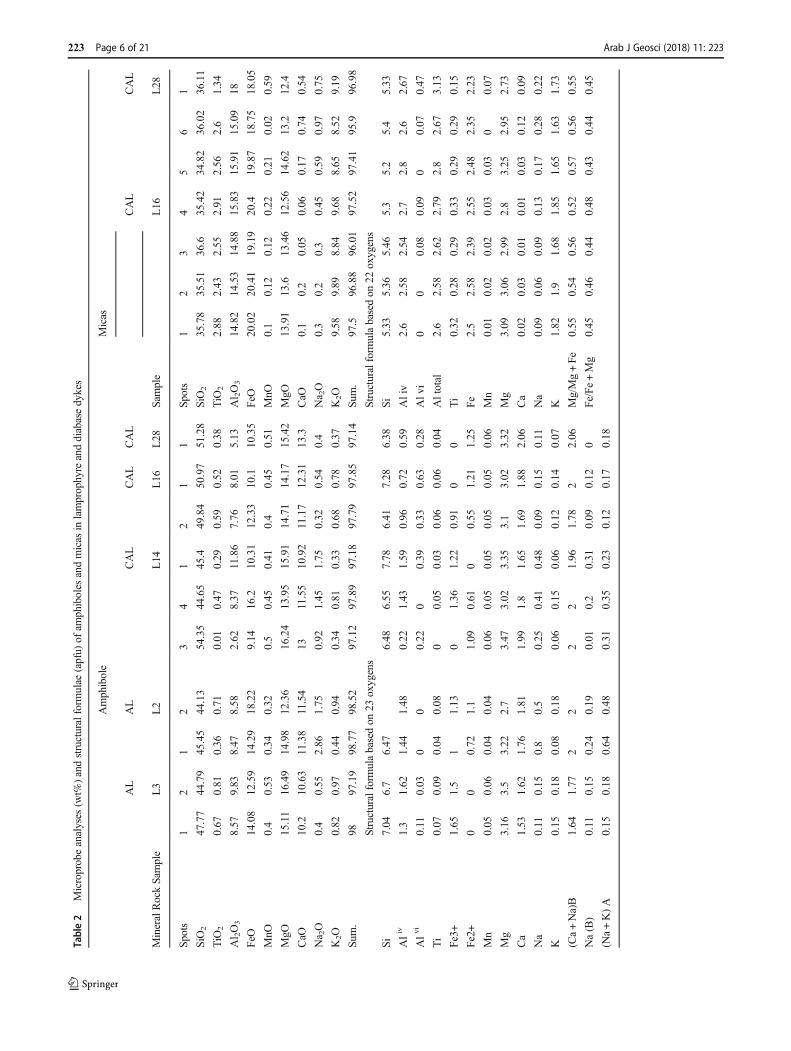
Table2
Microprobeanalyses
(wt%
)andstructuralform
ulae
(apfu)
ofam
phiboles
andmicas
inlamprophyre
anddiabasedykes
Amphibole
Micas
AL
AL
CAL
CAL
CAL
CAL
CAL
MineralRockSample
L3
L2
L14
L16
L28
Sample
L16
L28
Spots
12
12
34
12
11
Spots
12
34
56
1
SiO
247.77
44.79
45.45
44.13
54.35
44.65
45.4
49.84
50.97
51.28
SiO2
35.78
35.51
36.6
35.42
34.82
36.02
36.11
TiO
20.67
0.81
0.36
0.71
0.01
0.47
0.29
0.59
0.52
0.38
TiO
22.88
2.43
2.55
2.91
2.56
2.6
1.34
Al 2O3
8.57
9.83
8.47
8.58
2.62
8.37
11.86
7.76
8.01
5.13
Al 2O3
14.82
14.53
14.88
15.83
15.91
15.09
18
FeO
14.08
12.59
14.29
18.22
9.14
16.2
10.31
12.33
10.1
10.35
FeO
20.02
20.41
19.19
20.4
19.87
18.75
18.05
MnO
0.4
0.53
0.34
0.32
0.5
0.45
0.41
0.4
0.45
0.51
MnO
0.1
0.12
0.12
0.22
0.21
0.02
0.59
MgO
15.11
16.49
14.98
12.36
16.24
13.95
15.91
14.71
14.17
15.42
MgO
13.91
13.6
13.46
12.56
14.62
13.2
12.4
CaO
10.2
10.63
11.38
11.54
1311.55
10.92
11.17
12.31
13.3
CaO
0.1
0.2
0.05
0.06
0.17
0.74
0.54
Na 2O
0.4
0.55
2.86
1.75
0.92
1.45
1.75
0.32
0.54
0.4
Na 2O
0.3
0.2
0.3
0.45
0.59
0.97
0.75
K2O
0.82
0.97
0.44
0.94
0.34
0.81
0.33
0.68
0.78
0.37
K2O
9.58
9.89
8.84
9.68
8.65
8.52
9.19
Sum.
9897.19
98.77
98.52
97.12
97.89
97.18
97.79
97.85
97.14
Sum.
97.5
96.88
96.01
97.52
97.41
95.9
96.98
Structuralform
ulabasedon
23oxygens
Structuralform
ulabasedon
22oxygens
Si
7.04
6.7
6.47
6.48
6.55
7.78
6.41
7.28
6.38
Si
5.33
5.36
5.46
5.3
5.2
5.4
5.33
Aliv
1.3
1.62
1.44
1.48
0.22
1.43
1.59
0.96
0.72
0.59
Aliv
2.6
2.58
2.54
2.7
2.8
2.6
2.67
Alv
i0.11
0.03
00
0.22
00.39
0.33
0.63
0.28
Alv
i0
00.08
0.09
00.07
0.47
Ti
0.07
0.09
0.04
0.08
00.05
0.03
0.06
0.06
0.04
Altotal
2.6
2.58
2.62
2.79
2.8
2.67
3.13
Fe3+
1.65
1.5
11.13
01.36
1.22
0.91
00
Ti
0.32
0.28
0.29
0.33
0.29
0.29
0.15
Fe2+
00
0.72
1.1
1.09
0.61
00.55
1.21
1.25
Fe
2.5
2.58
2.39
2.55
2.48
2.35
2.23
Mn
0.05
0.06
0.04
0.04
0.06
0.05
0.05
0.05
0.05
0.06
Mn
0.01
0.02
0.02
0.03
0.03
00.07
Mg
3.16
3.5
3.22
2.7
3.47
3.02
3.35
3.1
3.02
3.32
Mg
3.09
3.06
2.99
2.8
3.25
2.95
2.73
Ca
1.53
1.62
1.76
1.81
1.99
1.8
1.65
1.69
1.88
2.06
Ca
0.02
0.03
0.01
0.01
0.03
0.12
0.09
Na
0.11
0.15
0.8
0.5
0.25
0.41
0.48
0.09
0.15
0.11
Na
0.09
0.06
0.09
0.13
0.17
0.28
0.22
K0.15
0.18
0.08
0.18
0.06
0.15
0.06
0.12
0.14
0.07
K1.82
1.9
1.68
1.85
1.65
1.63
1.73
(Ca+Na)B
1.64
1.77
22
22
1.96
1.78
22.06
Mg/Mg+Fe
0.55
0.54
0.56
0.52
0.57
0.56
0.55
Na(B)
0.11
0.15
0.24
0.19
0.01
0.2
0.31
0.09
0.12
0Fe/Fe
+Mg
0.45
0.46
0.44
0.48
0.43
0.44
0.45
(Na+K)A
0.15
0.18
0.64
0.48
0.31
0.35
0.23
0.12
0.17
0.18
223 Page 6 of 21 Arab J Geosci (2018) 11: 223
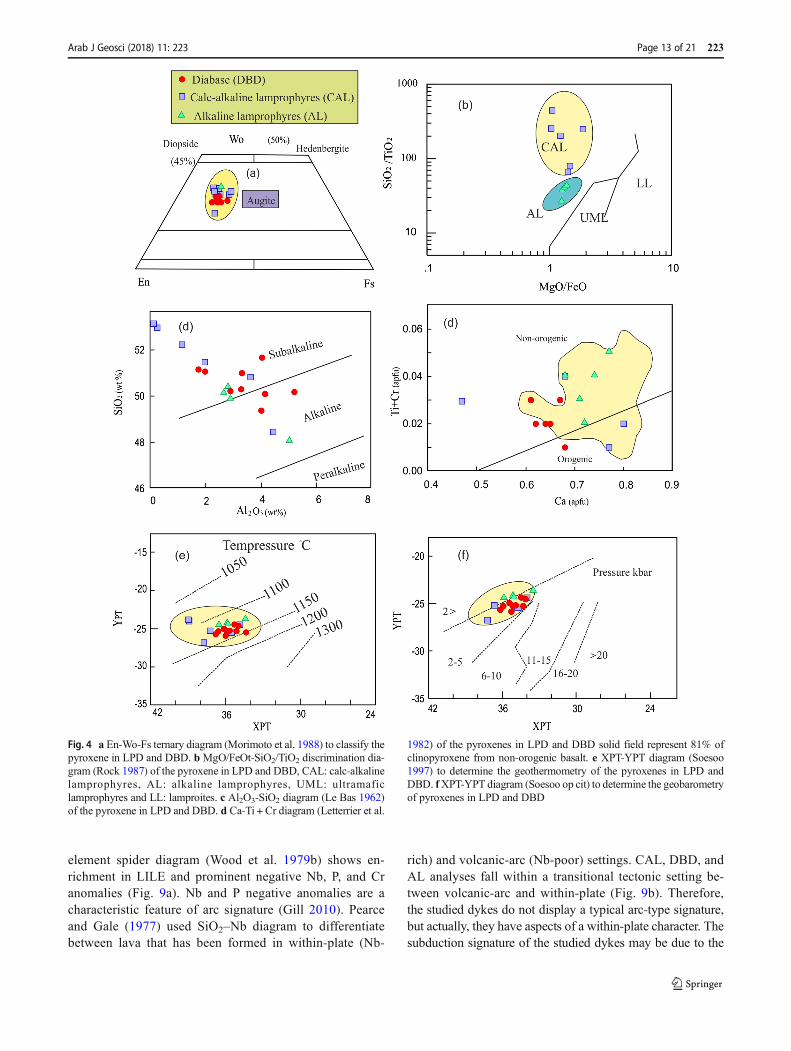
According to En-Wo-Fs ternary diagram (Morimoto et al.1988), the pyroxenes were classified as augite (Fig. 4a). OnMgO/FeOt-SiO2/TiO2 diagram (Rock 1987), the pyroxenesin LPD fall in the field of pyroxene, which characterizescalc-alkaline and alkaline lamprophyres (Fig. 4b). To de-tect the nature of magma, the pyroxene analyses plotted onAl2O3-SiO2 diagram (Le Bas 1962). The pyroxenes inCAL, DBD, and AL were crystallized from transitionalsubalkaline to alkaline magma (Fig. 4c). Ca-Ti + Cr dia-gram (Letterrier et al. 1982) indicates that the pyroxeneswere crystallized in non-orogenic tectonic environment(Fig. 4d). Soesoo (1997) calculated XPT and YPT valuesfrom pyroxene chemistry to determine the pyroxenegeothermobarometric conditions. The analyzed pyroxeneswere crystallized under temperature between 1100 and1150 °C (Fig. 4e). The pyroxenes in CAL and DBD werecrystallized under pressure 2–5 kbars, while those in ALwere crystallized under 2 kbars (Fig. 4f). Plots of pyroxenes
on 2Ti + Aliv + Cr–Alvi + Na diagram (Schweitzer et al. 1979)confirm the high oxygen fugacity (fO2) conditions underwhich pyroxenes were crystallized (Fig. 5a).
Amphiboles
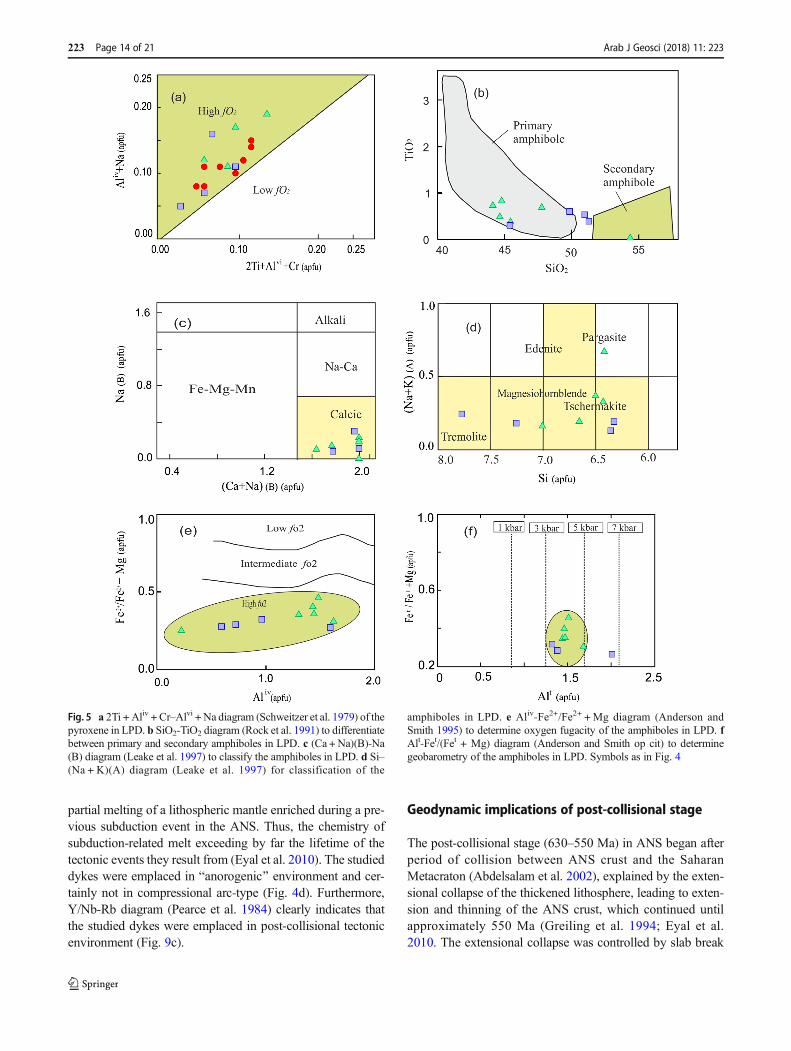
The analyzed amphiboles in LPD are Mg-rich amphibolesand contain moderate amount of Al2O3 (Table 2). Asshown in SiO2-TiO2 diagram (Rock et al. 1991), the am-phiboles are primary magmatic (Fig. 5b). Using plots ofamphiboles on (Ca + Na)B-Na(B) diagram (Leake et al.1997), classify them as calcic-amphiboles (Fig. 5c).According to Si-(Na + K)(A) diagram (Leak et al. op cit),the amphiboles were classified into manegsio-hornblendeand tschermarkite except two samples from CAL and AL,which were classified as tremolite and pargasite, respec-tively (Fig. 5d). Aliv-Fe2+/Fe2+ + Mg diagram (Andersonand Smith 1995) confirms the high fO2 conditions under
Table 3 Microprobe analyses (wt%) and structural formulae (apfu) of chlorites in lamprophyre and diabase dykes
Rock AL AL CAL CAL Diabase Diabase Diabase
Sample L1 L2 L12 L28 21D Mg6 Q13
Spots 1 2 1 2 1 2 3 1 1 2 1 1 2 3
SiO2 28.38 28.76 29.2 29.96 30.69 30.73 27.53 30.67 29.64 29.98 28.46 29.62 29.31 28.8
TiO2 0.01 0.02 0.01 0.02 0.25 0.14 0.51 0.04 0.88 0.23 0.12 0.18 0.91 0.28
Al2O3 18.81 20.1 16.75 16.5 15.13 14.25 17.18 15.46 16.78 15.46 18.24 12.96 15.1 15.7
FeO 27.63 28.65 25.15 27.28 23.57 25.32 24.49 27.16 26.84 27.63 28.73 27.97 28.13 26.24
MnO 0.03 0.02 0.03 0.04 0.02 0.02 0.01 0.03 0.04 0.02 0.37 0.19 0.19 0.17
MgO 16.33 16.65 18.85 17.64 20.49 19.44 19.45 18.45 15.88 18.14 15.52 16.38 16.64 17.89
CaO 0.02 0.02 0.02 0.1 0.02 0.12 0.33 0.02 0.28 0.04 0.12 0.19 0.13 0.12
Na2O 0 0 0 0 0.03 0.14 0 0.01 0.85 0.05 0.02 0.13 0.17 0.03
K2O 0 0.02 0 0.02 0.12 0 0 0 0.27 0.02 0 0.02 0.11 0.04
H2O 11.78 12.16 11.75 11.85 11.9 11.76 11.65 11.91 11.8 11.81 11.74 11.2 11.61 11.54
Sum. 102.99 106.4 101.76 103.41 102.22 101.92 101.15 103.75 103.25 103.4 103.32 98.84 102.3 100.8
Structural formula based on 28 oxygen
Si 5.78 5.67 5.95 6.06 6.18 6.25 5.63 6.18 5.98 6.07 5.81 6.33 6.04 5.97
Al iv 2.22 2.33 2.05 1.94 1.82 1.75 2.37 1.82 2.02 1.93 2.19 1.67 1.96 2.03
Al vi 2.29 2.35 1.98 1.99 1.78 1.68 1.8 1.85 2 1.77 2.21 1.6 1.72 1.82
Ti 0 0 0 0 0.04 0.02 0.08 0.01 0.13 0.04 0.02 0.03 0.14 0.04
Fe3+ 0.04 0.01 0 0.03 0 0 0 0.02 0 0 0.03 0 0 0
Fe2+ 4.66 4.71 4.31 4.58 3.97 4.34 4.36 4.55 4.56 4.72 4.88 5.02 4.86 4.61
Mn 0.01 0 0.01 0.01 0 0 0 0.01 0.01 0 0.06 0.03 0.03 0.03
Mg 4.95 4.9 5.73 5.32 6.15 5.9 5.93 5.54 4.77 5.48 4.73 5.22 5.11 5.53
Ca 0 0 0 0.02 0 0.03 0.07 0 0.06 0.01 0.03 0.04 0.03 0.03
Na 0 0 0 0 0.02 0.11 0 0.01 0.66 0.04 0.02 0.11 0.13 0.02
K 0 0.01 0 0.01 0.06 0 0 0 0.14 0.01 0 0.01 0.06 0.02
Fe/Fe +Mg 0.49 0.49 0.43 0.46 0.39 0.42 0.42 0.45 0.49 0.46 0.51 0.49 0.49 0.45
*T °C 405.71 454.77 390.78 523.02 431.3 491.03 514.49 405.71 448.37 429.17 484.63 373.71 435.57 450.5
*T °C: temperature chlorite formation is calculated according to Cathelineu and Nieva (1985)
Arab J Geosci (2018) 11: 223 Page 7 of 21 223
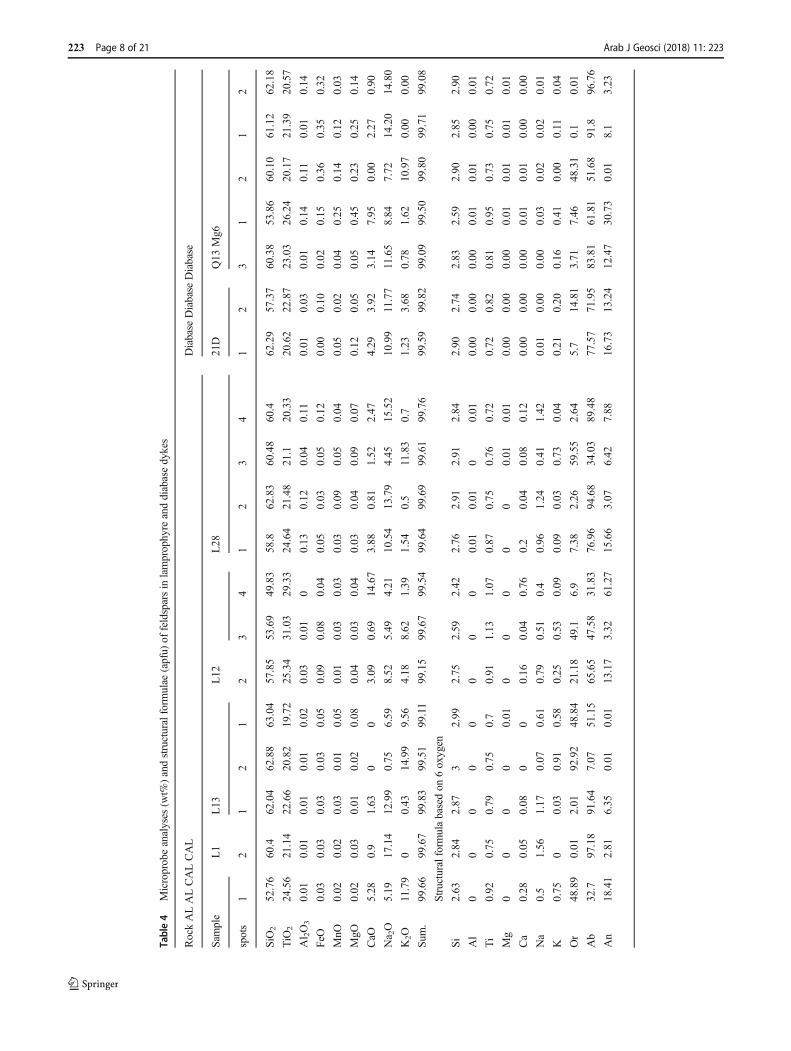
Table4
Microprobeanalyses
(wt%
)andstructuralform
ulae
(apfu)
offeldsparsin
lamprophyre
anddiabasedykes
RockALALCALCAL
Diabase
Diabase
Diabase
Sample
L1
L13
L12
L28
21D
Q13
Mg6
spots
12
12
12
34
12
34
12
31
21
2
SiO
252.76
60.4
62.04
62.88
63.04
57.85
53.69
49.83
58.8
62.83
60.48
60.4
62.29
57.37
60.38
53.86
60.10
61.12
62.18
TiO
224.56
21.14
22.66
20.82
19.72
25.34
31.03
29.33
24.64
21.48
21.1
20.33
20.62
22.87
23.03
26.24
20.17
21.39
20.57
Al 2O3
0.01
0.01
0.01
0.01
0.02
0.03
0.01
00.13
0.12
0.04
0.11
0.01
0.03
0.01
0.14
0.11
0.01
0.14
FeO
0.03
0.03
0.03
0.03
0.05
0.09
0.08
0.04
0.05
0.03
0.05
0.12
0.00
0.10
0.02
0.15
0.36
0.35
0.32
MnO
0.02
0.02
0.03
0.01
0.05
0.01
0.03
0.03
0.03
0.09
0.05
0.04
0.05
0.02
0.04
0.25
0.14
0.12
0.03
MgO
0.02
0.03
0.01
0.02
0.08
0.04
0.03
0.04
0.03
0.04
0.09
0.07
0.12
0.05
0.05
0.45
0.23
0.25
0.14
CaO
5.28
0.9
1.63
00
3.09
0.69
14.67
3.88
0.81
1.52
2.47
4.29
3.92
3.14
7.95
0.00
2.27
0.90
Na 2O
5.19
17.14
12.99
0.75
6.59
8.52
5.49
4.21
10.54
13.79
4.45
15.52
10.99
11.77
11.65
8.84
7.72
14.20
14.80
K2O
11.79
00.43
14.99
9.56
4.18
8.62
1.39
1.54
0.5
11.83
0.7
1.23
3.68
0.78
1.62
10.97
0.00
0.00
Sum.
99.66
99.67
99.83
99.51
99.11
99.15
99.67
99.54
99.64
99.69
99.61
99.76
99.59
99.82
99.09
99.50
99.80
99.71
99.08
Structuralform
ulabasedon
6oxygen
Si
2.63
2.84
2.87
32.99
2.75
2.59
2.42
2.76
2.91
2.91
2.84
2.90
2.74
2.83
2.59
2.90
2.85
2.90
Al
00
00
00
00
0.01
0.01
00.01
0.00
0.00
0.00
0.01
0.01
0.00
0.01
Ti
0.92
0.75
0.79
0.75
0.7
0.91
1.13
1.07
0.87
0.75
0.76
0.72
0.72
0.82
0.81
0.95
0.73
0.75
0.72
Mg
00
00
0.01
00
00
00.01
0.01
0.00
0.00
0.00
0.01
0.01
0.01
0.01
Ca
0.28
0.05
0.08
00
0.16
0.04
0.76
0.2
0.04
0.08
0.12
0.00
0.00
0.00
0.01
0.01
0.00
0.00
Na
0.5
1.56
1.17
0.07
0.61
0.79
0.51
0.4
0.96
1.24
0.41
1.42
0.01
0.00
0.00
0.03
0.02
0.02
0.01
K0.75
00.03
0.91
0.58
0.25
0.53
0.09
0.09
0.03
0.73
0.04
0.21
0.20
0.16
0.41
0.00
0.11
0.04
Or
48.89
0.01
2.01
92.92
48.84
21.18
49.1
6.9
7.38
2.26
59.55
2.64
5.7
14.81
3.71
7.46
48.31
0.1
0.01
Ab
32.7
97.18
91.64
7.07
51.15
65.65
47.58
31.83
76.96
94.68
34.03
89.48
77.57
71.95
83.81
61.81
51.68
91.8
96.76
An
18.41
2.81
6.35
0.01
0.01
13.17
3.32
61.27
15.66
3.07
6.42
7.88
16.73
13.24
12.47
30.73
0.01
8.1
3.23
223 Page 8 of 21 Arab J Geosci (2018) 11: 223
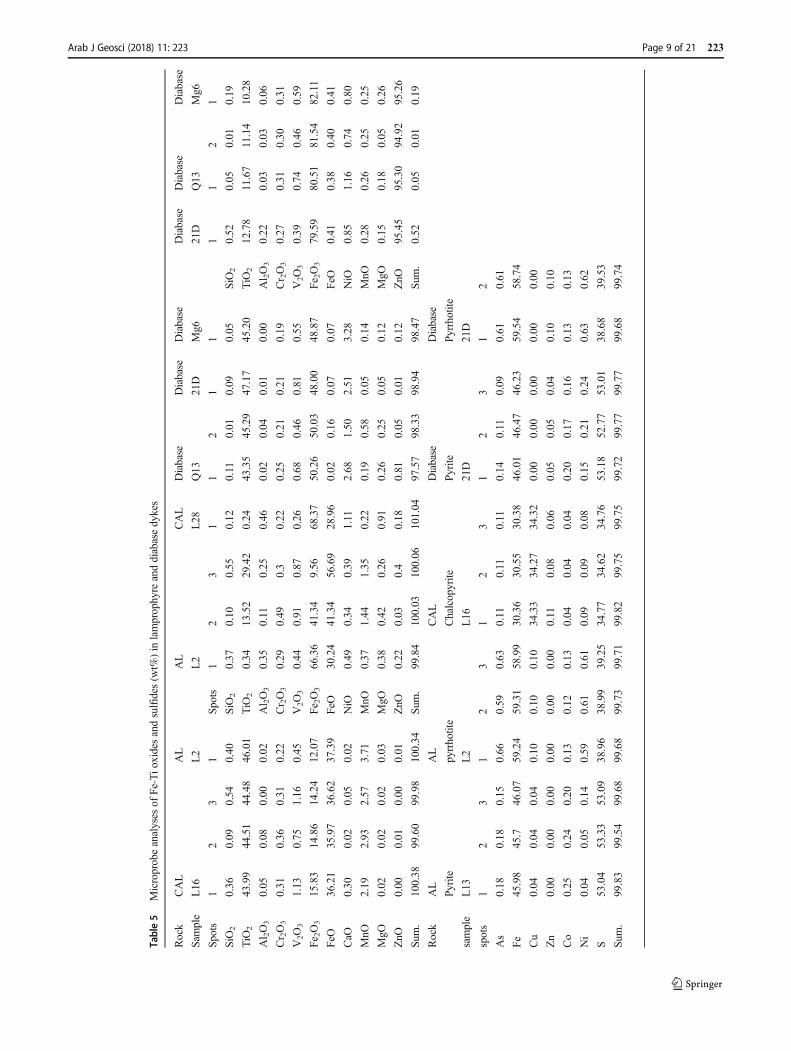
Table5
Microprobeanalyses
ofFe-Tio
xidesandsulfides
(wt%
)in
lamprophyre
anddiabasedykes
Rock
CAL
AL
AL
CAL
Diabase
Diabase
Diabase
Diabase
Diabase
Diabase
Sample
L16
L2
L2
L28
Q13
21D
Mg6
21D
Q13
Mg6
Spots
12
31
Spots
12
31
12
11
11
21
SiO
20.36
0.09
0.54
0.40
SiO2
0.37
0.10
0.55
0.12
0.11
0.01
0.09
0.05
SiO2
0.52
0.05
0.01
0.19
TiO
243.99
44.51
44.48
46.01
TiO
20.34
13.52
29.42
0.24
43.35
45.29
47.17
45.20
TiO
212.78
11.67
11.14
10.28
Al 2O3
0.05
0.08
0.00
0.02
Al 2O3
0.35
0.11
0.25
0.46
0.02
0.04
0.01
0.00
Al 2O3
0.22
0.03
0.03
0.06
Cr 2O3
0.31
0.36
0.31
0.22
Cr 2O3
0.29
0.49
0.3
0.22
0.25
0.21
0.21
0.19
Cr 2O3
0.27
0.31
0.30
0.31
V2O3
1.13
0.75
1.16
0.45
V2O3
0.44
0.91
0.87
0.26
0.68
0.46
0.81
0.55
V2O3
0.39
0.74
0.46
0.59
Fe 2O3
15.83
14.86
14.24
12.07
Fe2O3
66.36
41.34
9.56
68.37
50.26
50.03
48.00
48.87
Fe2O3
79.59
80.51
81.54
82.11
FeO
36.21
35.97
36.62
37.39
FeO
30.24
41.34
56.69
28.96
0.02
0.16
0.07
0.07
FeO
0.41
0.38
0.40
0.41
CaO
0.30
0.02
0.05
0.02
NiO
0.49
0.34
0.39
1.11
2.68
1.50
2.51
3.28
NiO
0.85
1.16
0.74
0.80
MnO
2.19
2.93
2.57
3.71
MnO
0.37
1.44
1.35
0.22
0.19
0.58
0.05
0.14
MnO
0.28
0.26
0.25
0.25
MgO
0.02
0.02
0.02
0.03
MgO
0.38
0.42
0.26
0.91
0.26
0.25
0.05
0.12
MgO
0.15
0.18
0.05
0.26
ZnO
0.00
0.01
0.00
0.01
ZnO
0.22
0.03
0.4
0.18
0.81
0.05
0.01
0.12
ZnO
95.45
95.30
94.92
95.26
Sum.
100.38
99.60
99.98
100.34
Sum.
99.84
100.03
100.06
101.04
97.57
98.33
98.94
98.47
Sum.
0.52
0.05
0.01
0.19
Rock
AL
AL
CAL
Diabase
Diabase
Pyrite
pyrrhotite
Chalcopyrite
Pyrite
Pyrrhotite
sample
L13
L2
L16
21D
21D
spots
12
31
23
12
31
23
12
As
0.18
0.18
0.15
0.66
0.59
0.63
0.11
0.11
0.11
0.14
0.11
0.09
0.61
0.61
Fe45.98
45.7
46.07
59.24
59.31
58.99
30.36
30.55
30.38
46.01
46.47
46.23
59.54
58.74
Cu
0.04
0.04
0.04
0.10
0.10
0.10
34.33
34.27
34.32
0.00
0.00
0.00
0.00
0.00
Zn
0.00
0.00
0.00
0.00
0.00
0.00
0.11
0.08
0.06
0.05
0.05
0.04
0.10
0.10
Co
0.25
0.24
0.20
0.13
0.12
0.13
0.04
0.04
0.04
0.20
0.17
0.16
0.13
0.13
Ni
0.04
0.05
0.14
0.59
0.61
0.61
0.09
0.09
0.08
0.15
0.21
0.24
0.63
0.62
S53.04
53.33
53.09
38.96
38.99
39.25
34.77
34.62
34.76
53.18
52.77
53.01
38.68
39.53
Sum.
99.83
99.54
99.68
99.68
99.73
99.71
99.82
99.75
99.75
99.72
99.77
99.77
99.68
99.74
Arab J Geosci (2018) 11: 223 Page 9 of 21 223
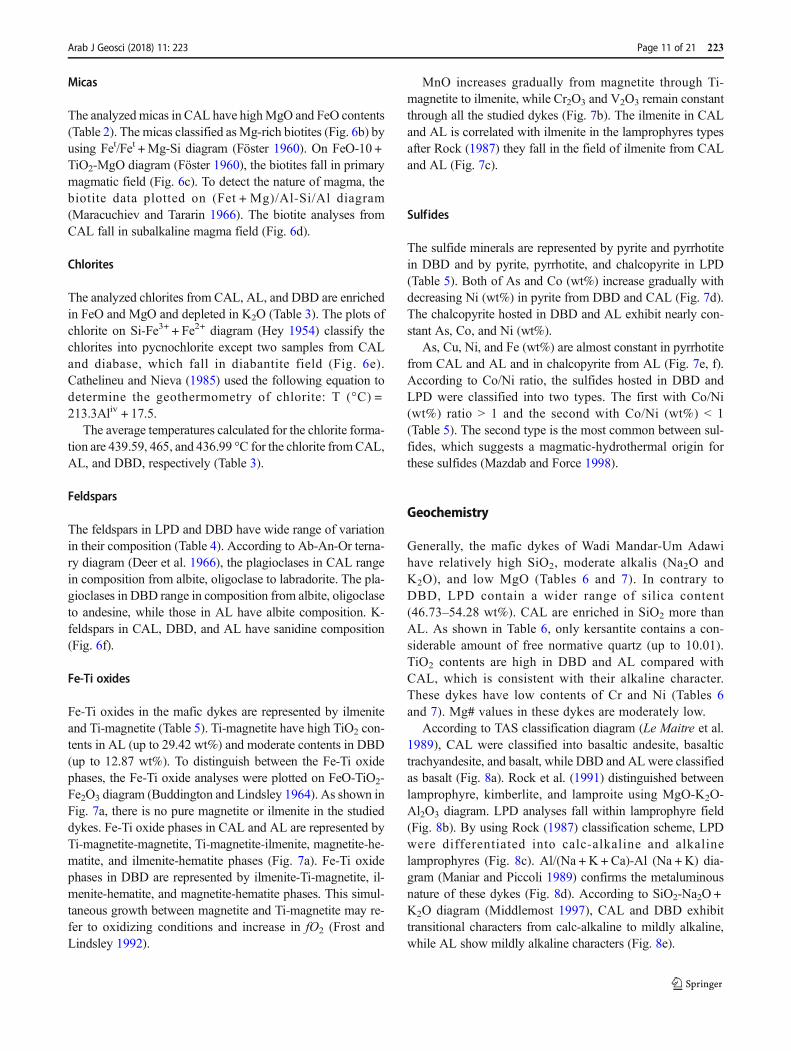
which amphiboles were crystallized (Fig. 5e). To determinethe geobarometry of amphiboles, the data were plotted on Alt-Fet/(Fet +Mg) diagram, which prove that the amphiboles were
crystallized under pressure 3–5 kbars (Fig. 5f). According toAl2O3-TiO2 diagram (Jiang and An 1984), the amphiboleswere crystallized from mixed crustal-mantle source (Fig. 6a).
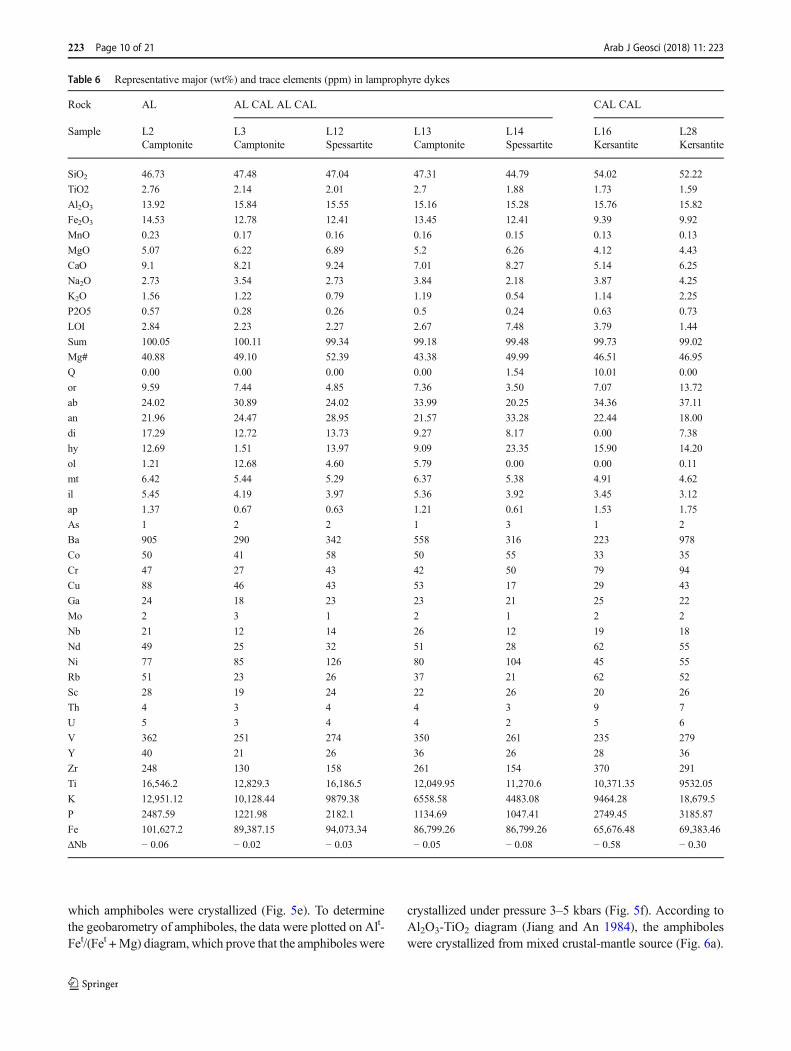
Table 6 Representative major (wt%) and trace elements (ppm) in lamprophyre dykes
Rock AL AL CAL AL CAL CAL CAL
Sample L2Camptonite
L3Camptonite
L12Spessartite
L13Camptonite
L14Spessartite
L16Kersantite
L28Kersantite
SiO2 46.73 47.48 47.04 47.31 44.79 54.02 52.22
TiO2 2.76 2.14 2.01 2.7 1.88 1.73 1.59
Al2O3 13.92 15.84 15.55 15.16 15.28 15.76 15.82
Fe2O3 14.53 12.78 12.41 13.45 12.41 9.39 9.92
MnO 0.23 0.17 0.16 0.16 0.15 0.13 0.13
MgO 5.07 6.22 6.89 5.2 6.26 4.12 4.43
CaO 9.1 8.21 9.24 7.01 8.27 5.14 6.25
Na2O 2.73 3.54 2.73 3.84 2.18 3.87 4.25
K2O 1.56 1.22 0.79 1.19 0.54 1.14 2.25
P2O5 0.57 0.28 0.26 0.5 0.24 0.63 0.73
LOI 2.84 2.23 2.27 2.67 7.48 3.79 1.44
Sum 100.05 100.11 99.34 99.18 99.48 99.73 99.02
Mg# 40.88 49.10 52.39 43.38 49.99 46.51 46.95
Q 0.00 0.00 0.00 0.00 1.54 10.01 0.00
or 9.59 7.44 4.85 7.36 3.50 7.07 13.72
ab 24.02 30.89 24.02 33.99 20.25 34.36 37.11
an 21.96 24.47 28.95 21.57 33.28 22.44 18.00
di 17.29 12.72 13.73 9.27 8.17 0.00 7.38
hy 12.69 1.51 13.97 9.09 23.35 15.90 14.20
ol 1.21 12.68 4.60 5.79 0.00 0.00 0.11
mt 6.42 5.44 5.29 6.37 5.38 4.91 4.62
il 5.45 4.19 3.97 5.36 3.92 3.45 3.12
ap 1.37 0.67 0.63 1.21 0.61 1.53 1.75
As 1 2 2 1 3 1 2
Ba 905 290 342 558 316 223 978
Co 50 41 58 50 55 33 35
Cr 47 27 43 42 50 79 94
Cu 88 46 43 53 17 29 43
Ga 24 18 23 23 21 25 22
Mo 2 3 1 2 1 2 2
Nb 21 12 14 26 12 19 18
Nd 49 25 32 51 28 62 55
Ni 77 85 126 80 104 45 55
Rb 51 23 26 37 21 62 52
Sc 28 19 24 22 26 20 26
Th 4 3 4 4 3 9 7
U 5 3 4 4 2 5 6
V 362 251 274 350 261 235 279
Y 40 21 26 36 26 28 36
Zr 248 130 158 261 154 370 291
Ti 16,546.2 12,829.3 16,186.5 12,049.95 11,270.6 10,371.35 9532.05
K 12,951.12 10,128.44 9879.38 6558.58 4483.08 9464.28 18,679.5
P 2487.59 1221.98 2182.1 1134.69 1047.41 2749.45 3185.87
Fe 101,627.2 89,387.15 94,073.34 86,799.26 86,799.26 65,676.48 69,383.46
ΔNb − 0.06 − 0.02 − 0.03 − 0.05 − 0.08 − 0.58 − 0.30
223 Page 10 of 21 Arab J Geosci (2018) 11: 223
Micas
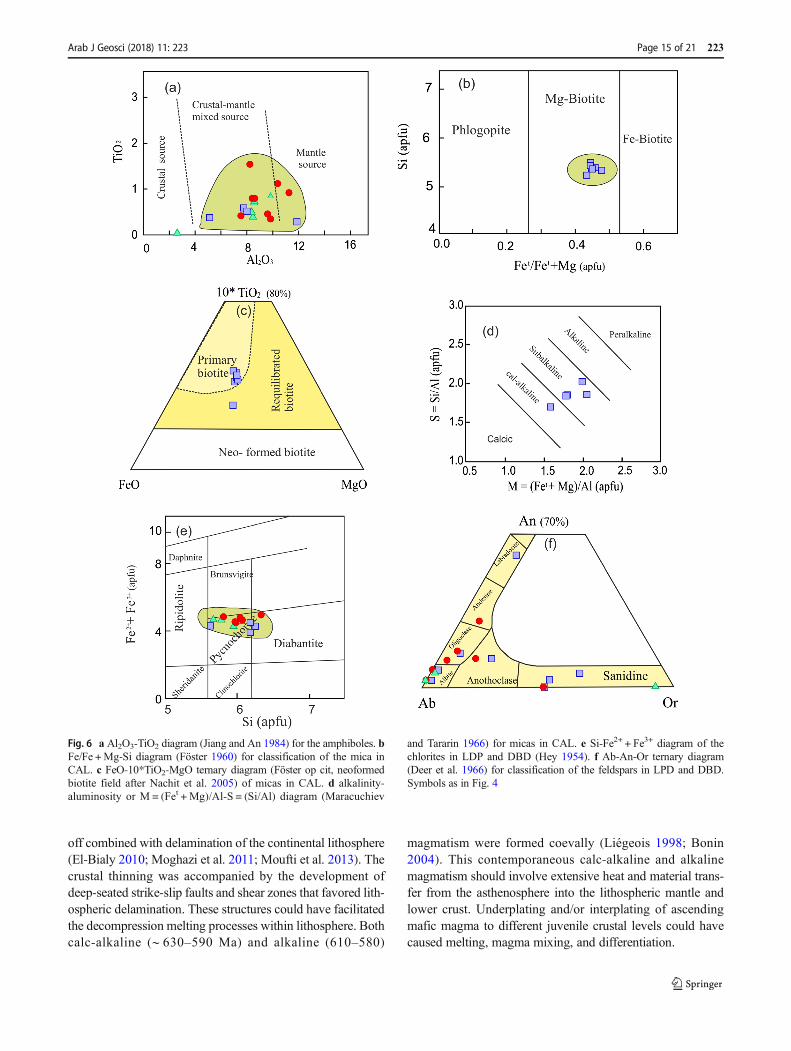
The analyzedmicas in CAL have highMgO and FeO contents(Table 2). The micas classified asMg-rich biotites (Fig. 6b) byusing Fet/Fet +Mg-Si diagram (Föster 1960). On FeO-10 +TiO2-MgO diagram (Föster 1960), the biotites fall in primarymagmatic field (Fig. 6c). To detect the nature of magma, thebiotite data plotted on (Fet + Mg)/Al-Si/Al diagram(Maracuchiev and Tararin 1966). The biotite analyses fromCAL fall in subalkaline magma field (Fig. 6d).
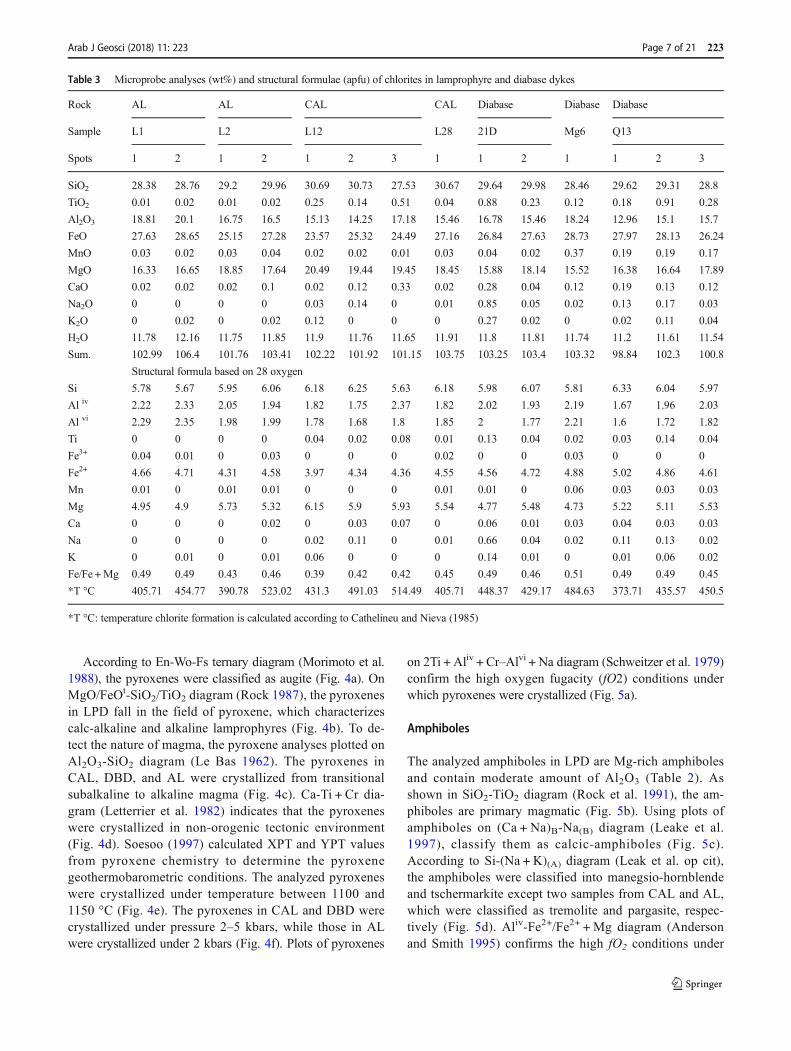
Chlorites
The analyzed chlorites from CAL, AL, and DBD are enrichedin FeO and MgO and depleted in K2O (Table 3). The plots ofchlorite on Si-Fe3+ + Fe2+ diagram (Hey 1954) classify thechlorites into pycnochlorite except two samples from CALand diabase, which fall in diabantite field (Fig. 6e).Cathelineu and Nieva (1985) used the following equation todetermine the geothermometry of chlorite: T (°C) =213.3Aliv + 17.5.
The average temperatures calculated for the chlorite forma-tion are 439.59, 465, and 436.99 °C for the chlorite fromCAL,AL, and DBD, respectively (Table 3).
Feldspars
The feldspars in LPD and DBD have wide range of variationin their composition (Table 4). According to Ab-An-Or terna-ry diagram (Deer et al. 1966), the plagioclases in CAL rangein composition from albite, oligoclase to labradorite. The pla-gioclases in DBD range in composition from albite, oligoclaseto andesine, while those in AL have albite composition. K-feldspars in CAL, DBD, and AL have sanidine composition(Fig. 6f).
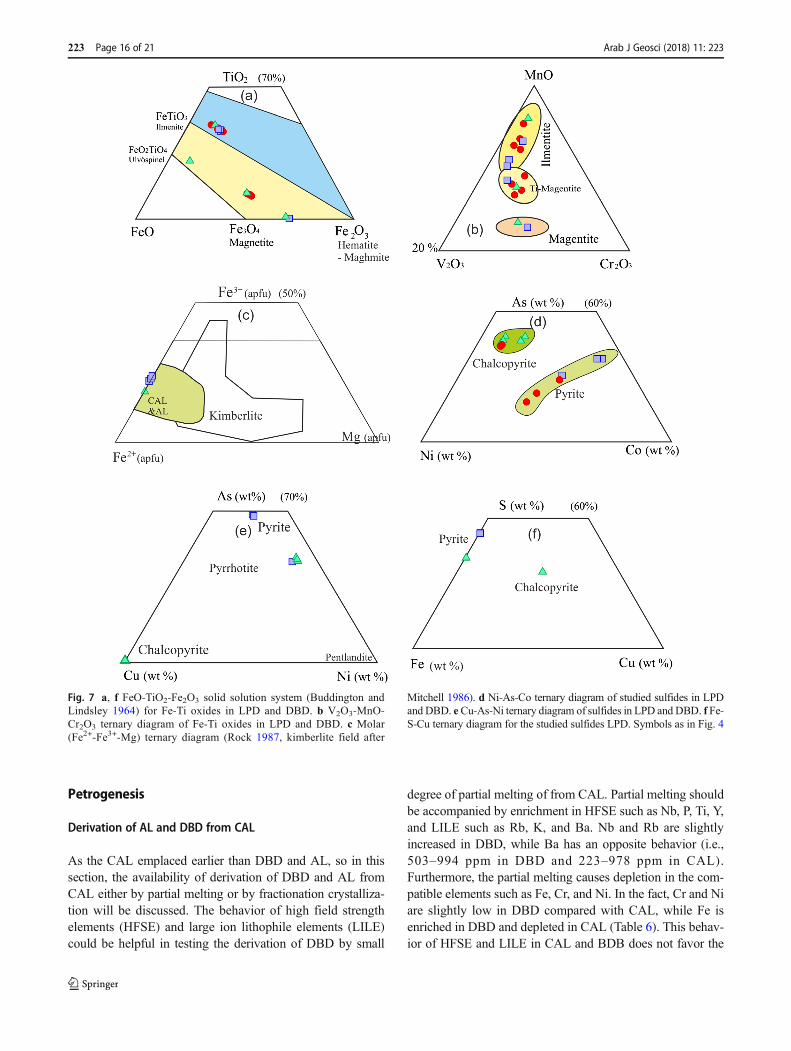
Fe-Ti oxides
Fe-Ti oxides in the mafic dykes are represented by ilmeniteand Ti-magnetite (Table 5). Ti-magnetite have high TiO2 con-tents in AL (up to 29.42 wt%) and moderate contents in DBD(up to 12.87 wt%). To distinguish between the Fe-Ti oxidephases, the Fe-Ti oxide analyses were plotted on FeO-TiO2-Fe2O3 diagram (Buddington and Lindsley 1964). As shown inFig. 7a, there is no pure magnetite or ilmenite in the studieddykes. Fe-Ti oxide phases in CAL and AL are represented byTi-magnetite-magnetite, Ti-magnetite-ilmenite, magnetite-he-matite, and ilmenite-hematite phases (Fig. 7a). Fe-Ti oxidephases in DBD are represented by ilmenite-Ti-magnetite, il-menite-hematite, and magnetite-hematite phases. This simul-taneous growth between magnetite and Ti-magnetite may re-fer to oxidizing conditions and increase in fO2 (Frost andLindsley 1992).
MnO increases gradually from magnetite through Ti-magnetite to ilmenite, while Cr2O3 and V2O3 remain constantthrough all the studied dykes (Fig. 7b). The ilmenite in CALand AL is correlated with ilmenite in the lamprophyres typesafter Rock (1987) they fall in the field of ilmenite from CALand AL (Fig. 7c).
Sulfides
The sulfide minerals are represented by pyrite and pyrrhotitein DBD and by pyrite, pyrrhotite, and chalcopyrite in LPD(Table 5). Both of As and Co (wt%) increase gradually withdecreasing Ni (wt%) in pyrite from DBD and CAL (Fig. 7d).The chalcopyrite hosted in DBD and AL exhibit nearly con-stant As, Co, and Ni (wt%).
As, Cu, Ni, and Fe (wt%) are almost constant in pyrrhotitefrom CAL and AL and in chalcopyrite from AL (Fig. 7e, f).According to Co/Ni ratio, the sulfides hosted in DBD andLPD were classified into two types. The first with Co/Ni(wt%) ratio ˃ 1 and the second with Co/Ni (wt%) ˂ 1(Table 5). The second type is the most common between sul-fides, which suggests a magmatic-hydrothermal origin forthese sulfides (Mazdab and Force 1998).
Geochemistry
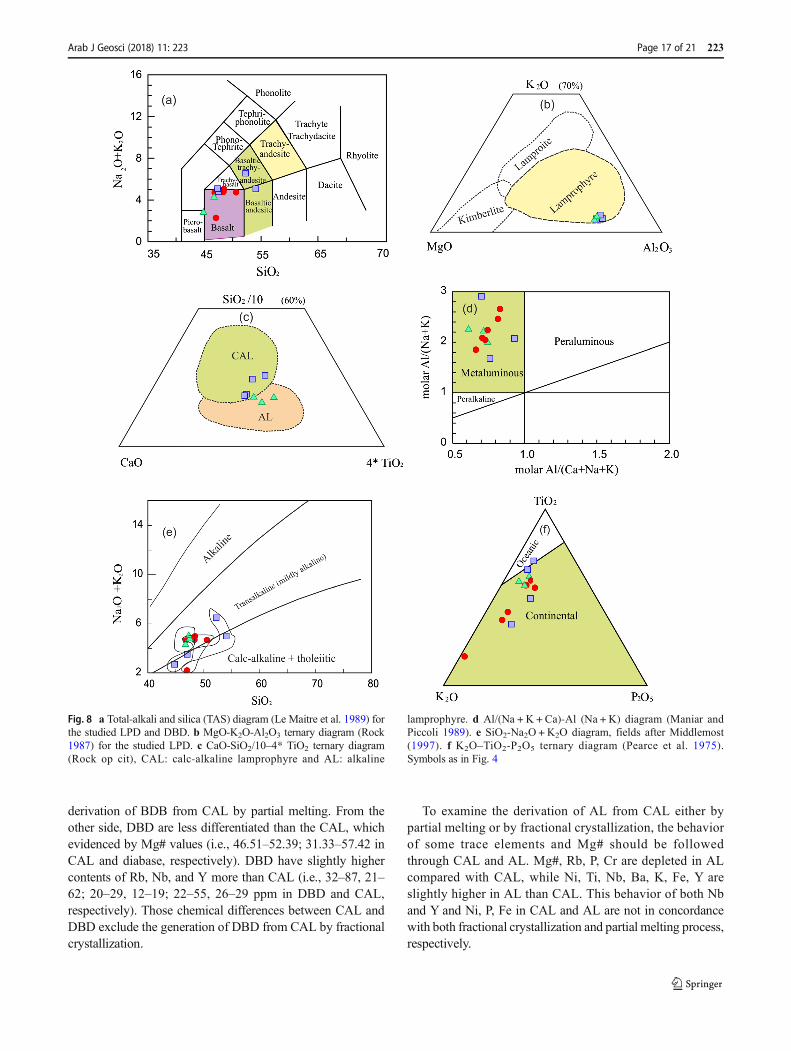
Generally, the mafic dykes of Wadi Mandar-Um Adawihave relatively high SiO2, moderate alkalis (Na2O andK2O), and low MgO (Tables 6 and 7). In contrary toDBD, LPD contain a wider range of silica content(46.73–54.28 wt%). CAL are enriched in SiO2 more thanAL. As shown in Table 6, only kersantite contains a con-siderable amount of free normative quartz (up to 10.01).TiO2 contents are high in DBD and AL compared withCAL, which is consistent with their alkaline character.These dykes have low contents of Cr and Ni (Tables 6and 7). Mg# values in these dykes are moderately low.
According to TAS classification diagram (Le Maitre et al.1989), CAL were classified into basaltic andesite, basaltictrachyandesite, and basalt, while DBD and AL were classifiedas basalt (Fig. 8a). Rock et al. (1991) distinguished betweenlamprophyre, kimberlite, and lamproite using MgO-K2O-Al2O3 diagram. LPD analyses fall within lamprophyre field(Fig. 8b). By using Rock (1987) classification scheme, LPDwere differentiated into calc-alkaline and alkalinelamprophyres (Fig. 8c). Al/(Na + K + Ca)-Al (Na + K) dia-gram (Maniar and Piccoli 1989) confirms the metaluminousnature of these dykes (Fig. 8d). According to SiO2-Na2O +K2O diagram (Middlemost 1997), CAL and DBD exhibittransitional characters from calc-alkaline to mildly alkaline,while AL show mildly alkaline characters (Fig. 8e).
Arab J Geosci (2018) 11: 223 Page 11 of 21 223
Discussion
The mafic dykes in Wadi Mandar-Wadi Um Adawi area arerepresented CAL, DBD, and AL (Fig. 4b, Fig. 8c). CAL rangein composition from basaltic andesite, basaltic trachyandesiteto basalt, while DBD and AL are basaltic in composition (Fig.8a). The mafic dykes have metaluminous nature. CAL andDBD show transitional characters from calc-alkaline to alka-line, while AL exhibit alkaline character (Fig. 4d, Fig. 8d, e).
These dykes were crystallized under temperature between1100 and 1150 °C and under pressure from 2 to 5 kbars inhigh oxygen fugacity conditions (Fig. 4e, f, Fig. 5a, e, f).
K2O-TiO2-P2O5 ternary diagram (Pearce et al. 1975)shows that the investigated dykes were emplaced in acontinental rather than in oceanic setting (Fig. 8f). Thesimilarity of both shapes and slopes of the trace elementspider patterns of the studied dykes is a common featurein many dyke swarms in Sinai (Eyal et al. 2010). Trace
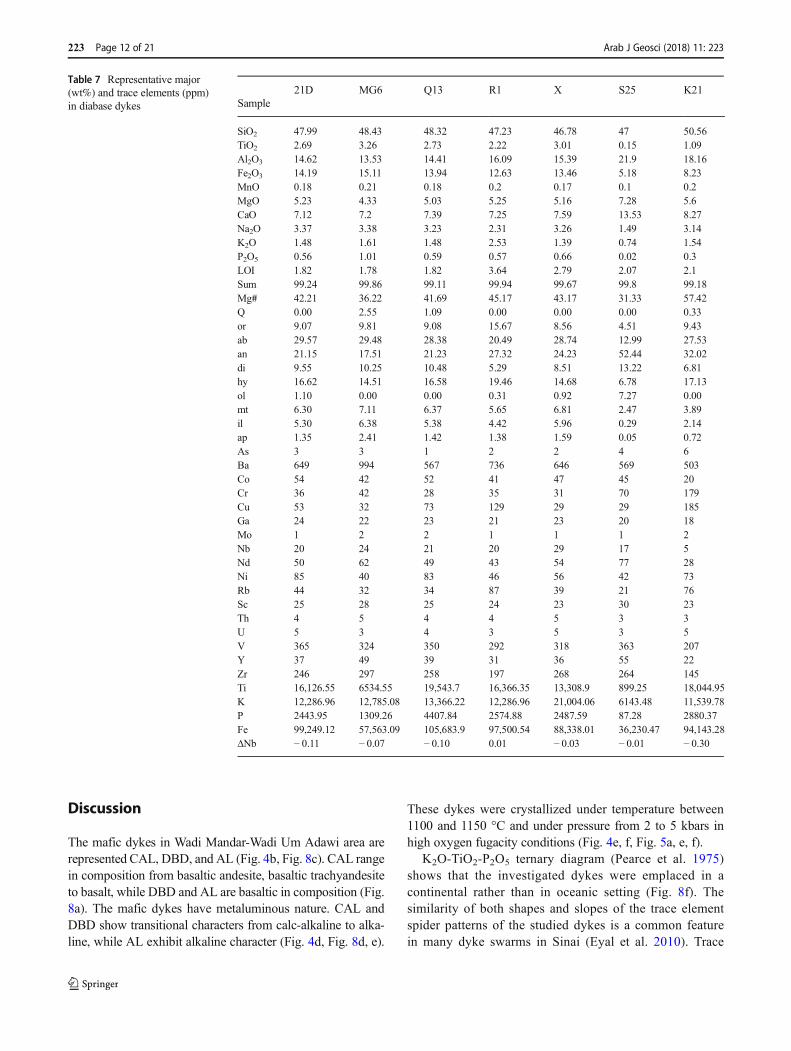
Table 7 Representative major(wt%) and trace elements (ppm)in diabase dykes Sample
21D MG6 Q13 R1 X S25 K21
SiO2 47.99 48.43 48.32 47.23 46.78 47 50.56TiO2 2.69 3.26 2.73 2.22 3.01 0.15 1.09Al2O3 14.62 13.53 14.41 16.09 15.39 21.9 18.16Fe2O3 14.19 15.11 13.94 12.63 13.46 5.18 8.23MnO 0.18 0.21 0.18 0.2 0.17 0.1 0.2MgO 5.23 4.33 5.03 5.25 5.16 7.28 5.6CaO 7.12 7.2 7.39 7.25 7.59 13.53 8.27Na2O 3.37 3.38 3.23 2.31 3.26 1.49 3.14K2O 1.48 1.61 1.48 2.53 1.39 0.74 1.54P2O5 0.56 1.01 0.59 0.57 0.66 0.02 0.3LOI 1.82 1.78 1.82 3.64 2.79 2.07 2.1Sum 99.24 99.86 99.11 99.94 99.67 99.8 99.18Mg# 42.21 36.22 41.69 45.17 43.17 31.33 57.42Q 0.00 2.55 1.09 0.00 0.00 0.00 0.33or 9.07 9.81 9.08 15.67 8.56 4.51 9.43ab 29.57 29.48 28.38 20.49 28.74 12.99 27.53an 21.15 17.51 21.23 27.32 24.23 52.44 32.02di 9.55 10.25 10.48 5.29 8.51 13.22 6.81hy 16.62 14.51 16.58 19.46 14.68 6.78 17.13ol 1.10 0.00 0.00 0.31 0.92 7.27 0.00mt 6.30 7.11 6.37 5.65 6.81 2.47 3.89il 5.30 6.38 5.38 4.42 5.96 0.29 2.14ap 1.35 2.41 1.42 1.38 1.59 0.05 0.72As 3 3 1 2 2 4 6Ba 649 994 567 736 646 569 503Co 54 42 52 41 47 45 20Cr 36 42 28 35 31 70 179Cu 53 32 73 129 29 29 185Ga 24 22 23 21 23 20 18Mo 1 2 2 1 1 1 2Nb 20 24 21 20 29 17 5Nd 50 62 49 43 54 77 28Ni 85 40 83 46 56 42 73Rb 44 32 34 87 39 21 76Sc 25 28 25 24 23 30 23Th 4 5 4 4 5 3 3U 5 3 4 3 5 3 5V 365 324 350 292 318 363 207Y 37 49 39 31 36 55 22Zr 246 297 258 197 268 264 145Ti 16,126.55 6534.55 19,543.7 16,366.35 13,308.9 899.25 18,044.95K 12,286.96 12,785.08 13,366.22 12,286.96 21,004.06 6143.48 11,539.78P 2443.95 1309.26 4407.84 2574.88 2487.59 87.28 2880.37Fe 99,249.12 57,563.09 105,683.9 97,500.54 88,338.01 36,230.47 94,143.28ΔNb − 0.11 − 0.07 − 0.10 0.01 − 0.03 − 0.01 − 0.30
223 Page 12 of 21 Arab J Geosci (2018) 11: 223
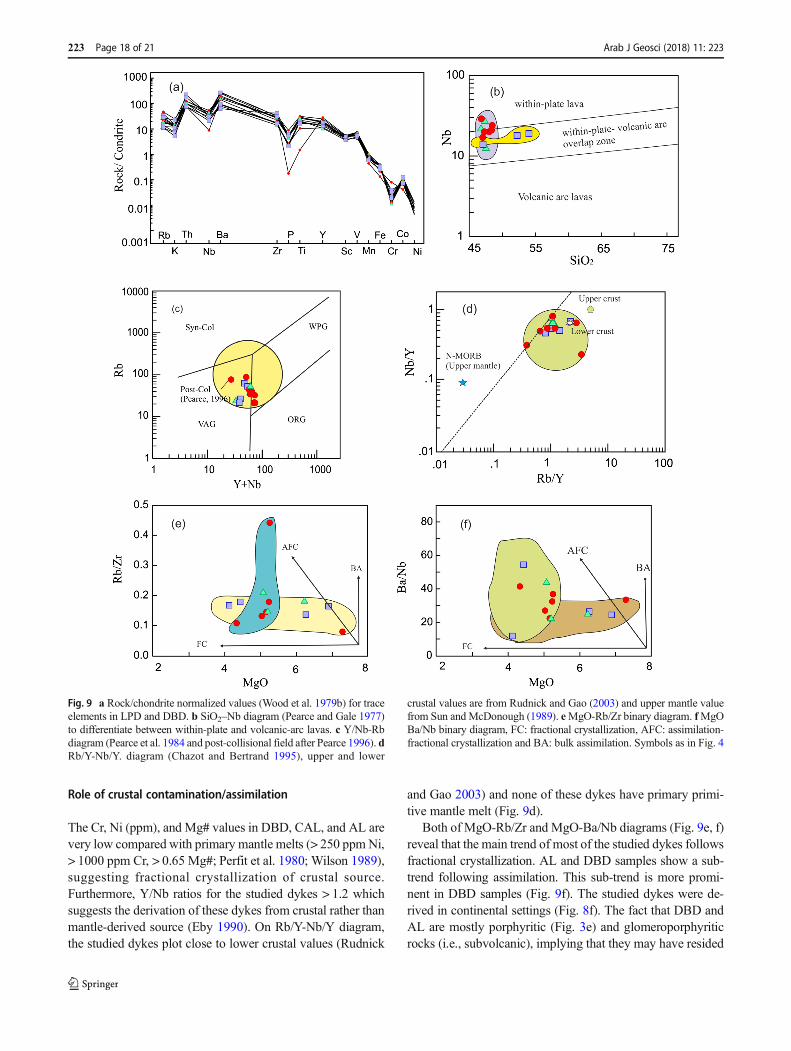
element spider diagram (Wood et al. 1979b) shows en-richment in LILE and prominent negative Nb, P, and Cranomalies (Fig. 9a). Nb and P negative anomalies are acharacteristic feature of arc signature (Gill 2010). Pearceand Gale (1977) used SiO2–Nb diagram to differentiatebetween lava that has been formed in within-plate (Nb-
rich) and volcanic-arc (Nb-poor) settings. CAL, DBD, andAL analyses fall within a transitional tectonic setting be-tween volcanic-arc and within-plate (Fig. 9b). Therefore,the studied dykes do not display a typical arc-type signature,but actually, they have aspects of a within-plate character. Thesubduction signature of the studied dykes may be due to the
Fig. 4 a En-Wo-Fs ternary diagram (Morimoto et al. 1988) to classify thepyroxene in LPD and DBD. bMgO/FeOt-SiO2/TiO2 discrimination dia-gram (Rock 1987) of the pyroxene in LPD and DBD, CAL: calc-alkalinelamprophyres, AL: alkaline lamprophyres, UML: ultramaficlamprophyres and LL: lamproites. c Al2O3-SiO2 diagram (Le Bas 1962)of the pyroxene in LPD and DBD. d Ca-Ti + Cr diagram (Letterrier et al.
1982) of the pyroxenes in LPD and DBD solid field represent 81% ofclinopyroxene from non-orogenic basalt. e XPT-YPT diagram (Soesoo1997) to determine the geothermometry of the pyroxenes in LPD andDBD. fXPT-YPT diagram (Soesoo op cit) to determine the geobarometryof pyroxenes in LPD and DBD
Arab J Geosci (2018) 11: 223 Page 13 of 21 223
partial melting of a lithospheric mantle enriched during a pre-vious subduction event in the ANS. Thus, the chemistry ofsubduction-related melt exceeding by far the lifetime of thetectonic events they result from (Eyal et al. 2010). The studieddykes were emplaced in Banorogenic^ environment and cer-tainly not in compressional arc-type (Fig. 4d). Furthermore,Y/Nb-Rb diagram (Pearce et al. 1984) clearly indicates thatthe studied dykes were emplaced in post-collisional tectonicenvironment (Fig. 9c).
Geodynamic implications of post-collisional stage
The post-collisional stage (630–550 Ma) in ANS began afterperiod of collision between ANS crust and the SaharanMetacraton (Abdelsalam et al. 2002), explained by the exten-sional collapse of the thickened lithosphere, leading to exten-sion and thinning of the ANS crust, which continued untilapproximately 550 Ma (Greiling et al. 1994; Eyal et al.2010. The extensional collapse was controlled by slab break
Fig. 5 a 2Ti + Aliv + Cr–Alvi + Na diagram (Schweitzer et al. 1979) of thepyroxene in LPD. b SiO2-TiO2 diagram (Rock et al. 1991) to differentiatebetween primary and secondary amphiboles in LPD. c (Ca + Na)(B)-Na(B) diagram (Leake et al. 1997) to classify the amphiboles in LPD. d Si–(Na + K)(A) diagram (Leake et al. 1997) for classification of the
amphiboles in LPD. e Aliv-Fe2+/Fe2+ + Mg diagram (Anderson andSmith 1995) to determine oxygen fugacity of the amphiboles in LPD. fAlt-Fet/(Fet + Mg) diagram (Anderson and Smith op cit) to determinegeobarometry of the amphiboles in LPD. Symbols as in Fig. 4
223 Page 14 of 21 Arab J Geosci (2018) 11: 223
off combined with delamination of the continental lithosphere(El-Bialy 2010; Moghazi et al. 2011; Moufti et al. 2013). Thecrustal thinning was accompanied by the development ofdeep-seated strike-slip faults and shear zones that favored lith-ospheric delamination. These structures could have facilitatedthe decompression melting processes within lithosphere. Bothcalc-alkaline (∼ 630–590 Ma) and alkaline (610–580)
magmatism were formed coevally (Liégeois 1998; Bonin2004). This contemporaneous calc-alkaline and alkalinemagmatism should involve extensive heat and material trans-fer from the asthenosphere into the lithospheric mantle andlower crust. Underplating and/or interplating of ascendingmafic magma to different juvenile crustal levels could havecaused melting, magma mixing, and differentiation.
Fig. 6 a Al2O3-TiO2 diagram (Jiang and An 1984) for the amphiboles. bFe/Fe +Mg-Si diagram (Föster 1960) for classification of the mica inCAL. c FeO-10*TiO2-MgO ternary diagram (Föster op cit, neoformedbiotite field after Nachit et al. 2005) of micas in CAL. d alkalinity-aluminosity or M = (Fet + Mg)/Al-S = (Si/Al) diagram (Maracuchiev
and Tararin 1966) for micas in CAL. e Si-Fe2+ + Fe3+ diagram of thechlorites in LDP and DBD (Hey 1954). f Ab-An-Or ternary diagram(Deer et al. 1966) for classification of the feldspars in LPD and DBD.Symbols as in Fig. 4
Arab J Geosci (2018) 11: 223 Page 15 of 21 223
Petrogenesis
Derivation of AL and DBD from CAL
As the CAL emplaced earlier than DBD and AL, so in thissection, the availability of derivation of DBD and AL fromCAL either by partial melting or by fractionation crystalliza-tion will be discussed. The behavior of high field strengthelements (HFSE) and large ion lithophile elements (LILE)could be helpful in testing the derivation of DBD by small
degree of partial melting of from CAL. Partial melting shouldbe accompanied by enrichment in HFSE such as Nb, P, Ti, Y,and LILE such as Rb, K, and Ba. Nb and Rb are slightlyincreased in DBD, while Ba has an opposite behavior (i.e.,503–994 ppm in DBD and 223–978 ppm in CAL).Furthermore, the partial melting causes depletion in the com-patible elements such as Fe, Cr, and Ni. In the fact, Cr and Niare slightly low in DBD compared with CAL, while Fe isenriched in DBD and depleted in CAL (Table 6). This behav-ior of HFSE and LILE in CAL and BDB does not favor the
Fig. 7 a, f FeO-TiO2-Fe2O3 solid solution system (Buddington andLindsley 1964) for Fe-Ti oxides in LPD and DBD. b V2O3-MnO-Cr2O3 ternary diagram of Fe-Ti oxides in LPD and DBD. c Molar(Fe2+-Fe3+-Mg) ternary diagram (Rock 1987, kimberlite field after
Mitchell 1986). d Ni-As-Co ternary diagram of studied sulfides in LPDand DBD. eCu-As-Ni ternary diagram of sulfides in LPD and DBD. f Fe-S-Cu ternary diagram for the studied sulfides LPD. Symbols as in Fig. 4
223 Page 16 of 21 Arab J Geosci (2018) 11: 223
derivation of BDB from CAL by partial melting. From theother side, DBD are less differentiated than the CAL, whichevidenced by Mg# values (i.e., 46.51–52.39; 31.33–57.42 inCAL and diabase, respectively). DBD have slightly highercontents of Rb, Nb, and Y more than CAL (i.e., 32–87, 21–62; 20–29, 12–19; 22–55, 26–29 ppm in DBD and CAL,respectively). Those chemical differences between CAL andDBD exclude the generation of DBD from CAL by fractionalcrystallization.
To examine the derivation of AL from CAL either bypartial melting or by fractional crystallization, the behaviorof some trace elements and Mg# should be followedthrough CAL and AL. Mg#, Rb, P, Cr are depleted in ALcompared with CAL, while Ni, Ti, Nb, Ba, K, Fe, Y areslightly higher in AL than CAL. This behavior of both Nband Y and Ni, P, Fe in CAL and AL are not in concordancewith both fractional crystallization and partial melting process,respectively.
Fig. 8 a Total-alkali and silica (TAS) diagram (Le Maitre et al. 1989) forthe studied LPD and DBD. b MgO-K2O-Al2O3 ternary diagram (Rock1987) for the studied LPD. c CaO-SiO2/10–4* TiO2 ternary diagram(Rock op cit), CAL: calc-alkaline lamprophyre and AL: alkaline
lamprophyre. d Al/(Na + K + Ca)-Al (Na + K) diagram (Maniar andPiccoli 1989). e SiO2-Na2O + K2O diagram, fields after Middlemost(1997). f K2O–TiO2-P2O5 ternary diagram (Pearce et al. 1975).Symbols as in Fig. 4
Arab J Geosci (2018) 11: 223 Page 17 of 21 223
Role of crustal contamination/assimilation
The Cr, Ni (ppm), and Mg# values in DBD, CAL, and AL arevery low compared with primary mantle melts (> 250 ppmNi,> 1000 ppm Cr, > 0.65 Mg#; Perfit et al. 1980; Wilson 1989),suggesting fractional crystallization of crustal source.Furthermore, Y/Nb ratios for the studied dykes > 1.2 whichsuggests the derivation of these dykes from crustal rather thanmantle-derived source (Eby 1990). On Rb/Y-Nb/Y diagram,the studied dykes plot close to lower crustal values (Rudnick
and Gao 2003) and none of these dykes have primary primi-tive mantle melt (Fig. 9d).
Both of MgO-Rb/Zr and MgO-Ba/Nb diagrams (Fig. 9e, f)reveal that the main trend of most of the studied dykes followsfractional crystallization. AL and DBD samples show a sub-trend following assimilation. This sub-trend is more promi-nent in DBD samples (Fig. 9f). The studied dykes were de-rived in continental settings (Fig. 8f). The fact that DBD andAL are mostly porphyritic (Fig. 3e) and glomeroporphyriticrocks (i.e., subvolcanic), implying that they may have resided
Fig. 9 a Rock/chondrite normalized values (Wood et al. 1979b) for traceelements in LPD and DBD. b SiO2–Nb diagram (Pearce and Gale 1977)to differentiate between within-plate and volcanic-arc lavas. c Y/Nb-Rbdiagram (Pearce et al. 1984 and post-collisional field after Pearce 1996). dRb/Y-Nb/Y. diagram (Chazot and Bertrand 1995), upper and lower
crustal values are from Rudnick and Gao (2003) and upper mantle valuefrom Sun and McDonough (1989). eMgO-Rb/Zr binary diagram. fMgOBa/Nb binary diagram, FC: fractional crystallization, AFC: assimilation-fractional crystallization and BA: bulk assimilation. Symbols as in Fig. 4
223 Page 18 of 21 Arab J Geosci (2018) 11: 223
in crustal magma chambers prior to extrusion/shallow intru-sion and would have had sufficient residence period to interactwith continental crust. Accordingly, the role of assimilationand/or contamination should be considered in the magmaticevolution of DBD and AL.
By using ΔNb value of Fitton (2007) whereas, ΔNb =1.74+ log (Nb/Y)-1.92 Log (Zr/Y) for the studied dykes.ΔNb values for all the studied dykes are negative (Tables 6and 7), suggesting their derivation from an enriched mantlesources through partial melting (Fitton 2007). Ni and Crdepletion especially in DBD and to some extent in CALand AL could be explained by small degree of partial melt-ing of heterogeneous mantle source followed by fractionalcrystallization (Fitton and Upton 1985).
The evidences from mineral chemistry, major and traceelements, and geochemical ratios mentioned before favor themodel of mixed crustal-mantle source (Fig. 6a). Thus, theparental magmas of the investigated dykes were generatedmost likely from lower crustal sources (Fig. 9d), with contri-bution from mantle-derived melt. Therefore, the mafic dykesin Wadi Mandar-Wadi Um Adawi area were generated fromdifferent magmatic sources by partial melting followed byfractional crystallization (Fig. 9e, f). Furthermore, the crustalcontamination/assimilation has a considerable role in themagmatic evolution of AL and DBD (Fig. 9f).
Conclusion
(1) The mafic dykes in Wadi Mandar-Wadi Um Adawi areaare represented by lamprophyre and diabase dykes. Thefield observations, distributions, trends, and cross cuttingrelationships suggest that the emplacement of calc-alkaline lamprophyres preceded that of the diabasedykes, while alkaline lamprophyres emplaced later thanthe diabase dykes.
(2) The dykes in Wadi Mandar-Wadi Um Adawi area repre-sent three episodes of dyke swarms in Precambrian rock inSinai, which are calc-alkaline lamprophyres, diabase, andalkaline lamprophyres. These dykes have metaluminousnature. Calc-alkaline lamprophyres and diabase dykesshow transitional characters from calc-alkaline to alkaline,while alkaline lamprophyres exhibit alkaline character
(3) The dykes were crystallized under crystallization temper-atures between 1100 and 1150 °C and under pressureranges from 3 to 5 kbars. They were crystallized underhigh oxygen fugacity conditions.
(4) Calc-alkaline lamprophyres, diabase dykes, and alkalinelamprophyres have different magmatic sources and thepartial melting and or fractional crystallization could notbe considered for the generation of diabase dykes oralkaline lamprophyres lamprophyre from calc-alkalinelamprophyres.
(5) The dykes emplaced during the post-collisional stage,i.e., Bnon-orogenic^ environment and certainly not incompressional arc-type one.
(6) The parental magmatic sources of the studied dykeswere originated from crustal material with addition ofmantle-derived melt. During post-collisional stage,the mantle-derived melt underplate and intraplate thecrust, which generate coeval calc-alkaline and alka-line magmatic sources. Partial melting and subsequentfractional crystallization were the responsible processin the magmatic evolution of the studied dykes. Inaddition to partial melting and fractional crystalliza-tion, the crustal contamination/assimilation is consid-ered in generation of diabase dykes and alkalinelamprophyres.
Acknowledgments The authors are very grateful to Prof. Dr. K.Petrakakis, Mr. P. Nagl, and Mr. F. Kiraly, Faculty of Erath Sciences,University of Vienna for their help in carrying out X-ray fluorescenceand microprobe analyses.
References
Abdel-Rahman AFM (1996) Pan-African volcanism: petrology and geo-chemistry of the Dokhan volcanic suite in the northern Nubianshield. Geol Mag 133:17–31
Abdelsalam MG, Liégeois J, Stern RJ (2002) The Saharan Metacraton. JAfr Earth Sci 34:119–136
Anderson JL, Smith DR (1995) The effects of temperature and fO2 on theAl-in hornblende barometer. Am Mineral 80:549–559
Basta EZ, El-Sharkawy MA, Mikhail MA (1985) Petrographical andpetrochemical studies on some Egyptian lamprophyres. J CollegeScience, King Saud University 16:137–164
Bentor YK (1985) The crust evolution of the Arabo-Nubian massif withspecial reference to the Sinai peninsula. Precamb Res 28:1–74
Bonin B (2004) Do coeval mafic and felsic magmas in post-collisional towithin-plate regimes necessarily imply two contrasting, mantle andcrustal, sources? A review. Lithos 78:1–24
Buddington AF, Lindsley DH (1964) Iron-titanium oxide minerals andsynthetic equivalents. J Petrol 5:310–357
Camp VE, Roobol MJ (1992) Upwelling asthenosphere beneath westernArabia and its regional implications. J Geophys Res 97(B11):15255–15271
Cathelineu M, Nieva D (1985) A chlorite solution geothermometery, thelos Azufers (Mexico) geothermal system. ContribMineral Petrol 91:235–244
Chazot G, Bertrand H (1995) Genesis of silicic magmas during tertiarycontinental rifting in Yemen. Lithos 36:69–83
Deer WA, Howie RA, Zussman J (1966) An introduction to the rock-forming minerals. Longman Group UK, Harlow
Eby GN (1990) The A-type granitoids: a review of their occurrence andchemical characteristics and speculations on their petrogenesis.Lithos 26:115–134
El-Bialy MZ (2010) On the pan-African transition of the Arabian-NubianShieldfrom compression to extension: the post-collision Dokhanvolcanic suite of kid-Malhak region, Sinai, Egypt. Gondwana Res17:26–43
Eyal M, Litvinovsky B, Jahn BM, Zanvilevich A, Katzir Y (2010) Originand evolution of post-coll is ional magmatism: coeval
Arab J Geosci (2018) 11: 223 Page 19 of 21 223
Neoproterozoic calc-alkaline and alkaline suites of the Sinai penin-sula. Chem Geol 269:153–179
Eyal Y, Eyal M (1987) Mafic dyke swarms in the Arabian-Nubian shield.Israel J Earth Sci 36:195–211
Fitton JG (2007) The OIB paradox. In: Foulger GR, Jurdy DM (eds)Plates, plumes, and planetary processes. Geol Soc Am Spec Pap430:387–412
Fitton JG, Upton GGJ (1985) Alkaline igneous rocks: a review sympo-sium. J Geol Soc Lond 142:697–708
Föster MD (1960) Interpretation of the composition of Trioctahedralmicas. US Geol Surv Prof Pap 354B:11–49
Frost BR, Lindsley DH (1992) Equilibria among Fe-Ti oxides, pyrox-enes, olivine, and quartz: part II. Application. AmMineral 77:1004–1020
Gill R (2010) Igneous rocks and processes: a practical guide. Wiley-Blackwell
Greenberg JK (1981) Characteristics and origin of Egyptian youngergranites: summary. Geol Soc Am Bull 92:224–232
Greiling RO, AbdeenMM,Dardir AA, Akhal H, RamlyMF, Kamal GM,OsmanAF, RashwanAA, RiceAHN, SadekMF (1994)A structuralsynthesis of the Proterozoic Arabian-Nubian shield in Egypt. GeolRundsch 83(3):484–501
Halpern M, Tristan N (1981) Geochronology of the Arabian-Nubianshield in southern Israel and Sinai. J Geol 89:639–648
Hey MH (1954) Anew review of the chlorites. Mineral Mag 30:277–292Jarrar GH, Stern RJ, Saffarini G, Al-Zubi H (2003) Late and post-
orogenic Neoproterozoic intrusions of Jordan: implications forcrustal growth in the northernmost segment of the east AfricanOrogen. Precamb Res 123:295–319
Jarrar GH, Manton WI, Stern RJ, Zachmann F (2008) LateNeoproterozoic A-type granites in the northernmost Arabian–Nubian shield formed by fractionation of basaltic melts. ChemErde 68:295–312
Jiang CY, An SY (1984) On chemical characteristics of calcic amphibolesfrom igneous rocks and their petrogenesis significance (in Chinesewith English abstract). J Mineral Petrol 3:1–9
KabeshMK, Abdel Khalek ML, Refaat AM (1978) Geology of Wadi EI-Mellaha area. Esh El-Mellaha range, Eastern Desert. J Geol UnitedArab Republic 14:53–84
Le BasMJ (1962) The role of aluminum in igneous. Clinopyroxenes withrelation to their parentage. Am J Sci 260:267–288
Le Maitre RW, Bateman P, Dudek A et al (1989) A Classification ofigneous rocks andglossary of terms: Recommendations of theInternational Union of Geological Sciences Subcommission on theSystematics of Igneous Rocks. Blackwell Scientific Publications,Oxford 193pp with folding chart
Leake BE, Woolley AR, Arps CES et al (1997) Nomenclature of amphi-boles: report of the subcommittee on amphiboles of the internationalmineralogical association, commission on newminerals and mineralnames. Can Mineral 35:219–246
Lehmann E (1977) The mineralogical variations in spessartites of theAswan area, Egypt. N Jb mineral Abh l29:66–14
Letterrier J, Maury RC, Thonon P, Girard D, Marchal M (1982)Clinopyroxene composition as a method of identification of themagmatic affinities of paleo-volcanic series. Earth Planet Sci Lett59:139–154
Liégeois JP (1998) Preface-some words on the post-collisionalmagmatism. Lithos 45:15–17
Maniar PD, Piccoli PM (1989) Tectonic discrimination of granitoids.Geol Soc Am Bull 101:635–643
Maracuchiev AA, Tararin IA (1966) Mineralogical criteria for alkalinityof granitoids, IZV. A. N. USSR. T Seria. Geol 3:20–38
Mazdab FK, Force ER (1998) Comparison of cobalt and nickel contentsin sulfides from iron-oxide (Cu-Au-U-REE) occurrences with othershydrothermal and magmatic systems. Abstr Annu Meet Geol SocAm 30:369 (Abstract)
Meneisy M (1990) Volcanicity. In: Saild R (ed) The geology of Egypt.Balkema, Rotterdam, Netherland, pp 157–172
Middlemost EAK (1997) Magmas, rocks and planetary development.Longman, Harlow
Mitchell RH (1986) Kimberlites; mineralogy, geochemistry, petrology.Plenum Press, New York
Moghazi AM (1999)Magma source and evolution of late Neoproterozoicgranitoids in the Gabal El Urf area, Eastern Desert, Egypt: geochem-ical and Sr–Nd isotopic constraints. Geol Mag 136:285–300
Moghazi AM, Harbi HM, Ali KA (2011) Geochemistry of the lateNeoproterozoic Hadb adh Dayheen ring complex, central Arabianshield: implications for the origin rare metal-bearing post-orogenicA-type granites. J Asian Earth Sci 42:1324–1340
Moghazi AM (2002) Petrology and geochemistry of pan-African granit-oids, Kab Amiri area, Egypt - implications for tectonomagmaticstages of the Nubian shield evolution. Mineral Petrol 75:41–67
Mohamed FH, Moghazi AM, Hassanen MA (2000) Geochemistry, pet-rogenesis and tectonic setting of late Neoproterozoic Dokhan-typevolcanic rocks in the Fatira area, Eastern Desert, Egypt. Int J EarthSci 88:764–777
Morimoto N, Fabries J, Fergusson AK et al (1988) Nomenclature ofpyroxenes. Am Mineral 73:1123–1133
Moufti AMB, Ali KA, Whitehouse MJ (2013) Geochemistry and petro-genesis of the Ediacaran post-collisional Jabal AI-Hassir ring com-plex, southern Arabian shield, Saudi Arabia. Chem Erde 73:451–467
Nachit H, Ibhi A, Abia EH, Ben Ohoud M (2005) Discrimination be-tween primary magmatic biotites, re-equilibrated biotites andneoformed biotites. Geoscience 337:1415–1420
Pearce JA, Gale GE (1977) Identification of ore deposition environmentfrom trace element geochemistry. Geol Soc London Spec Pub 7:4–24
Pearce JA, Gorman BE, Birkett TC (1975) The TiO2–K2O–P2O5 dia-gram: a method of discriminating between oceanic and nonoceanicbasalts. Earth Planet Sci Lett 24:419–426
Pearce JA, Harris NW, Tindle AG (1984) Trace element discriminationdiagrams for the tectonic interpretation of granitic rocks. J Petrol 25:956–983
Pearce JA (1996) Sources and settings of granitic rocks. Episodes 19:120–125
Perfit MR, Brueckner H, Lawrence JR, Kay RW (1980) Trace elementand isotopic variations in a zoned pluton and associated volcanicrocks, Unalaska Island, Alaska. Contrib Mineral Petrol 73:69–87
Rock NMS (1987) The nature and origin of lamprophyres: an overview.In: Fitton, J.G., Upton, B.G.J. (eds.), alkaline igneous rocks. GeolSoc London Spec Pub 30:191–226
Rock NMS, Bowes DR, Wright AE (1991) Lamprophyres. Blackie andSon, Glasgow-London
Rudnick RL, Gao S (2003) The composition of the continental crust. In:Rudnick RL (ed) The crust. Elsevier-Pergamon, Oxford, pp 1–64
Schandelmeier H, Abdel Rahman EM, Wipfler E et al (1994) LateProterozoic magmatism in the Nakasib suture, Red Sea hills,Sudan. J Geol Soc 151:485–497
Schweitzer EL, Papike JJ, Bence AE (1979) Statistical analysis ofclinopyroxenes from deep sea basalts. Am Mineral 64:501–513
Shafranek D (1978) Dykes in the southeastern part of the Precambrianmassif of Sinai. The Hebrew University of Jerusalem, MSc Thesis,99 p
Soesoo A (1997) A multivariate statistical analysis of clinopyroxenecomposition: empirical coordinates for the crystallisation PT-estima-tions. Geol Soc Swed Geol Foreningen 119:55–60
Stern RJ, Hedge CE (1985) Geochronologic and isotopic constraints onlate Precambrian crustal evolution in the Eastern Desert of Egypt.Am J Sci 285:97–127
223 Page 20 of 21 Arab J Geosci (2018) 11: 223
Stern RJ, Manton WI (1987) Age of Feiran basement rocks, Sinai: impli-cations for late Precambrian crustal evolution in the northernArabian-Nubian shield. J Geol Soc London 144:569–575
Stern RJ, Voegeli DA (1987) Geochemistry, geochronology, and petro-genesis of a late Precambrian (590 Ma) composite dike form thenorth-Eastern Desert of Egypt. Geol Rundsch 76(2):325–341
Streckeisen AL (1978) IUGS subcommission on the systematics of igneousrocks. Classification and nomenclature of volcanic rocks, lamprophyres,carbonatites and Melilite rocks. Recommendations and suggestions.Neues Jahrbuch für Mineralogie, Abhandlungen 141:1–14
Sun S-s, McDonough WF (1989) Chemical and isotopic systematics ofoceanicbasalts: implications for mantle composition and processes.In: Saunders AD, Norry M (eds) Magmatism in ocean basins. GeolSoc London Spec Publ 42:313–345
Wilson M (1989) Igneous Petrogenesis. A Global Tectonic ApproachAcademic-Division of Unwin Hyman Ltd., Landon
Wood DA, Tarney J, Varet J et al (1979) Geochemistry of basalts drilledin the North Atlantic by IPOD leg 49: implications for mantle het-erogeneity. Earth Planet Sci Lett 42:77–97
Arab J Geosci (2018) 11: 223 Page 21 of 21 223