Embed Size (px)
Citation preview
Ballasted Clarification with Enhanced
MLSS (BioMag) Doubles Plant
Capacity within Existing Activated
Sludge System-A Pilot Study at
Kemptville, ON
copyright © 2014 Evoqua Water Technologies LLC, all rights reserved
Project Team
•Project Coordination: City of North Grenville,
ON
•Project Engineering: XCG Consultants-
Oakville, ON
•Equipment and Support: Evoqua Water
Technologies
•Funding: Ontario Ministry of the Environment-
Innovative Technology Grant Program
Presentation Outline
•Background and Project Objectives
•BioMagTM Process Overview
•Demonstration Methodology
•Results •Biological Treatment Performance
•Clarifier Stress Testing
•Conclusions
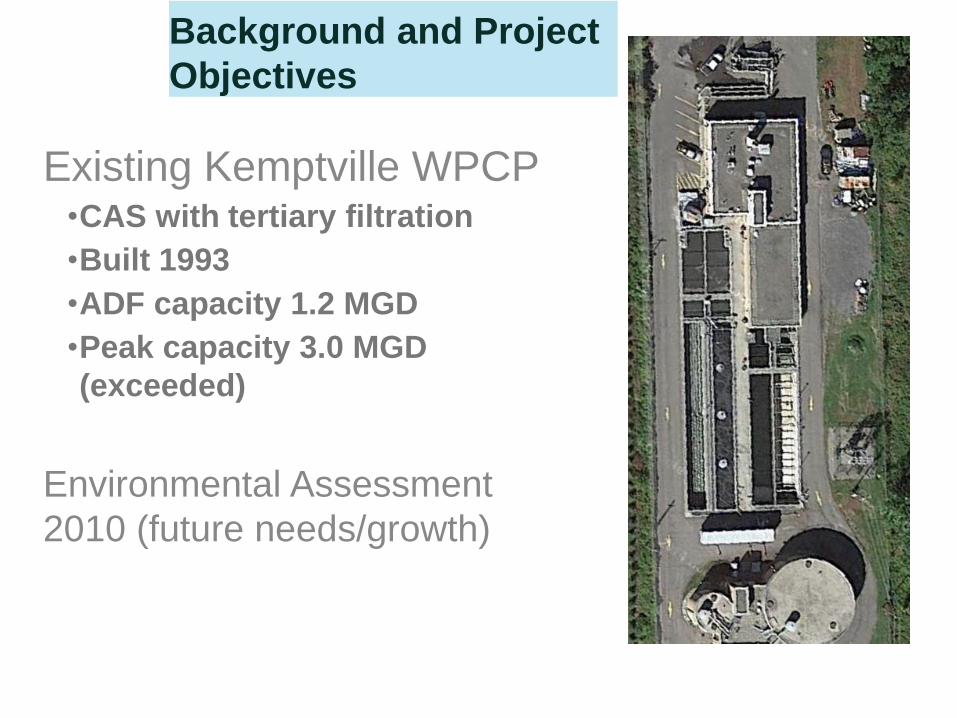
Background and Project
Objectives
Existing Kemptville WPCP •CAS with tertiary filtration
•Built 1993
•ADF capacity 1.2 MGD
•Peak capacity 3.0 MGD
(exceeded)
Environmental Assessment
2010 (future needs/growth)
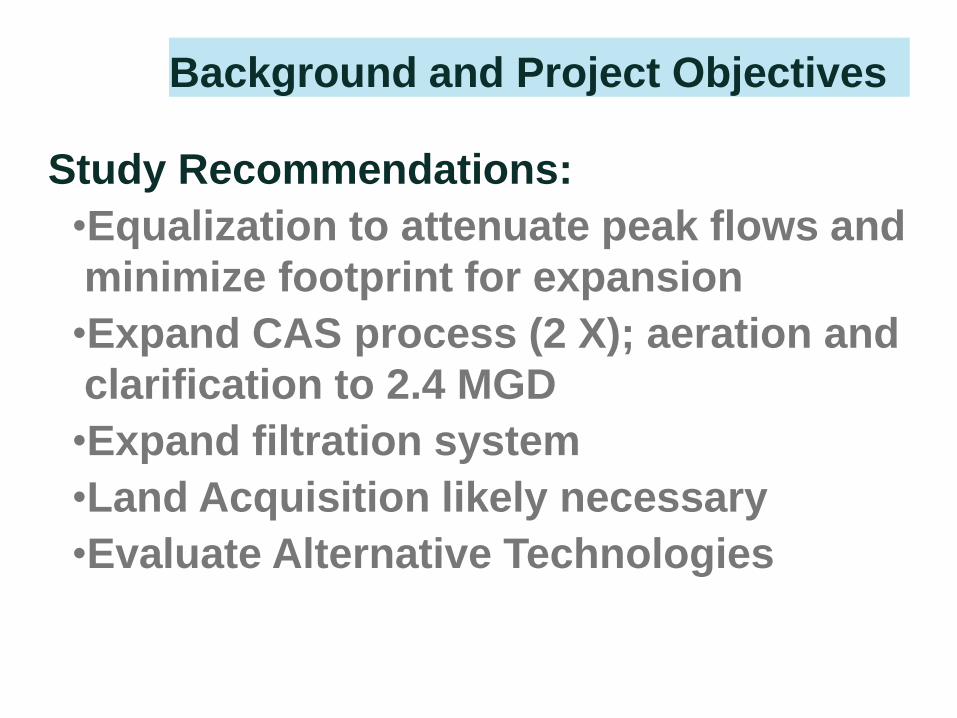
Background and Project Objectives
Study Recommendations:
•Equalization to attenuate peak flows and
minimize footprint for expansion
•Expand CAS process (2 X); aeration and
clarification to 2.4 MGD
•Expand filtration system
•Land Acquisition likely necessary
•Evaluate Alternative Technologies
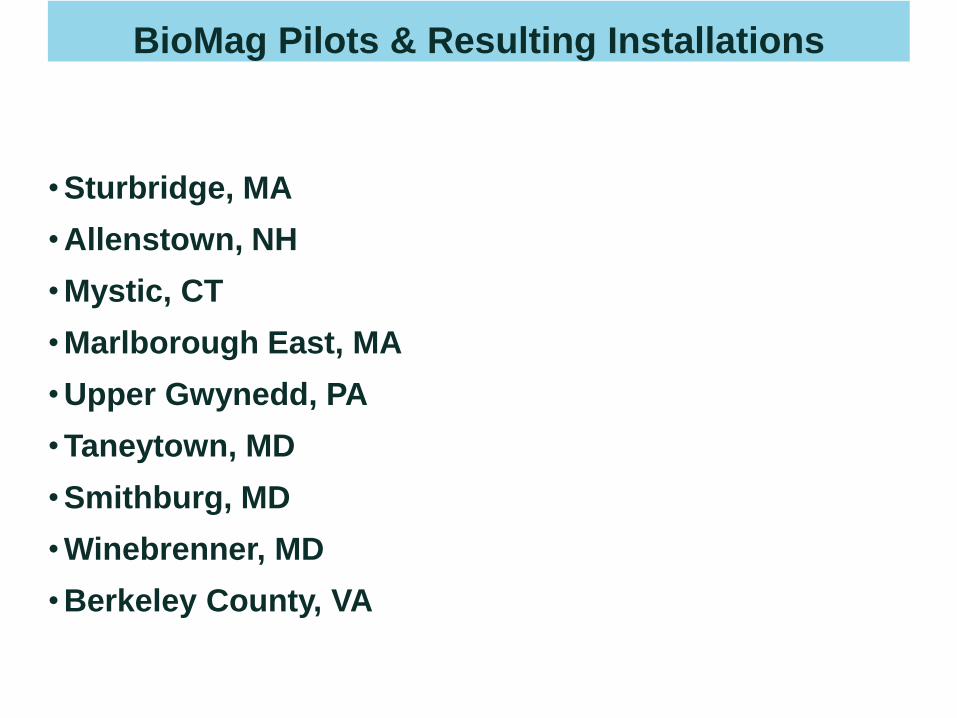
BioMag Pilots & Resulting Installations
• Sturbridge, MA
• Allenstown, NH
• Mystic, CT
• Marlborough East, MA
• Upper Gwynedd, PA
• Taneytown, MD
• Smithburg, MD
• Winebrenner, MD
• Berkeley County, VA
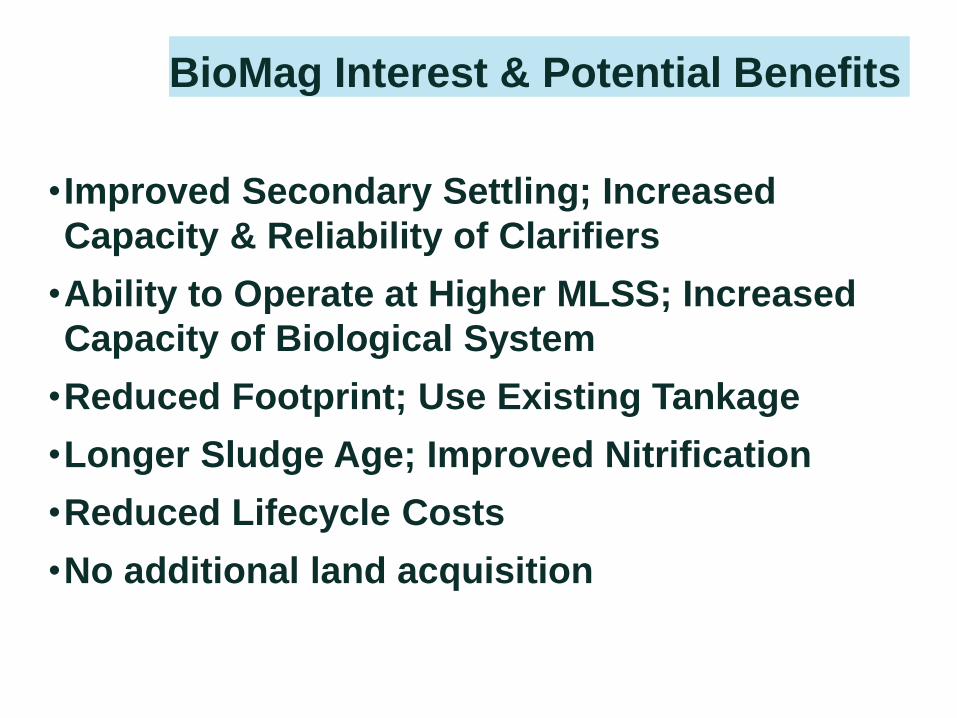
BioMag Interest & Potential Benefits
•Improved Secondary Settling; Increased
Capacity & Reliability of Clarifiers
•Ability to Operate at Higher MLSS; Increased
Capacity of Biological System
•Reduced Footprint; Use Existing Tankage
•Longer Sludge Age; Improved Nitrification
•Reduced Lifecycle Costs
•No additional land acquisition
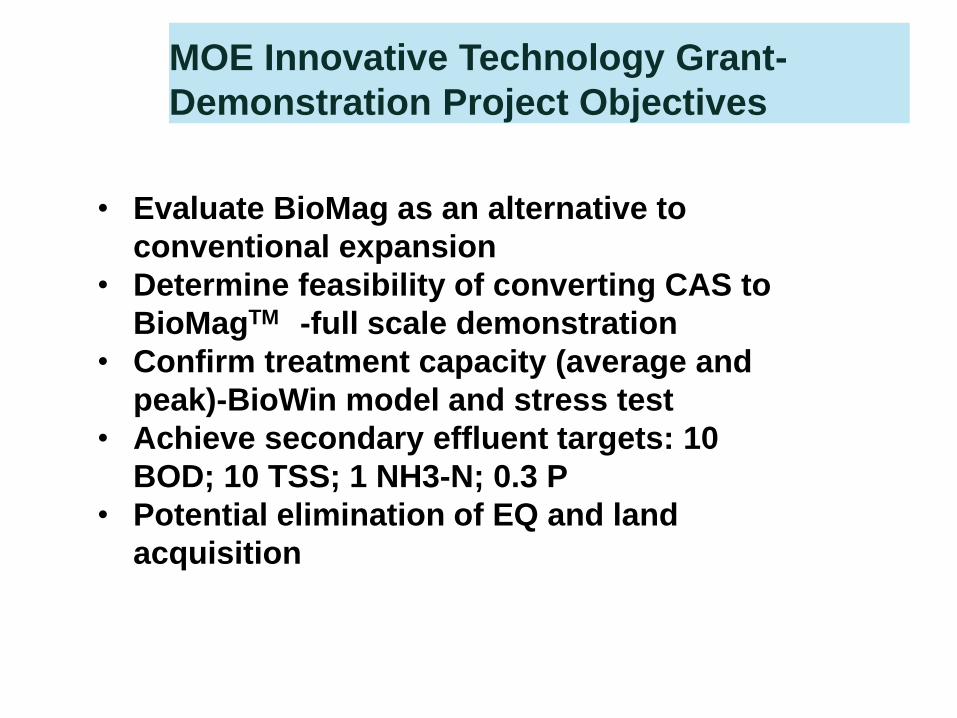
MOE Innovative Technology Grant-
Demonstration Project Objectives
• Evaluate BioMag as an alternative to
conventional expansion
• Determine feasibility of converting CAS to
BioMagTM -full scale demonstration
• Confirm treatment capacity (average and
peak)-BioWin model and stress test
• Achieve secondary effluent targets: 10
BOD; 10 TSS; 1 NH3-N; 0.3 P
• Potential elimination of EQ and land
acquisition
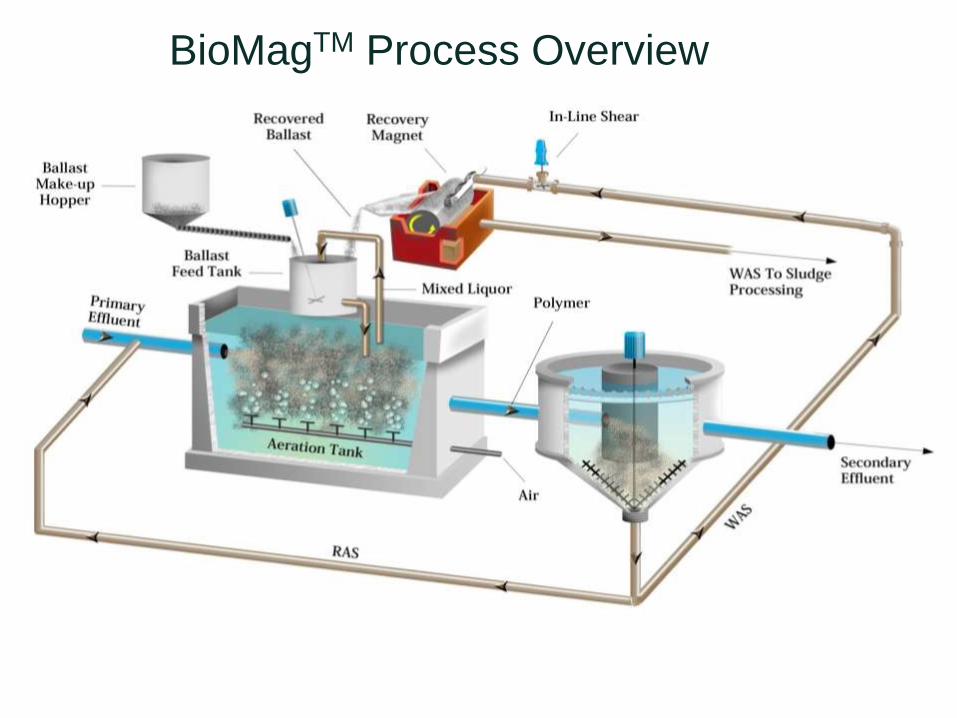
BioMagTM Process Overview
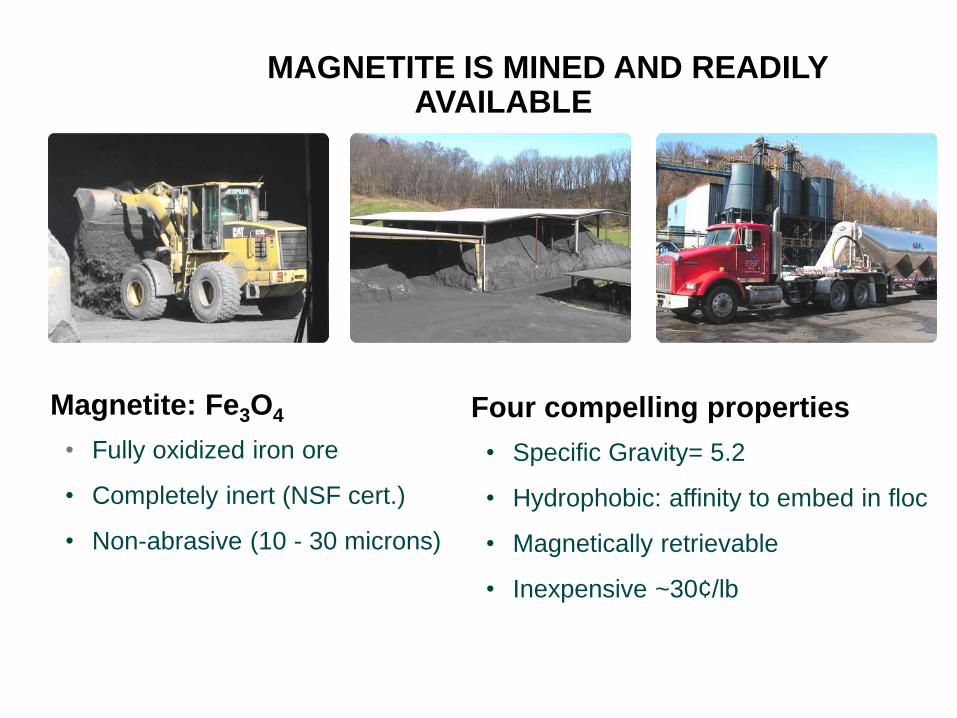
Magnetite: Fe3O4
• Fully oxidized iron ore
• Completely inert (NSF cert.)
• Non-abrasive (10 - 30 microns)
Four compelling properties
• Specific Gravity= 5.2
• Hydrophobic: affinity to embed in floc
• Magnetically retrievable
• Inexpensive ~30¢/lb
MAGNETITE IS MINED AND READILY AVAILABLE
BIOMAG SYSTEM VALUE DEMONSTRATION Clarifiers determine the
capacity of a WWTP
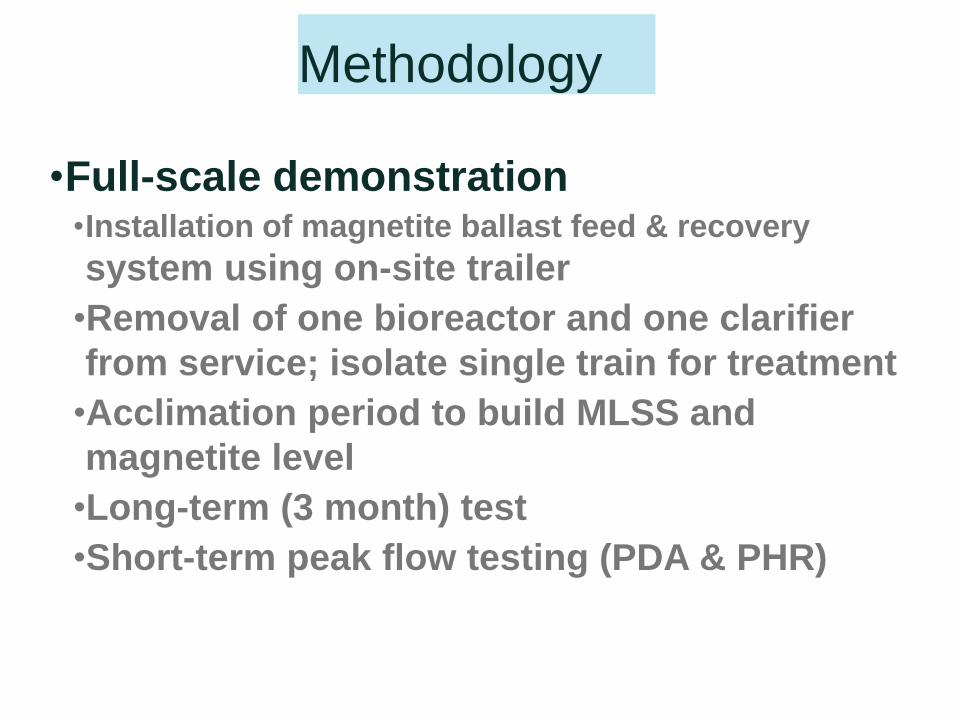
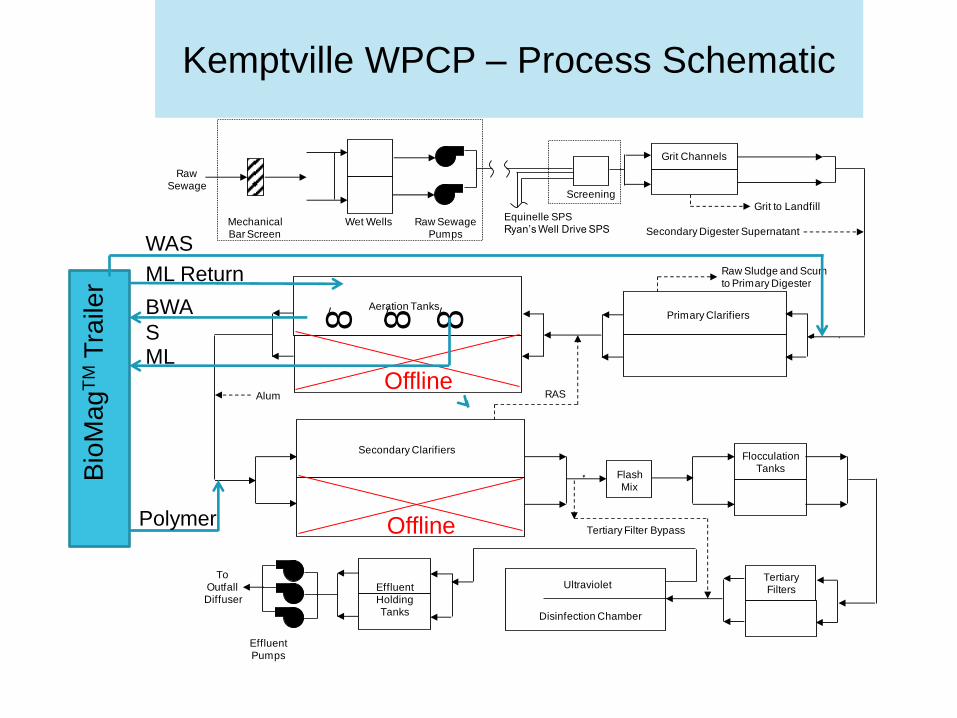
Methodology
•Full-scale demonstration •Installation of magnetite ballast feed & recovery
system using on-site trailer
•Removal of one bioreactor and one clarifier
from service; isolate single train for treatment
•Acclimation period to build MLSS and
magnetite level
•Long-term (3 month) test
•Short-term peak flow testing (PDA & PHR)
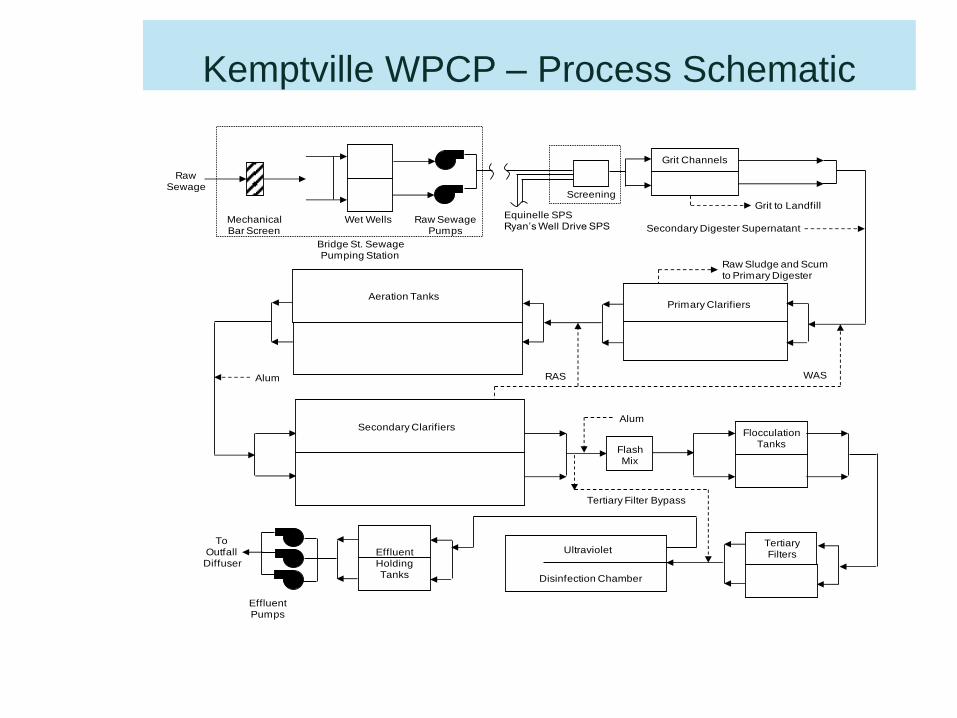
Kemptville WPCP – Process Schematic
Grit Channels
FlashMix
Grit to Landfill
Primary Clarifiers
Raw Sludge and Scum to Primary Digester
Aeration Tanks
Secondary Clarifiers
Secondary Digester Supernatant
Alum
FlocculationTanks
TertiaryFiltersUltraviolet
Disinfection Chamber
EffluentHoldingTanks
EffluentPumps
ToOutfallDiffuser
Alum
RAS WAS
Screening
RawSewage
MechanicalBar Screen
Wet Wells Raw SewagePumps
Bridge St. SewagePumping Station
Tertiary Filter Bypass
Equinelle SPSRyan’s Well Drive SPS
Offline
Offline
Bio
Ma
gT
M T
raile
r
BWA
S
Polymer
8
8
8
ML Return
WAS
ML
Kemptville WPCP – Process Schematic
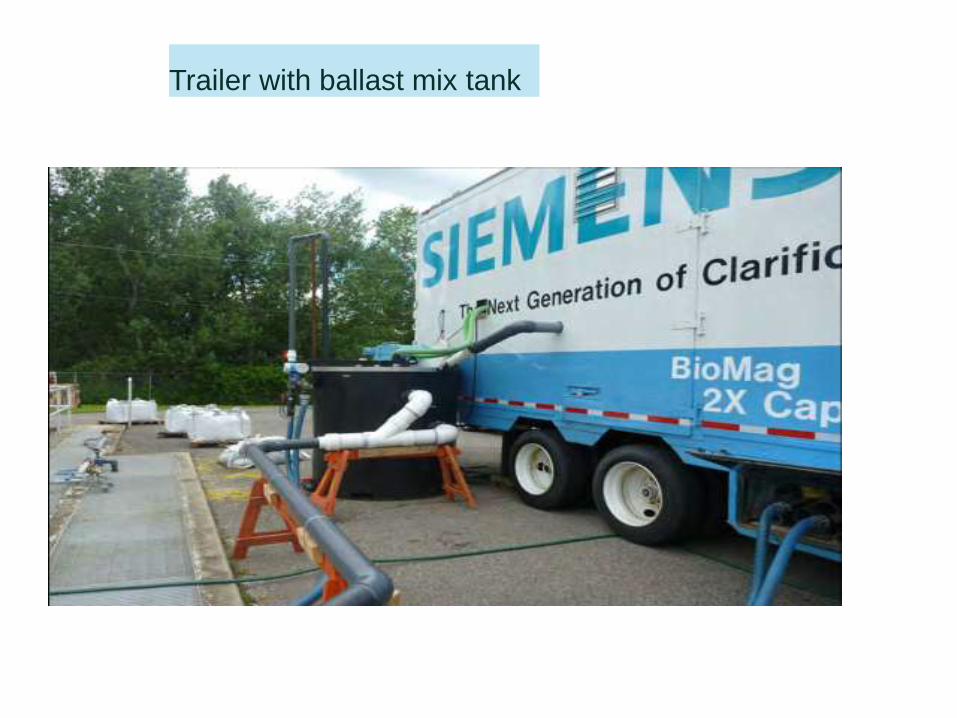
Trailer with ballast mix tank
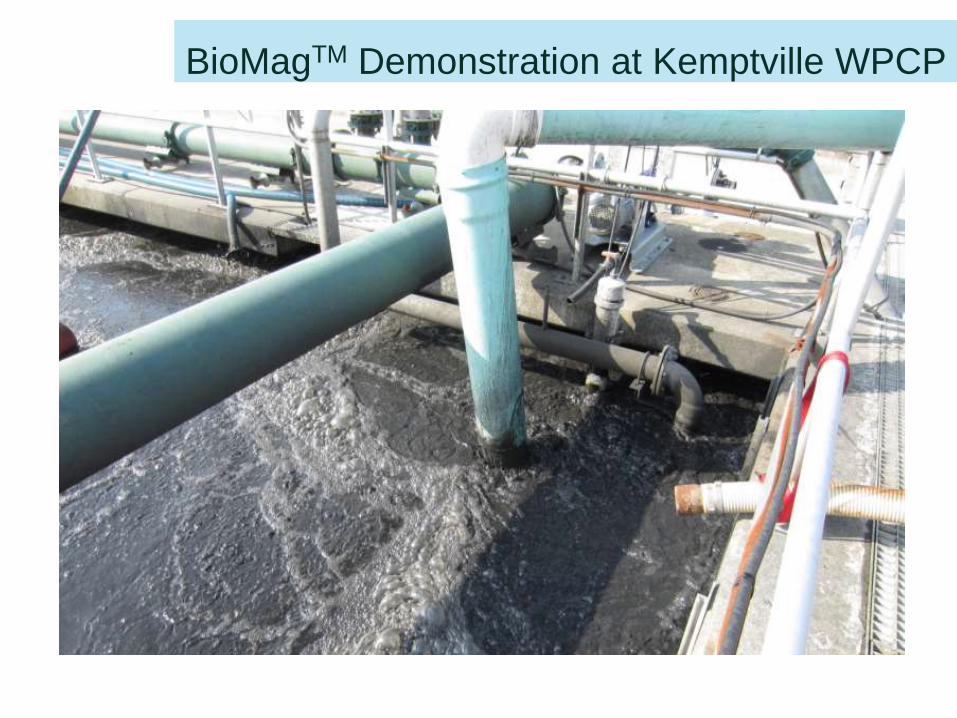
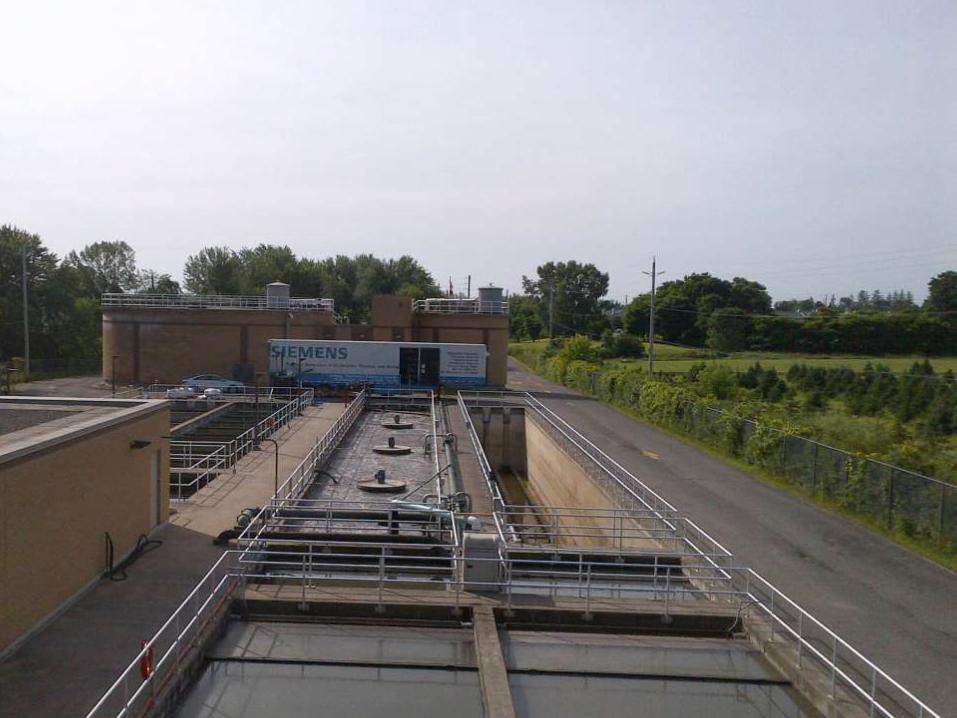
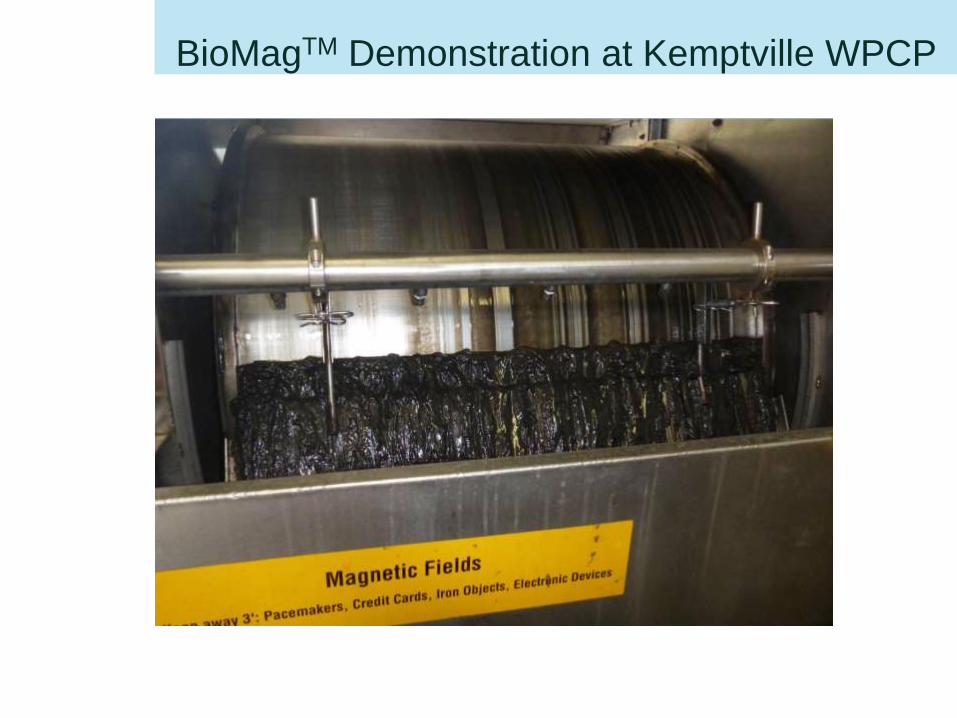
BioMagTM Demonstration at Kemptville WPCP
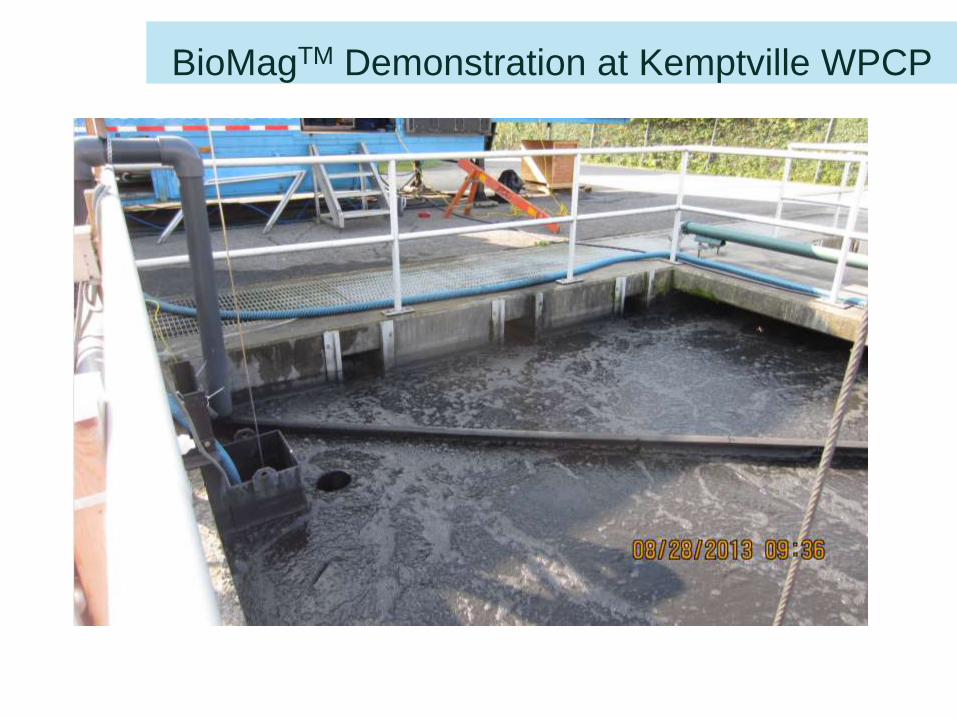
BioMagTM Demonstration at Kemptville WPCP
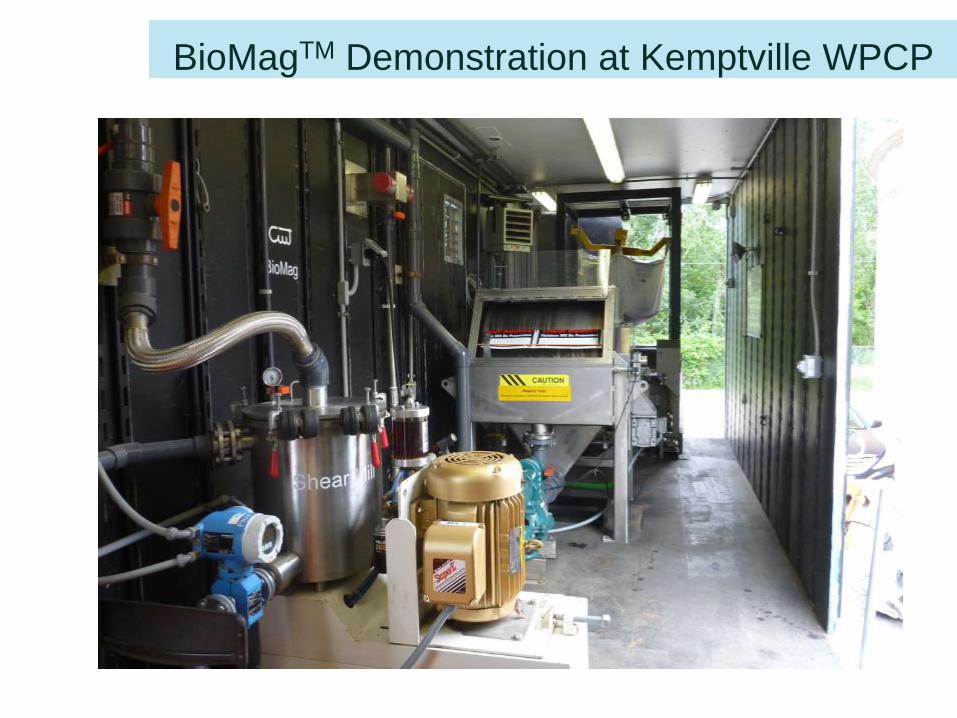
BioMagTM Demonstration at Kemptville WPCP
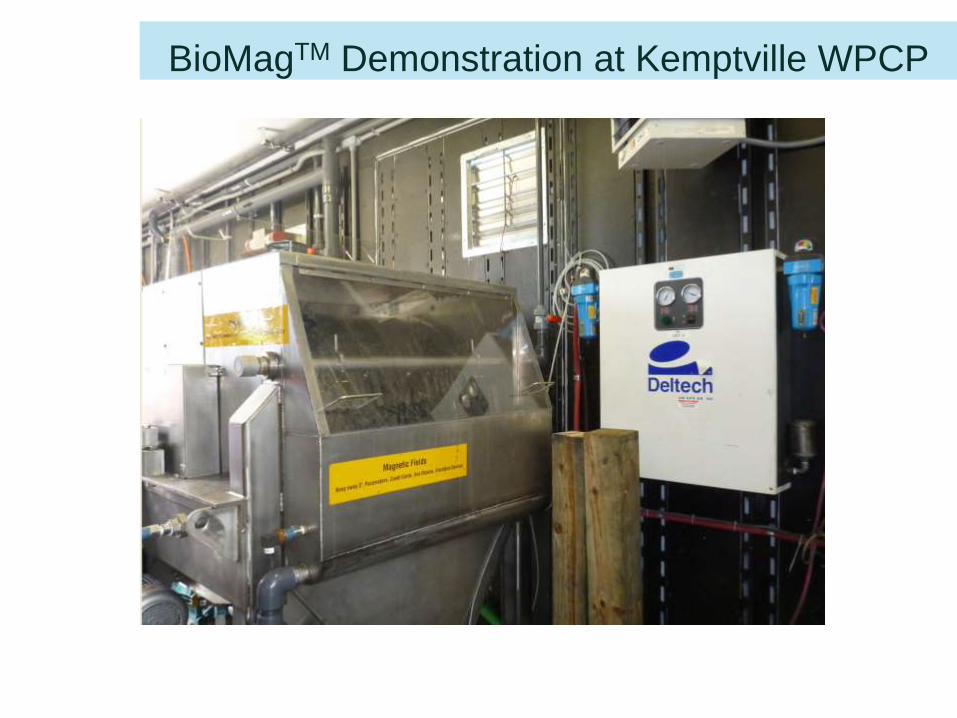
BioMagTM Demonstration at Kemptville WPCP
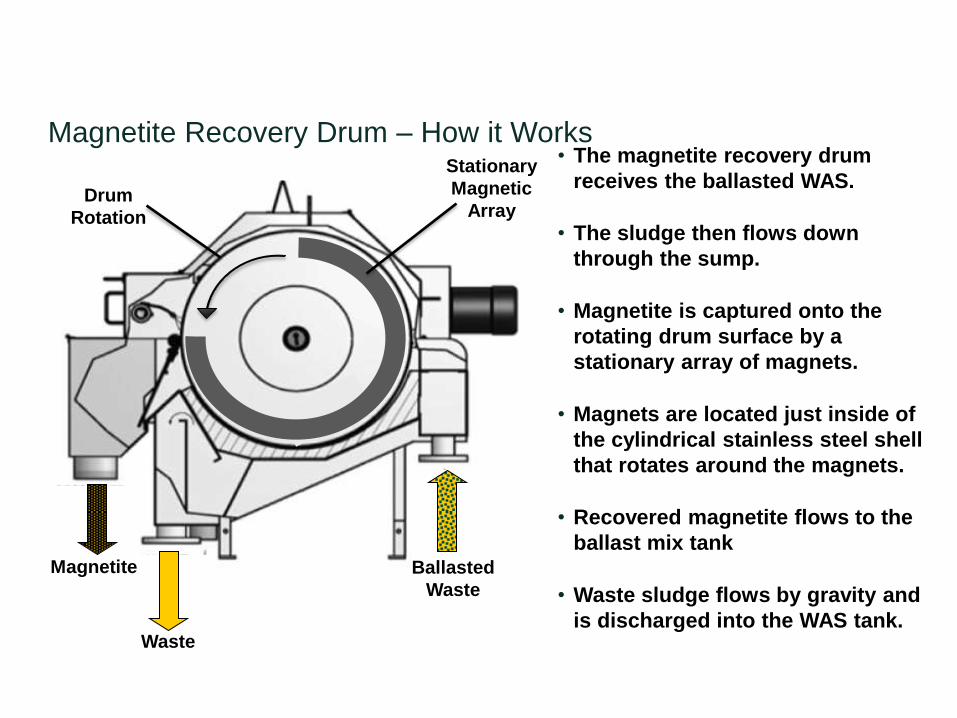
Magnetite Recovery Drum – How it Works
Waste
Magnetite Ballasted
Waste
Stationary
Magnetic
Array Drum
Rotation
• The magnetite recovery drum
receives the ballasted WAS.
• The sludge then flows down
through the sump.
• Magnetite is captured onto the
rotating drum surface by a
stationary array of magnets.
• Magnets are located just inside of
the cylindrical stainless steel shell
that rotates around the magnets.
• Recovered magnetite flows to the
ballast mix tank
• Waste sludge flows by gravity and
is discharged into the WAS tank.
BioMagTM Demonstration at Kemptville WPCP
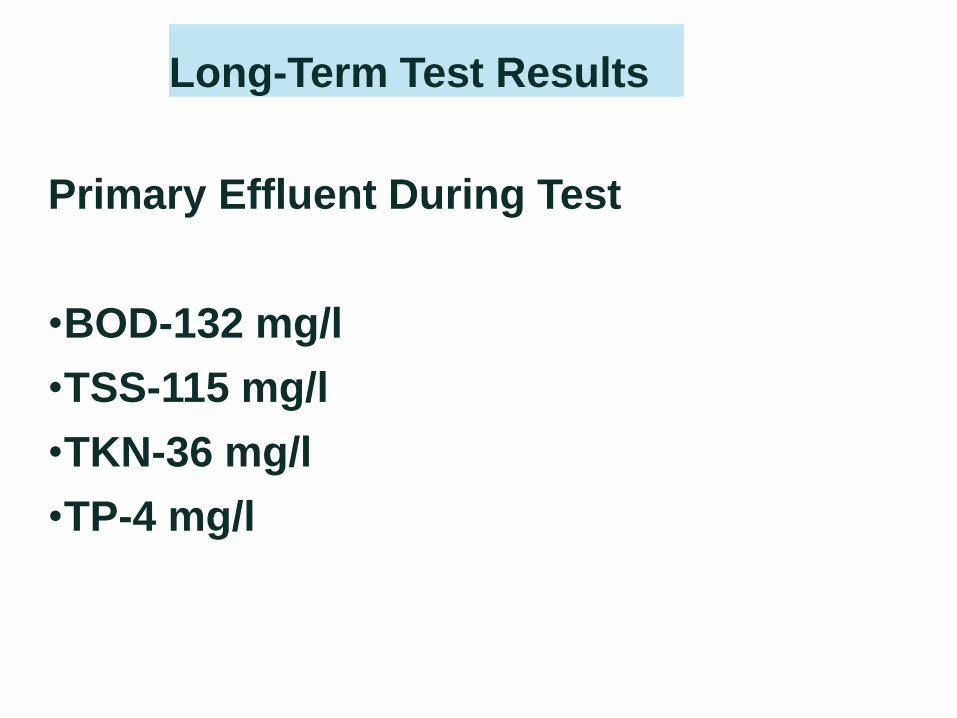
Long-Term Test Results
Primary Effluent During Test
•BOD-132 mg/l
•TSS-115 mg/l
•TKN-36 mg/l
•TP-4 mg/l
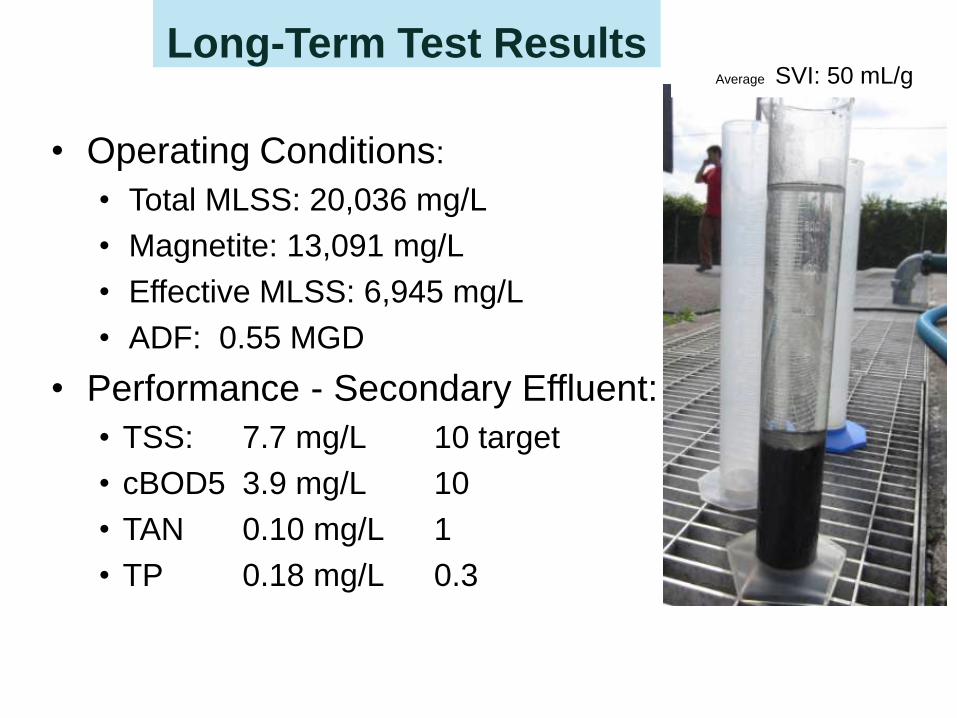
Long-Term Test Results
• Operating Conditions:
• Total MLSS: 20,036 mg/L
• Magnetite: 13,091 mg/L
• Effective MLSS: 6,945 mg/L
• ADF: 0.55 MGD
• Performance - Secondary Effluent:
• TSS: 7.7 mg/L 10 target
• cBOD5 3.9 mg/L 10
• TAN 0.10 mg/L 1
• TP 0.18 mg/L 0.3
Average SVI: 50 mL/g
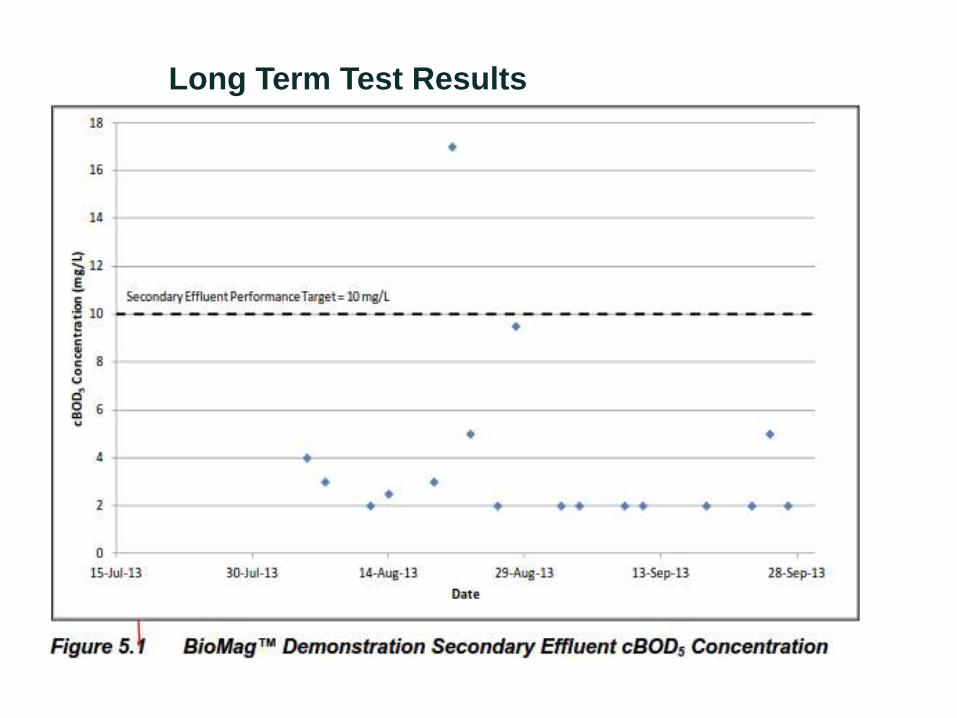
Long Term Test Results
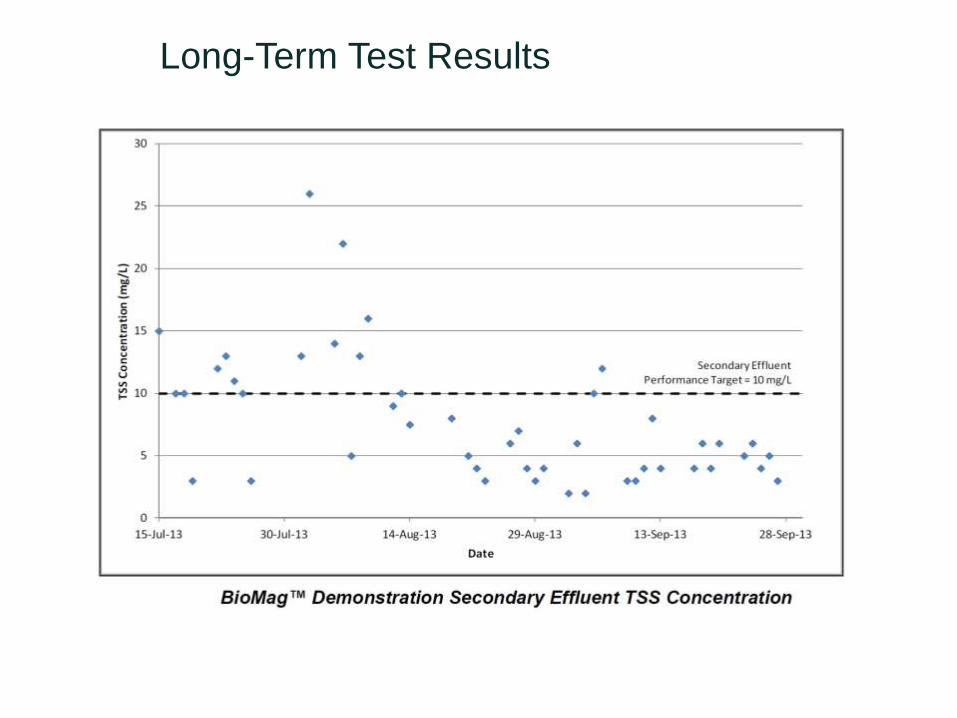
Long-Term Test Results
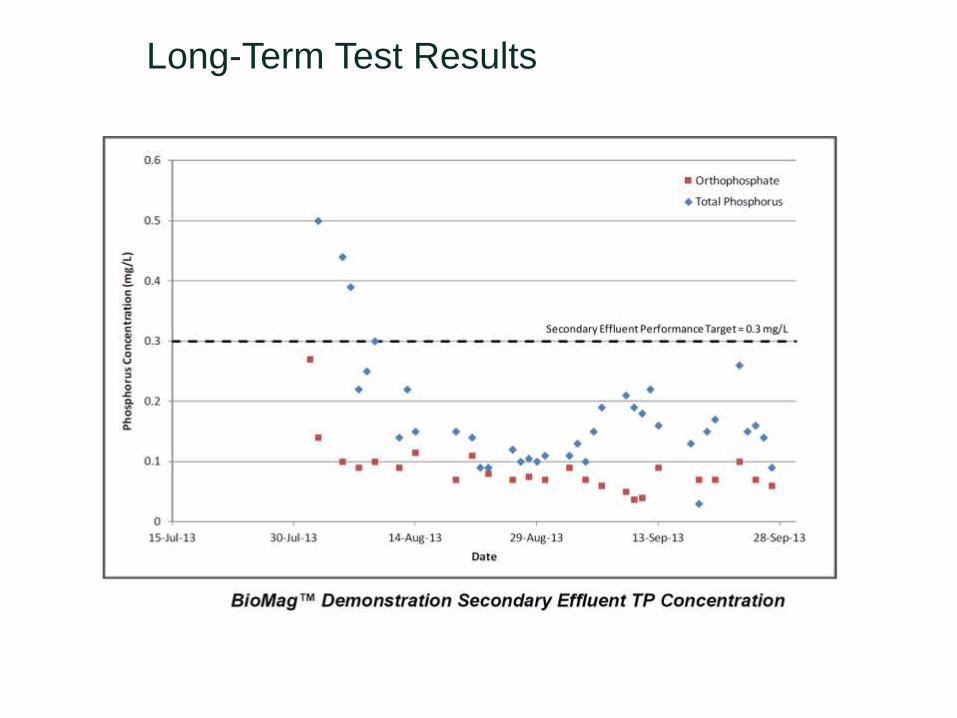
Long-Term Test Results
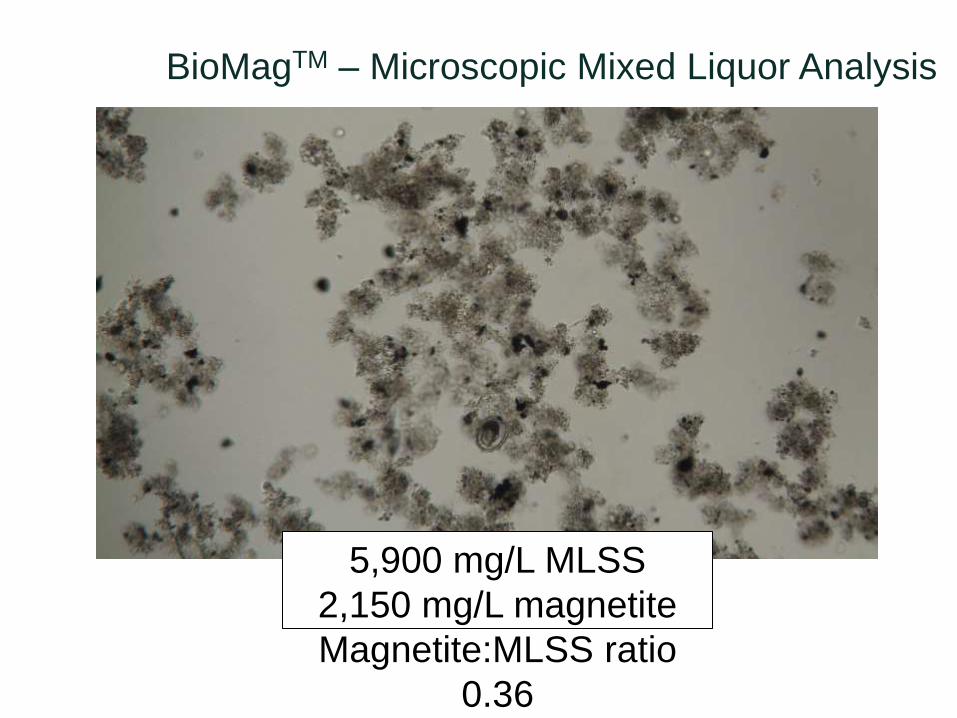
BioMagTM – Microscopic Mixed Liquor Analysis
5,900 mg/L MLSS
2,150 mg/L magnetite
Magnetite:MLSS ratio
0.36
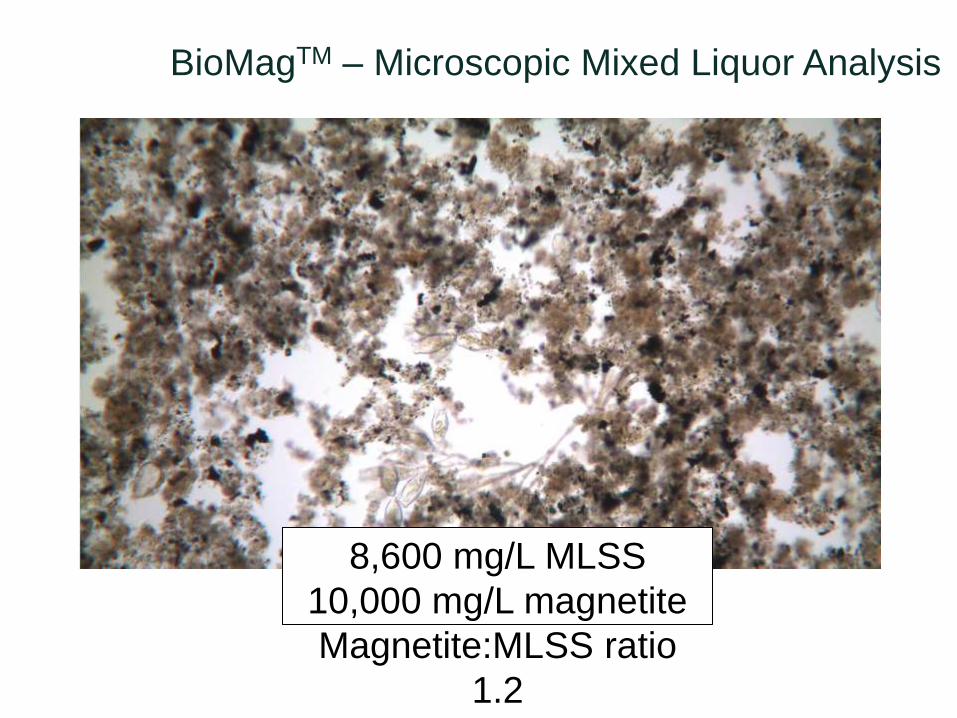
BioMagTM – Microscopic Mixed Liquor Analysis
8,600 mg/L MLSS
10,000 mg/L magnetite
Magnetite:MLSS ratio
1.2
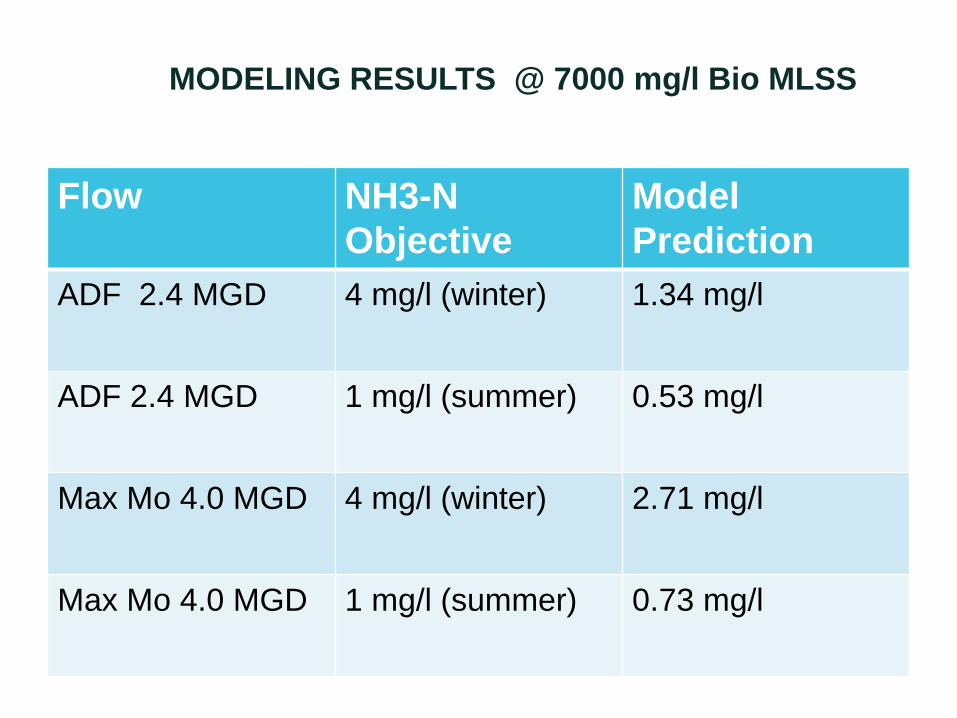
MODELING RESULTS @ 7000 mg/l Bio MLSS
Flow NH3-N
Objective
Model
Prediction
ADF 2.4 MGD 4 mg/l (winter) 1.34 mg/l
ADF 2.4 MGD 1 mg/l (summer) 0.53 mg/l
Max Mo 4.0 MGD 4 mg/l (winter) 2.71 mg/l
Max Mo 4.0 MGD 1 mg/l (summer) 0.73 mg/l
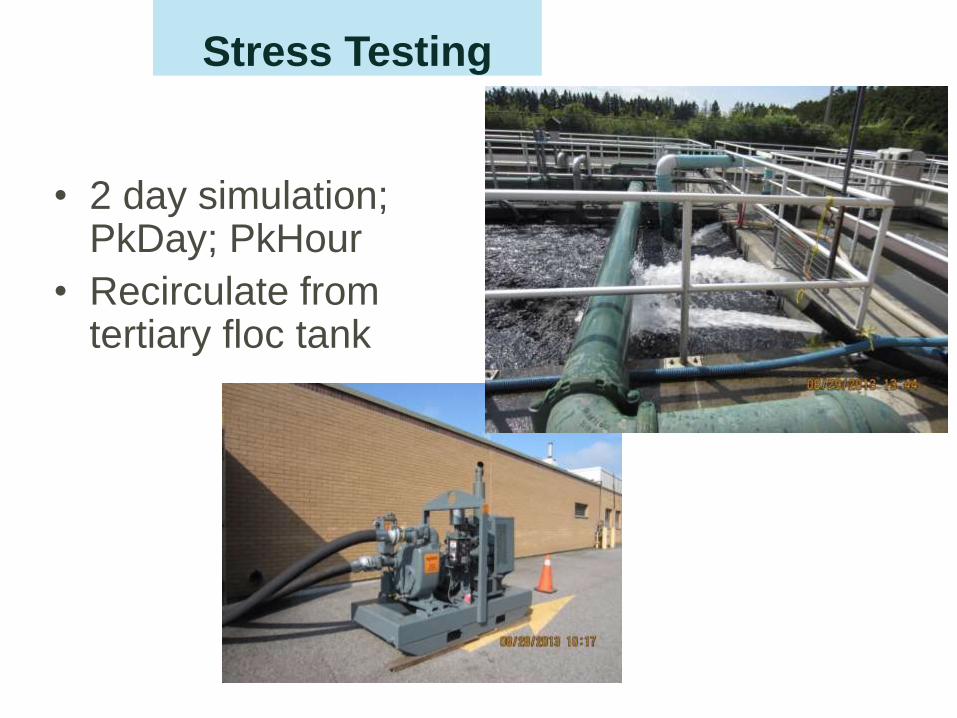
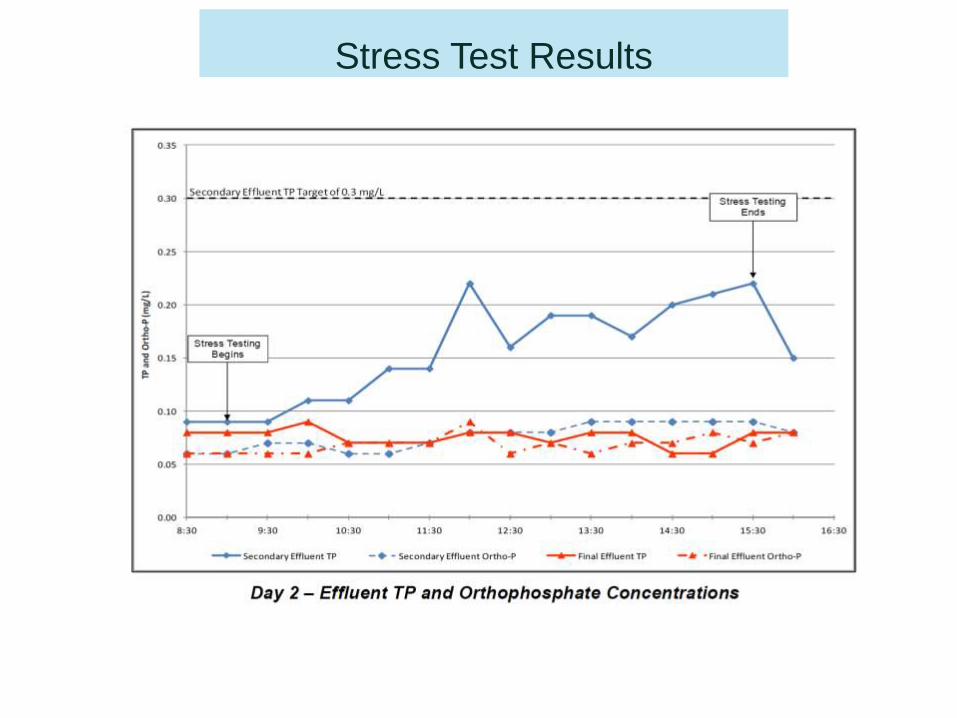
Stress Testing
• 2 day simulation; PkDay; PkHour
• Recirculate from tertiary floc tank
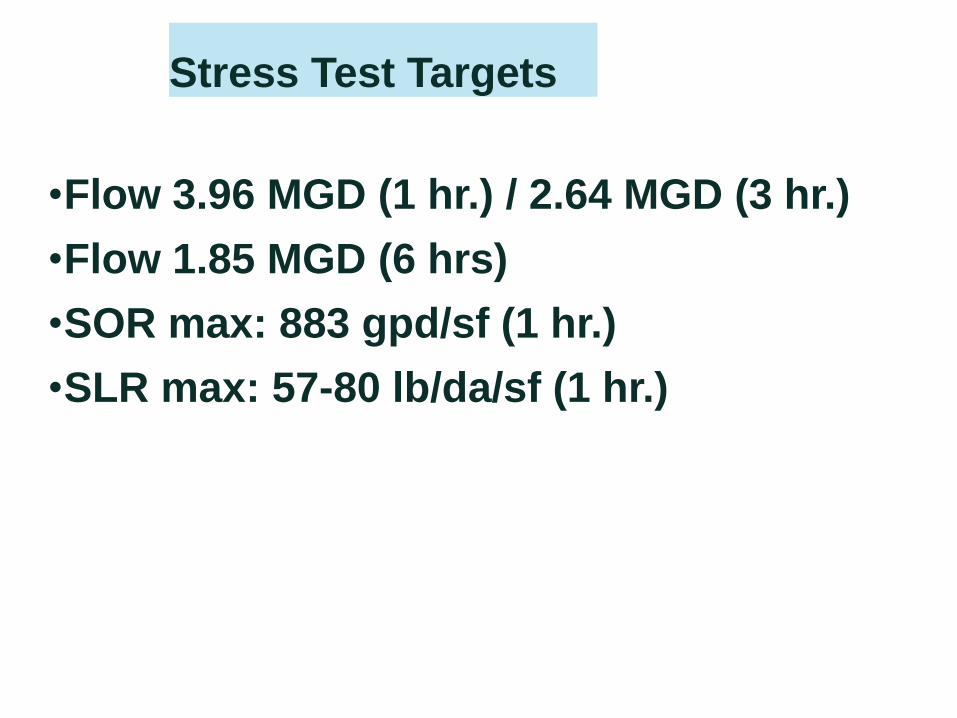
Stress Test Targets
•Flow 3.96 MGD (1 hr.) / 2.64 MGD (3 hr.)
•Flow 1.85 MGD (6 hrs)
•SOR max: 883 gpd/sf (1 hr.)
•SLR max: 57-80 lb/da/sf (1 hr.)
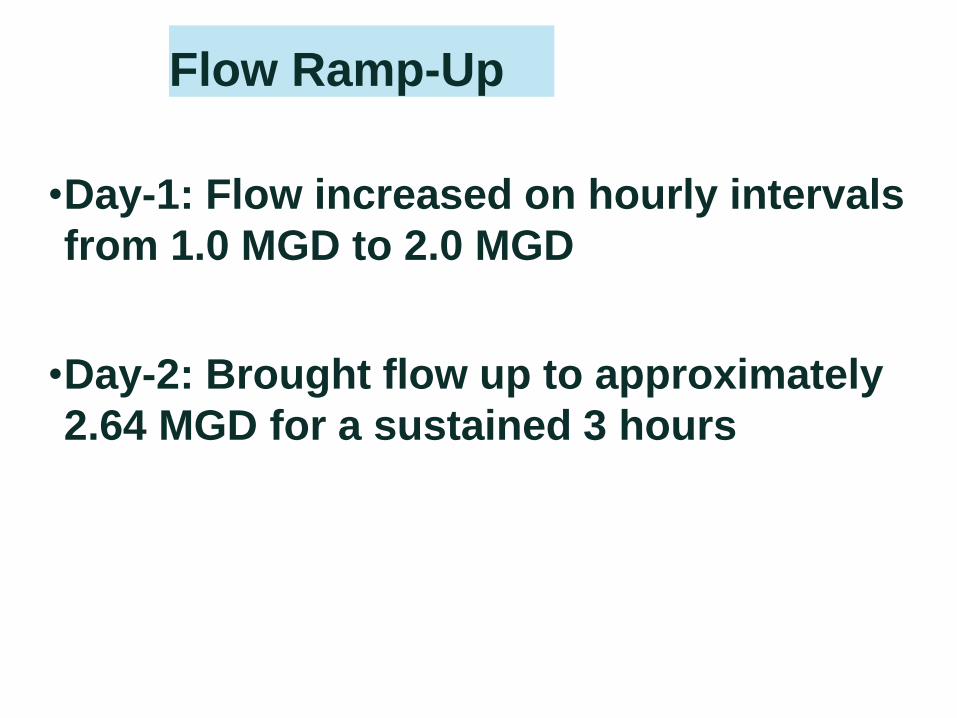
Flow Ramp-Up
•Day-1: Flow increased on hourly intervals
from 1.0 MGD to 2.0 MGD
•Day-2: Brought flow up to approximately
2.64 MGD for a sustained 3 hours
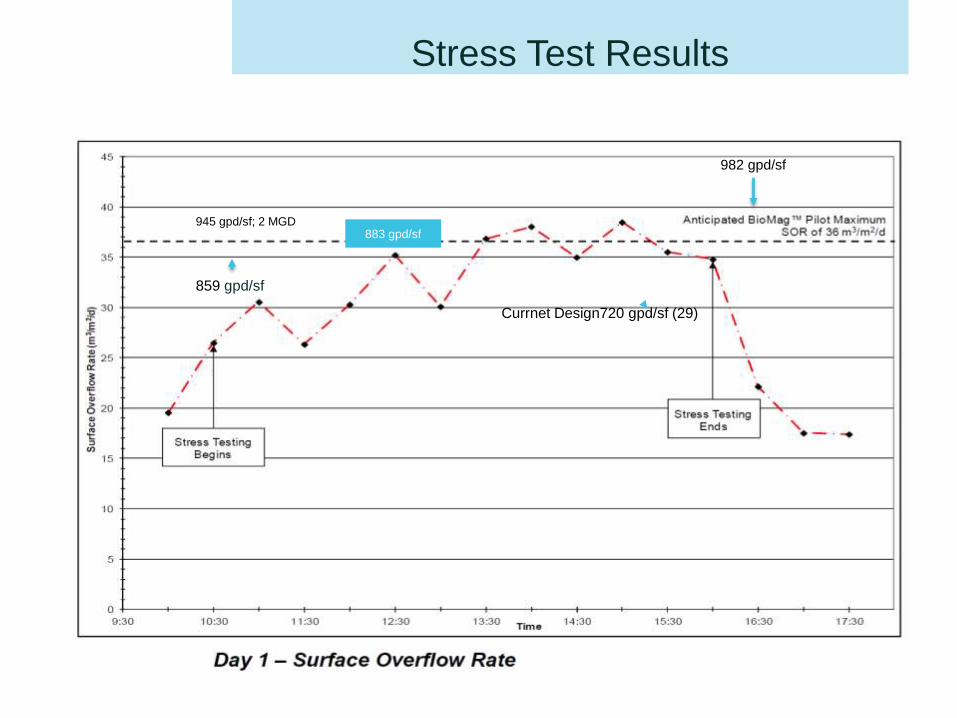
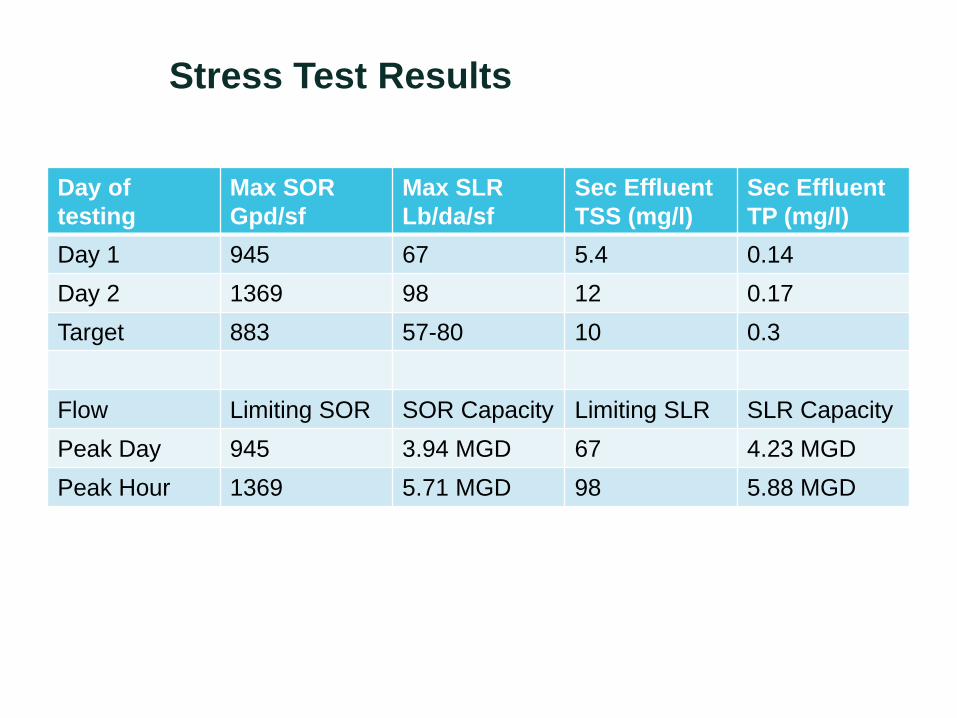
Stress Test Results
945 gpd/sf; 2 MGD
982 gpd/sf
859 gpd/sf
883 gpd/sf
Currnet Design720 gpd/sf (29)
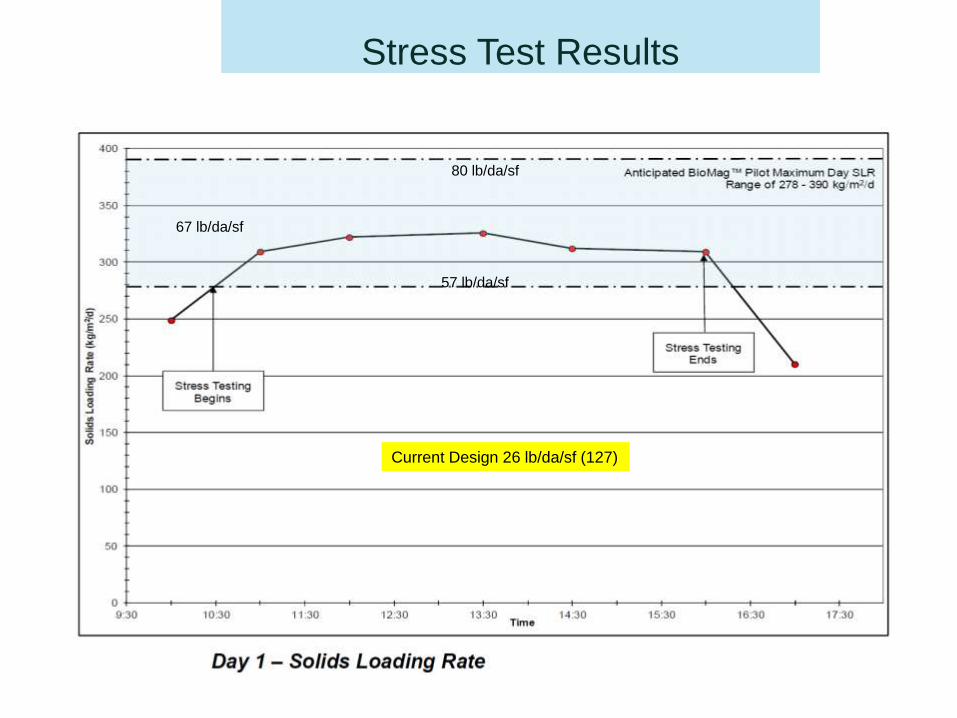
Stress Test Results
67 lb/da/sf
57 lb/da/sf
80 lb/da/sf
Current Design 26 lb/da/sf (127)
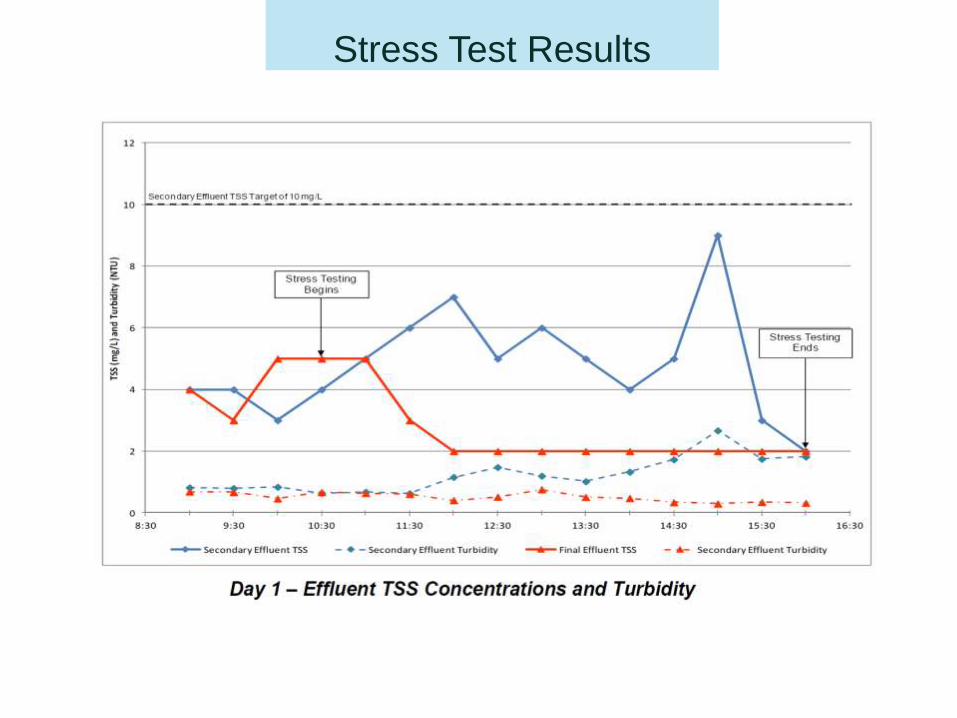
Stress Test Results
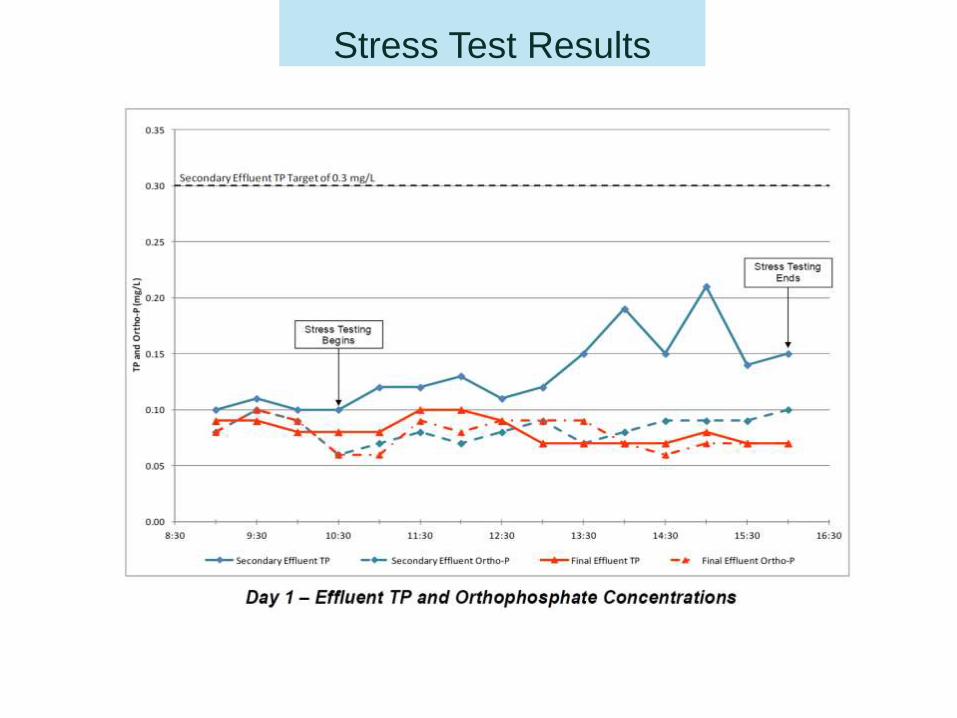
Stress Test Results
Stress Test Results
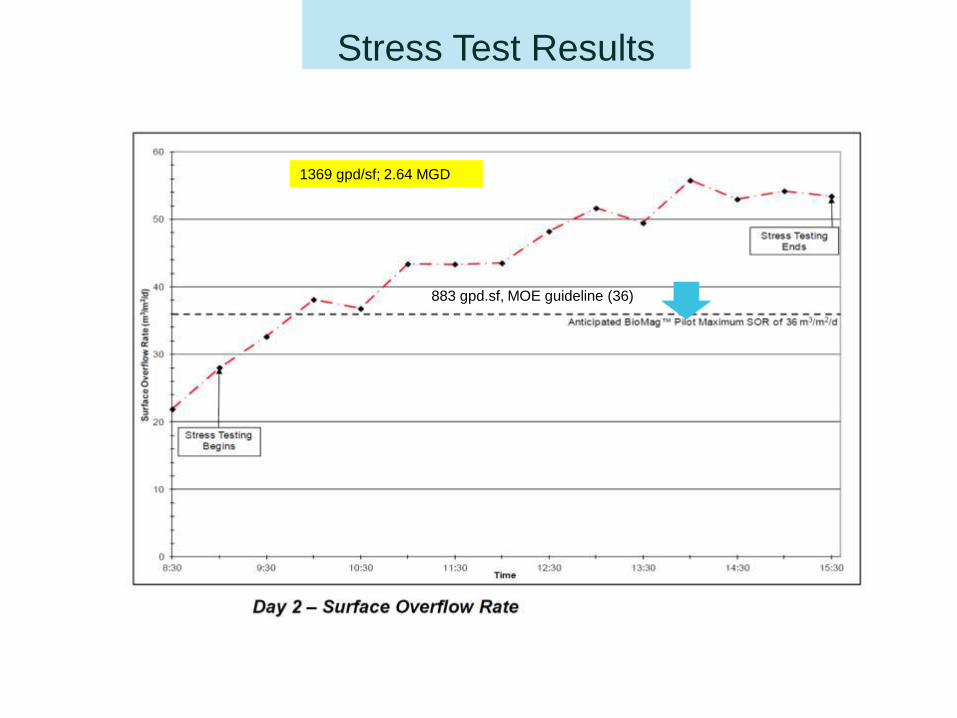
1369 gpd/sf; 2.64 MGD
883 gpd.sf, MOE guideline (36)
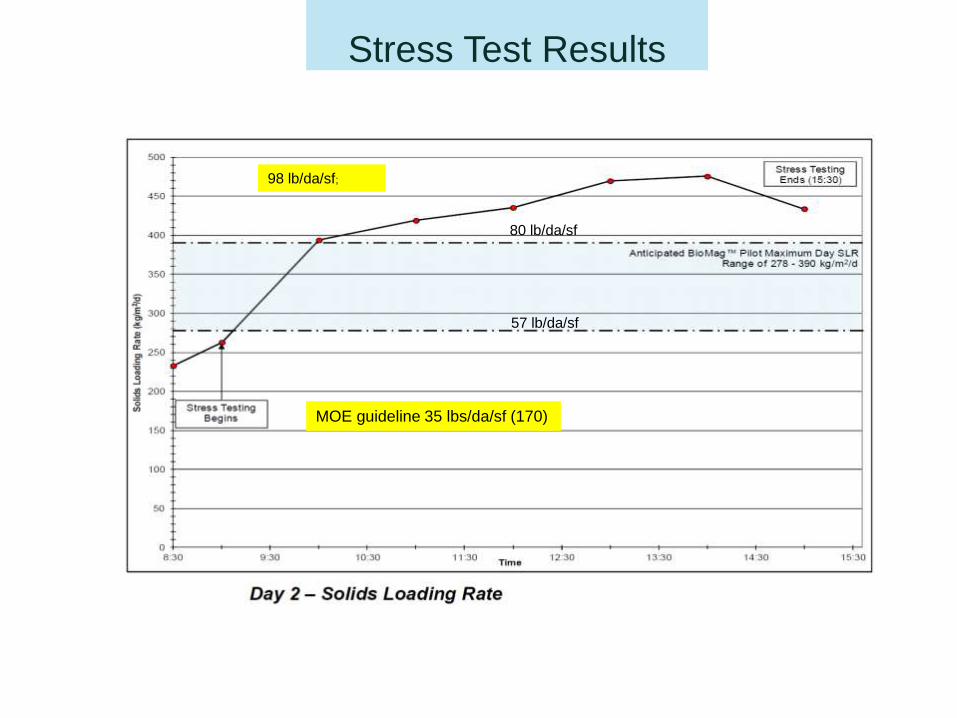
Stress Test Results
98 lb/da/sf;
57 lb/da/sf
80 lb/da/sf
MOE guideline 35 lbs/da/sf (170)
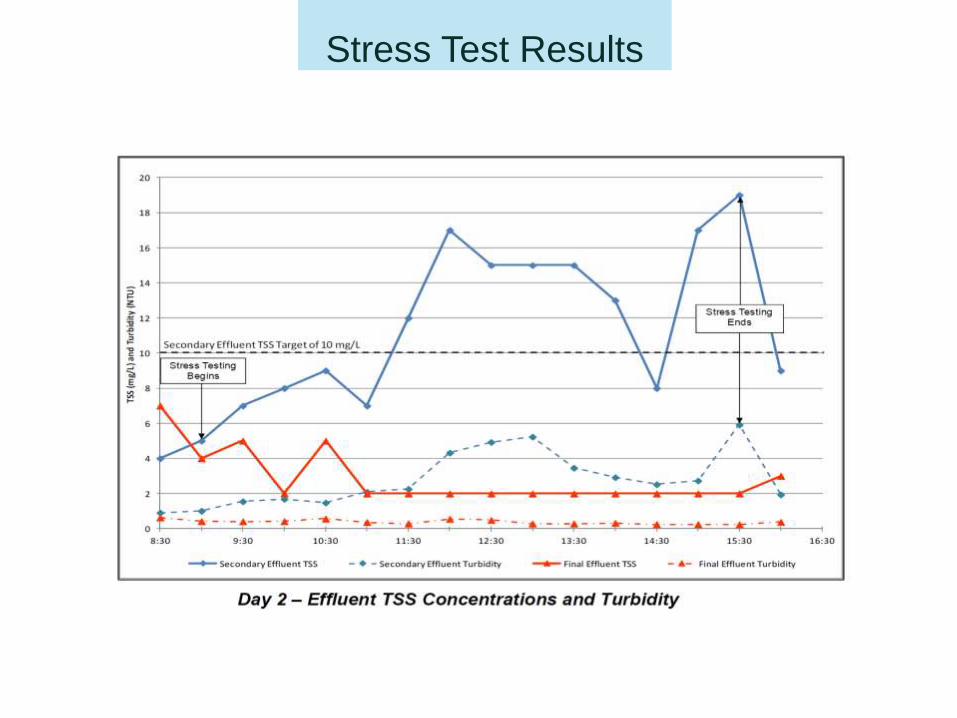
Stress Test Results
Stress Test Results
Stress Test Results
Day of
testing
Max SOR
Gpd/sf
Max SLR
Lb/da/sf
Sec Effluent
TSS (mg/l)
Sec Effluent
TP (mg/l)
Day 1 945 67 5.4 0.14
Day 2 1369 98 12 0.17
Target 883 57-80 10 0.3
Flow Limiting SOR SOR Capacity Limiting SLR SLR Capacity
Peak Day 945 3.94 MGD 67 4.23 MGD
Peak Hour 1369 5.71 MGD 98 5.88 MGD
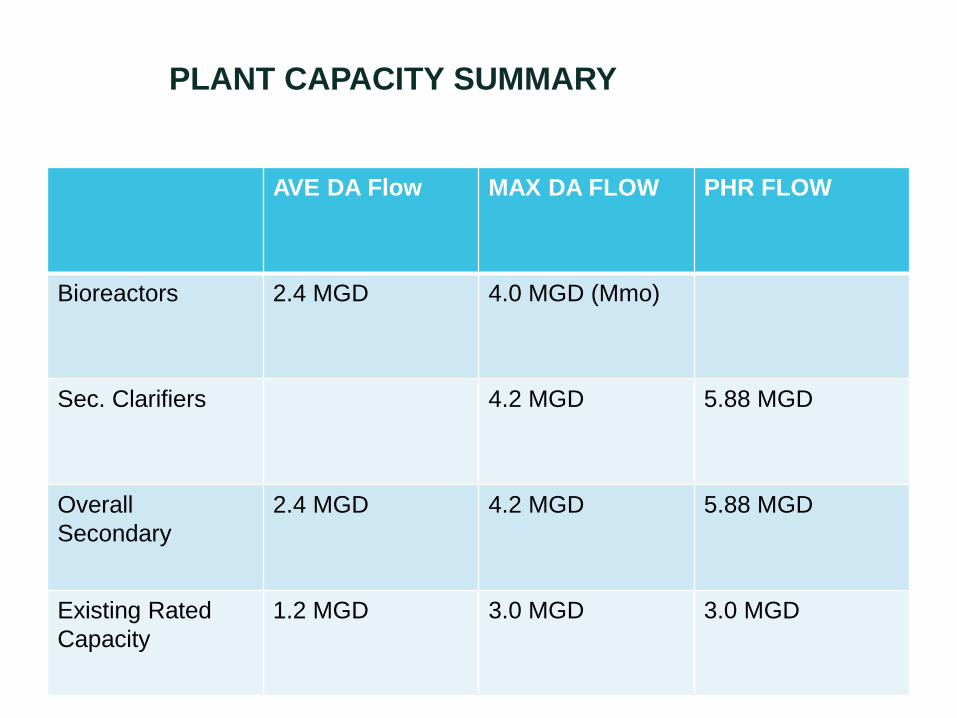
PLANT CAPACITY SUMMARY
AVE DA Flow MAX DA FLOW PHR FLOW
Bioreactors 2.4 MGD 4.0 MGD (Mmo)
Sec. Clarifiers 4.2 MGD 5.88 MGD
Overall
Secondary
2.4 MGD 4.2 MGD 5.88 MGD
Existing Rated
Capacity
1.2 MGD 3.0 MGD 3.0 MGD
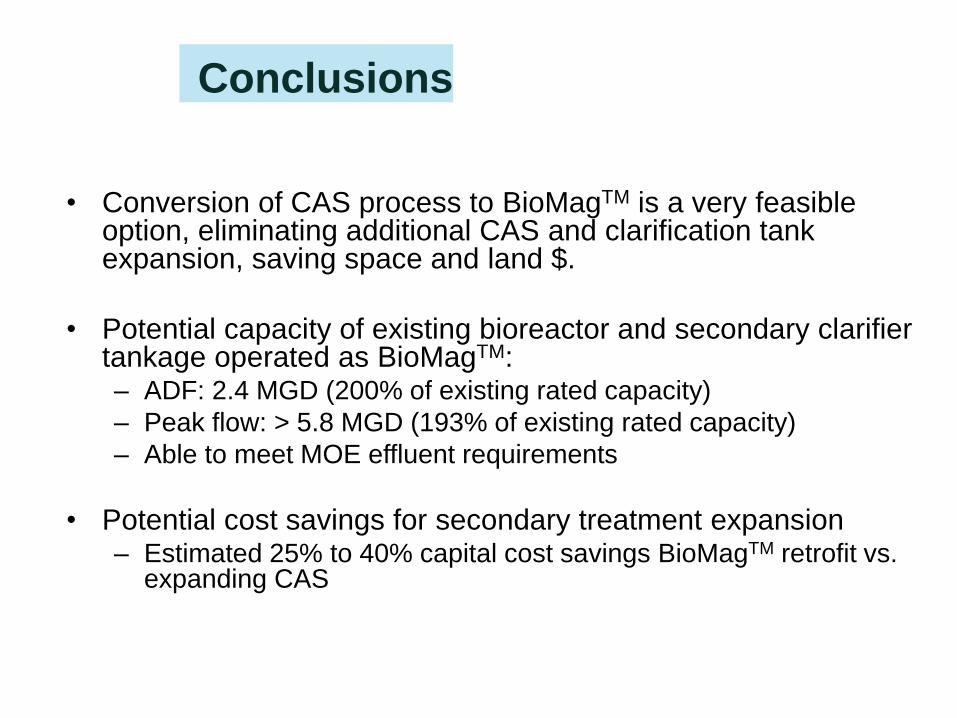
Conclusions
• Conversion of CAS process to BioMagTM is a very feasible option, eliminating additional CAS and clarification tank expansion, saving space and land $.
• Potential capacity of existing bioreactor and secondary clarifier tankage operated as BioMagTM: – ADF: 2.4 MGD (200% of existing rated capacity)
– Peak flow: > 5.8 MGD (193% of existing rated capacity)
– Able to meet MOE effluent requirements
• Potential cost savings for secondary treatment expansion – Estimated 25% to 40% capital cost savings BioMagTM retrofit vs.
expanding CAS
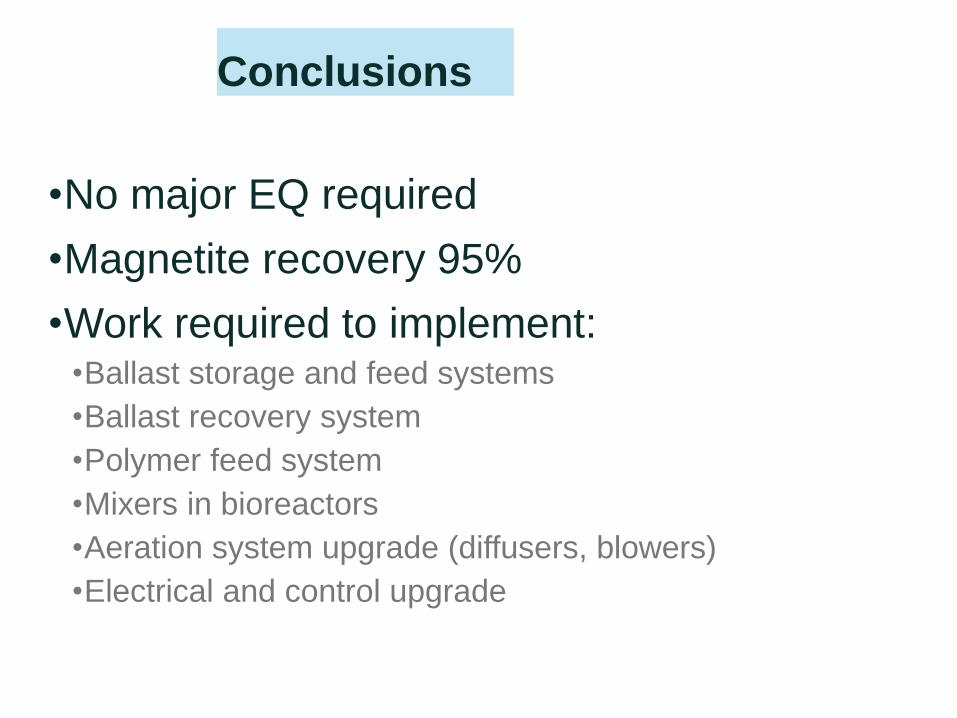
Conclusions
•No major EQ required
•Magnetite recovery 95%
•Work required to implement: •Ballast storage and feed systems
•Ballast recovery system
•Polymer feed system
•Mixers in bioreactors
•Aeration system upgrade (diffusers, blowers)
•Electrical and control upgrade
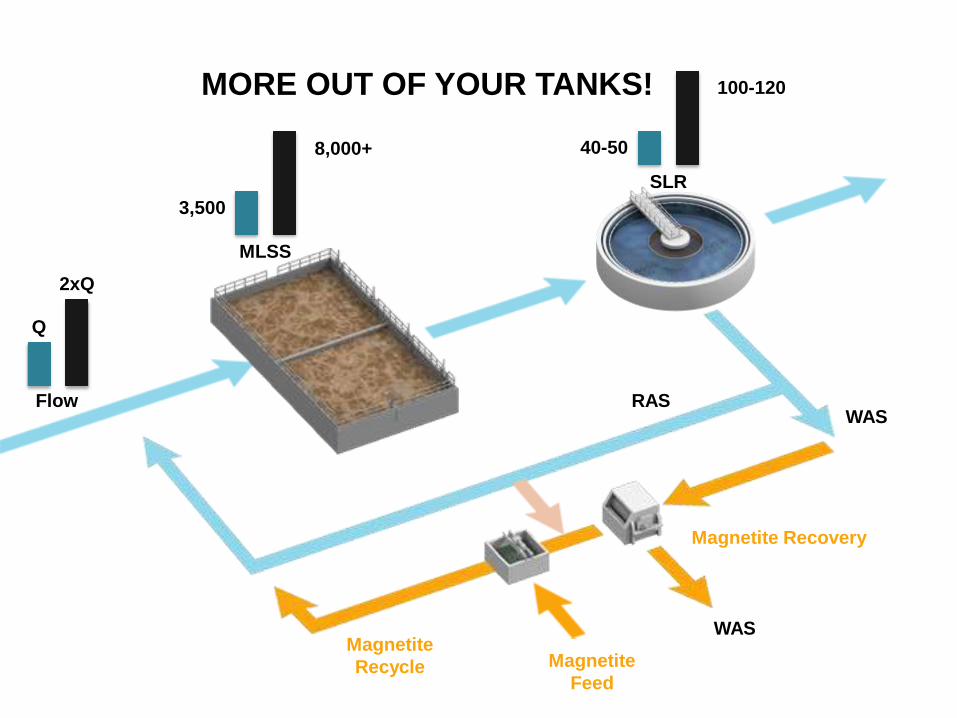
Flow RAS
WAS
Magnetite Recovery
Magnetite
Recycle Magnetite
Feed
WAS
MORE OUT OF YOUR TANKS!
MLSS
8,000+
SLR
100-120
3,500
40-50
Q
2xQ
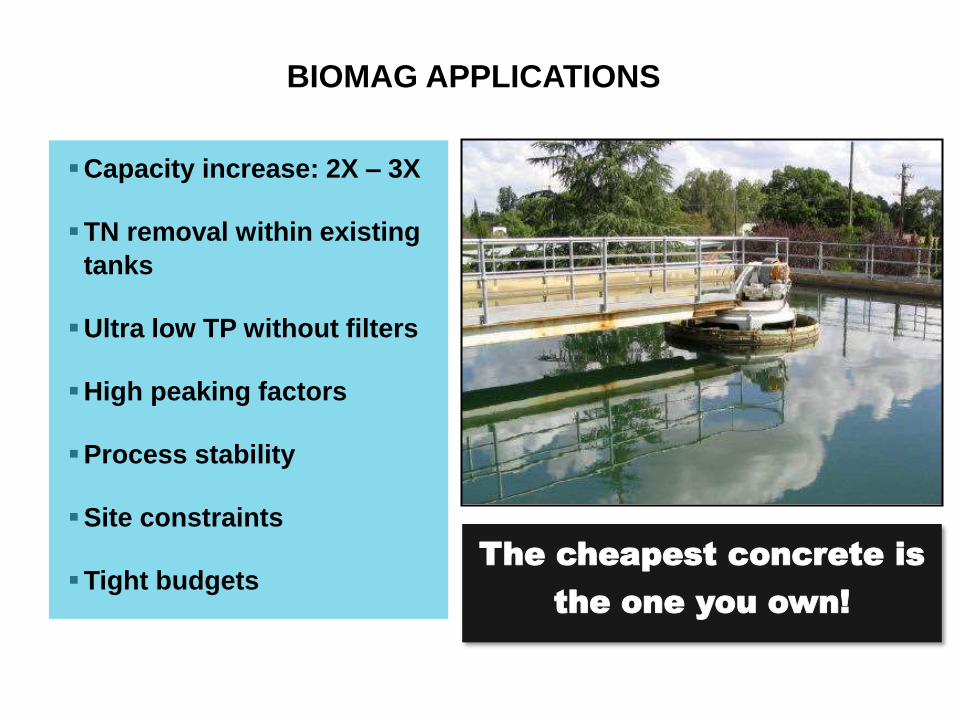
BIOMAG APPLICATIONS
Capacity increase: 2X – 3X
TN removal within existing
tanks
Ultra low TP without filters
High peaking factors
Process stability
Site constraints
Tight budgets The cheapest concrete is
the one you own!
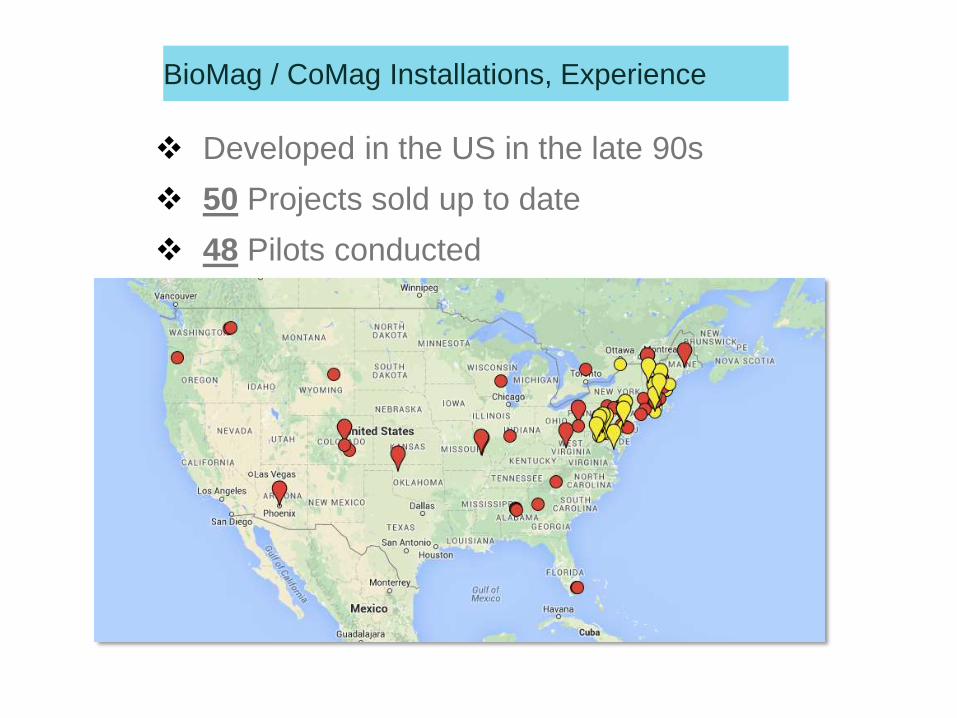
BioMag / CoMag Installations, Experience
Developed in the US in the late 90s
50 Projects sold up to date
48 Pilots conducted

THANK YOU FOR YOUR ATTENTION
John Irwin
Technical Sales Manager
Evoqua Water Technologies
copyright © 2014 Evoqua Water Technologies LLC, all rights reserved