Embed Size (px)
Citation preview

Research ArticleComparison of Relative Waist Circumference betweenAsian Indian and US Adults
Harpreet S. Bajaj,1 Mark A. Pereira,2 Rajit Mohan Anjana,3 Raj Deepa,3
Viswanathan Mohan,3 Noel T. Mueller,4 Gundu H. R. Rao,5 and Myron D. Gross5
1 STOP Diabetes Foundation, Inc., Brampton, ON, Canada L6S 0C92Division of Epidemiology & Community Health, University of Minnesota, 1300 South Second Street,Suite 300, Minneapolis, MN 55454, USA
3Madras Diabetes Research Foundation and Dr. Mohan’s Diabetes Specialties Centre, Chennai, Tamil Nadu 600 086, India4Columbia University, New York, NY 10032, USA5University of Minnesota, Minneapolis, MN 55454, USA
Correspondence should be addressed to Mark A. Pereira; [email protected]
Received 27 February 2014; Revised 29 May 2014; Accepted 15 June 2014; Published 21 September 2014
Academic Editor: B. J. Ammori
Copyright © 2014 Harpreet S. Bajaj et al. This is an open access article distributed under the Creative Commons AttributionLicense, which permits unrestricted use, distribution, and reproduction in any medium, provided the original work is properlycited.
Background. Relative to Europeans, Asian Indians have higher rates of type 2 diabetes and cardiovascular disease. Whetherdifferences in body composition may underlie these population differences remains unclear. Methods. We compared directlymeasured anthropometric data from the Chennai Urban Rural Epidemiology Study (CURES) survey of southern Indians (I) withthose from three US ethnic groups (C: Caucasians, A: African Americans, and M: Mexican Americans) from NHANES III (ThirdNational Health and Nutrition Examination Survey). A total of 15,733 subjects from CURES and 5,975 from NHANES III metinclusion criteria (age 20–39, no known diabetes). Results. Asian Indian men and women had substantially lower body mass index,waist circumference, hip circumference, waist-to-hip ratio, and body surface area relative to US groups (𝑃 values <0.0001). Incontrast, the mean (±se) waist-weight ratio was significantly higher (𝑃 < 0.001) in I (men 1.35 ± 0.002 and women 1.45 ± 0.002)than in all the US groups (1.09, 1.21, and 1.14 in A, M, and Cmen; 1.23, 1.33, and 1.26 in A, M, and C women (se ranged from 0.005 to0.006)). Conclusions. Compared to the US, the waist-weight ratio is significantly higher in men and women from Chennai, India.These results support the hypothesis that Southeast Asian Indians are particularly predisposed toward central adiposity.
1. Introduction
The number of people with type 2 diabetes in India is highestin the world and is predicted to increase 150% by year 2025,when the projected 69.9 million cases will comprise almosta quarter of the world’s diabetic population [1]. The AsianIndian (AI) phenotype, which refers to certain unique clinicaland biochemical characteristics such as greater abdominalobesity despite lower body mass index, has been well docu-mented and shown to make AI more prone to diabetes [2–14]and coronary artery disease [15–19] than Caucasians (C) ofEuropean ancestry.
The World Health Organization has addressed this para-dox of low obesity and high chronic disease risk in Asian
populations by setting lower thresholds of BMI to identifythose who may be at high risk [20]. However, some havesuggested that BMI has a relatively weak association withchronic disease prevalence [21, 22] and with visceral abdom-inal fat [23] in AI. As alternative measures, studies in variouspopulations, including AI [9, 22–24], US [25], and elsewhere[26], suggest that either waist circumference (WC) alone [23,25] or waist-hip ratio (WHR) [9, 22, 24, 26] may be a bettersingle anthropometric marker of chronic disease risk, ascompared to BMI, because they may more specifically reflectabdominal body fatness. However, WC alone does not reflectlean body mass, which is known to be protective [27], andfails to allow comparisons between subjects and populationsdue to confounding by body size and weight. Evidence that
Hindawi Publishing CorporationJournal of ObesityVolume 2014, Article ID 461956, 10 pageshttp://dx.doi.org/10.1155/2014/461956
2 Journal of Obesity
high WHR may contribute to the high incidence of diabetesin AI is equivocal [19, 28–30].
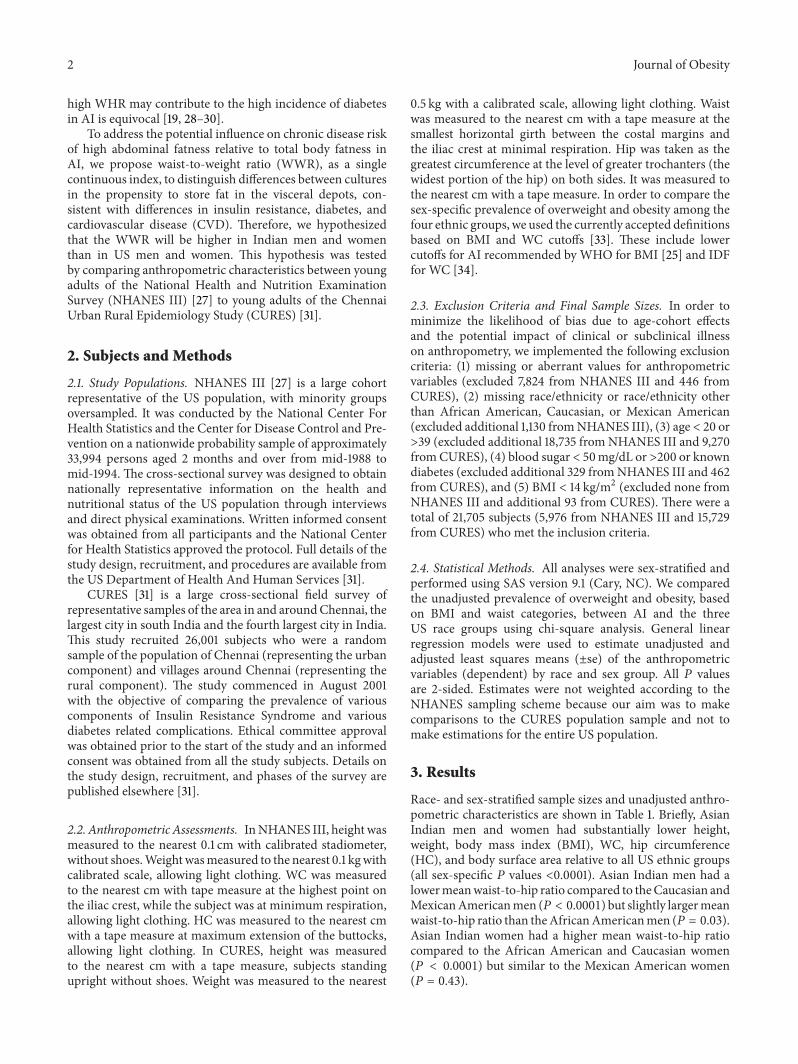
To address the potential influence on chronic disease riskof high abdominal fatness relative to total body fatness inAI, we propose waist-to-weight ratio (WWR), as a singlecontinuous index, to distinguish differences between culturesin the propensity to store fat in the visceral depots, con-sistent with differences in insulin resistance, diabetes, andcardiovascular disease (CVD). Therefore, we hypothesizedthat the WWR will be higher in Indian men and womenthan in US men and women. This hypothesis was testedby comparing anthropometric characteristics between youngadults of the National Health and Nutrition ExaminationSurvey (NHANES III) [27] to young adults of the ChennaiUrban Rural Epidemiology Study (CURES) [31].
2. Subjects and Methods
2.1. Study Populations. NHANES III [27] is a large cohortrepresentative of the US population, with minority groupsoversampled. It was conducted by the National Center ForHealth Statistics and the Center for Disease Control and Pre-vention on a nationwide probability sample of approximately33,994 persons aged 2 months and over from mid-1988 tomid-1994. The cross-sectional survey was designed to obtainnationally representative information on the health andnutritional status of the US population through interviewsand direct physical examinations. Written informed consentwas obtained from all participants and the National Centerfor Health Statistics approved the protocol. Full details of thestudy design, recruitment, and procedures are available fromthe US Department of Health And Human Services [31].
CURES [31] is a large cross-sectional field survey ofrepresentative samples of the area in and aroundChennai, thelargest city in south India and the fourth largest city in India.This study recruited 26,001 subjects who were a randomsample of the population of Chennai (representing the urbancomponent) and villages around Chennai (representing therural component). The study commenced in August 2001with the objective of comparing the prevalence of variouscomponents of Insulin Resistance Syndrome and variousdiabetes related complications. Ethical committee approvalwas obtained prior to the start of the study and an informedconsent was obtained from all the study subjects. Details onthe study design, recruitment, and phases of the survey arepublished elsewhere [31].
2.2. Anthropometric Assessments. InNHANES III, height wasmeasured to the nearest 0.1 cm with calibrated stadiometer,without shoes.Weightwasmeasured to the nearest 0.1 kgwithcalibrated scale, allowing light clothing. WC was measuredto the nearest cm with tape measure at the highest point onthe iliac crest, while the subject was at minimum respiration,allowing light clothing. HC was measured to the nearest cmwith a tape measure at maximum extension of the buttocks,allowing light clothing. In CURES, height was measuredto the nearest cm with a tape measure, subjects standingupright without shoes. Weight was measured to the nearest
0.5 kg with a calibrated scale, allowing light clothing. Waistwas measured to the nearest cm with a tape measure at thesmallest horizontal girth between the costal margins andthe iliac crest at minimal respiration. Hip was taken as thegreatest circumference at the level of greater trochanters (thewidest portion of the hip) on both sides. It was measured tothe nearest cm with a tape measure. In order to compare thesex-specific prevalence of overweight and obesity among thefour ethnic groups, we used the currently accepted definitionsbased on BMI and WC cutoffs [33]. These include lowercutoffs for AI recommended by WHO for BMI [25] and IDFfor WC [34].
2.3. Exclusion Criteria and Final Sample Sizes. In order tominimize the likelihood of bias due to age-cohort effectsand the potential impact of clinical or subclinical illnesson anthropometry, we implemented the following exclusioncriteria: (1) missing or aberrant values for anthropometricvariables (excluded 7,824 from NHANES III and 446 fromCURES), (2) missing race/ethnicity or race/ethnicity otherthan African American, Caucasian, or Mexican American(excluded additional 1,130 fromNHANES III), (3) age < 20 or>39 (excluded additional 18,735 from NHANES III and 9,270fromCURES), (4) blood sugar < 50mg/dL or >200 or knowndiabetes (excluded additional 329 fromNHANES III and 462from CURES), and (5) BMI < 14 kg/m2 (excluded none fromNHANES III and additional 93 from CURES). There were atotal of 21,705 subjects (5,976 from NHANES III and 15,729from CURES) who met the inclusion criteria.
2.4. Statistical Methods. All analyses were sex-stratified andperformed using SAS version 9.1 (Cary, NC). We comparedthe unadjusted prevalence of overweight and obesity, basedon BMI and waist categories, between AI and the threeUS race groups using chi-square analysis. General linearregression models were used to estimate unadjusted andadjusted least squares means (±se) of the anthropometricvariables (dependent) by race and sex group. All 𝑃 valuesare 2-sided. Estimates were not weighted according to theNHANES sampling scheme because our aim was to makecomparisons to the CURES population sample and not tomake estimations for the entire US population.
3. Results
Race- and sex-stratified sample sizes and unadjusted anthro-pometric characteristics are shown in Table 1. Briefly, AsianIndian men and women had substantially lower height,weight, body mass index (BMI), WC, hip circumference(HC), and body surface area relative to all US ethnic groups(all sex-specific 𝑃 values <0.0001). Asian Indian men had alowermeanwaist-to-hip ratio compared to theCaucasian andMexicanAmericanmen (𝑃 < 0.0001) but slightly largermeanwaist-to-hip ratio than theAfricanAmericanmen (𝑃 = 0.03).Asian Indian women had a higher mean waist-to-hip ratiocompared to the African American and Caucasian women(𝑃 < 0.0001) but similar to the Mexican American women(𝑃 = 0.43).

Journal of Obesity 3
Table1:Mean(sd)
anthropo
metric
varia
bles
bypo
pulatio
n.
Male
Female
African
American
Mexican
American
Caucasian
AsianIndian
African
American
Mexican
American
Caucasia
nAsia
nIndian
𝑁884
1043
799
7577
1131
1098
1021
8152
Height(cm
)176.9(7.13)
170.0(6.51)
177.5
(6.68)
164.7(7.63)
163.6(6.42)
157.4
(6.10
)164.0(6.51)
156.3(7.05)
Weight(kg)
82.5(19
.12)
75.4(13.91)
81.3(16.64
)59.2(10.29)
74.5(19
.68)
67.3(16.01)
67.3(16.97)
54.7(10.18)
BMI(kg/m
2 )26.3(5.56)
26.0(4.30)
25.7(4.70)
21.8(3.80)
27.8(7.04)
27.1(6.15
)25.0(6.08)
22.4(4.45)
Waist(cm)
88.7(14
.54)
90.2(11.17)
91.7(12.71)
78.5(10.10)
89.3(16.20)
88.0(14
.29)
83.5(14
.86)
77.6(10.59)
Hip
(cm)
99.3(11.13)
96.4(7.84)
99.0(8.86)
87.8(9.74
)104.6(13.82)
101.3
(12.38)
100.5(12.61)
89.6(11.3
3)Waist/
hip
0.89
(0.07)
0.93
(0.06)
0.92
(0.06)
0.90
(0.07)
0.85
(0.08)
0.87
(0.07)
0.83
(0.08)
0.87
(0.08)
BSA[32]
2.00
(0.24)
1.88(0.19
)1.9
9(0.22)
1.64(0.16
)1.8
3(0.25)
1.70(0.21)
1.74(0.22)
1.53(0.15
)

4 Journal of Obesity
100
90
80
70
60
50
40
30
20
10
0
(%)
Afr
ican
Am
eric
an
Afr
ican
Am
eric
an
Mex
ican
Am
eric
an
Mex
ican
Am
eric
an
Cauc
asia
n
Cauc
asia
n
ObeseOverweight
Normal
Men Women
recommendations (Janssen et al, 2004) of23 and 27.5 kg/m to define overweight and obesity, respectively.WHO Expert committee
∗Appropriate index for Asian populations based on
Asia
n In
dian∗
Asia
n In
dian∗
Asia
n In
dian∗
Asia
n In
dian∗
2
Figure 1: BMI categories stratified by ethnicity and sex.
3.1. Ethnic Variations in BMI andWCCategories. Inmen andwomen alike, as shown in Figure 1 based on BMI criteria,the frequency of AI in the normal weight category (84.2%for men, 77.4% for women) was significantly greater, andthe frequency of overweight and obesity was lower, thanany other ethnic group (𝑃 < 0.0001 for all sex-stratifiedcomparisons). This remained true even after applying lowercutoffs for the Asians Indians as suggested by the WHOExpert Committee recommendations [25], except for thefrequency of overweight Asian Indian women which wassimilar to the African American women (𝑃 value = 0.69),slightly less than Mexican American women (𝑃 value =0.03) and significantly less than Caucasian women (𝑃 value<0.0001). In Figure 2, it is seen that the Asian Indianmen andwomen have lower central obesity meeting NCEP’s metabolicsyndrome cutoff values for WC than all other groups (𝑃 <0.0001). When applying the ethnicity driven IDF cutoffs, thedifferences between the AI and other groups were attenuatedbut remained statistically significant (𝑃 < 0.0001), even withthe lower cutoffs suggested for the Asian Indian men.
3.2. Correlations among Anthropometric Variables. Table 2(men) and Table 3 (women) include the unadjusted sex- andpopulation-specific Pearson correlations among the variousanthropometric variables. We pooled the US race groupswithin sex because the correlations did not vary in importantways among US race groups. The magnitudes of these corre-lations were all lower, without exception, in the AI comparedto the US, with most of the Asian-US differences being large.
For example, themagnitude of the correlations between waistand either body weight or BMI ranged from 0.56 to 0.63in Chennai men and women, compared to 0.90 to 0.93 inUS men and women. The scattergrams in Figure 3, shownformen, demonstrate the considerable population differencesin the association between waist and BMI between Chennaiand US Caucasian men. For any given BMI in AI there wasconsiderably more interindividual variation in the waist thanis observed in the US. Very similar results were observed forwomen and for the other US ethnic groups (data not shown).
Of note, age and height adjustment did not alter the corre-lations inmagnitude or direction in any considerablemanner(data not presented). In contrast, as presented in Tables 2and 3, weight adjustment altered correlations between hipand waist as well as between hip and WHR among the USpopulation. The strong correlations between hip and waistwere considerably attenuated by adjusting for weight in bothgenders in the US population, whereas this adjustment hadlittle effect in the Asian Indian population (Tables 2 and 3).Of particular note the different direction of the correlationbetween hips and WHR for AI (−0.12 for men, −0.23 forwomen)was compared toUS (0.40 formen, 0.26 for women).However, in the US the correlation between hips and WHRwas confounded by the high correlation between waist andweight. As such, further adjustment for weight reversed thedirection of this correlation in the US (−0.37 for men, −0.53for women). Weight adjustment marginally strengthened themagnitude of the correlation in the AI, but because thecorrelation between waist and weight is relatively low, thedirection of the association remained inversed (−0.29 inmen,−0.36 in women).
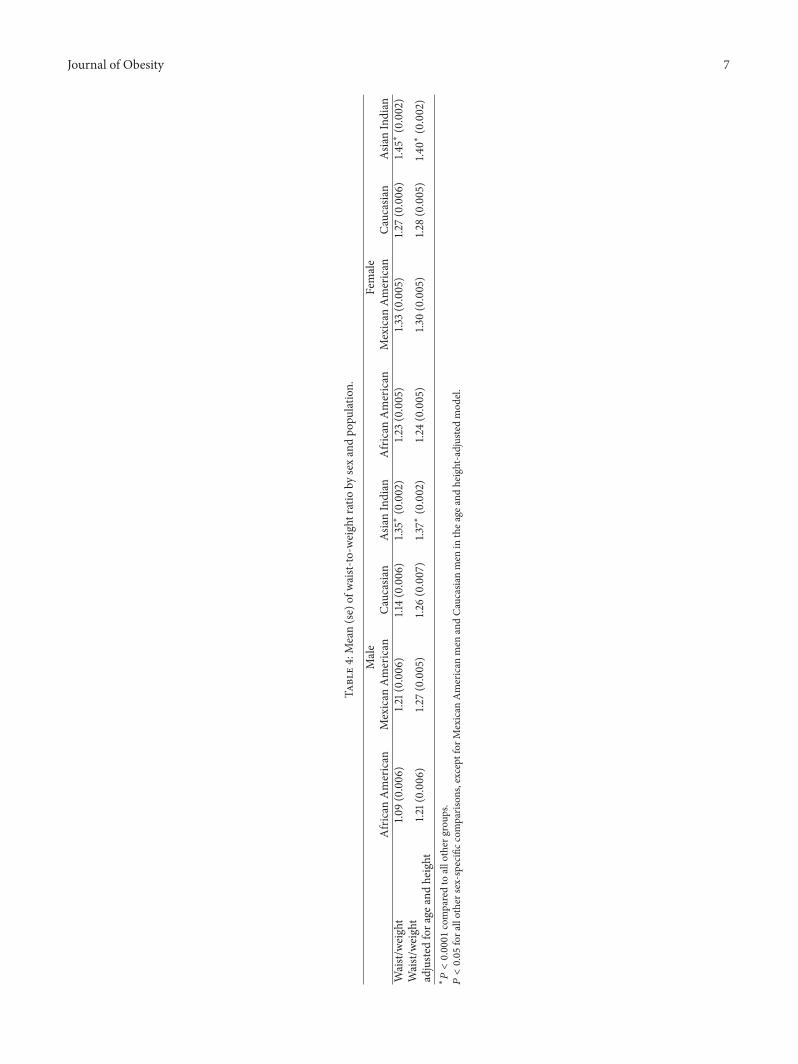
3.3. The Waist-to-Weight Ratio (WWR). To further evaluatepossible differences between populations in central adipositywhile taking into account differences in total body mass, wecomputed the WC to body weight ratio. The WWR followeda normal distribution for all sex and population groups.The median WWR was highest among men and womenfrom India and was in fact higher than the 75th percentileof all other groups. The means of WWR before and afteradjustment for height are shown in Table 4. As can be seen,WWRwas significantly higher (𝑃 < 0.0001) in the AI than inUS for both sexes. The attenuation of these differences by ageand height adjustment was minimal.
4. Discussion
The present study compares a number of traditional anthro-pometric factors between young adults of the US repre-sentative NHANES III survey, including three race/ethnicgroups, and the population-based CURES survey of AI.Our observations confirm the findings of others that theAI tend to be much smaller than the US population inall traditional anthropometric measurements—body weight,body height, BMI, body surface area, hips, and WC. Incontrast, we observed the WHR, which some studies havefound to be higher in AI than in other groups [22, 24, 26], tobe somewhat higher in AI women compared to US women,

Journal of Obesity 5
Table2:Pearsoncorrelations—men.
WAIST
HIP
WHR
WT
BMI
BSA
CURE
SNHANES
CURE
SNHANES
CURE
SNHANES
CURE
SNHANES
CURE
SNHANES
CURE
SNHANES
WAIST
0.72
0.18
0.42
0.84
0.60
0.90
−0.05
0.20
0.10
0.19
HIP
0.82
0.89
−0.29
−0.37
0.54
0.95
−0.01
0.20
0.05
0.20
WHR
0.45
0.77
−0.12
0.40
0.18
0.48
−0.06
0.09
0.09
0.15
WT
0.61
0.90
0.57
0.95
0.18
0.48
0.83
0.91
0.97
0.99
BMI
0.56
0.93
0.49
0.90
0.20
0.60
0.82
0.91
−0.03
0.36
BSA
0.57
0.84
0.54
0.92
0.16
0.41
0.97
0.98
0.66
0.82
HT
0.09
0.18
0.13
0.35
−0.03
−0.12
0.32
0.45
−0.26
0.05
0.53
0.61
Not
bold:unadjusted.
Bold:adjustedfora
ge,height,andweight.
WAIST:
waistcircum
ference;HIP:hip
circum
ference;WHR:
waist-
to-hip
ratio
;WT:
body
weight;BM
I:bo
dymassind
ex;B
SA:bod
ysurfa
cearea;H
T:height;C
URE
S:Ch
ennaiU
rban
RuralE
pidemiology
Stud
y;NHANES
:NationalH
ealth
andNutritionEx
aminationSurvey.

6 Journal of Obesity
Table3:Pearsoncorrelations—wom
en.
WAIST
HIP
WHR
WT
BMI
BSA
CURE
SNHANES
CURE
SNHANES
CURE
SNHANES
CURE
SNHANES
CURE
SNHANES
CURE
SNHANES
WAIST
0.65
−0.00
20.45
0.83
0.60
0.90
0.01
0.15
0.12
0.19
HIP
0.79
0.87
−0.36
−0.53
0.58
0.94
−0.02
0.23
0.07
0.10
WHR
0.40
0.69
−0.23
0.26
0.10
0.40
0.04
0.01
0.07
0.17
WT
0.63
0.90
0.62
0.94
0.09
0.40
0.86
0.94
0.97
0.99
BMI
0.57
0.92
0.60
0.93
0.04
0.46
0.86
0.94
−0.10
0.23
BSA
0.60
0.86
0.57
0.91
0.12
0.37
0.97
0.98
0.72
0.87
HT
0.06
0.07
−0.01
0.17
0.11
−0.11
0.20
0.29
−0.31
−0.05
0.42
0.44
Not
bold:unadjusted.
Bold:adjustedfora
ge,height,andweight.
WAIST:
waistcircum
ference;HIP:hip
circum
ference;WHR:
waist-
to-hip
ratio
;WT:
body
weight;BM
I:bo
dymassind
ex;B
SA:bod
ysurfa
cearea;H
T:height;C
URE
S:Ch
ennaiU
rban
RuralE
pidemiology
Stud
y;NHANES
:NationalH
ealth
andNutritionEx
aminationSurvey.
Journal of Obesity 7
Table4:Mean(se)of
waist-
to-w
eightratio
bysexandpo
pulation.
Male
Female
African
American
Mexican
American
Caucasian
AsianIndian
African
American
Mexican
American
Caucasia
nAsia
nIndian
Waist/
weight
1.09(0.006)
1.21(0.00
6)1.14(0.006)
1.35∗
(0.002)
1.23(0.005)
1.33(0.005)
1.27(0.006)
1.45∗
(0.002)
Waist/weight
1.21(0.00
6)1.2
7(0.005)
1.26(0.007)
1.37∗
(0.002)
1.24(0.005)
1.30(0.005)
1.28(0.005)
1.40∗
(0.002)
adjuste
dfora
geandheight
∗𝑃<0.0001comparedto
allother
grou
ps.
𝑃<0.05fora
llothersex-specific
comparis
ons,except
forM
exican
American
men
andCa
ucasianmen
inthea
geandheight-adjustedmod
el.

8 Journal of Obesity
70
60
50
40
30
20
10
0A
fric
an A
mer
ican
Afr
ican
Am
eric
an
Mex
ican
Am
eric
an
Mex
ican
Am
eric
an
Cauc
asia
n
Cauc
asia
n
Asia
n In
dian
Asia
n In
dian
Meet IDF MS criteria
Meet IDF MS criteria
Male central obesity
≥90 Asian Indians
Female central obesity
Meet ATP III MS criteria
Meet ATP III MS criteria
(%)
ATP III: ≥102 cmIDF: ≥94 cm non-Asians
ATP III: ≥88 cmIDF: ≥80 cm non-Asians
≥80 Asian Indians
Men Women
Figure 2: Waist categories stratified by ethnicity and sex.
200
180
160
140
120
100
80
60
40
20
00 10 20 30 40 50 10 20 30 40 50
y = 2.57x + 25.6
R2 = 0.8671
y = 1.46x + 46.3
R2 = 0.3045
Wai
st (c
m)
200
180
160
140
120
100
80
60
40
20
0
Wai
st (c
m)
BMI (kg/m2)BMI (kg/m2)
NHANES III CURES
Figure 3: Correlations of waist circumference and BMI in US Caucasian and Asian Indian men. The corresponding 𝑅2 value for women ofNHANES III was 0.85, in comparison to 0.31 for CURES women. The 𝑅2 across the other two NHANES III race/ethnic groups for men andwomen ranged from 0.81 to 0.88.
but not different, or in fact lower, among AI men comparedto USmen. In our analyses, the differences between means ofWHR, though significantly higher in AI women compared toCaucasian and African American women, were small.
It is possible, therefore, that if AI have a propensitytowards excess accumulation of visceral body fat, it is beingmasked, perhaps especially in themen, by large differences inoverall body size between populations. Based on the findings
of the present study, it appears that our novel measure-ment, WWR, is a simple anthropometric index capturingpopulation differences in propensity for intra-abdominal fatstorage. The WWR would appear to sufficiently account forthe large confounding influence of overall body size andgeneral adiposity. For any given bodyweight, largerWCcouldreflect larger intra-abdominal fat depots. Individuals withrelatively high body weights who tend to carry much of their

Journal of Obesity 9
weight in muscle and subcutaneous fat depots peripherallywould be expected to have lower WWR and lower risk fordiabetes andCVD, hypothetically. Based on our observations,the distribution of WWR in young adults from Chennai,India, is considerably shifted to the right in comparison tosimilarly aged adults from three race/ethnic groups of the USpopulation.
An intriguing observation from comparisons performedin present study was the vastly different correlation betweenWC and BMI between young adults of Chennai, India,compared to those from three US race/ethnic groups. In theUS over 80% of the variation (𝑟 = ∼0.9) in WC is explainedby BMI, whereas in Chennai, India, these two parametersshared less than 40% common variance (𝑟 = ∼0.60). Thisobservation helps us to understand the basis for the higherWWR in Chennai than in US. At any given BMI there isclearly much more variation in the WC of Asian Indianyoung adults than in US young adults. Indeed, the varianceof WWR in the Chennai men and women was threefoldhigher than that of the USmen andwomen (0.03 versus 0.01).This observation suggests that AI may have a heightenedpropensity for accumulating central adiposity, for any givenbody size, than other populations.
A strength of the WWR is that it retains simplicity inmeasurement and calculation, making it desirable overWHRand BMI in this regard, and allows comparisons betweenpeople and populations varying in overall body size, makingit more useful than theWC alone. A possible limitation of theWWR is that it does not consider height. To look further intothe usefulness of height, we did compute (data not presented)a waist-to-BMI ratio (WBR).This ratio differentiated the twopopulations on an ecological level in a similar manner as didthe WWR. Using such ratio did not seem to provide anyadded benefit to the WWR, while it may be fraught with anumber of conceptual and statistical problems discussed byothers [35, 36]. Another conceivable limitation of the WWRis that the denominator (weight) is highly correlated with thenumerator in many populations (see Tables 2 and 3).
Strengths of the present study are multiple. It is apopulation-based and a large-scale study of AI who havea high risk of diabetes; the study compares them with thethree main ethnic groups of the US NHANES population.The high quality standardization of anthropometric mea-surements in both cohorts minimizes measurement errorsand biases. Despite several practical advantages of ecologicstudies, including low cost, there exist severalmethodologicallimitations to any ecological study in its ability tomake causalinferences [32]. Ecological studies often suffer from biases(ecological fallacy or aggregation bias), which represents thefailure of expected ecological effect estimates to reflect theeffect at the individual level. A potential strategy suggestedfor minimizing ecological bias is to use smaller units in orderto make the groups more homogeneous with respect to theexposure [32]. For this reason, we included only nondiabeticyoung adults who were not underweight, which also helpsto minimize the effects of temporal ambiguity (presenceof disease effecting body habitus) and different cohorteffects between populations. Possible limitations of this studyoriginating from the somewhat different anthropometric
measurement standards were described in the methods sec-tion. Given that these differences were small, we believe thatthe results are not materially biased by misclassification dueto such measurement differences. The fact that the CURESsurvey was conducted in and around the southern Indian cityof Chennai begs the question of whether these results can begeneralized to the whole Asian Indian population.
We believe that our findings in this study are provocativeand should stimulate further research into novel anthropo-metric features that may differentiate populations at veryhigh risk for chronic disease, despite relatively low adiposity.The findings should motivate future coordinated research oncomplex exposures, their social and behavioral determinants,and possible interventions. Certainly, the WWR should bevalidated using more precise clinical methods of measuringfat depots, including DEXA and CT scan. The WWR shouldbe investigated in other studies in order to address possibleinfluences of age, ethnicity, gender and nutritional status, andits relation to chronic diseases and mortality.
Conflict of Interests
The authors declare that there is no conflict of interestsregarding the publication of this paper.
References
[1] R. Sicree, J. Shaw, and P. Zimmet, “Diabetes and impairedglucose tolerance,” in Diabetes Atlas, D. Gan, Ed., pp. 15–103, International Diabetes Federation, Brussels, Belgium, 3rdedition, 2006.
[2] N. Abate and M. Chandalia, “Ethnicity and type 2 diabetes:focus on Asian Indians,” Journal of Diabetes and Its Complica-tions, vol. 15, no. 6, pp. 320–327, 2001.
[3] S. R. Joshi, “Metabolic syndrome—emerging clusters of theIndian phenotype,” Journal of Association of Physicians of India,vol. 51, pp. 445–446, 2003.
[4] R. Deepa, S. Sandeep, and V. Mohan, “Abdominal obesity,visceral fat and type 2 diabetes—“Asian Indian phenotype”,” inType 2 Diabetes in South Asians: Epidemiology, Risk Factors andPrevention, V.Mohan andG.H. R. Rao, Eds., pp. 138–152, JaypeeBrothers Medical, New Delhi, India, 2006.
[5] A. Ramachandran, C. Snehalatha, V. Viswanathan, M.Viswanathan, and S.M. Haffner, “Risk of noninsulin dependentdiabetes mellitus conferred by obesity and central adiposity indifferent ethnic groups: a comparative analysis between AsianIndians, Mexican Americans and Whites,” Diabetes Researchand Clinical Practice, vol. 36, no. 2, pp. 121–125, 1997.
[6] A. Raji, E. W. Seely, R. A. Arky, and D. C. Simonson, “Body fatdistribution and insulin resistance in healthy Asian Indians andCaucasians,” Journal of Clinical Endocrinology and Metabolism,vol. 86, no. 11, pp. 5366–5371, 2001.
[7] M. Chandalia, N. Abate, A. Garg, J. Stray-Gundersen, and S.M. Grundy, “Relationship between generalized and upper bodyobesity to insulin resistance in Asian Indian men,” Journal ofClinical Endocrinology and Metabolism, vol. 84, no. 7, pp. 2329–2335, 1999.
[8] P. M. McKeigue, B. Shah, and M. G. Marmot, “Relationof central obesity and insulin resistance with high diabetes

10 Journal of Obesity
prevalence and cardiovascular risk in SouthAsians,”TheLancet,vol. 337, no. 8738, pp. 382–386, 1991.
[9] P. M. McKeigue, T. Pierpoint, J. E. Ferrie, and M. G. Marmot,“Relationship of glucose intolerance and hyperinsulinaemia tobody fat pattern in South Asians and Europeans,” Diabetologia,vol. 35, no. 8, pp. 785–791, 1992.
[10] H. M. Mather and H. Keen, “The Southall Diabetes Survey:prevalence of known diabetes in Asians and Europeans,” BritishMedical Journal, vol. 291, no. 6502, pp. 1081–1084, 1985.
[11] Q. Qiao, G. Hu, J. Tuomilehto et al., “Age- and sex-specificprevalence of diabetes and impaired glucose regulation in 11Asian cohorts,”Diabetes Care, vol. 26, no. 6, pp. 1770–1780, 2003.
[12] A. Ramachandran, C. Snehalatha, D. Dharmaraj, and M.Viswanathan, “Prevalence of glucose intolerance in Asian Indi-ans: urban-rural difference and significance of upper bodyadiposity,” Diabetes Care, vol. 15, no. 10, pp. 1348–1355, 1992.
[13] A. Ramachandran, M. V. Jali, V. Mohan, C. Snehalatha, andM. Viswanathan, “High prevalence of diabetes in an urbanpopulation in South India,” British Medical Journal, vol. 297, no.6648, pp. 587–590, 1988.
[14] A. Ramachandran, C. Snehalatha, E. Latha, V. Vijay, andM. Viswanathan, “Rising prevalence of NIDDM in an urbanpopulation in India,” Diabetologia, vol. 40, no. 2, pp. 232–237,1997.
[15] K. Hughes, “Mortality from cardiovascular diseases in Chinese,Malays and Indians in Singapore, in comparison with EnglandandWales, USA and Japan,” Annals of the Academy of MedicineSingapore, vol. 18, no. 6, pp. 642–645, 1989.
[16] P. M. McKeigue, G. J. Miller, and M. G. Marmot, “Coronaryheart disease in South Asians overseas: a review,” Journal ofClinical Epidemiology, vol. 42, no. 7, pp. 597–609, 1989.
[17] S. S. Anand, S. Yusuf, V. Vuksan et al., “Differences in riskfactors, atherosclerosis, and cardiovascular disease betweenethnic groups in Canada: the Study of Health Assessment andRisk in Ethnic groups (SHARE),”The Lancet, vol. 356, no. 9226,pp. 279–284, 2000.
[18] J. Lee, D. Heng, K. S. Chia, S. K. Chew, B. Y. Tan, and K. Hughes,“Risk factors and incident coronary heart disease in Chinese,Malay and Asian Indian males: the Singapore cardiovascularcohort study,” International Journal of Epidemiology, vol. 30, no.5, pp. 983–988, 2001.
[19] A. Laws, J. L. Jeppesen, P. C. Maheux, P. Schaaf, Y.-D. Chen,and G. M. Reaven, “Resistance to insulin-stimulated glucoseuptake and dyslipidemia in Asian Indians,” Arteriosclerosis andThrombosis, vol. 14, no. 6, pp. 917–922, 1994.
[20] WHO Expert Consultation, “Appropriate body-mass index forAsian populations and its implications for policy and interven-tion strategies,”The Lancet, vol. 363, no. 9412, pp. 157–163, 2004.
[21] A. Ramachandran, C. Snehalatha, and V. Vijay, “Temporalchanges in prevalence of type 2 diabetes and impaired glucosetolerance in urban southern India,” Diabetes Research andClinical Practice, vol. 58, no. 1, pp. 55–60, 2002.
[22] F. Razak, S. Anand, V. Vuksan et al., “Ethnic differencesin the relationships between obesity and glucose-metabolicabnormalities: a cross-sectional population-based study,” Inter-national Journal of Obesity, vol. 29, no. 6, pp. 656–667, 2005.
[23] M. Anjana, S. Sandeep, R. Deepa, K. S. Vimaleswaran, S.Farooq, and V. Mohan, “Visceral and central abdominal fatand anthropometry in relation to diabetes in Asian Indians,”Diabetes Care, vol. 27, no. 12, pp. 2948–2953, 2004.
[24] K. M. Shelgikar, T. D. R. Hockaday, and C. S. Yajnik, “Centralrather than generalized obesity is related to hyperglycaemia inAsian Indian subjects,” Diabetic Medicine, vol. 8, no. 8, pp. 712–717, 1991.
[25] I. Janssen, P. T. Katzmarzyk, and R. Ross, “Waist circumferenceand not body mass index explains obesity-related health risk,”The American Journal of Clinical Nutrition, vol. 79, no. 3, pp.379–384, 2004.
[26] P. S. Yusuf, S. Hawken, S. Ounpuu et al., “Effect of potentiallymodifiable risk factors associated with myocardial infarctionin 52 countries (the INTERHEART study): case-control study,”The Lancet, vol. 364, no. 9438, pp. 937–952, 2004.
[27] US Department of Health and Human Services and NationalCenter for Health Statistics,NHANES III Refernce Manuals andReports (CD-ROM), Center forDisease Control and Prevention,Hyattsville, Md, USA, 1996.
[28] R. Hakeem, J.Thomas, and S. H. Badruddin, “Urbanisation andcoronary heart disease risk factors in South Asian children,”Journal of the PakistanMedical Association, vol. 51, no. 1, pp. 22–28, 2001.
[29] A. Misra, D. Athiko, R. Sharma, R. M. Pandey, and N. Khanna,“Non-obese hyperlipidemic Asian northern Indian males haveadverse anthropometric profile,” Nutrition, Metabolism andCardiovascular Diseases, vol. 12, no. 4, pp. 178–183, 2002.
[30] A. M. Hodge, G. K. Dowse, V. R. Collins et al., “Abdominalfat distribution and insulin levels only partially explain adversecardiovascular risk profile in Asian Indians,” Journal of Cardio-vascular Risk, vol. 3, no. 3, pp. 263–270, 1996.
[31] M. Deepa, R. Pradeepa, M. Rema et al., “The ChennaiUrban Rural Epidemiology Study (CURES)—Study designand methodology (Urban Component) (CURES-1),” Journal ofAssociation of Physicians of India, vol. 51, pp. 863–870, 2003.
[32] H. Morgenstern, “Ecologic studies in epidemiology: concepts,principles, and methods,” Annual Review of Public Health, vol.16, pp. 61–81, 1995.
[33] “Third report of the National Cholesterol Education Program(NCEP) Expert Panel on detection, evaluation, and treatmentof high blood cholesterol in adults (Adult Treatment Panel III),”Circulation, vol. 106, no. 25, pp. 3143–3421, 2002.
[34] “The IDF consensus worldwide definition of the metabolicsyndrome,” International Diabetes Federation Avenue EmileDe Mot 19 B-1000 Brussels, Belgium, 2006, http://www.idf.org/webdata/docs/IDF Meta def final.pdf.
[35] W. D. Ross, S. M. Crawford, D. A. Kerr, R. Ward, D. A. Bailey,and R. M. Mirwald, “Relationship of the body mass indexwith skinfolds, girths, and bone breadths in Canadian menand women aged 20–70 years,” American Journal of PhysicalAnthropology, vol. 77, no. 2, pp. 169–173, 1988.
[36] W. D. Ross, “On combining samples that differ allometricallywith size,” Revista Brasileira de Medicina do Esporte, vol. 3, no.4, pp. 95–100, 1997.

Submit your manuscripts athttp://www.hindawi.com
Stem CellsInternational
Hindawi Publishing Corporationhttp://www.hindawi.com Volume 2014
Hindawi Publishing Corporationhttp://www.hindawi.com Volume 2014
MEDIATORSINFLAMMATION
of
Hindawi Publishing Corporationhttp://www.hindawi.com Volume 2014
Behavioural Neurology
EndocrinologyInternational Journal of
Hindawi Publishing Corporationhttp://www.hindawi.com Volume 2014
Hindawi Publishing Corporationhttp://www.hindawi.com Volume 2014
Disease Markers
Hindawi Publishing Corporationhttp://www.hindawi.com Volume 2014
BioMed Research International
OncologyJournal of
Hindawi Publishing Corporationhttp://www.hindawi.com Volume 2014
Hindawi Publishing Corporationhttp://www.hindawi.com Volume 2014
Oxidative Medicine and Cellular Longevity
Hindawi Publishing Corporationhttp://www.hindawi.com Volume 2014
PPAR Research
The Scientific World JournalHindawi Publishing Corporation http://www.hindawi.com Volume 2014
Immunology ResearchHindawi Publishing Corporationhttp://www.hindawi.com Volume 2014
Journal of
ObesityJournal of
Hindawi Publishing Corporationhttp://www.hindawi.com Volume 2014
Hindawi Publishing Corporationhttp://www.hindawi.com Volume 2014
Computational and Mathematical Methods in Medicine
OphthalmologyJournal of
Hindawi Publishing Corporationhttp://www.hindawi.com Volume 2014
Diabetes ResearchJournal of
Hindawi Publishing Corporationhttp://www.hindawi.com Volume 2014
Hindawi Publishing Corporationhttp://www.hindawi.com Volume 2014
Research and TreatmentAIDS
Hindawi Publishing Corporationhttp://www.hindawi.com Volume 2014
Gastroenterology Research and Practice
Hindawi Publishing Corporationhttp://www.hindawi.com Volume 2014
Parkinson’s Disease
Evidence-Based Complementary and Alternative Medicine
Volume 2014Hindawi Publishing Corporationhttp://www.hindawi.com