Embed Size (px)
DESCRIPTION
Body mass index and waist circumference as predictors of mortality among older Singaporeans. Authors : Angelique Chan, Chetna Malhotra, Rahul Malhotra, Truls Ostbye Department: Program in Health Services and Systems Research. Background. - PowerPoint PPT Presentation
Citation preview
Body mass index and waist circumference as predictors of mortality among older Singaporeans
Authors: Angelique Chan, Chetna Malhotra, Rahul Malhotra, Truls Ostbye
Department: Program in Health Services and Systems Research
Background
• High body-mass index (BMI) and waist circumference linked to mortality
• Most studies conducted in younger populations• Relationship between BMI and mortality in
elderly is inconsistent. 1-4
1 Troiano RP et al. The relationship between body weight and mortality: a quantitative analysis of combined information from existing studies. Int J Obes 1996; 20:63-75.
2 Allison et al. Body mass index and all-cause mortality among people age 70 and over: the Longitudinal Study of Aging. Int J Obesity 1997; 21 (6):424-431.
3 Rajala et al. Body weight and the three year prognosis in very old people. Int J Obes 1990; 14: 997-1003.
4 Losonczy KG et al. Does weight loss from middle age to old age explain the inverse weight mortality relation in old age? Am J Epidemiology 1995; 141: 312-321.
Objective
• To assess the relationship of BMI and waist-circumference with all-cause mortality among older Singaporeans
Methods: Panel on Health and Aging of Singaporean elderly (PHASE)
• Wave 1: Conducted in January-July 2009. • Interviews with 5000 elderly >60 years
• Wave 2: July 2011-• Information on mortality
• Current analysis limited to 3860 individuals whose survival status was known
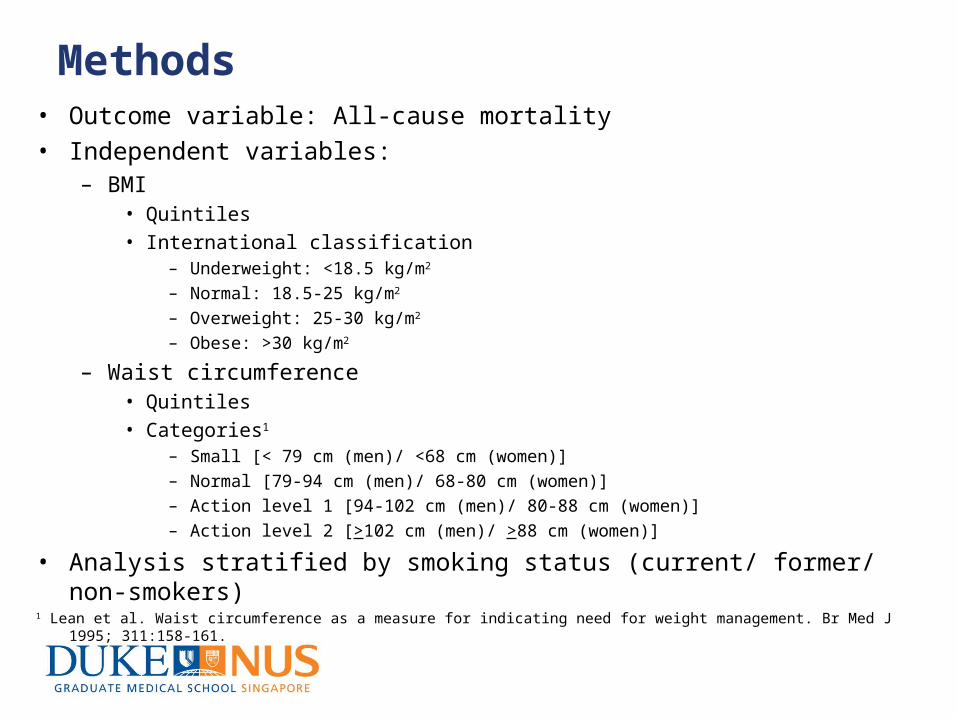
Methods• Outcome variable: All-cause mortality• Independent variables:
– BMI• Quintiles• International classification
– Underweight: <18.5 kg/m2
– Normal: 18.5-25 kg/m2
– Overweight: 25-30 kg/m2
– Obese: >30 kg/m2
– Waist circumference• Quintiles• Categories1
– Small [< 79 cm (men)/ <68 cm (women)]
– Normal [79-94 cm (men)/ 68-80 cm (women)]
– Action level 1 [94-102 cm (men)/ 80-88 cm (women)]
– Action level 2 [>102 cm (men)/ >88 cm (women)]
• Analysis stratified by smoking status (current/ former/ non-smokers)1 Lean et al. Waist circumference as a measure for indicating need for weight management. Br Med J 1995; 311:158-161.
Statistical analysis
• Logistic regression predicting all-cause mortality for quintiles and standard classifications for BMI and waist circumference
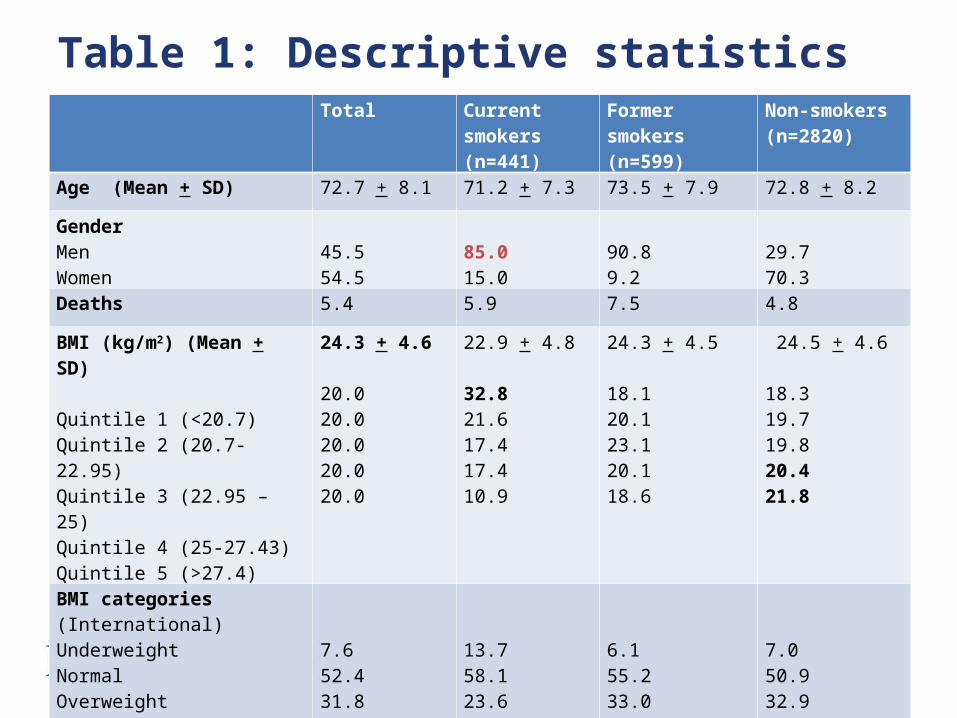
Table 1: Descriptive statistics Total Current
smokers(n=441)
Former smokers(n=599)
Non-smokers(n=2820)
Age (Mean + SD) 72.7 + 8.1 71.2 + 7.3 73.5 + 7.9 72.8 + 8.2GenderMenWomen
45.554.5
85.015.0
90.89.2
29.770.3
Deaths 5.4 5.9 7.5 4.8BMI (kg/m2) (Mean + SD)
Quintile 1 (<20.7)Quintile 2 (20.7-22.95)Quintile 3 (22.95 – 25)Quintile 4 (25-27.43)Quintile 5 (>27.4)
24.3 + 4.6
20.020.020.020.020.0
22.9 + 4.8
32.821.617.417.410.9
24.3 + 4.5
18.120.123.120.118.6
24.5 + 4.6
18.319.719.820.421.8
BMI categories (International)UnderweightNormalOverweightObese
7.652.431.88.2
13.758.123.64.7
6.155.233.05.7
7.050.932.99.3
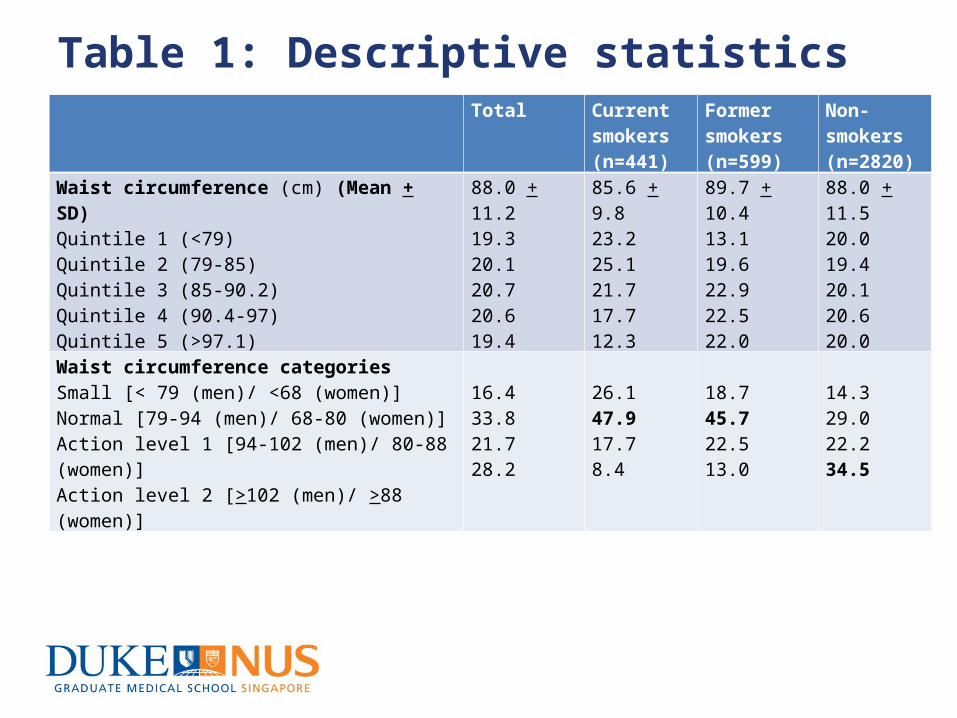
Table 1: Descriptive statistics Total Current
smokers(n=441)
Former smokers(n=599)
Non-smokers(n=2820)
Waist circumference (cm) (Mean + SD)Quintile 1 (<79)Quintile 2 (79-85)Quintile 3 (85-90.2)Quintile 4 (90.4-97)Quintile 5 (>97.1)
88.0 + 11.219.320.120.720.619.4
85.6 + 9.823.225.121.717.712.3
89.7 + 10.413.119.622.922.522.0
88.0 + 11.520.019.420.120.620.0
Waist circumference categoriesSmall [< 79 (men)/ <68 (women)]Normal [79-94 (men)/ 68-80 (women)]Action level 1 [94-102 (men)/ 80-88 (women)]Action level 2 [>102 (men)/ >88 (women)]
16.433.821.728.2
26.147.917.78.4
18.745.722.513.0
14.329.022.234.5
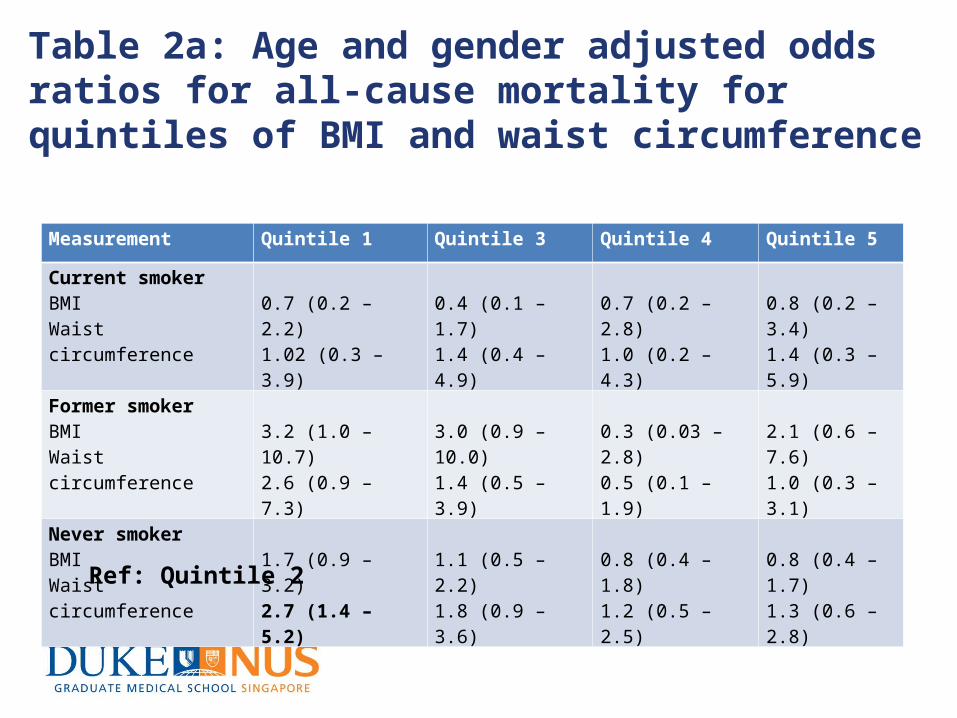
Table 2a: Age and gender adjusted odds ratios for all-cause mortality for quintiles of BMI and waist circumference
Measurement Quintile 1 Quintile 3 Quintile 4 Quintile 5Current smokerBMI Waist circumference
0.7 (0.2 – 2.2)1.02 (0.3 – 3.9)
0.4 (0.1 – 1.7)1.4 (0.4 – 4.9)
0.7 (0.2 – 2.8)1.0 (0.2 – 4.3)
0.8 (0.2 – 3.4)1.4 (0.3 – 5.9)
Former smokerBMI Waist circumference
3.2 (1.0 – 10.7)2.6 (0.9 – 7.3)
3.0 (0.9 – 10.0)1.4 (0.5 – 3.9)
0.3 (0.03 – 2.8)0.5 (0.1 – 1.9)
2.1 (0.6 – 7.6)1.0 (0.3 – 3.1)
Never smokerBMI Waist circumference
1.7 (0.9 – 3.2)2.7 (1.4 – 5.2)
1.1 (0.5 – 2.2)1.8 (0.9 – 3.6)
0.8 (0.4 – 1.8)1.2 (0.5 – 2.5)
0.8 (0.4 – 1.7)1.3 (0.6 – 2.8)
Ref: Quintile 2
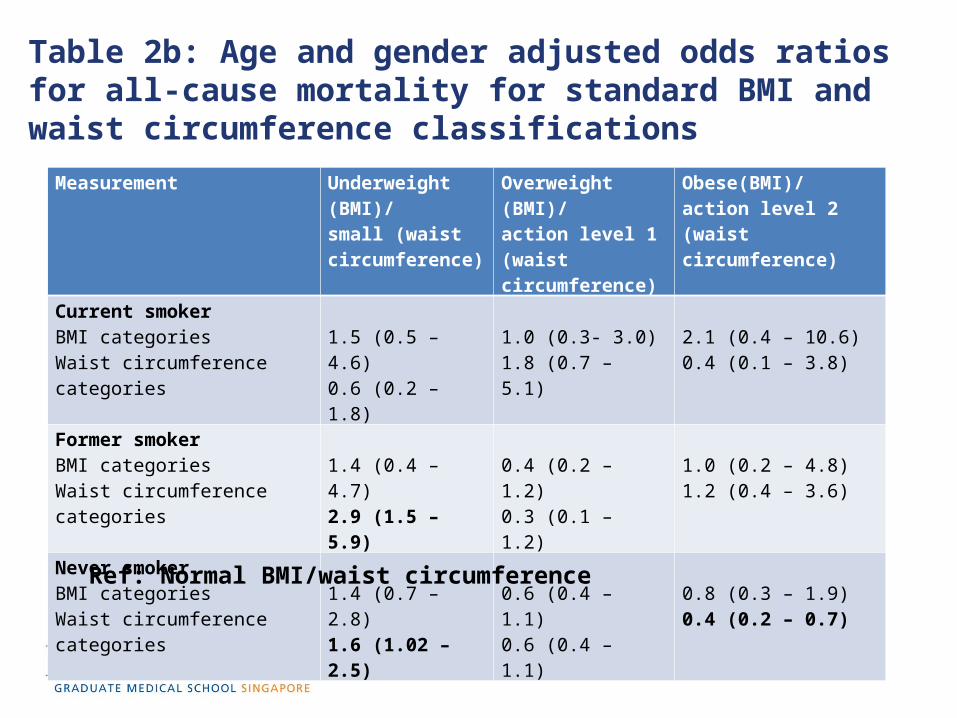
Table 2b: Age and gender adjusted odds ratios for all-cause mortality for standard BMI and waist circumference classifications
Measurement Underweight (BMI)/small (waist circumference)
Overweight (BMI)/action level 1 (waist circumference)
Obese(BMI)/ action level 2 (waist circumference)
Current smokerBMI categories Waist circumference categories
1.5 (0.5 – 4.6)0.6 (0.2 – 1.8)
1.0 (0.3- 3.0)1.8 (0.7 – 5.1)
2.1 (0.4 – 10.6)0.4 (0.1 – 3.8)
Former smokerBMI categories Waist circumference categories
1.4 (0.4 – 4.7)2.9 (1.5 – 5.9)
0.4 (0.2 – 1.2)0.3 (0.1 – 1.2)
1.0 (0.2 – 4.8)1.2 (0.4 – 3.6)
Never smokerBMI categories Waist circumference categories
1.4 (0.7 – 2.8)1.6 (1.02 – 2.5)
0.6 (0.4 – 1.1)0.6 (0.4 – 1.1)
0.8 (0.3 – 1.9)0.4 (0.2 – 0.7)Ref: Normal BMI/waist circumference

Conclusion
• No relationship between BMI and mortality• Among non-smokers
– Higher odds of mortality in those with smaller waist circumference
– Lower odds of mortality among elderly in highest waist circumference classification
• Data collection for wave 2 of the survey ongoing and final results expected by July 2012

Thank you


![Body mass index, abdominal fatness, weight gain and the ... · [51], however, it is unclear whether waist circumference or waist-to-hip ratio is more strongly associated with psoriasis](https://img.pdfslide.us/doc/110x75/5e70519171e1233f161859ba/body-mass-index-abdominal-fatness-weight-gain-and-the-51-however-it-is.jpg)