Embed Size (px)
Citation preview
1
DEMOGRAPHIC TRENDS
Warren SmithData Analyst, Barnstable County Dept. of Human Services and Senior Mobility Initiative on Cape Cod
“CHARTING THE COURSE”
Power in Aging Collaborative Planning Summit
November 9, 2007
Barnstable Senior Center

2
Today’s Presentation
“What We Know About Older Cape Codders”
DEMOGRAPHIC HIGHLIGHTS:
Cape Cod’s Older Population
IndividualsHouseholds with Age 65+ Persons
3
Demographicsof Cape Cod’s Older
Population
4
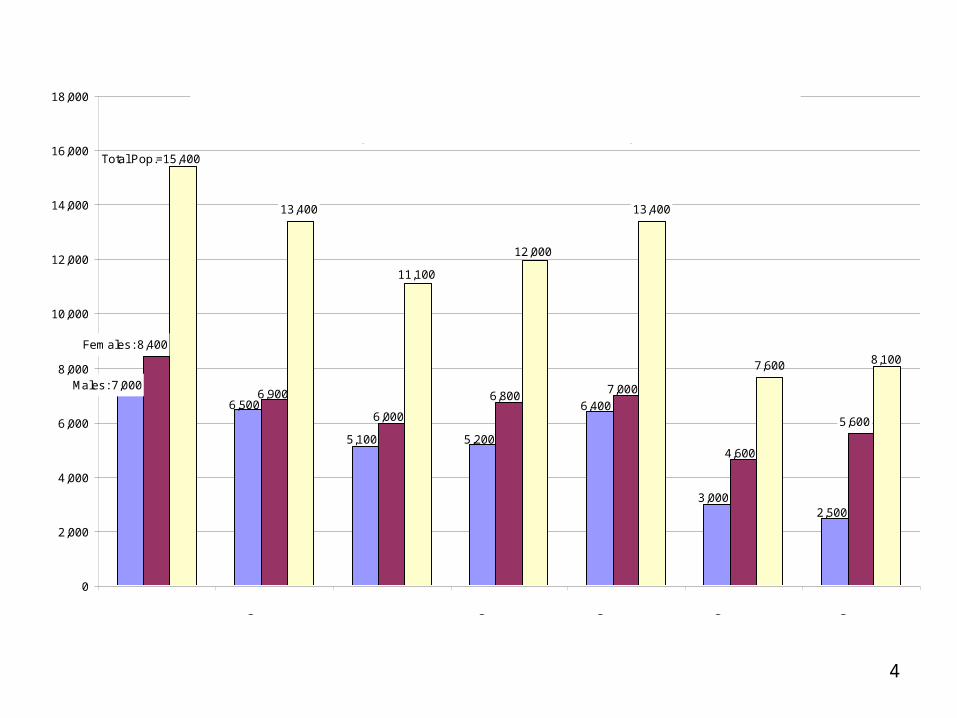
2,5003,000
6,400
5,2005,100
6,500
Males: 7,000
5,600
4,600
7,0006,800
6,000
6,900
Females: 8,400
Total Pop.=15,400
13,400
11,100
12,000
13,400
7,600 8,100
0
2,000
4,000
6,000
8,000
10,000
12,000
14,000
16,000
18,000
1 2 3 4 5 6 7Ages 55-59 Ages 60-64 Ages 65-69 Ages 70-74 Ages 75-79 Ages 80-84 Ages 85+
Cape Cod's Older Population in Year 2006(latest US Census estimates)
Note: Ages 50-54 = 17,000

5
Older Population at 2005
45,000 Women36,000 Men0
6
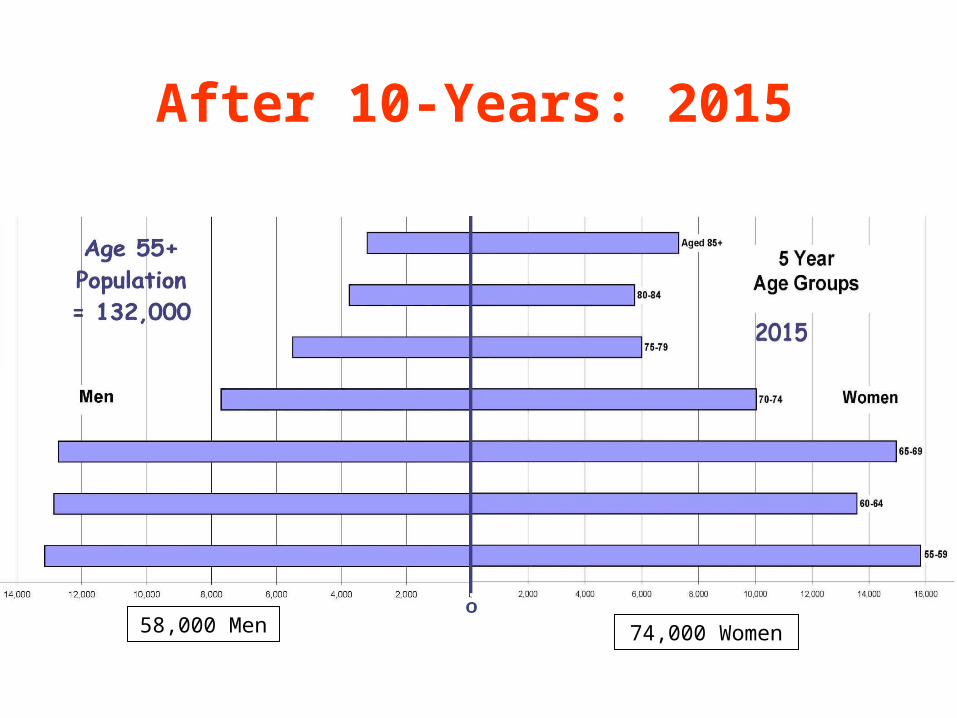
After 10-Years: 2015
58,000 Men 74,000 Women
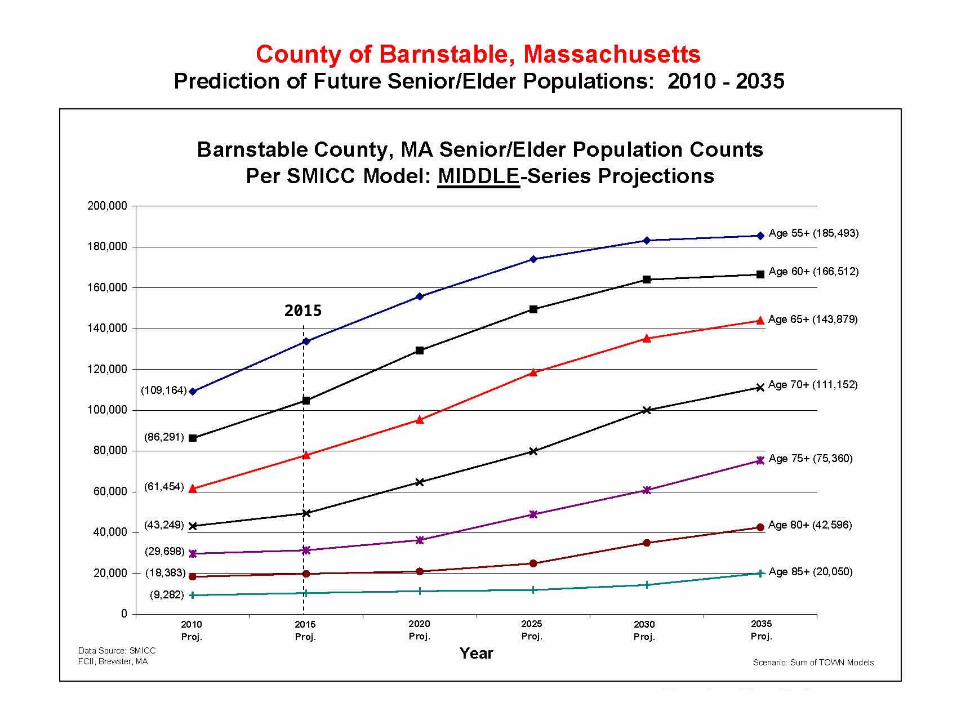
7
2015

8
Primary Reason For This Population Growth
“Baby Boomers”

9
“Baby Boomers”(19-Year Cohort: 1946-1964)
• Post WWII Babies• Youngest is Age 44• Oldest is Age 61• Started Turning 60
Last Year

10
Cape’s “Boomers” in 2006
(latest US Census estimates)
59,000 “Boomers” (Ages 43-60)
26% of Total Population:
- 31,000 females (53%)
- 28,000 males (47%)
Oldest “Boomers” Became
Eligible For COA Services in
2006 (the “leading edge” is here!)
Turning Age 60 at rate of 8 per day (one every 3 hours!)

11
“Boomers” plus Senior/Elders
Comprise 55% of the Cape’s Population

12
Older Population’s Income
• Aggregate Social Security Income $562 mil• Aggregate Retirement Income $630 mil
_______ $1.2 Billion
plus earned income, dividends, etc.
Now That’s POWER IN AGING!

13
Individuals “Independence” is key!

14
Aging in Place“Aging in place is growing older
without having to move.”[1]
“Some 70% of seniors spend the rest of their life in the place where they celebrated their 65th birthday.”[1]
FUTURE: 90% of “Baby Boomers” plan to “age in place” (Would mean about 70,000 on Cape by 2015, 100,000 by 2025,. . . . )
1. Source: “Resource For Aging In Place,” www.seniorresource.com/ageinpl.htm
15
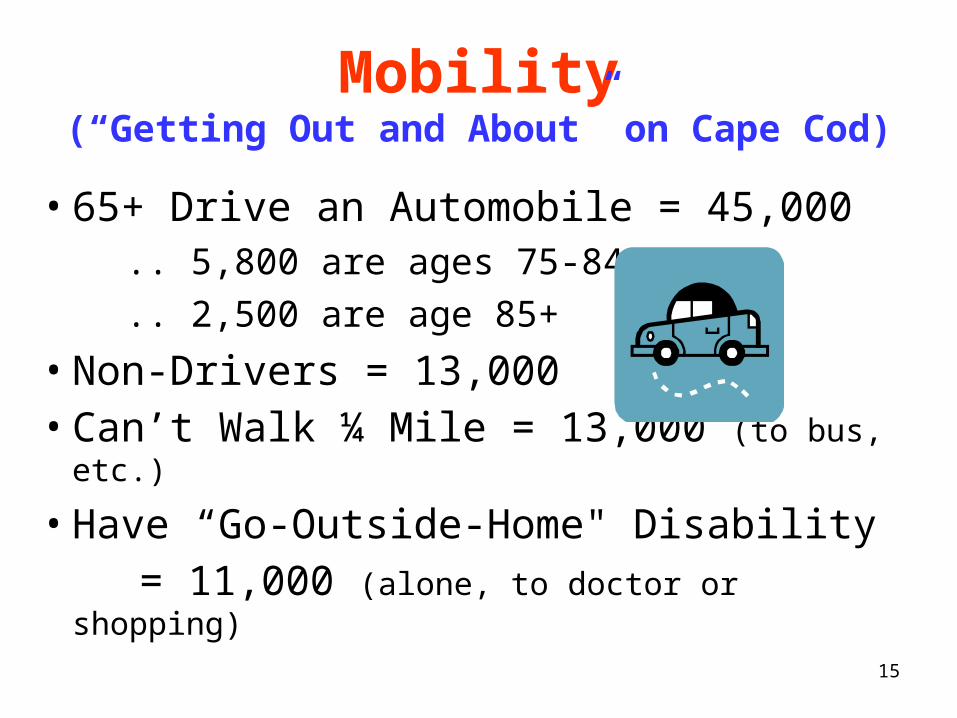
Mobility(“Getting Out and About” on Cape Cod)
• 65+ Drive an Automobile = 45,000 .. 5,800 are ages 75-84 .. 2,500 are age 85+
• Non-Drivers = 13,000• Can’t Walk ¼ Mile = 13,000 (to bus,
etc.)
• Have “Go-Outside-Home" Disability = 11,000 (alone, to doctor or shopping)
16
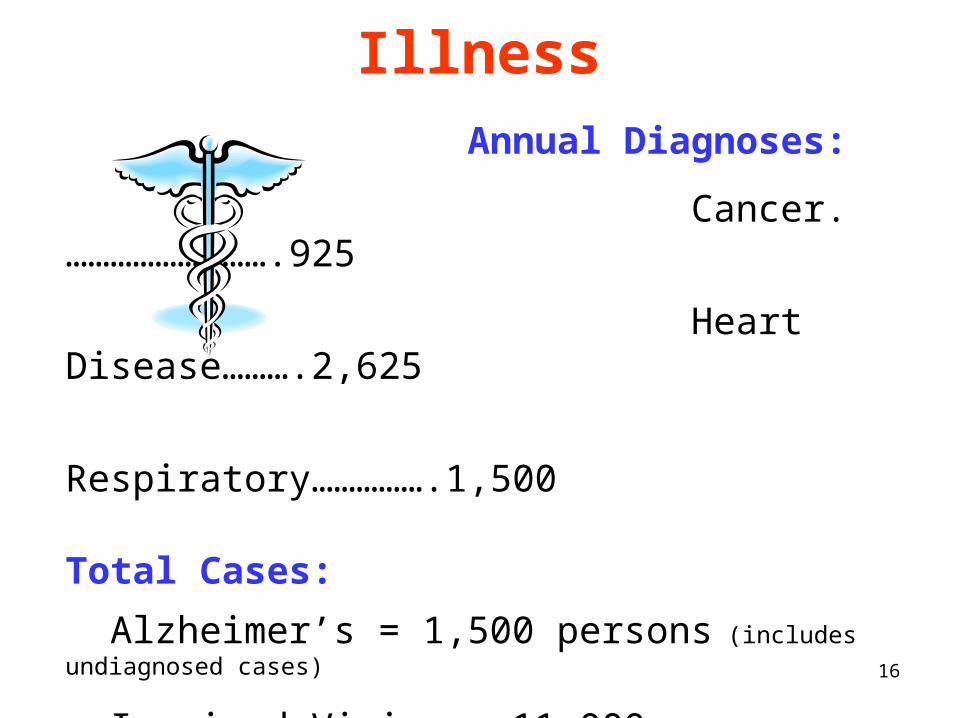
Illness Annual Diagnoses:
Cancer.……………………….925
Heart Disease……….2,625
Respiratory…………….1,500
Total Cases:
Alzheimer’s = 1,500 persons (includes undiagnosed cases)
Impaired Vision = 11,000
Impaired Hearing = 21,000
17
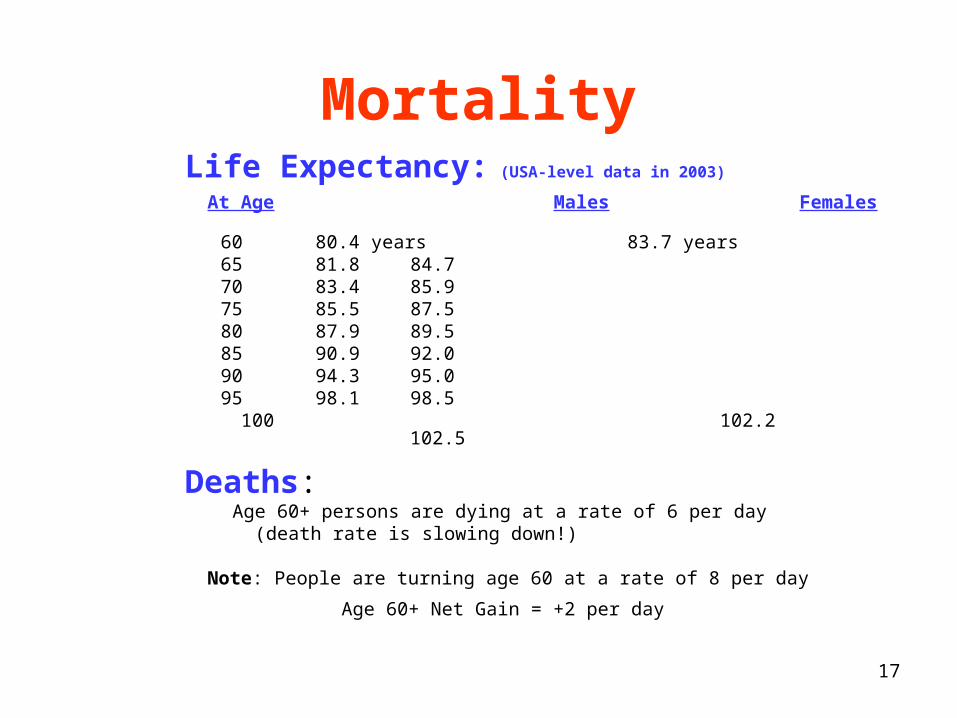
MortalityLife Expectancy: (USA-level data in 2003)
At Age Males Females 60 80.4 years 83.7 years65 81.8 84.770 83.4 85.975 85.5 87.580 87.9 89.585 90.9 92.090 94.3 95.095 98.1 98.5
100 102.2 102.5
Deaths:Age 60+ persons are dying at a rate of 6 per day (death rate is slowing down!)
Note: People are turning age 60 at a rate of 8 per day
Age 60+ Net Gain = +2 per day
18
HouseholdsWith Someone Age 65+

19
Household Profile(Someone in household is age 65+)
• Number of Households = 35,000 36% of all households
• One Adult LIVING ALONE = 29%• Average Size 2.0 persons• AT LEAST ONE PERSON Retired =
81%• EVERYONE in Household Retired =
61%

20
Household Profile (continued)
• Have disabled/chronically ill person(s) = 25%• Include “Frail” Elders = 20%• Receive Home Health/Aide Services = 7%
• Uses PUBLIC Transportation (RTA) = 5%
• Uses PRIVATE Transportation = 13% (includes taxi, family/friends, COA, P&B, etc.)