Embed Size (px)
Citation preview

1
Chapter 5 Lecture -Poverty, Inequality, and Development
EC348 - Development Economics EC348 - Development Economics
Sapa, Vietnam*Dennis C. McCornac

2
Distribution and Development: Seven Critical Questions
1. What is the extent of relative inequality, and how is this related to the extent of poverty?
2. Who are the poor and what are their economics characteristics?
3. Who benefits from economic growth?4. Does rapid growth necessarily cause greater income
inequality?5. Do the poor benefit from growth?6. Are high levels of inequality always bad?7. What policies can reduce poverty?

3
Issues Development and growth is often discussed as if the
population of a given country enjoyed the same rate of change in income
This is certainly not true: there is inequality among the citizens of any given country some people earn a higher share of national income than other people
Given that there is inequality, is it still true that, when a country grows, all the population benefits from it?
To be able to answer this question, we have to analyze how inequality and poverty change as a country grows

4
Economic growth is necessary, but not sufficient, to improve the living standards of the whole population:– If a country is too poor, even redistributing all income in
order to have a perfectly egalitarian income distribution, everybody will still be poor (case of Vietnam in 1980’s)
– But a country may grow, and income distribution may become so unequal, that the number of people with low living standards may actually increase
Growth may be associated with worsening of the income distribution when:– The relatively well-off get most of the benefits of increased
income (“the rich get richer, and the poor get poorer”)

5
(Con’t) Growth may be associated with worsening of the income distribution when:– Government forces savings to further increase growth, thus
reducing consumption and welfare
– Government uses increased income in projects that do not reflect directly into benefits for citizens (several less-developed countries have well-armed military, nuclear weapons, palaces, etc.)
Recent evidence suggests growth is actually good for the poor When data across countries is examined, it can be seen that the
income of the 20% poorest of the population tends to grow together with average
When growth rate increases, income of the poor also grows faster

6
Measures of Inequality To discuss these issues in more detail, we have to be able to
measure inequality And to measure inequality, we must have a precise definition. Inequality can be measured in several different ways, and
each different way may be the most appropriate for a particular kind of analysis
Measures of inequality are based on how the average income of a given country is distributed across its population
To obtain a measure of inequality, we need information of income for each single individual in the country, or for a “sample” of individuals
This information is usually obtained via household surveys. How?

7
The Gini coefficient is the ratio of the areas A/(A+B) in the figure above
Lorenz Curve

8
To summarize inequality in a single number, some statistics were developed.
The most popular one is the Gini coefficient– The ratio of the areas A/(A+B) – Larger Gini coefficient means larger inequality (note that the
coefficient is between 0 and 1) – Keep in mind, however, sometimes the value is based on 100 point
scale.
Another popular approach is to compare the income of different fractions of the population; for example: ratio between income of the 20% richest and income of the 20% poorest
http://web.worldbank.org/WBSITE/EXTERNAL/TOPICS/EXTPOVERTY/EXTPA/0,,contentMDK:20238991~menuPK:492138~pagePK:148956~piPK:216618~theSitePK:430367,00.html

9
“Textbook Lorenz Curve”BD - If the income distribution in a given country was completely egalitarianSo, any deviation from the 45o line is due to inequality in the distribution

10
Lorenz Curve of Income Distribution
https://www.cia.gov/library/publications/the-world-factbook/rankorder/2172rank.html

11
Functional Income DistributionAssume a traditional economy in which labor is the only variable input (capital and land are fixed): Output = Wages + ProfitsFunctional income distribution = Wages as a percentage of ProfitsThe higher the ratio, the greater is income equality

12
Absolute Poverty and Poverty Gap Definition for Absolute Poverty: The poverty
threshold, or poverty line, is the minimum level of income deemed necessary to achieve an adequate standard of living in a given country
International Poverty Line: The common international poverty line has in the past been roughly $1 a day. In 2008, the World Bank came out with a revised figure of $1.25 at 2005 purchasing-power parity (PPP).

13
Measuring Poverty Gap
Poverty and income inequality depend on type of economic, political and institutional arrangements according to which rising national incomes are distributed among broad segments of a population
A middle-income country may have a higher poverty rate and poverty gap than a low-income country (South Africa vs. Sri Lanka)

14
Measuring Inequality and Poverty
Headcount Index: H/N– Where H is the number of persons who are poor and N is
the total number of people in the economy
Total poverty gap:
– Where Yp is the absolute poverty line; and Yi the income of the ith poor person
TPG (Yp Yi)i1
H

15
Measuring Total Poverty Gap
16
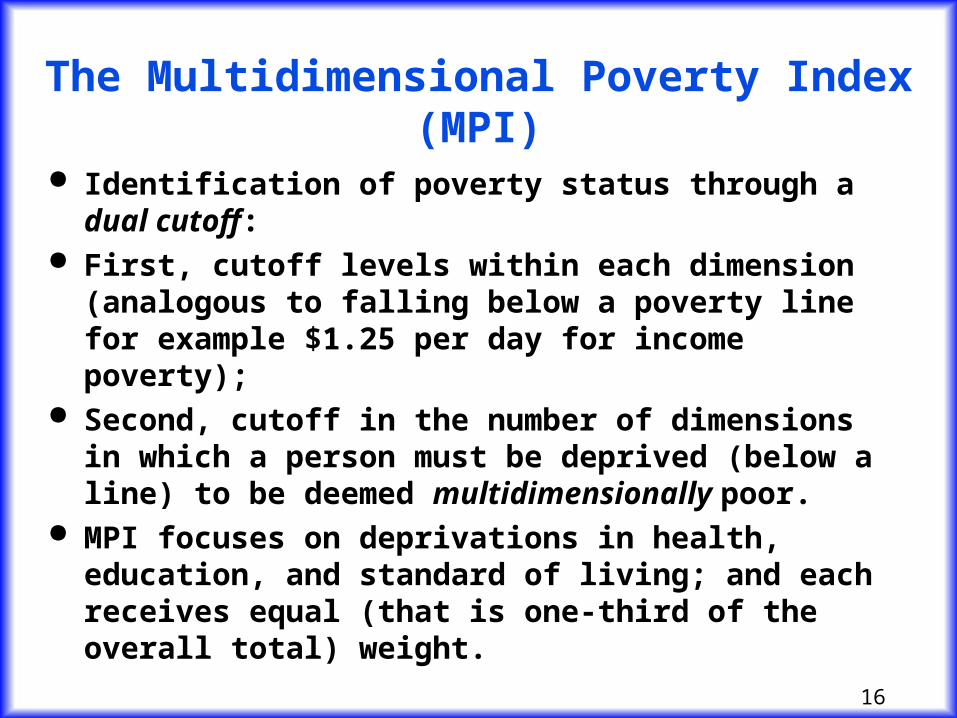
The Multidimensional Poverty Index (MPI)
Identification of poverty status through a dual cutoff: First, cutoff levels within each dimension (analogous to
falling below a poverty line for example $1.25 per day for income poverty);
Second, cutoff in the number of dimensions in which a person must be deprived (below a line) to be deemed multidimensionally poor.
MPI focuses on deprivations in health, education, and standard of living; and each receives equal (that is one-third of the overall total) weight.

17
MPI Indicators Health - two indicators with equal weight - whether any child has died in the
family, and whether any adult or child in the family is malnourished –weighted equally (each counts as one-sixth toward the maximum deprivation in the MPI)
Education - two indicators with equal weight - whether no household member completed 5 years of schooling, and whether any school-aged child is out of school for grades 1 through 8 (each counts one-sixth toward the MPI).
Standard of Living, equal weight on 6 deprivations (each counts as 1/18 toward the maximum): lack of electricity; insufficiently safe drinking water; inadequate sanitation; inadequate flooring; unimproved cooking fuel; lack of more than one of 5 assets – telephone, radio, TV, bicycle, and motorbike.

18
Income Poverty Incidence in Selected Countries

19
MPI Rankings and Poverty Headcounts for Selected Countries

20
Multidimensional Poverty Tells a Different Story Than Income Poverty
The results showed that knowing income poverty is not enough if our concern is with multidimensional poverty.
Multidimensionally, Bangladesh is substantially less poor - but Pakistan substantially poorer - than would be predicted by income poverty
Ethiopia is far more multidimensionally poor, and Tanzania much less so, than predicted by income poverty.
Most Latin American countries e.g. Brazil rank worse on multidimensional poverty than on income poverty; but Colombia’s income and MPI poverty ranks are about same.

21
Lorenz Curve of Income Distribution
The greater the curvature of the Lorenz Curve, the greater is the degree of income inequality
Improved Income Distribution
Worsening Income Distribution
Crossing Lorenz Curves in the Modern-Sector Enlargement Growth Typology

22
Efficiency versus Equality
Some degree of inequality is due to the fact that different people have different levels of ability
Also, some degree of inequality is necessary to generate incentives in the market this is the way to make people work hard, or to give right incentives for creative people to innovate
Policies that try to reduce this type of inequality tend to reduce the efficiency in terms of allocation of resources
What is the ideal point in terms of the ‘efficiency versus equality’ tradeoff? Explain.
23
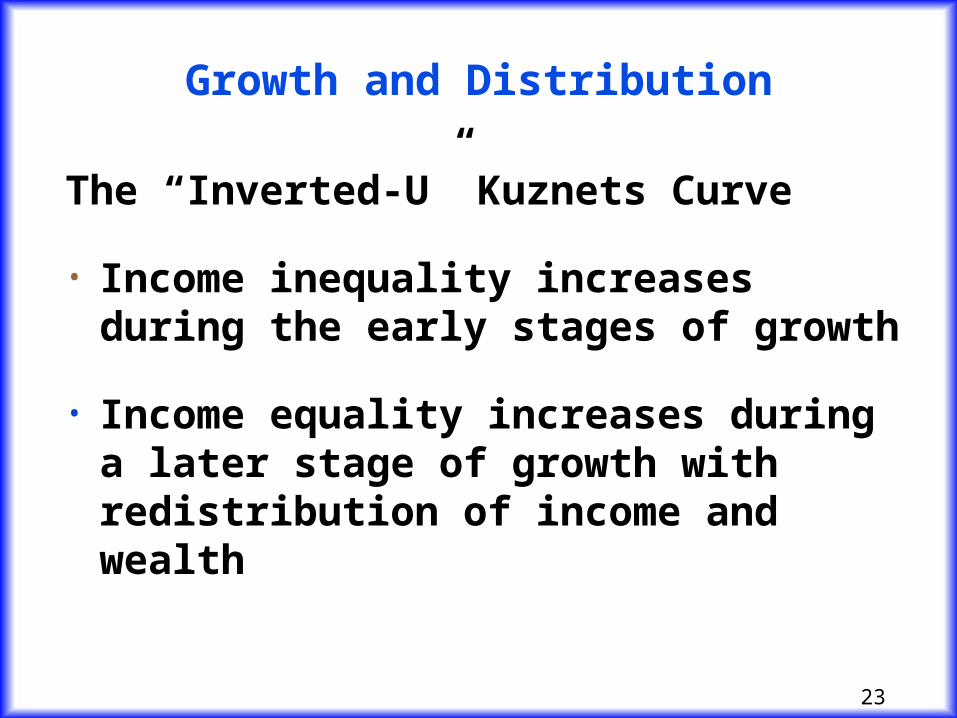
Growth and Distribution
The “Inverted-U” Kuznets Curve
• Income inequality increases during the early stages of growth
• Income equality increases during a later stage of growth with redistribution of income and wealth

24
The Kuznets Curve
Cross country evidence supports the hypothesis
Time series data show some countries have been able to grow and improve income distribution at the same time

25
The idea comes from the a two sector (agriculture and industry) model.
Initially, with all population in rural areas: development is low and there is no inequality (the whole society is poor)
Intermediary stage: part of the population migrates to urban areas, where wages are higher inequality rises with first steps of industrialization
Final stage: most of the population lives in urban areas, and wages in agriculture become higher further development brings reductions in inequality
Explaining the Kuznets Curve

26
Initially, a relatively small fraction of the population would benefit from development increased inequality
After modernization was spread out through society, inequality would be reduced
In the end, the economy would move from a situation of poverty with low inequality, to a situation of development with low inequality; the increase and reduction in inequality would be the transition between these two points
Evidence on this idea is suspect
Further Explaining the Kuznets Curve

27
Nowadays, the dominant view is that there is no clear relation between development and inequality (across countries or though time), although not all economist agree
Nevertheless, changes that a country goes through during the development process may affect inequality
In the short run, inequality tends to be very persistent within a country
Changes in inequality are generally small when compared to changes in other economic variables (income, urbanization, etc)
Why is Inequality Persistent?

28
Inequality in access to education and credit (entrepreneurship)
Culture and social structures associated with discrimination
Inequality in political representation
Intergenerational transmission of inequality via fertility and educational decisions (poor people tend to have more kids and invest less in each).
Inequality Depends on Factors that are Persistent Through Time

29
Consequences of Inequality Apart from welfare concerns, inequality also has
direct economic consequences
Inequality tends to increase crime (economic theory of crime) material costs of crime are around 4% of GDP for the US; and probably more for Latin America and ex-USSR
Inequality may affect policy-making, if income is related to political power more influence to the richer

30
Income and Inequality in Selected Countries
31
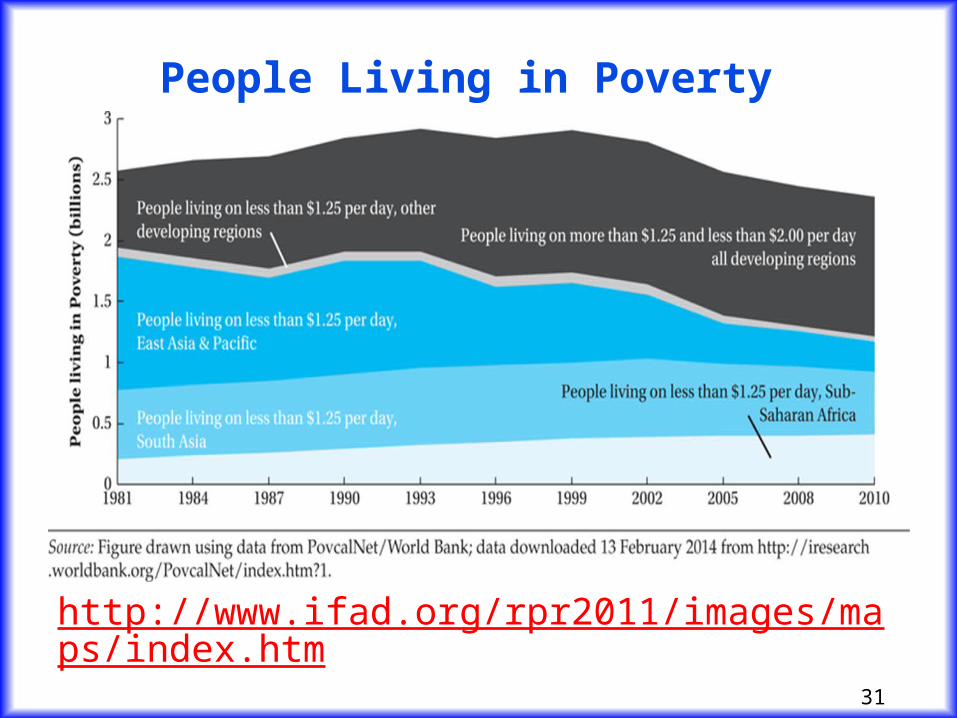
http://www.ifad.org/rpr2011/images/maps/index.htm
People Living in Poverty

32
The world's seven richest men could wipe out global poverty
By Anuradha Vittachi,12 June 1997,London, UK
The world's seven richest men could wipe out global poverty. Their combined wealth is more than enough to provide the basic needs of the poorest quarter of the world's people.
According to the UN's 1997 Human Development Report (HDR), published today, it would cost just $80 billion to provide access to basic social services and income transfers to the poverty-stricken - less than the net wealth of these seven billionaires. In fact, the top ten billionaires have 1.5 times as much money as the combined national incomes of the 48 poorest countries, home to 10 % of the world's people.
Food for Thought
Do you think this has changed over the past decade and a half?

33
“Poor nutrition is implicated in more than half of all child deaths worldwide—a proportion unmatched by any infectious disease since the Black Death,” says Jean-Louis Sarbib, Senior Vice President for Human Development at the World Bank. “It is intimately linked with poor health and environmental factors and yet, policymakers, politicians, and economists often fail to recognize these connections. For example, nearly 60% of children who die of common diseases like diarrhea and malaria could have ultimately survived had they not been malnourished in the first place.”
http://web.worldbank.org/WBSITE/EXTERNAL/NEWS/0,,contentMDK:20839585~pagePK:64257043~piPK:437376~theSitePK:4607,00.html
Not Enough Food for Thought

34
Characteristics of Poverty Groups Rural populationRural population Women and childrenWomen and children Ethnic minorities and indigenous populationEthnic minorities and indigenous population

35
Sister, if you don’t beat them, they’ll stop being good. And if they’re good and you beat them, they’ll stay that way. — A man in Bangladesh
When my husband died, my in- laws told me to get out. So I came to town and slept on the pave-ment. — A middle- aged widow in Kenya
Problems have affected our relationship. The day my husband brings in money, we are all right together. The day he stays at home [ out of work], we are fighting constantly. — A woman from El Gawaber, Egypt
The unemployed men are frustrated because they can no longer play the part of family providers and protectors. They live on the money made by their wives and feel humiliated because of this. — An elderly woman from Uchkun, Kyrgyzstan
When a a woman gives her opinion, they [ men] make fun of her and don’t pay attention. If women go to a meeting, they don’t give their opinion. — A woman in Las Pascuas, Bolivia
Problems of Gender Relations in Developing Countries: Voices of the Poor
http://go.worldbank.org/H1N8746X10

36
The Range of Policy Options: Some Basic Considerations
Areas of intervention– Change the functional distribution
Give more income to labor and less to capital.– Change asset and skill inequality: the sources of income
inequality. Land reform; microcredit; basic education
– Make taxes more progressive.– Poverty reduction programs: direct transfers or
subsidies for food, education, health, etc.

37
Policy options– Changing relative factor prices
Traditional-sector workers have very low incomes and minimum-wage laws are seldom enforced.
Artificially high modern-sector wages (due to unions or laws) reduce the growth of the modern sector, condemning more people to poverty and exclusion.
– Changing relative factor prices Market-determined wages (which would be lower) in the modern
sector would increase employment and incomes for the poor. Market-determined cost of capital (which would be higher)
would encourage firms to hire workers rather than buy capital.

38
Policy options– Transfer payments and public provision of
goods and services Make sure it’s targeted to the poor. Prevent the poor from becoming dependent on it
… but encourage appropriate risk taking. Discourage switching from work to program. Avoid resentment by nearly-poor-but-not-enough
who are working.

39
Policy options– “workfare” is better than welfare if it
Does not undermine incentives for acquiring human capital needed for private sector jobs
Increases net benefits – including externalities Is difficult to identify the needy without work requirement There are relatively few poor people
There less social stigma / political resentment from workfare The need for a ‘package’ of policies
– Eliminate price distortions: more efficiency, more employment and less poverty
– Structural change in asset ownership– Progressive taxes and transfers; safety net

40
Concepts for Review
Absolute povertyAbsolute poverty Asset ownershipAsset ownership Character of economic growthCharacter of economic growth Disposable incomeDisposable income Factor share distribution of Factor share distribution of
incomeincome Factors of productionFactors of production Functional distribution of incomeFunctional distribution of income Gini coefficientGini coefficient Headcount indexHeadcount index Income inequalityIncome inequality Indirect taxesIndirect taxes Kuznets curve Kuznets curve
Land reformLand reform Lorenz curveLorenz curve Multidimensional poverty index Multidimensional poverty index
(MPI)(MPI) Personal distribution of incomePersonal distribution of income Progressive income taxProgressive income tax Public consumptionPublic consumption Redistribution policiesRedistribution policies Regressive taxRegressive tax Size distribution of incomeSize distribution of income SubsidySubsidy Total poverty gap (TPG) Total poverty gap (TPG) Workfare programsWorkfare programs