Embed Size (px)
Citation preview
1
Chapter 2 Lecture - Comparative Economic
Development
EC348 Development Economics
2
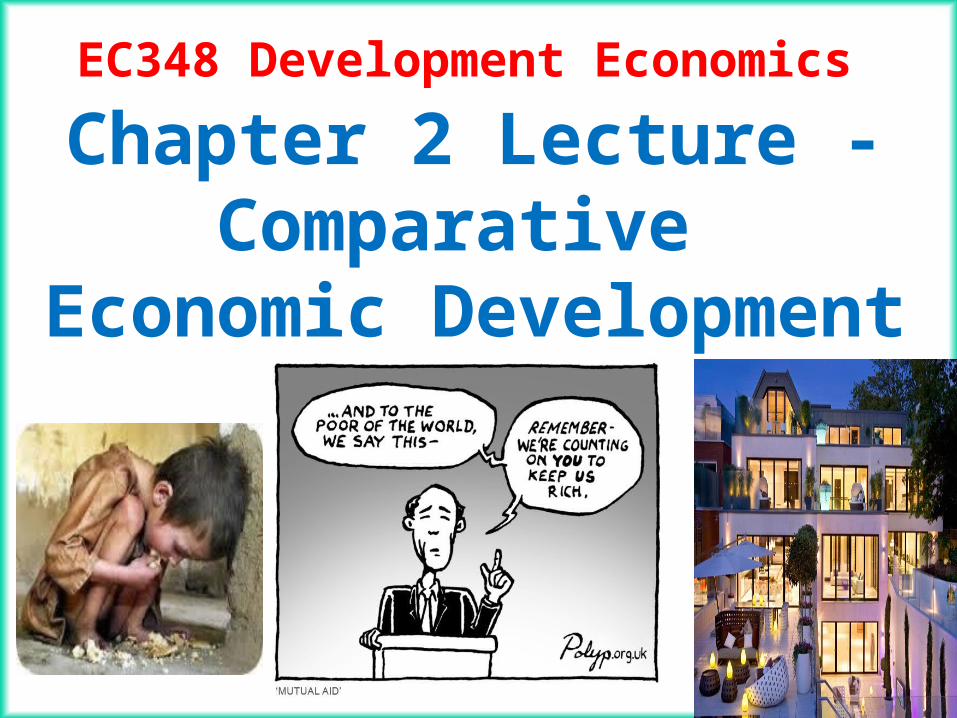
Defining the Developing WorldWorld Bank Scheme- ranks countries on GNI/capita
http://data.worldbank.org/about/country-classifications
3
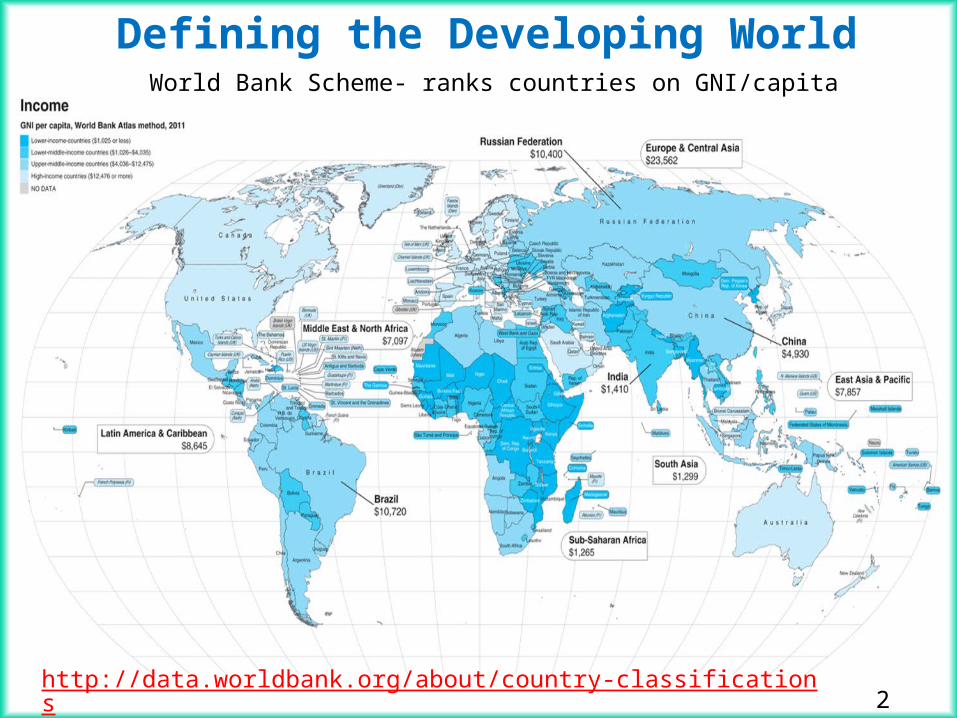
Characteristics of the Developing World: Diversity within Commonality
1. Lower levels of living and productivity
2. Lower levels of human capital (health, education, skills)
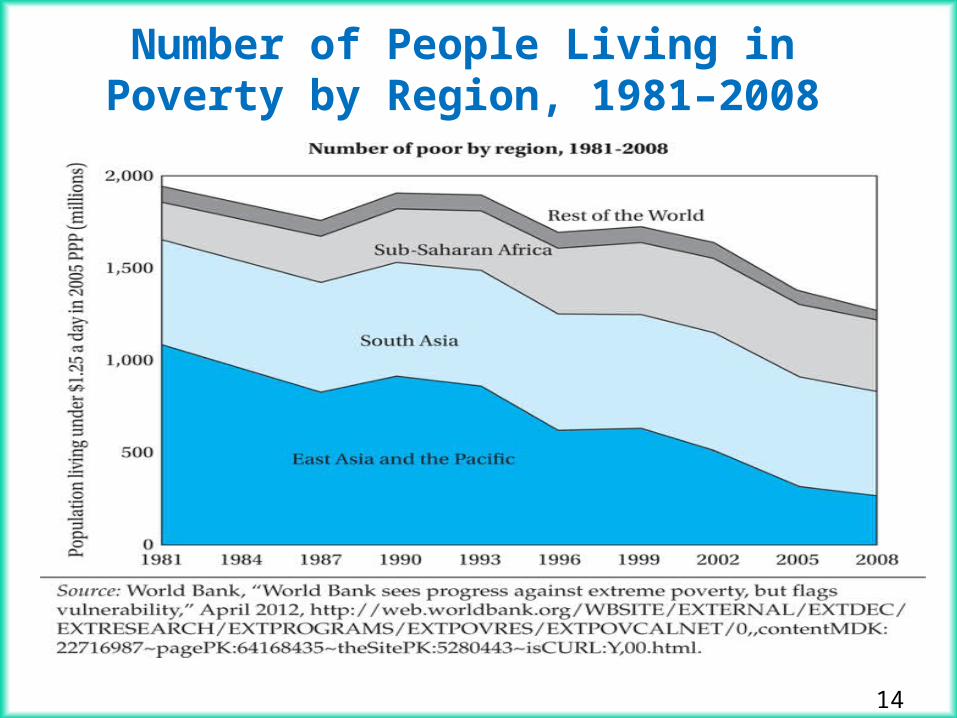
3. Higher Levels of Inequality and Absolute Poverty
– Absolute Poverty– World Poverty
4. Higher Population Growth Rates
– Crude Birth rates
Source: Data from World Bank, World Development Indicators 2013 (Washington, D. C.: World Bank, 2013), p.24.
4
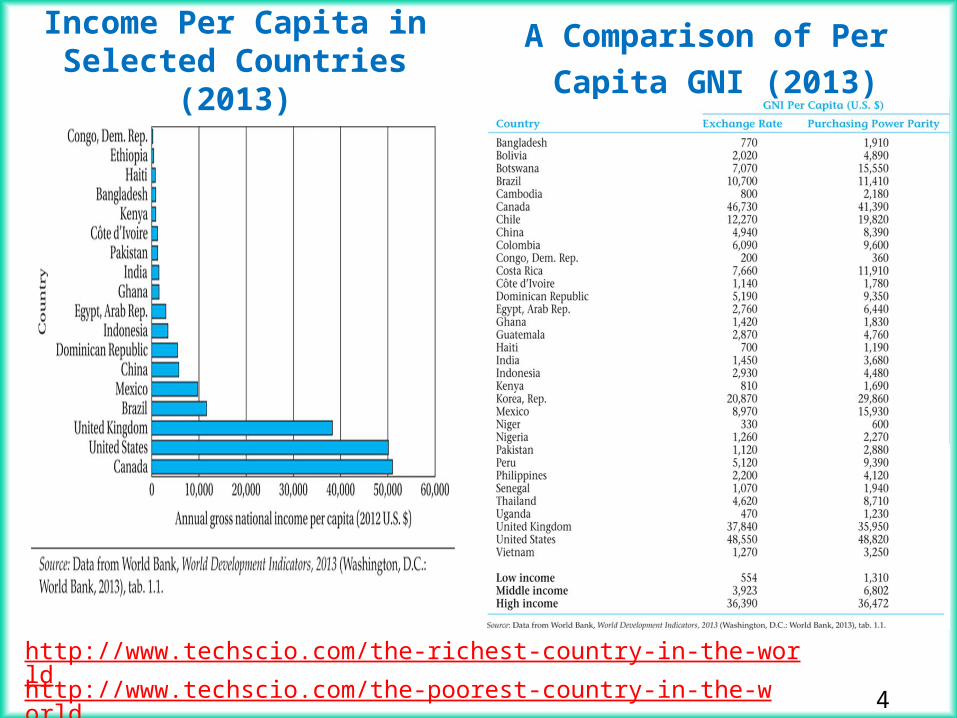
Income Per Capita in Selected Countries (2013)
A Comparison of Per
Capita GNI (2013)
http://www.techscio.com/the-richest-country-in-the-world
http://www.techscio.com/the-poorest-country-in-the-world
5
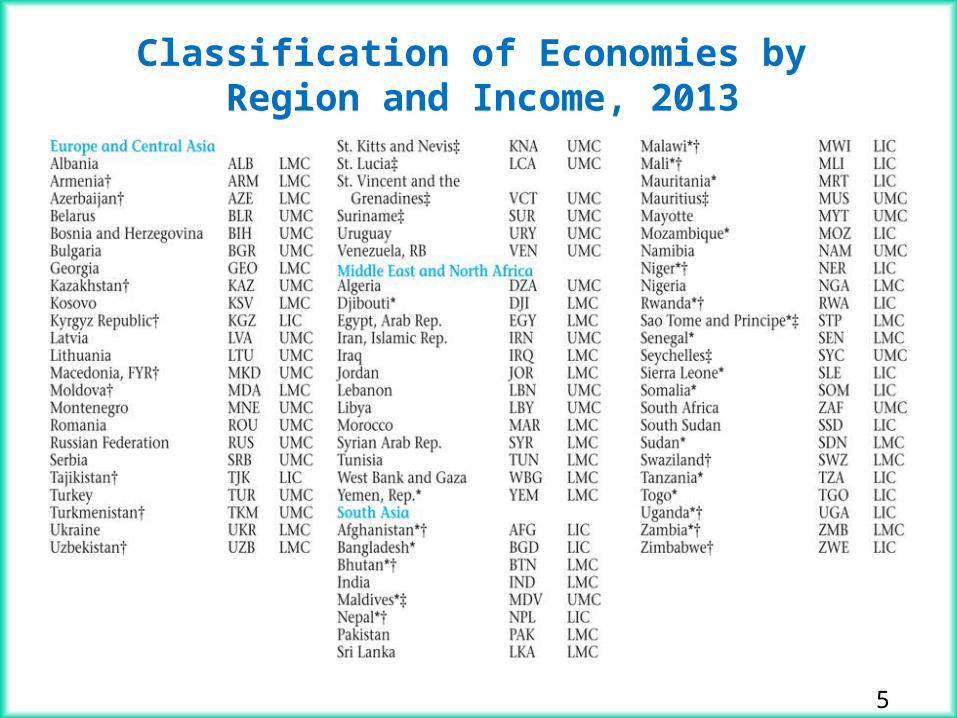
Classification of Economies by Region and Income, 2013
6
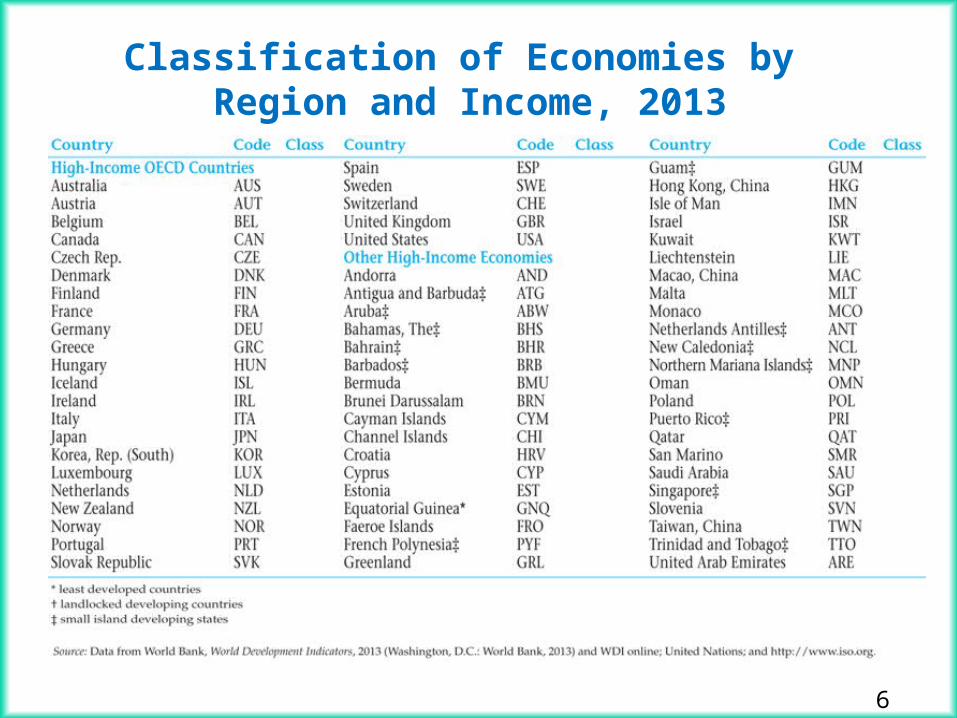
Classification of Economies by Region and Income, 2013
7
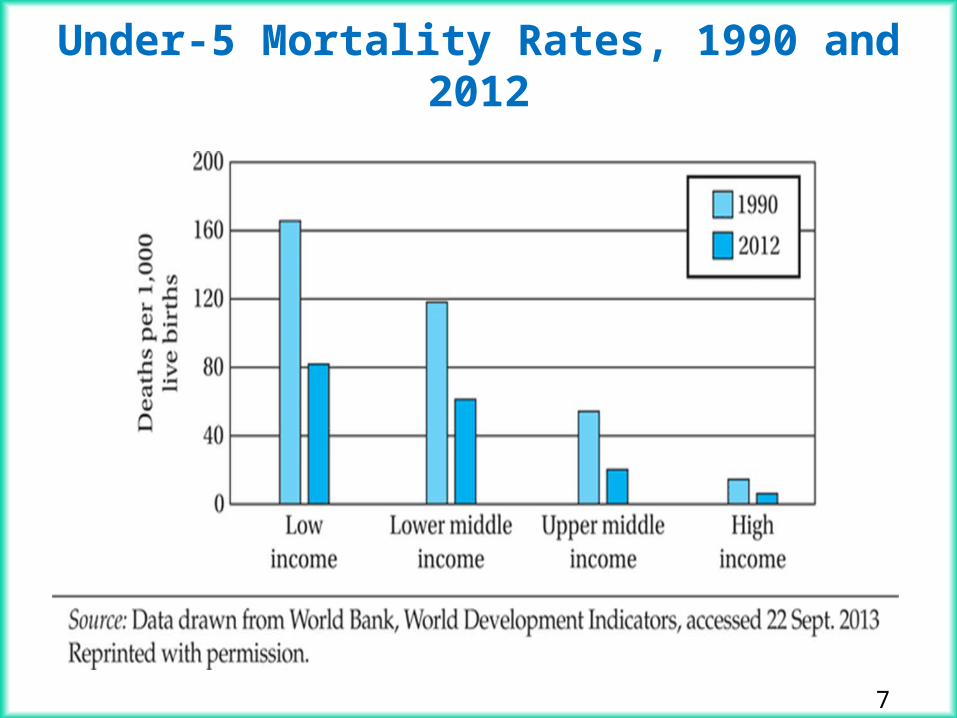
Under-5 Mortality Rates, 1990 and 2012
8
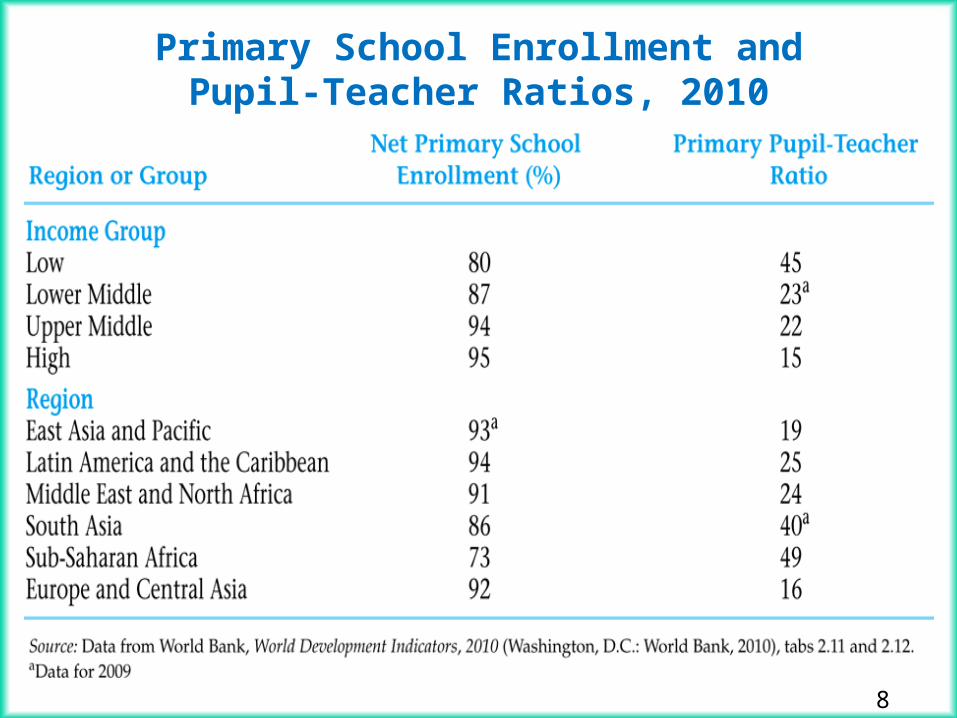
Primary School Enrollment and Pupil-Teacher Ratios, 2010
9
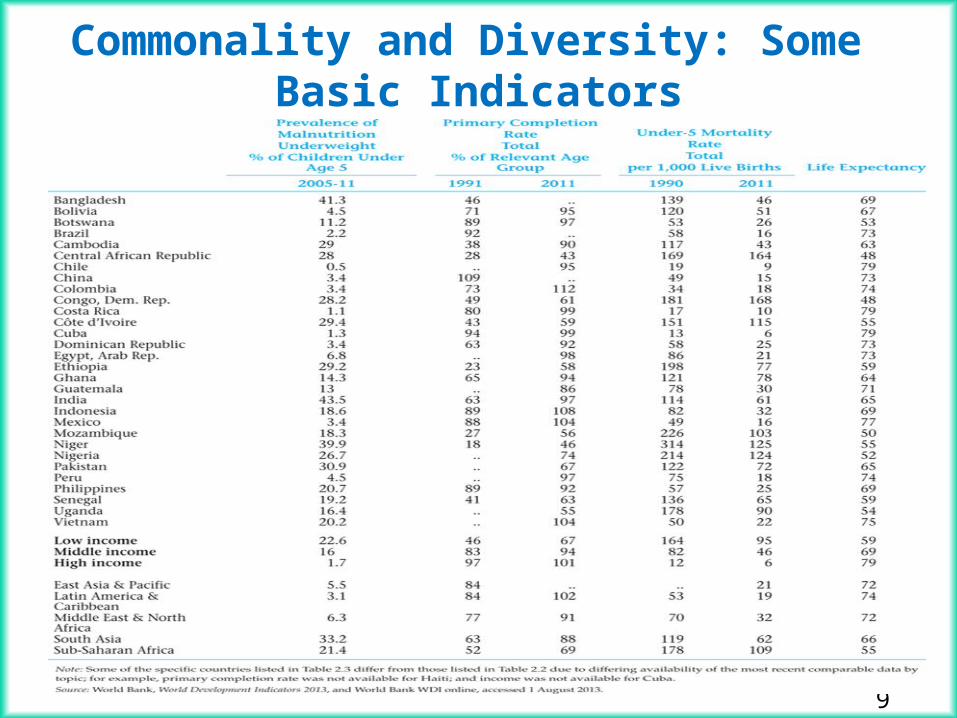
Commonality and Diversity: Some Basic Indicators
10
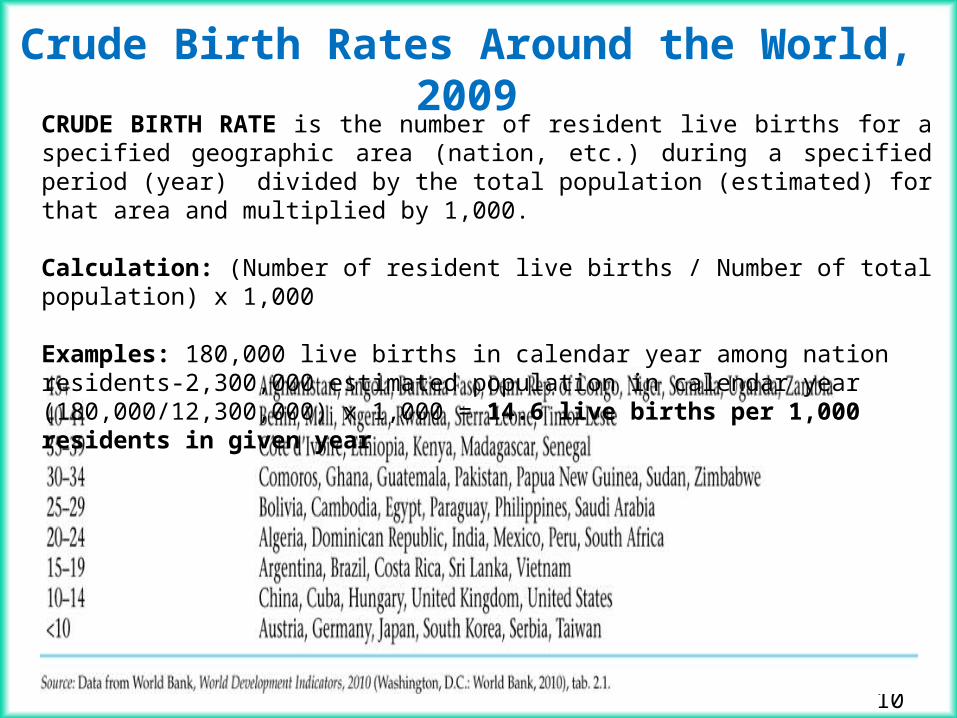
Crude Birth Rates Around the World, 2009CRUDE BIRTH RATE is the number of resident live births for a specified geographic area (nation, etc.) during a specified period (year) divided by the total population (estimated) for that area and multiplied by 1,000.
Calculation: (Number of resident live births / Number of total population) x 1,000
Examples: 180,000 live births in calendar year among nation residents-2,300,000 estimated population in calendar year(180,000/12,300,000) x 1,000 = 14.6 live births per 1,000 residents in given year
11
Characteristics of the Developing World: Diversity within Commonality
5. Greater Social Fractionalization
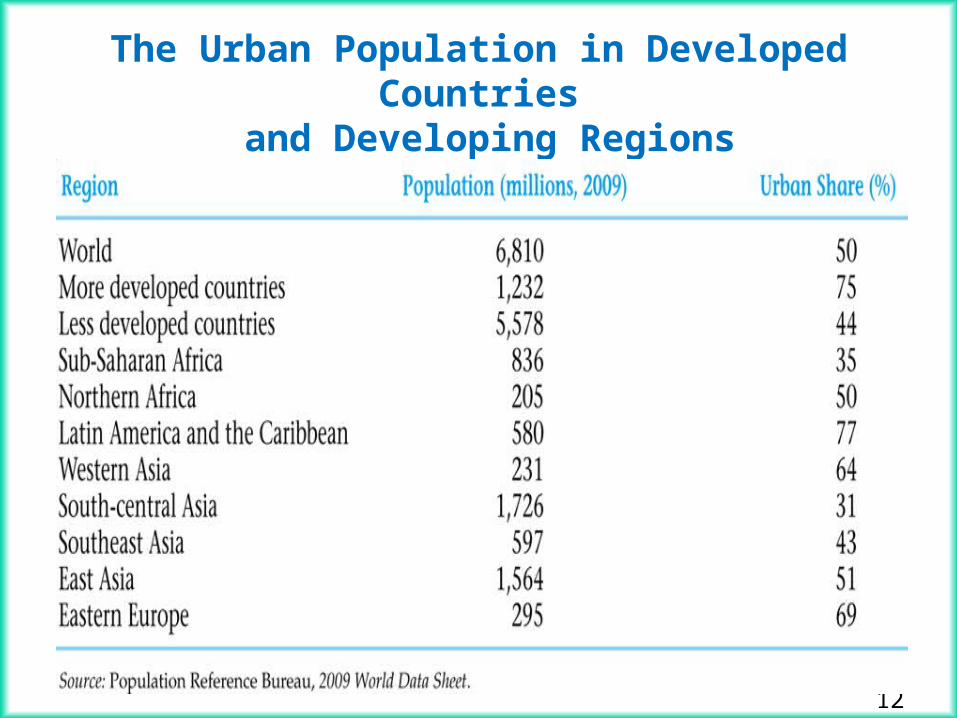
6. Larger Rural Populations but Rapid Rural-to-Urban Migration
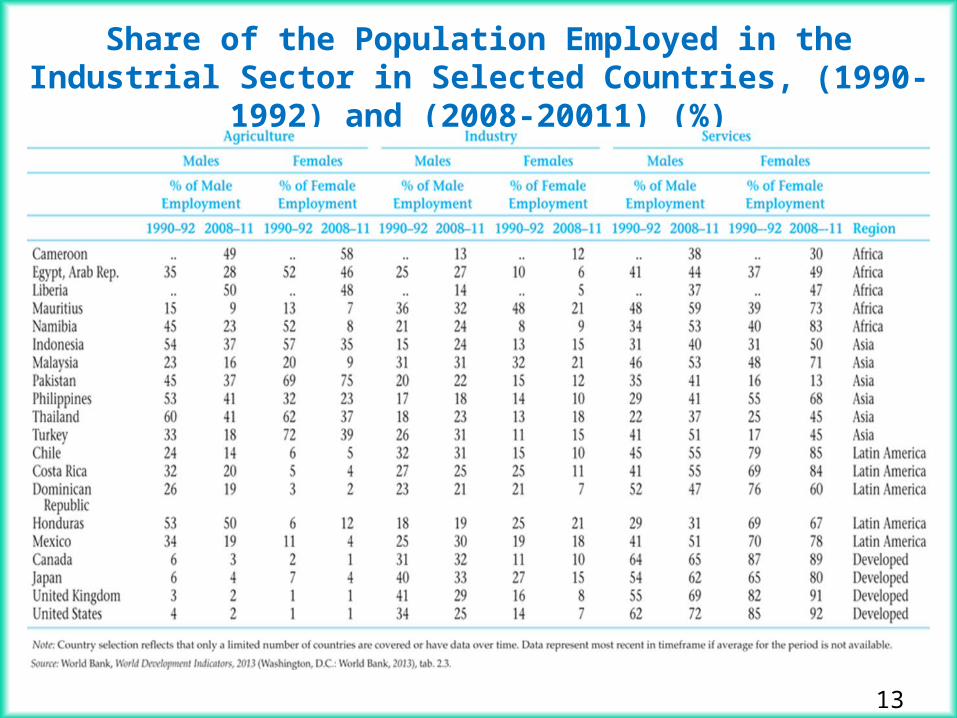
7. Lower Levels of Industrialization and Manufactured Exports
8. Adverse Geography– Resource endowments
12
The Urban Population in Developed Countries and Developing Regions
13
Share of the Population Employed in the Industrial Sector in Selected Countries, (1990-1992) and (2008-20011) (%)
14
Number of People Living in Poverty by Region, 1981–2008
15
Characteristics of the Developing World: Diversity within Commonality
9. Underdeveloped Financial and Other markets– Imperfect markets– Incomplete information
10. Colonial Legacy and External Dependence– Institutions– Private property– Personal taxation– Taxes in cash rather than in kind
16
Human Development Index• Recent efforts have tried to come up with an indicator that
summarizes several different “dimensions” of welfare
• The most well-known example is the Human Development Index (HDI), developed by the United Nations Development Program (UNDP)
• The HDI combines measures of income, education (enrollment ratio and literacy), and health (life expectancy), into a single measure
• The HDI is a relative index: the value for each country is between 0 and 1; it conveys the relative position of a given country in the overall development schedule
• For example, a country with income per capita equal to $9,000, life expectancy at birth equal to 71, adult literacy equal to 75%, and enrollment ratio equal to 98% would have an HDI equal to 78
• Countries are classified into different “development groups” according to the value of their HDI
17
Overall Indicators of Development
• Non-economists (and some economists) usually reject the idea that welfare and poverty should be measured by income alone
• Although income makes people live better, there are other dimensions of people’s lives that are also important for welfare
• A large array of Social Indicators try to measure these different dimensions
• Health variables: child mortality, life expectancy, malnutrition, number of hospital beds per inhabitants, etc
• Education indicators: illiteracy, enrollment rates, average educational achievement in the population, etc
• Access to service/information indicators: radios or TV’s per inhabitants, circulation of newspapers, % of households with access to safe water, etc
Can you think of other indicators?
18
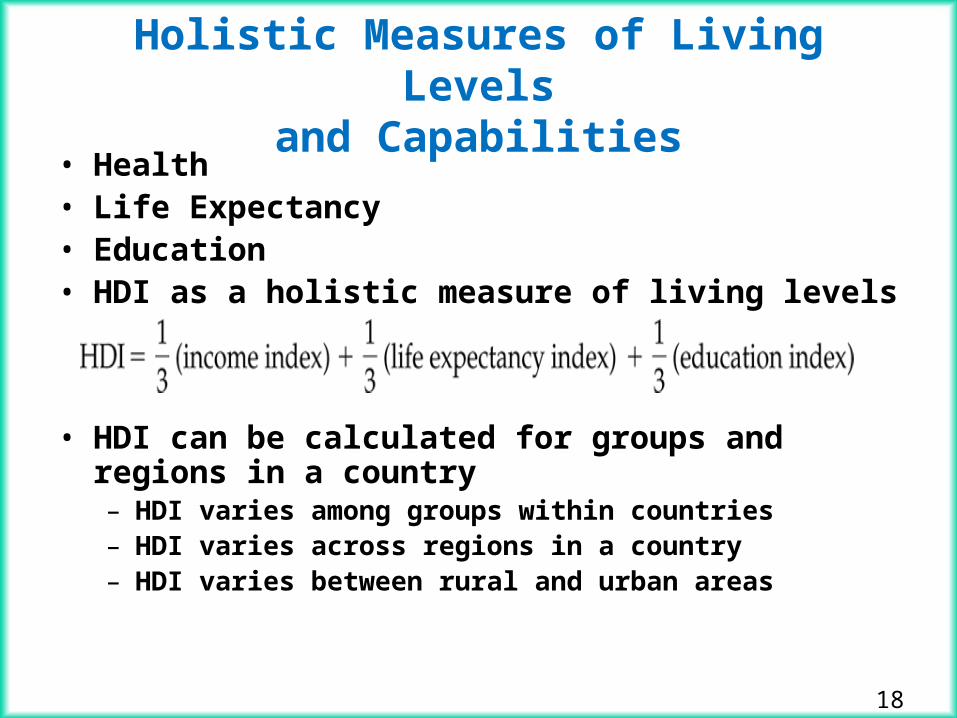
Holistic Measures of Living Levelsand Capabilities
• Health• Life Expectancy• Education • HDI as a holistic measure of living levels
• HDI can be calculated for groups and regions in a country– HDI varies among groups within countries– HDI varies across regions in a country – HDI varies between rural and urban areas
19
What is new in the New HDI? 1. Calculating with a geometric mean
• Probably most consequential: The index is now computed with a geometric mean, instead of an arithmetic mean
• A geometric mean is also used to build up the overall education index from its two components
• Traditional HDI added the three components and divided by 3
• New HDI takes the cube root of the product of the three component indexes
• The traditional HDI calculation assumed one component traded off against another as perfect substitutes, a strong assumption
• The reformulation now allows for imperfect substitutability
http://mathforum.org/library/drmath/view/52814.html
20
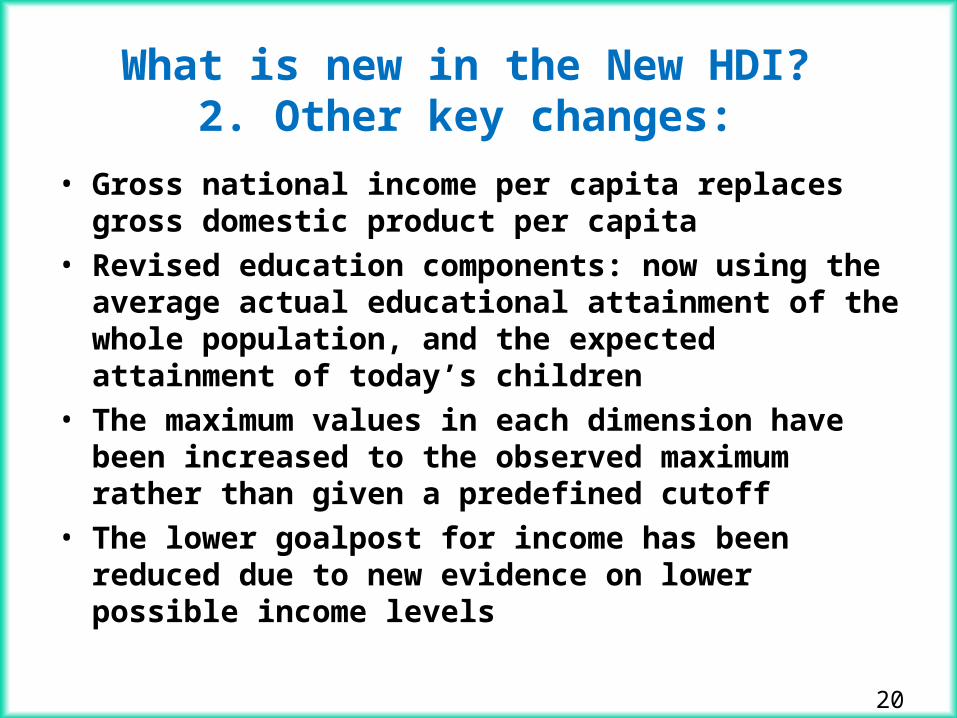
What is new in the New HDI? 2. Other key changes:
• Gross national income per capita replaces gross domestic product per capita
• Revised education components: now using the average actual educational attainment of the whole population, and the expected attainment of today’s children
• The maximum values in each dimension have been increased to the observed maximum rather than given a predefined cutoff
• The lower goalpost for income has been reduced due to new evidence on lower possible income levels
21
HUMAN DEVELOPMENT INDEX WEB SITE
http://hdr.undp.org/en/statistics/hdi
Looking at the Data
MULTIDIMENSIONAL POVERTY INDEX
http://www.ophi.org.uk/policy/multidimensional-poverty-index
22
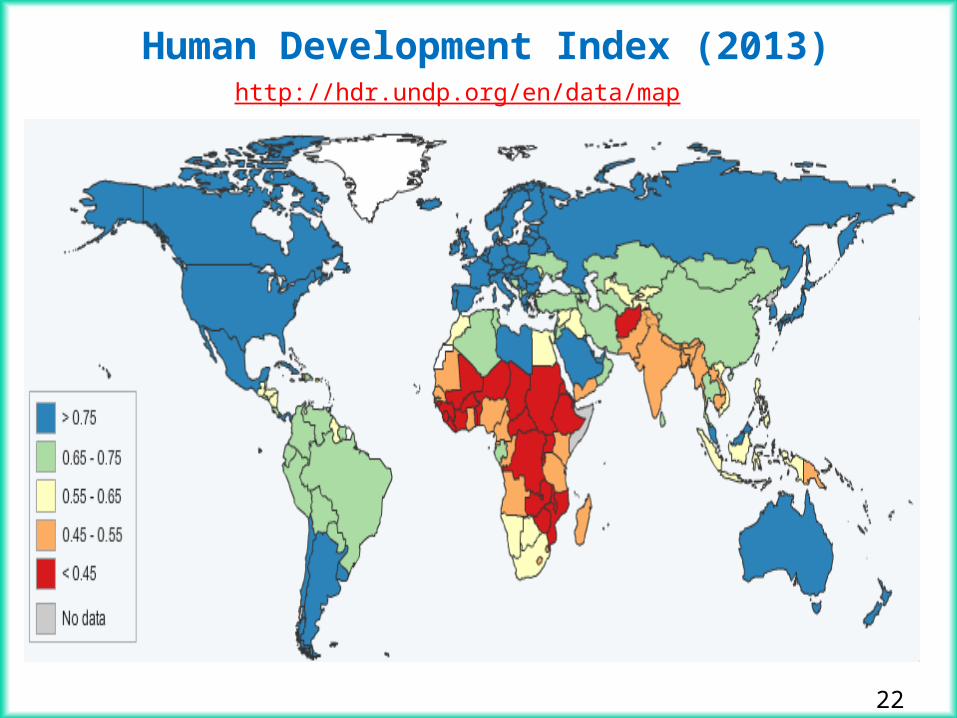
Human Development Index (2013)http://hdr.undp.org/en/data/map
23
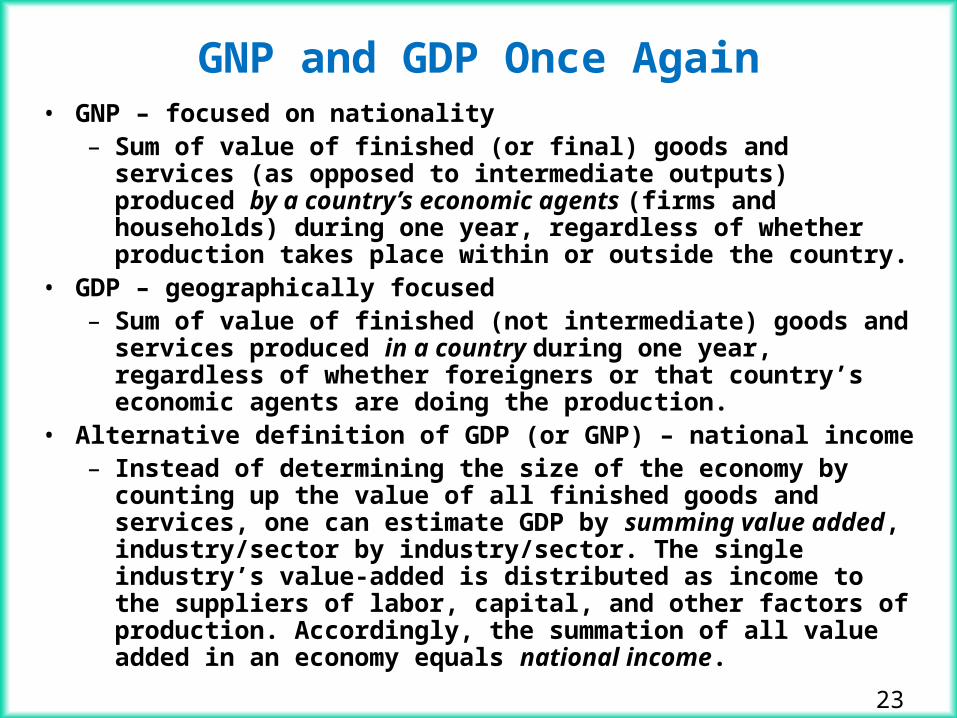
GNP and GDP Once Again• GNP – focused on nationality
– Sum of value of finished (or final) goods and services (as opposed to intermediate outputs) produced by a country’s economic agents (firms and households) during one year, regardless of whether production takes place within or outside the country.
• GDP – geographically focused– Sum of value of finished (not intermediate) goods and services
produced in a country during one year, regardless of whether foreigners or that country’s economic agents are doing the production.
• Alternative definition of GDP (or GNP) – national income– Instead of determining the size of the economy by counting up
the value of all finished goods and services, one can estimate GDP by summing value added, industry/sector by industry/sector. The single industry’s value-added is distributed as income to the suppliers of labor, capital, and other factors of production. Accordingly, the summation of all value added in an economy equals national income.
24
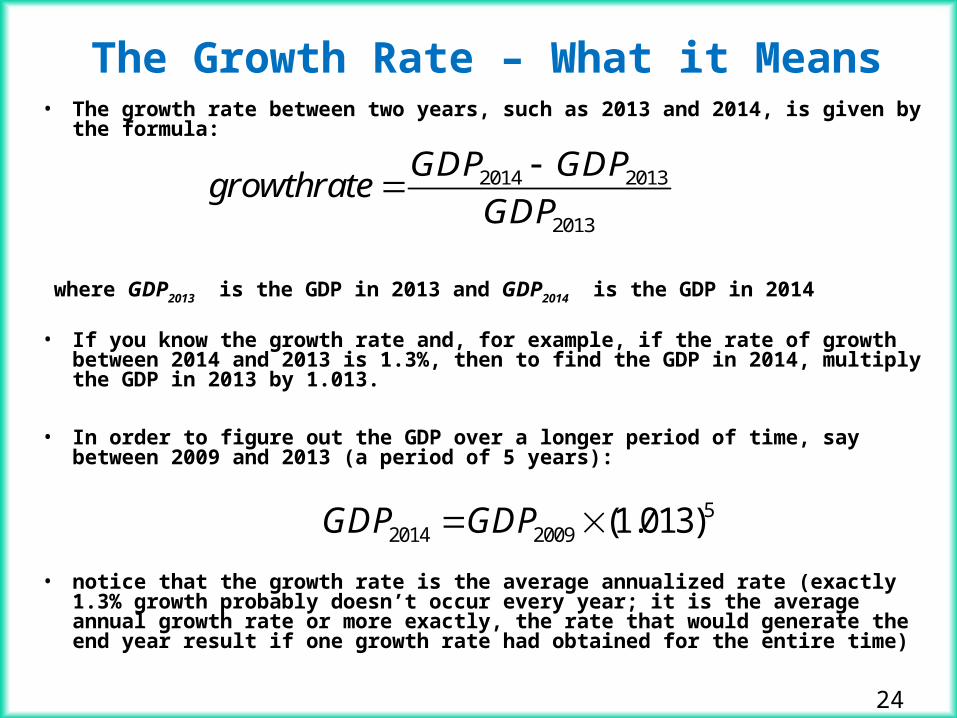
The Growth Rate – What it Means• The growth rate between two years, such as 2013 and 2014, is given by the
formula:
where GDP2013 is the GDP in 2013 and GDP2014 is the GDP in 2014
• If you know the growth rate and, for example, if the rate of growth between 2014 and 2013 is 1.3%, then to find the GDP in 2014, multiply the GDP in 2013 by 1.013.
• In order to figure out the GDP over a longer period of time, say between 2009 and 2013 (a period of 5 years):
• notice that the growth rate is the average annualized rate (exactly 1.3% growth probably doesn’t occur every year; it is the average annual growth rate or more exactly, the rate that would generate the end year result if one growth rate had obtained for the entire time)
2014 2013
2013
GDP GDPgrowthrate
GDP
52014 2009 (1.013)GDP GDP
25
0.00
1.00
2.00
3.00
4.00
5.00
6.00
7.00
8.00
0 1 2 3 4 5 6 7 8 9 10 11 12 13 14 15 16 17 18 19 20
Valu
e in
Year
t
Year
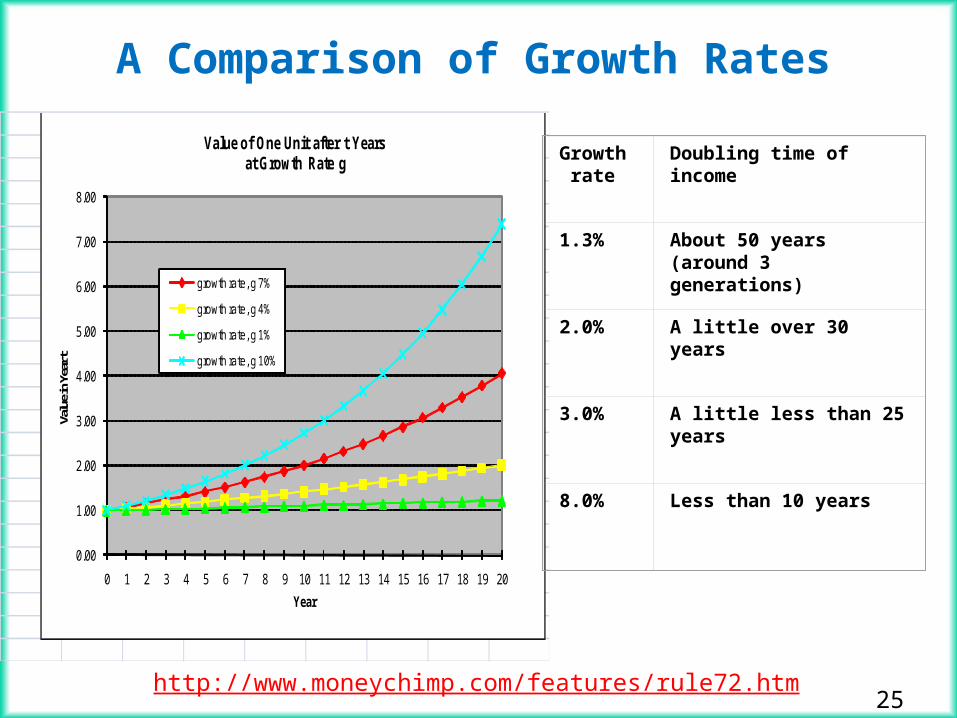
Value of One Unit after t Years at Growth Rate g
growth rate, g 7%
growth rate, g 4%
growth rate, g 1%
growth rate, g 10%
Growth rate
Doubling time of income
1.3% About 50 years (around 3 generations)
2.0% A little over 30 years
3.0% A little less than 25 years
8.0% Less than 10 years
A Comparison of Growth Rates
http://www.moneychimp.com/features/rule72.htm
26
Looking at Purchasing Power Parity(PPP)
• In the 1970s economists considered if official income numbers were a good reflection of differences between countries
• For example, an income of $200 per year would not be enough to live in the US (not even necessities could be purchased on this income)
• Thus, converting the income in one country to US dollars using the market exchange rate gives distorted numbers – the market exchange rate is not a good reflection of the purchasing power of a given currency in another country
• For instance, the market exchange rate does not include goods that cannot be internationally traded, such as food and some services
Give Examples
27
Exchange Rate Conversion• Many services (e.g., haircuts) and more than a few finished goods tend not to be
traded internationally. This complicates the task of comparing per-capita GDP in one country with that of another country, as is required for the systematic analysis of economic development.
• Suppose, for example, that a haircut in Hanoi, Vietnam costs 60,000 dong and the price of the same haircut in Baltimore is $20. Converting the former price using the exchange rate of 20, 000 dong yields $3. Obviously, this discounts the value of nontraded services produced and consumed in Hanoi (or, equivalently, exaggerates the value of the same services produced and consumed in Baltimore).
• Purchasing-power parity estimates of GDP correct for this distortion.– Standard measure of dollar-equivalent GDP: Multiply GDP, as expressed in
local currency, by exchange rate.– Purchasing-power parity measure: Evaluate all finished goods and services
using U.S. prices.
28
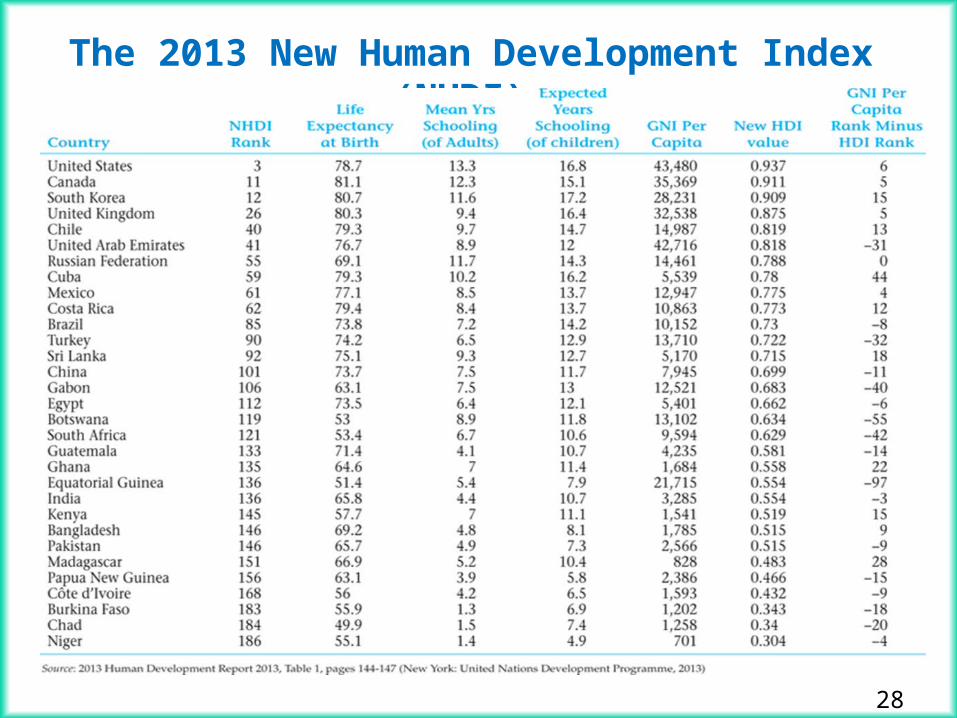
The 2013 New Human Development Index (NHDI),
29
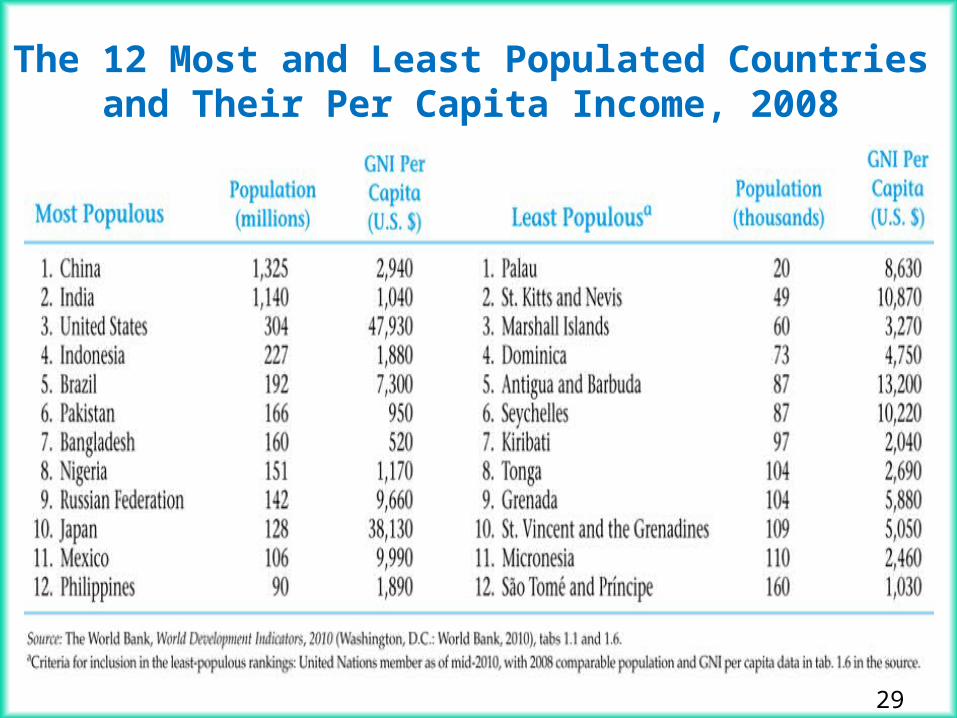
The 12 Most and Least Populated Countries and Their Per Capita Income, 2008
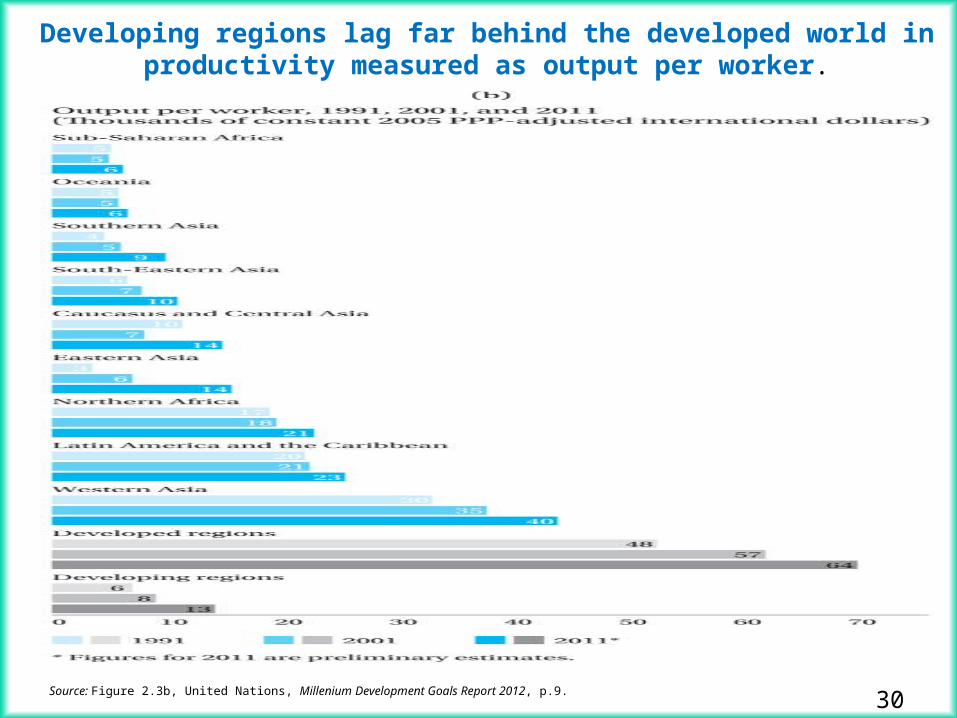
30Source: Figure 2.3b, United Nations, Millenium Development Goals Report 2012, p.9.
Developing regions lag far behind the developed world in productivity measured as output per worker.
31
Are Living Standards of Developing and Devolved Nations Converging?
• Evidence of unconditional convergence is hard to find
• But there is increasing evidence of “per capita income convergence,” weighting changes in per capita income by population size
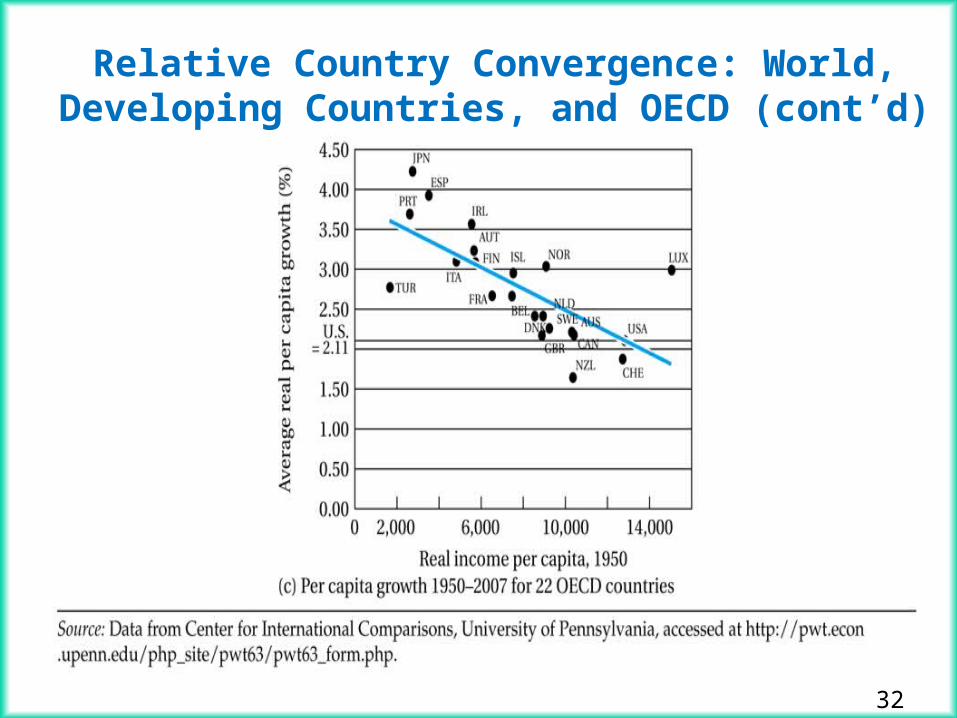
32
Relative Country Convergence: World, Developing Countries, and OECD (cont’d)
33
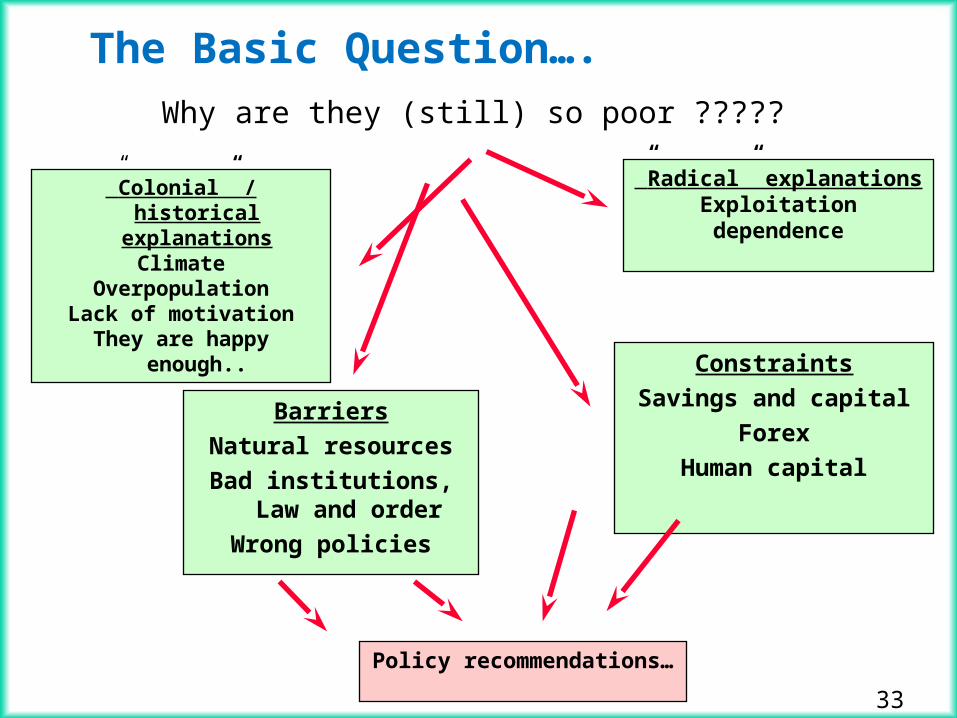
The Basic Question….
Why are they (still) so poor ?????
”Radical” explanationsExploitationdependence
”Colonial” / historical explanations
ClimateOverpopulation
Lack of motivationThey are happy
enough.. ConstraintsSavings and capital
ForexHuman capital
BarriersNatural resourcesBad institutions,
Law and orderWrong policies
Policy recommendations…
34
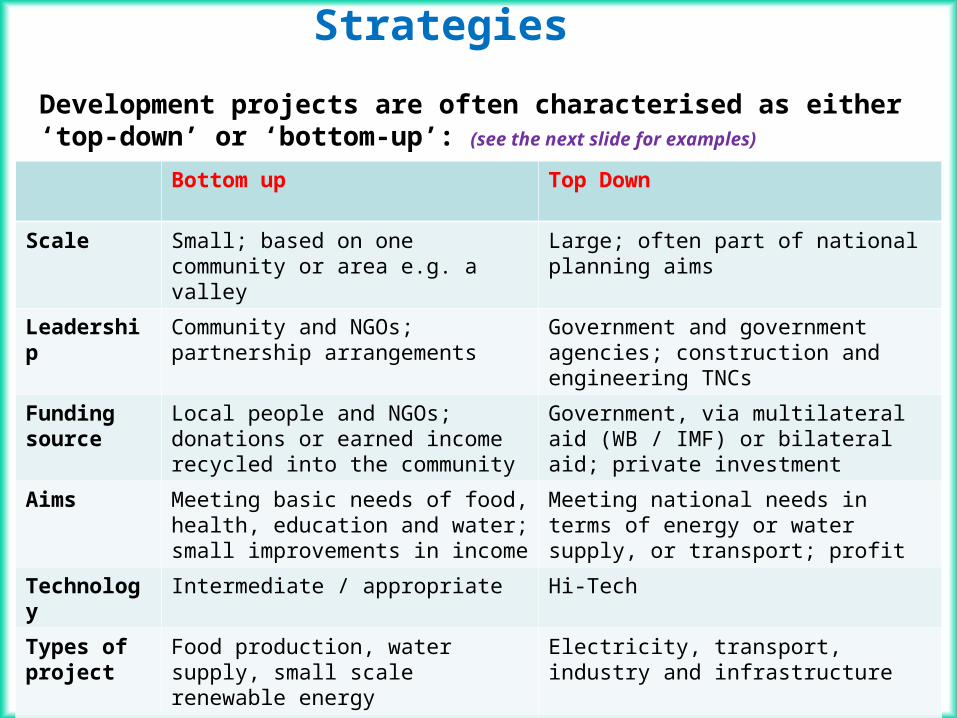
Strategies Development projects are often characterised as either ‘top-down’ or ‘bottom-up’: (see the next slide for examples)
Bottom up Top Down
Scale Small; based on one community or area e.g. a valley
Large; often part of national planning aims
Leadership Community and NGOs; partnership arrangements
Government and government agencies; construction and engineering TNCs
Funding source
Local people and NGOs; donations or earned income recycled into the community
Government, via multilateral aid (WB / IMF) or bilateral aid; private investment
Aims Meeting basic needs of food, health, education and water; small improvements in income
Meeting national needs in terms of energy or water supply, or transport; profit
Technology Intermediate / appropriate Hi-Tech
Types of project
Food production, water supply, small scale renewable energy
Electricity, transport, industry and infrastructure
Winners Local people; the environment Industry, urban dwellers, TNCs
Losers Usually are none Environment, rural people
35
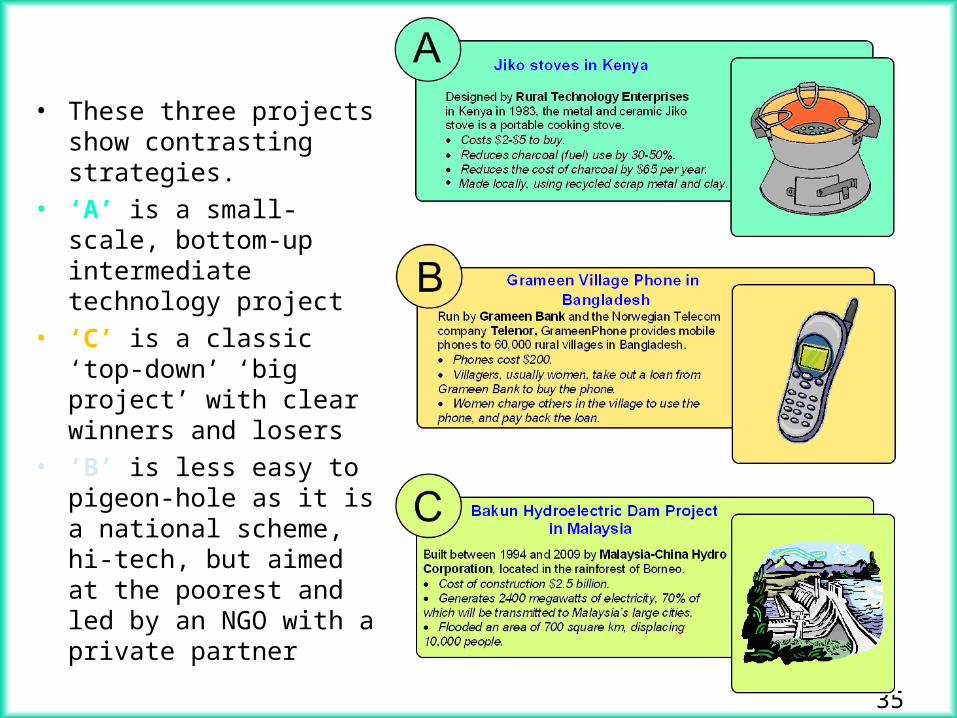
• These three projects show contrasting strategies.
• ‘A’ is a small-scale, bottom-up intermediate technology project
• ‘C’ is a classic ‘top-down’ ‘big project’ with clear winners and losers
• ‘B’ is less easy to pigeon-hole as it is a national scheme, hi-tech, but aimed at the poorest and led by an NGO with a private partner
36
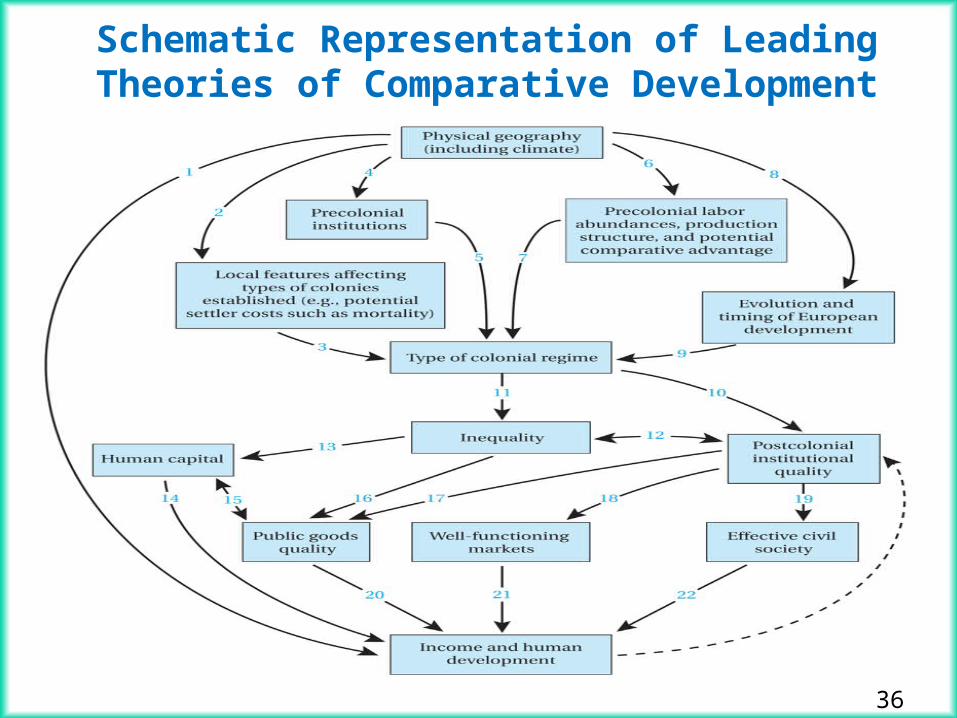
Schematic Representation of Leading Theories of Comparative Development
37
Nature and Role of Economic Institutions
• Institutions provide “rules of the game” of economic life
• Provide underpinning of a market economy• Include property rights; contract enforcement• Can work for improving coordination, • Restricting coercive, fraudulent and anti-competitive
behavior • Providing access to opportunities for the broad
population-• Constraining the power of elites, and managing conflict • Provision of social insurance • Provision of predictable macroeconomic stability
38
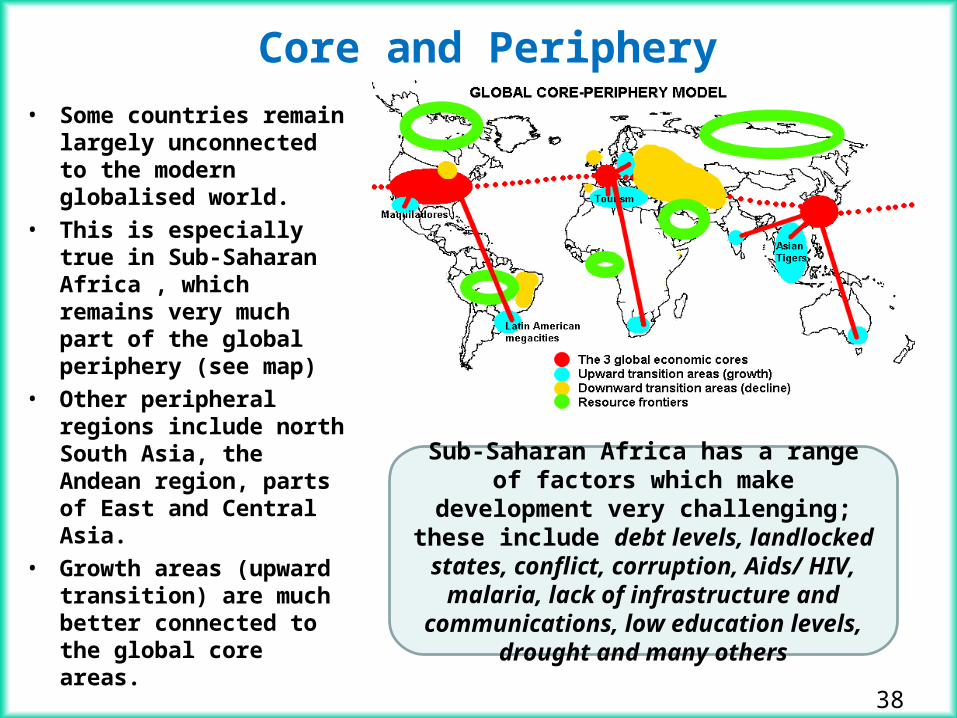
Core and Periphery
• Some countries remain largely unconnected to the modern globalised world.
• This is especially true in Sub-Saharan Africa , which remains very much part of the global periphery (see map)
• Other peripheral regions include north South Asia, the Andean region, parts of East and Central Asia.
• Growth areas (upward transition) are much better connected to the global core areas.
Sub-Saharan Africa has a range of factors which make development very challenging; these include debt levels, landlocked states, conflict, corruption,
Aids/ HIV, malaria, lack of infrastructure and communications, low education
levels, drought and many others
39
40
Concepts for Review• Absolute poverty• Brain drain• Capital stock• Convergence• Crude birth rate• Dependency burden• Depreciation (of the capital
stock)• Divergence• Economic Institutions• Free trade• Gross domestic product (GDP)• Gross national income (GNI)• Human capital
• Human Development Index (HDI)
• Incomplete information
• Infrastructure
• Least developed countries
• Low-income countries (LICs)
• Middle-income countries
• Newly industrializing countries (NICs)
• Purchasing power parity (PPP)
• Resource endowment
• Terms of trade
• Value added