Embed Size (px)
Citation preview
i INSETA Sector Skills Plan 2017/18
1 August 2017
ii INSETA Sector Skills Plan 2017/18
FOREWORD
It is a pleasure to present the 2017/18 Sector Skills Plan (SSP) on behalf of INSETA to the DHET. New theoretical input has been added throughout. The Executive Summary highlights the content of the five chapters and is aligned to the objectives of the National Development Plan. A separate section on Research Methodology has been positioned before Chapter 1 as requested by the Department. Chapter 3 has been renamed and restructured according to the new DHET requirements, and the PIVOTAL List is also included in this chapter. The Continuous Improvement Plan (CIP) has been rewritten according to the DHET CIP matters template. In terms of what has changed in relation to the CIP of 2016: INSETA has embarked on a Strategic Integrated Project in collaboration with GIZ (skills for green jobs), the Construction SETA, the short-term insurance industry and the Department of Energy. The aim of this project is to replace electric geysers tied to insurance claims with solar water heating systems. This project provides opportunities for apprentice and qualified plumbers to pursue further qualifications and training through a partnership through the TVET colleges. In this year’s submission of the SSP, INSETA has positioned itself to become an authority on labour market analysis in the insurance sector. This has been initiated through a strong employer-led process which will continue. INSETA has furthermore up-skilled its internal capacity on Labour Market systems and tools that assist with research development and data analysis. We are certain that the current form of the SSP sets out an agreed sector strategy to address skills needs. INSETA, in turn, has a central role to play in supporting the insurance sector to meet its skills needs. We are confident that this SSP will add impetus to the skills development initiatives activated by our SETA and give members direction. The 2017 SSP underpins the industry strategies where they exist and serves as a driving force to improve skills planning and increased employment opportunities within the sector. This SSP also underpins the government’s agenda of reducing unemployment, combating inequality and alleviating poverty. We have no doubt that this SSP will become the key planning tool for skills forecasting and development within the insurance and related services sector. The aim of this SSP is to ensure that this document is used as a source of reference by all stakeholders concerned with the workforce profile of the sector, the supply and demand for skills within it, employment trends, transformation and various occupational levels, and response to the national agenda. The 2017/18 SSP is rich in evidence-based research, compounded by a wealth of stakeholder inputs. It is focused on the state of skills in the sector and contains research powerful enough to provide clear and reliable direction to INSETA for discretionary grant spend to support industry and economic goals. The Board of INSETA has risen to the challenge of ensuring a credible, insightful and high quality SSP for 2017/2018 that reflects the complex dynamics of the insurance sector and the challenges in meeting national, economic and social goals. To this end, we endorse this Sector Skills Plan of 2017.
iii INSETA Sector Skills Plan 2017/18
ACRONYMS
ABIB Association for Black Insurance Brokers
ASISA Association of Savings and Investment South Africa
ATR Annual Training Report
BATSETA Council of Retirement Funds for South Africa
B-BBEE Broad-Based Black Economic Empowerment
BBF Black Brokers Forum
BHF Board of Healthcare Funders
BIAC Black Insurance Advisory Council
BUSOSA Burial Society of South Africa
CETA Construction Education and Training Authority
CGFRI Government Framework Research Institute
ETQA Education and Training Quality Assurer
EWSETA Energy Sector Education and Training Authority
FAIS Financial Advisory Intermediary Services
FET Further Education and Training
FIA Financial Advisory and Intermediary Association
FPI Financial Planning Institute
FSB Financial Services Board
FSC Financial Sector Charter
FSP Financial Service Providers
GDP Gross Domestic Product
GIZ German Cooperation (Deutsche Gesellschaft für Internationale Zusammenarbeit)
HRDSA Human Resource Development Strategy for South Africa
ICT Information and Communication Technologies
IISA Insurance Institute of South Africa
ILA Institute of Loss Adjustors
INSETA Insurance Sector Education and Training Authority
IOPSA Institute of Plumbers South Africa
NC(V) National Certificate (Vocational)
NDP National Development Plan
NGP National Growth Path
NQF National Qualifications Framework
NSDS National Skills Development Strategy
NSWHP National Solar Water Heating Programme
OFO Organising Framework for Occupations
PIRB Plumbing Industry Registration Board
PIVOTAL Professional, Vocational, Technical and Academic Learning
QCTO Quality Council for Trade and Occupations
SAFOBS South African Funeral Business Services
SAIA South African Insurance Association
SAQA South African Qualifications Authority
SARB South African Reserve Bank
SAUMA South African Underwriting Managers Association
SDP Skills Development Provider
SETA Sector Education and Training Authority
SIC Standard Industrial Classification
SME Small and Micro-Enterprises
SSP Sector Skills Plan
SWH Solar Water Heating
TVET Technical, Vocational, Education and Training (colleges)
WSP Workplace Skills Plan

iv INSETA Sector Skills Plan 2017/18
EXECUTIVE SUMMARY
The INSETA sector skills plan (SSP) can be referred to as a “programme of action” for INSETA. This goes hand-in-hand with the common goal of all South Africans, the National Development Plan (NDP), which offers a long-term perspective. As a long-term strategic plan, the NDP serves four broad objectives:
Providing overarching goals for what INSETA would like to achieve by 2030
Building consensus on the key obstacles to achieving these goals and what needs to be done to overcome those obstacles
Providing a shared long-term strategic framework as a base for more detailed planning to advance the long-term goals set out in the NDP
Creating a basis for decision-making on best use of limited resources. The NDP aims to ensure that all South Africans attain a decent standard of living through the elimination of poverty and reduction of inequality. The INSETA SSP complements the vision of the NDP by explaining the profile of the insurance sector and the role of INSETA and its partners in implementing various programmes. Detailed information is provided on how INSETA disburses its funds in terms of the Skills Development Levies Act. Within this document, great emphasis is placed on INSETA’s commitment to reducing unemployment in the South African economy through the modification of the insurance sector. The focus is on the issue of scarce and critical skills, and dealing with the high unemployment rate, which is largely due to the mismatch of skills supplied by our labour force and what the labour market demands. INSETA has also clarified its intentions and rules of engagement with the public by emphasising its commitment to working collectively with TVET colleges, universities, and the private and public sectors with the framework of theory and practice. Prioritising and supporting the objectives of the insurance sector allows for curriculum and qualification design to be more responsive to industry needs. This can be achieved through:
Providing quality lecturers, facilitators or trainers
Providing access to appropriate learning material
Providing relevant student information and support
Developing partnerships between the public and private sectors
Ensuring safe and productive workplaces conducive to quality skills and training provision that is responsive to industry demands.
In this year’s SSP, the focus has not changed from the previous National Skills Development Strategy (NSDS III). However, an interactive skills planning approach has led to new performance evaluation programmes being put in place. There must be a broad initiative where the focus is not only on the needs of the insurance sector but also encouraging an educational programme that will bridge the gap between the level of competence needed by the industry and the quality of students supplied by the system.
v INSETA Sector Skills Plan 2017/18
Chapter 1 examines the ten Sector Industrial Classification (SIC) codes that are represented by INSETA, these being Short-term, Long-term, Reinsurance, Pension Funds (except compulsory social security), Health Care, Funeral, Unit Trusts, Insurance and Pension Funds, and Risk Management and Auxiliaries (including brokers and intermediaries). INSETA has examined the sub-sectors and clustered all 10 into three categories, namely: Short-Term Insurance, Long-Term Insurance and Collective Investments. This chapter focuses on the scope of coverage within all sub-sectors and gives an analysis of the major role players, the economic performance, and a detailed overview of employer and employee profiles within the sector. INSETA data, and noticeable trends and progress were identified around transformation at certain occupational levels. Chapter 2 includes a discussion of the change drivers in relation to supply and demand, and the alignment with national strategies and plans. This chapter includes a table which outlines the factors that affect skills demand and supply in the sector and the implications for skills planning. It also includes alignment with the national strategies and plans such as the National Development plan, New Growth Path, HRD Strategy, the White Paper on Post-School Education and Training and Strategic Integrated Projects in the Office of the Presidency. Chapter 3 shows the occupations that are hard to fill across 22 large and medium companies and 20 small companies over a six to 12 month period. The critical skill gaps and the top 10 scarce and critical skills occupations for 2017/18 are highlighted. The challenge of skills shortages shows that there is a growing mismatch between the skills employers need and the talent available. This chapter also explains some of the supply problems faced by employers, the impact of skills shortages on insurance companies and includes a PIVOTAL list. Chapter 4 highlights all existing partnerships with the SETA, and the successes and challenges of these are explained. What is in the pipeline with regard to new partnerships is also discussed in this chapter. The partnerships revolve around the following: TVET colleges, Universities, Employers who provide workplace-based experience, Professional Bodies, Industry Associations and other SETAs. A brief discussion is included on the successful and unsuccessful partnerships. For the most part, INSETA’s partnerships are working well and beneficiaries are pleased with the progress made thus far. In Chapter 5, important findings from previous chapters are identified. These findings were used to inform the skills priority actions for the sector as stipulated in this chapter. The measures that INSETA has taken to support national strategies and plans are discussed. In summary, Chapters 1 to 5 detail the updates since the 2016/17 SSP submission, and the focus now will be on planning for the skills shortages and addressing these in the SETA’s upcoming strategic session.
vi INSETA Sector Skills Plan 2017/18
TABLE OF CONTENTS
FOREWORD ............................................................................................................................................................. ii ACRONYMS ............................................................................................................................................................ iii EXECUTIVE SUMMARY ........................................................................................................................................... iv TABLE OF CONTENTS ............................................................................................................................................. vi LIST OF FIGURES ................................................................................................................................................... vii LIST OF TABLES ..................................................................................................................................................... vii RESEARCH PROCESS AND METHODS ................................................................................................................... viii
1 Introduction ............................................................................................................................................ viii 2 Research Conducted ............................................................................................................................... viii 3 Methodology ............................................................................................................................................. x 4 Definitions of Terms Used in this Document ............................................................................................ xi 5 Conclusion ................................................................................................................................................ xi
CHAPTER ONE: SECTOR PROFILE ............................................................................................................................ 1
1 Introduction ............................................................................................................................................... 1 2 Scope of Coverage ..................................................................................................................................... 1 3 Key Role-Players ........................................................................................................................................ 3 4 Economic Performance ............................................................................................................................. 5 5 Employer Profile ........................................................................................................................................ 7 6 Labour Market Profile................................................................................................................................ 8 7 Conclusion ............................................................................................................................................... 15
CHAPTER TWO: KEY SKILLS ISSUES ....................................................................................................................... 16
1 Introduction ............................................................................................................................................. 16 2 Change Drivers ........................................................................................................................................ 16 3 Key Factors Affecting Skills Demand and Supply and Implications for Skills Planning ............................ 17 4 Alignment with National Strategies and Plans ........................................................................................ 18 5 Conclusion ............................................................................................................................................... 20
CHAPTER THREE: OCCUPATIONAL SHORTAGES AND SKILLS GAPS ....................................................................... 21
1 Introduction ............................................................................................................................................. 21 2 Hard-to-Fill Vacancies .............................................................................................................................. 21 3 A Composite Profile of Skills Gaps in the Insurance Sector: 2015-2019 .................................................. 24 4 Extent and Nature of Supply ................................................................................................................... 28 5 PIVOTAL List ............................................................................................................................................. 34 6 Conclusion ............................................................................................................................................... 36
CHAPTER FOUR: SECTOR PARTNERSHIPS ............................................................................................................. 38
1 Introduction ............................................................................................................................................. 38 2 Existing Partnerships ............................................................................................................................... 38 3 New Partnerships .................................................................................................................................... 42 4 Conclusion ............................................................................................................................................... 42
CHAPTER FIVE: SKILLS PRIORITY ACTIONS ............................................................................................................ 43
1 Introduction ............................................................................................................................................. 43 2 Findings from Previous Chapters ............................................................................................................. 43 3 Recommended Actions ............................................................................................................................ 45 4 Conclusion ............................................................................................................................................... 46
REFERENCE LIST .................................................................................................................................................... 48
vii INSETA Sector Skills Plan 2017/18
LIST OF FIGURES Figure 1: The insurance sector environment .......................................................................................................... 3 Figure 2: Key role-players in the insurance sector environment ............................................................................ 5 Figure 3: Sectoral composition of the South African economy in 2016 ................................................................. 6 Figure 4: Quarterly changes in the finance and business sector’s GDP contribution (percentage) ....................... 6 Figure 5: Employers registered with INSETA versus WSPs received per sub-sector in 2017.................................. 7 Figure 6: Provincial breakdown of INSETA employers by province and year 2016/2017 ....................................... 8 Figure 7: Employment turnover for Small ............................................................................................................ 31 Figure 8: Employment turnover for Small companies .......................................................................................... 31 Figure 9: Educational levels by race and gender – NQF levels 1, 2 and 10 ........................................................... 32 Figure 10: Educational levels by race and gender – NQF levels 3, 4, 5 and 6 ....................................................... 32 Figure 11: Educational levels by race and gender – NQF levels 7, 8 and 9 ........................................................... 33 Figure 12: INSETA’s current partnerships and related projects............................................................................ 38 Figure 13: INSETA’s model of an ideal partnership .............................................................................................. 41
LIST OF TABLES Table 1: Research conducted in preparing INSETA’s 2017/2018 SSP .................................................................. viii Table 2: Active employers and WSPs submitted – 2016/17 vs 2017/18 ................................................................ x Table 3: The sub-sectors within the insurance sector and their related SIC codes ................................................ 1 Table 4: Key role-players in the insurance sector ................................................................................................... 3 Table 5: Percentage of employers per sub-sector and employer size .................................................................... 7 Table 6: Geographical distribution of employees 2017 by province and employer size ........................................ 9 Table 7: Employees per major occupational group and employer size .................................................................. 9 Table 8: Age of employees per occupational group ............................................................................................. 10 Table 9: Employee race and gender by occupational group ................................................................................ 10 Table 10: NSDS III transformational imperatives – focus on race and disability in the sector ............................. 11 Table 11: Employee race percentage per major sub-sector ................................................................................. 12 Table 12: Employees’ age percentage per major sub-sector ............................................................................... 12 Table 13: Employees’ gender percentage per major sub-sector .......................................................................... 13 Table 14: Disabled employees percentage per major sub-sector ........................................................................ 13 Table 15: Qualifications of male employees in the sector by race and employer size (percentage) ................... 14 Table 16: Qualifications of female employees in the sector by race and employer size (percentage) ................ 14 Table 17: Change drivers affecting the insurance sector ..................................................................................... 16 Table 18: Factors affecting skills demand and supply in the sector and their implications for skills planning .... 17 Table 19: Top hard-to-fill vacancies for large and medium-sized employers in the short- and long-term insurance sub-sectors ........................................................................................................................................... 21 Table 20: Top hard-to-fill vacancies for small- and micro-sized employers in the short- and long-term insurance sub-sectors ........................................................................................................................................................... 23 Table 21: Skills gaps associated with the financial investment advisor occupation ............................................. 24 Table 22: Skills gaps associated with the insurance agent occupation ................................................................ 24 Table 23: Skills gaps associated with the sales manager occupation ................................................................... 25 Table 24: Skills gaps associated with the outbound contact centre consultant occupation ................................ 25 Table 25: Skills gaps associated with the commercial sales representative occupation ...................................... 25 Table 26: Skills gaps associated with the sales and marketing manager occupation ........................................... 26 Table 27: Skills gaps associated with the developer programmer occupation..................................................... 26 Table 28: Skills gaps associated with the actuary occupation .............................................................................. 26 Table 29: Skills gaps associated with the insurance administrator occupation .................................................... 27 Table 30: Top 10 scarce skills occupations for 2017/18 ....................................................................................... 27 Table 31: Throughput data for INSETA’s education and training provision programmes – 2015/16 & 2016/17 29 Table 32: INSETA's PIVOTAL List 2017/18 ............................................................................................................. 34 Table 33: Description of INSETA’s current partnerships and their status ............................................................ 38 Table 34: INSETA’s 2017 approved spend with TVET College partners, and learners to be supported through these partnerships ................................................................................................................................................ 40 Table 35: INSETA’s planned partnerships ............................................................................................................. 42

viii INSETA Sector Skills Plan 2017/18
RESEARCH PROCESS AND METHODS
1 Introduction
INSETA has conducted various research initiatives and data analyses over the last three years. Care was taken to use a variety of sources and broaden the scope of grassroots consultations. This SSP has been developed with a high level of stakeholder participation, which enhanced the authoritative and focused nature of the research. The information that underpins the 2017/2018 SSP is therefore both credible and insightful.
2 Research Conducted
2.1 Various Research Initiatives
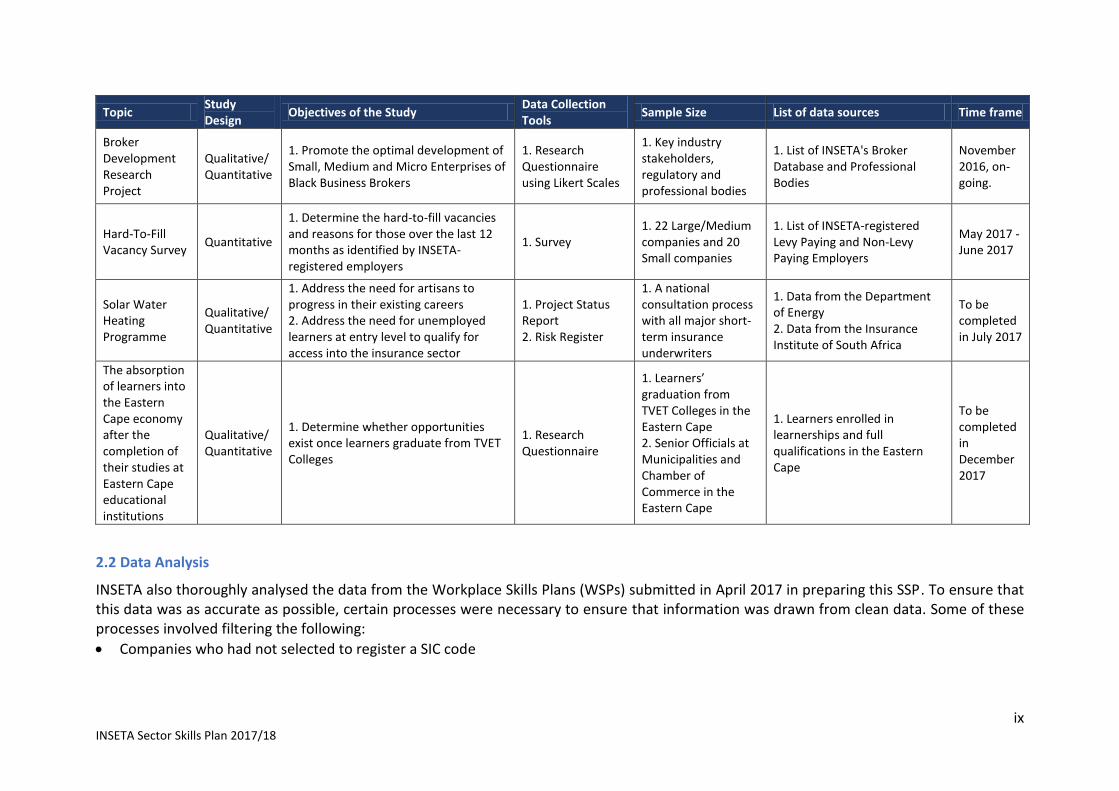
Table 1 below presents the comprehensive range of research initiatives that INSETA carried out in order to gather meaningful data for the 2017/2018 SSP. Table 1: Research conducted in preparing INSETA’s 2017/2018 SSP
Topic Study Design
Objectives of the Study Data Collection Tools
Sample Size List of Data Sources Time Frame
Skills Availability and Transformation in the Insurance Industry
Qualitative/ Quantitative
1. Determine the status of transformation in the sub-sectors of the insurance industry served by INSETA 2. Determine what skills are available and identify skills shortages 3. Highlight areas that offer job creation opportunities 4. Identify gaps between existing qualifications and skills and those required 5. Define industry expectations for addressing these gaps
1. Desktop Research 2. Interview Protocols (discussion guide and telephonic questionnaire) 3. Web-based Survey
1. 228 Senior Representatives of Large and Medium Levy-Paying companies 2. 4000 Small Levy-Paying and Non-Levy-Paying companies, including Micro Enterprises
1. 2014/15 WSP and ATR Data extracted from SARS 2. South African Underwriting Managers Association (SAUMA) Database from the South African Insurance Association 3. The Financial Intermediaries Association Qualifications from the National Qualifications Framework
March 2014 - December 2015
ix INSETA Sector Skills Plan 2017/18
Topic Study Design
Objectives of the Study Data Collection Tools
Sample Size List of data sources Time frame
Broker Development Research Project
Qualitative/ Quantitative
1. Promote the optimal development of Small, Medium and Micro Enterprises of Black Business Brokers
1. Research Questionnaire using Likert Scales
1. Key industry stakeholders, regulatory and professional bodies
1. List of INSETA's Broker Database and Professional Bodies
November 2016, on-going.
Hard-To-Fill Vacancy Survey
Quantitative
1. Determine the hard-to-fill vacancies and reasons for those over the last 12 months as identified by INSETA-registered employers
1. Survey 1. 22 Large/Medium companies and 20 Small companies
1. List of INSETA-registered Levy Paying and Non-Levy Paying Employers
May 2017 - June 2017
Solar Water Heating Programme
Qualitative/ Quantitative
1. Address the need for artisans to progress in their existing careers 2. Address the need for unemployed learners at entry level to qualify for access into the insurance sector
1. Project Status Report 2. Risk Register
1. A national consultation process with all major short-term insurance underwriters
1. Data from the Department of Energy 2. Data from the Insurance Institute of South Africa
To be completed in July 2017
The absorption of learners into the Eastern Cape economy after the completion of their studies at Eastern Cape educational institutions
Qualitative/ Quantitative
1. Determine whether opportunities exist once learners graduate from TVET Colleges
1. Research Questionnaire
1. Learners’ graduation from TVET Colleges in the Eastern Cape 2. Senior Officials at Municipalities and Chamber of Commerce in the Eastern Cape
1. Learners enrolled in learnerships and full qualifications in the Eastern Cape
To be completed in December 2017
2.2 Data Analysis
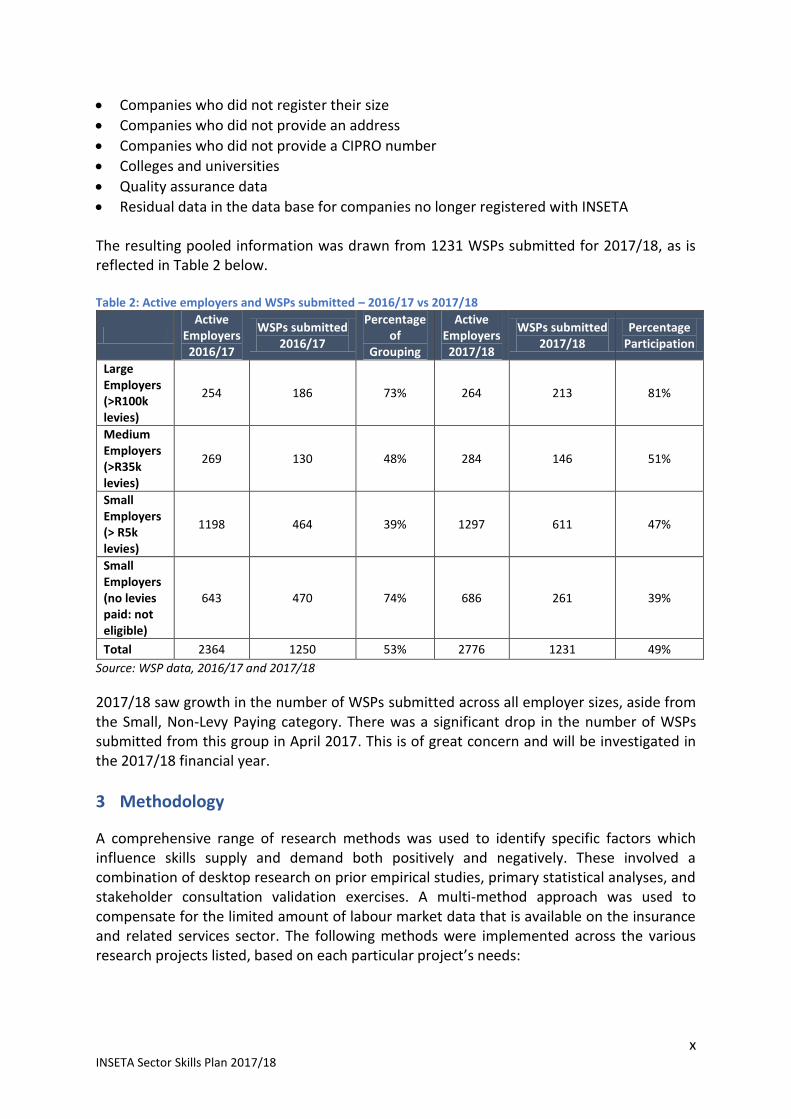
INSETA also thoroughly analysed the data from the Workplace Skills Plans (WSPs) submitted in April 2017 in preparing this SSP. To ensure that this data was as accurate as possible, certain processes were necessary to ensure that information was drawn from clean data. Some of these processes involved filtering the following:
Companies who had not selected to register a SIC code
x INSETA Sector Skills Plan 2017/18
Companies who did not register their size
Companies who did not provide an address
Companies who did not provide a CIPRO number
Colleges and universities
Quality assurance data
Residual data in the data base for companies no longer registered with INSETA The resulting pooled information was drawn from 1231 WSPs submitted for 2017/18, as is reflected in Table 2 below. Table 2: Active employers and WSPs submitted – 2016/17 vs 2017/18
Active
Employers 2016/17
WSPs submitted 2016/17
Percentage of
Grouping
Active Employers 2017/18
WSPs submitted 2017/18
Percentage Participation
Large Employers (>R100k levies)
254 186 73% 264 213 81%
Medium Employers (>R35k levies)
269 130 48% 284 146 51%
Small Employers (> R5k levies)
1198 464 39% 1297 611 47%
Small Employers (no levies paid: not eligible)
643 470 74% 686 261 39%
Total 2364 1250 53% 2776 1231 49%
Source: WSP data, 2016/17 and 2017/18
2017/18 saw growth in the number of WSPs submitted across all employer sizes, aside from the Small, Non-Levy Paying category. There was a significant drop in the number of WSPs submitted from this group in April 2017. This is of great concern and will be investigated in the 2017/18 financial year.
3 Methodology
A comprehensive range of research methods was used to identify specific factors which influence skills supply and demand both positively and negatively. These involved a combination of desktop research on prior empirical studies, primary statistical analyses, and stakeholder consultation validation exercises. A multi-method approach was used to compensate for the limited amount of labour market data that is available on the insurance and related services sector. The following methods were implemented across the various research projects listed, based on each particular project’s needs:
xi INSETA Sector Skills Plan 2017/18
Purposive sample selection - The main goal of purposive sampling is to focus on particular characteristics of a population that are of interest
Expert sampling - Expert sampling is a type of purposive sampling technique that is used when research needs to glean knowledge from individuals that have particular expertise
Expert elicitation - Particular expertise is investigated and forms the basis of a research project which requires a focus on individuals with specific expertise
Qualitative - Exploratory research entails an in-depth investigation into the topic at hand to define, describe and enhance understanding of the topic
Explanatory (statistical) research - Explanatory research provides data for extrapolating the results to populations and providing “hard data” (numbers)
Qualitative research - This research is concerned with “...developing explanations or gathering of opinions...”
Triangulation - This is an analysis device for enhancing the credibility, accuracy and persuasiveness of the research across a multiplicity of different industry sectors
Thematic analysis - The procedure of thematic networks provides a technique for breaking up text, and finding within it explicit rationalisations and their implicit significations
Each method was based on the level of insight it provided to facilitate a comprehensive labour market analysis. The skills division at INSETA uses multiple sources of data, especially qualitative data, to complement the quantitative WSP/ATR data; qualitative sources included key stakeholder meetings. Desktop analysis of skills shortages as identified from PESTEL empirical data was performed. The hard-to-fill vacancy survey was conducted by INSETA in order to contribute value to the Employer Survey which in all likelihood is going to commence in April 2018 under the auspices of the Department of Higher Education and Training. This section thus outlines the research methodology of both the human capital study and the SSP research conducted by INSETA.
4 Definitions of Terms Used in this Document
Black – Refers to Indian, African and Coloured race groups
Indian – Refers to Indian and Asian race groups
Youth – Refers to people under the age of 35
5 Conclusion
INSETA is satisfied that its research process and methods in compiling this SSP were thorough and varied, and have led to information that is accurate and meaningful. That being said, lessons have been learned which will affect the research process and methodology underpinning the next SSP.
4.1 Proposed Future Projects
The research completed over the past three years has raised issues which INSETA believes need further investigation. The following research will be undertaken during the course of 2017/18 to obtain information that will improve INSETA’s skills and service development within the insurance sectors:
xii INSETA Sector Skills Plan 2017/18
Investigation as to the decline in the submission of WSP data by active, Small, Non-Levy Paying employers This research will look at the reasons behind the significant decline in the number of active, Small, Non-Levy Paying employers who are submitting WSP data. Respondents who submitted WSP data in 2016 but not in 2017 will be approached and interviewed telephonically using a semi-structured qualitative research methodology. Analysis will be completed using a thematic pattern analysis. Areas to be evaluated will be as follows:
Changes in the insurance sector environment – mergers and acquisitions, current recession, legislation requirements and retirement of company principals
Relationships with INSETA – perception of INSETA’s ability to add value and provide support; any positive/negative feedback
The perceived ability of internship and learnership programmes at SMME’s to create employment opportunities for the youth in the insurance sector
Learnerships tracer studies These retrospective analyses of learnership students within the INSETA environment began in 2016 and have already produced meaningful results. A tracer study helps researchers identify effective and ineffective components in educational and vocational programmes. A tracer study in the field of education includes data from former students of learning institutions or vocational programmes. Researchers administer tracer studies to the sample groups between nine to 12 months after graduation from the measured programme. This research will be continued in 2017/18 in order to evaluate the long-term impact of producing employment security for learners within the programme. The results of tracer studies highlight circumstances that can produce meaningful change in populations. Promotion of symbiotic partnerships in developing skills across sectors outside of INSETA’s scope of practice INSETA has been working on a pilot project which looks at needs within the short-term insurance industry. The project looks at areas where short-term insurers make use of external, certified providers to provide a service to policy holders. Areas that could be evaluated include replacement of geysers, replacement of damaged carpets, automobile services, assessors etc. There is potential to work with other, relevant SETAs, upskill providers and provide a greater understanding of the role and legalities of the short-term insurance industry. Reorganisation and redesign of the data-collection process for WSP submissions to enhance the quality of analysis As industry needs change, there comes a time when an organisation must re-evaluate its data collection methodology to ensure continued production of clean and useful data and accurate findings for the purposes of report writing. The right analysis approach will help in understanding and interpreting findings. They can then be used constructively to guide programme and policy improvement.
1 INSETA Sector Skills Plan 2017/18
CHAPTER ONE: SECTOR PROFILE
1 Introduction
This section presents a profile of the insurance sector, which includes the scope of coverage of this sector and a discussion of its key role players. The sector’s economic performance is analysed according to its contribution to the GDP and its competitiveness within the economy. The employer profile of the insurance sector is demarcated, as is the labour market profile, which reveals the characteristics of the employees in the sector. This chapter aims to provide a broad understanding of the sector and its contribution to the economy.
2 Scope of Coverage
Insurance is defined as an agreement between a policyholder and the insurance company. Insurance is divided into long-term and short-term insurance (FSB, 2017). The industry in South Africa is growing, with new insurance companies appearing all the time. Even non-sector businesses such as major food chains are branching into insurance. The insurance sector is clustered within the economic group category of “Finance and Business Services” (this includes Insurance, Banking, and Financial and related Administrative Support Institutions). The latest GDP data shows that that this economic sector is one of the top three main contributors. All insurance companies must be registered with the FSB and must comply with relevant legislation. INSETA’s mandate is to ensure a skilled and capable insurance sector workforce by adopting a learning strategy aimed at all levels of employment in the sector and aligned to the National Skills Development Strategy. INSETA’s role is to promote and facilitate the delivery of education, training and development in order to enhance the skills profile of the insurance sector and support the country’s transformation agenda.
2.1 Insurance Sector Sub-sectors
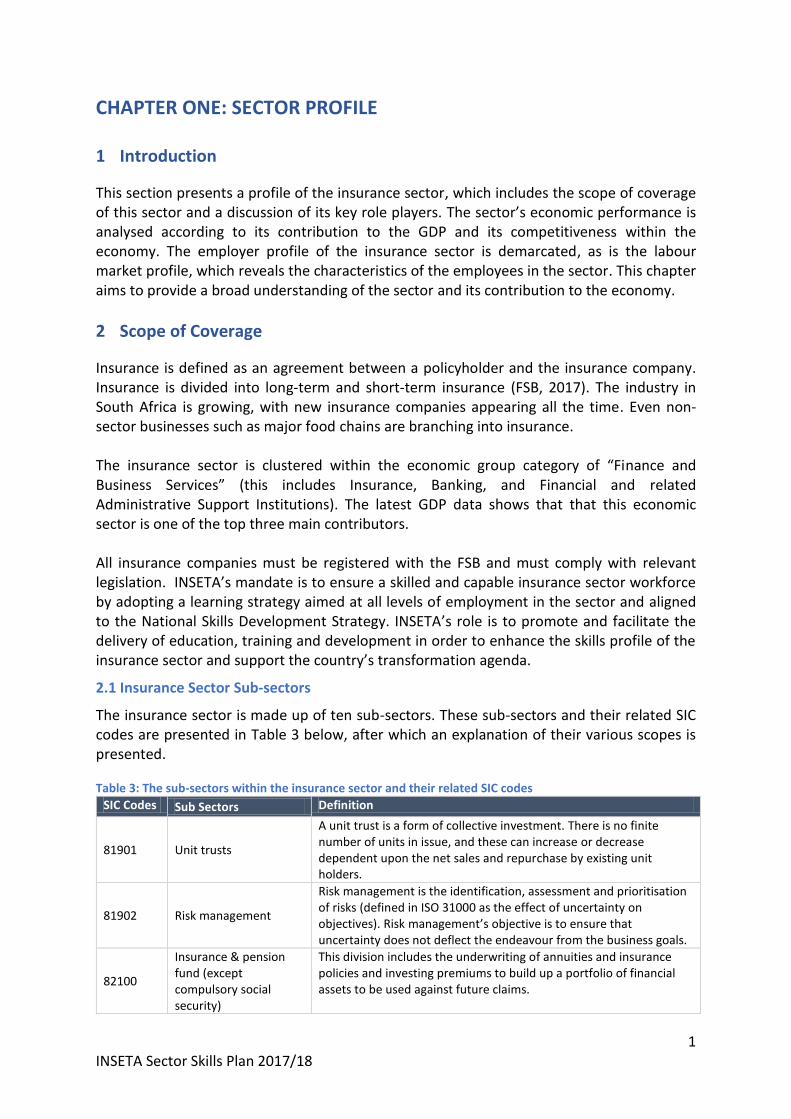
The insurance sector is made up of ten sub-sectors. These sub-sectors and their related SIC codes are presented in Table 3 below, after which an explanation of their various scopes is presented. Table 3: The sub-sectors within the insurance sector and their related SIC codes
SIC Codes Sub Sectors Definition
81901 Unit trusts
A unit trust is a form of collective investment. There is no finite number of units in issue, and these can increase or decrease dependent upon the net sales and repurchase by existing unit holders.
81902 Risk management
Risk management is the identification, assessment and prioritisation of risks (defined in ISO 31000 as the effect of uncertainty on objectives). Risk management’s objective is to ensure that uncertainty does not deflect the endeavour from the business goals.
82100
Insurance & pension fund (except compulsory social security)
This division includes the underwriting of annuities and insurance policies and investing premiums to build up a portfolio of financial assets to be used against future claims.

2 INSETA Sector Skills Plan 2017/18
SIC Codes Sub Sectors Definition
82110 Life insurance A life insurance policy is a contract with an insurance company. In exchange for premium payments, the insurance company provides a lump-sum payment to beneficiaries upon the insured's death.
82120 Pension funding Pooled contributions from pension plans set up by employers, unions, or other organisations provide for the employees' or members' retirement benefits.
82131 Health care benefits Health insurance is a type of insurance coverage that covers the cost of an insured individual's medical and surgical expenses.
82191 Short-term insurance As the name implies, short-term insurance is a form of protection intended to provide you with financial coverage should you need it in the short term.
82192 Funeral insurance Funeral insurance is a contract whereby the insurer guarantees to cover the funeral costs of the insured. Moreover, the policy may also cover related expenses.
82193 Reinsurance
This is a contract between an insurance company and a reinsurer to protect the insurance company from losses. Reinsurance provides a way for the insurance company to protect itself from financial disaster and ruin by passing on the risk to other companies. Reinsurance redistributes or diversifies the risks.
83000 Auxiliary activities (includes brokers and intermediaries)
An insurance auxiliary service means any service provided by an actuary, intermediary, or an insurance agent in relation to general, business or life insurance.
Source: DHET
2.1.1 Simplification of Sub-Sectors
Some of the offerings and activities of the sub-sectors above are very similar, so to facilitate more meaningful data, INSETA has re-categorised them into three major categories, namely: Short-Term, Long-Term and Collective Investments (Unit Trusts). Long-Term Insurance This covers life-changing events, such as death, retirement and disability. The types of cover offered include Life, Disability, Dread Disease, Funeral and Credit Life Cover. Short-Term Insurance This encompasses all types of insurance policies other than life insurance. This includes vehicle, property, household, medical, personal liability, travel and business insurance. Collective Investments A collective investment scheme involves members of the public investing money or other assets in a portfolio. This category was formerly known as Unit Trusts. The scope of coverage of the insurance sector, as clustered per the three categories above, is presented graphically in Figure 1 overleaf.

3 INSETA Sector Skills Plan 2017/18
3 Key Role-Players
The insurance sector is supported by professional bodies and industry associations which seek to support a particular profession, the interests of individuals engaged in that profession and the public interest. The secondary role of these bodies and associations is to support the businesses of the sector. Table 4: Key role-players in the insurance sector
Regulatory bodies Key focus
FSB Financial Services Board
FSB is an independent institution, established by statute to oversee the South African non-banking financial services industry in the public interest, and fully funded by fees and levies imposed on this industry
SARB South African Reserve Bank
SARB protects the value of South Africa’s currency. In discharging this role, it takes responsibility for informing the South African community and all stakeholders abroad about monetary policy and the South African economic situation
SAQA-registered professional bodies and associations
Key focus
ILA Institute of Loss Adjustors
ILA controls the professional standards and conduct of Loss Adjusters by means of a Code of Conduct and a Disciplinary Procedure. The Association of Insurance Assessors of Southern Africa, as it was then known, was formed in 1960. The name was changed to the Institute of Loss Adjusters of Southern Africa on 20 August 1968
FPI Financial Planning Institute
FPI is a South African Qualifications Authority-recognised professional association for financial planners in South Africa. It is the only institution in South Africa to offer the CFP® certification, as well as an approved examination body for the FAIS Regulatory Examinations
BATSETA Council of Retirement Funds for South Africa
BATSETA is a non-profit organisation, managed by a Board of Directors, that looks after the interests of Principal Officers, trustees and fund fiduciaries in the retirement industry
Short-Term •Short-term insurance
•Health care benefits
Long-Term
•Life insurance
•Pension / retirement funds
•Funeral insurance
Collective Investments
•Unit trusts / investments
Risk management
services and
auxiliary activities,
including
insurance brokers
and
intermediaries
FINANCIAL SECTOR CHARTER
Figure 1: The insurance sector environment
4 INSETA Sector Skills Plan 2017/18
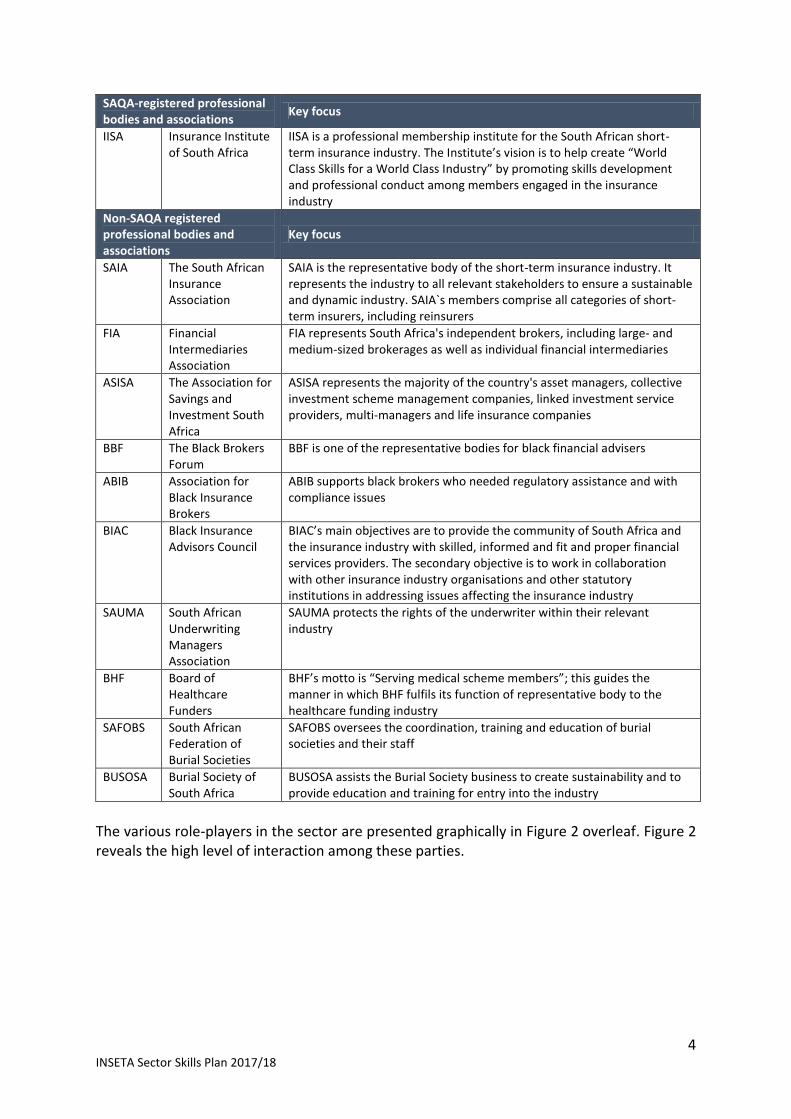
SAQA-registered professional bodies and associations
Key focus
IISA Insurance Institute of South Africa
IISA is a professional membership institute for the South African short-term insurance industry. The Institute’s vision is to help create “World Class Skills for a World Class Industry” by promoting skills development and professional conduct among members engaged in the insurance industry
Non-SAQA registered professional bodies and associations
Key focus
SAIA The South African Insurance Association
SAIA is the representative body of the short-term insurance industry. It represents the industry to all relevant stakeholders to ensure a sustainable and dynamic industry. SAIA`s members comprise all categories of short-term insurers, including reinsurers
FIA Financial Intermediaries Association
FIA represents South Africa's independent brokers, including large- and medium-sized brokerages as well as individual financial intermediaries
ASISA The Association for Savings and Investment South Africa
ASISA represents the majority of the country's asset managers, collective investment scheme management companies, linked investment service providers, multi-managers and life insurance companies
BBF The Black Brokers Forum
BBF is one of the representative bodies for black financial advisers
ABIB Association for Black Insurance Brokers
ABIB supports black brokers who needed regulatory assistance and with compliance issues
BIAC Black Insurance Advisors Council
BIAC’s main objectives are to provide the community of South Africa and the insurance industry with skilled, informed and fit and proper financial services providers. The secondary objective is to work in collaboration with other insurance industry organisations and other statutory institutions in addressing issues affecting the insurance industry
SAUMA South African Underwriting Managers Association
SAUMA protects the rights of the underwriter within their relevant industry
BHF Board of Healthcare Funders
BHF’s motto is “Serving medical scheme members”; this guides the manner in which BHF fulfils its function of representative body to the healthcare funding industry
SAFOBS South African Federation of Burial Societies
SAFOBS oversees the coordination, training and education of burial societies and their staff
BUSOSA Burial Society of South Africa
BUSOSA assists the Burial Society business to create sustainability and to provide education and training for entry into the industry
The various role-players in the sector are presented graphically in Figure 2 overleaf. Figure 2 reveals the high level of interaction among these parties.

5 INSETA Sector Skills Plan 2017/18
4 Economic Performance
The economic performance of the sector was evaluated based on data provided by Statistics South Africa (StatsSA). The data was compared with other credible sector economic performance reports to triangulate the results. South Africa has a very mature insurance market; the issue is that products remain concentrated among a very small proportion of the population. This is especially so when compared to other countries in Africa. Notwithstanding, South Africa’s insurance market accounted for nearly 75% of the total premium written across Africa in 2013. In that year, the insurance sector contributed approximately 15% to the GDP. By the end of 2014, the primary short-term insurers reported gross premiums of R102.8bn, up from R96.2bn a year earlier. In the first quarter of 2015, the results were also strong, with the short-term insurers already generating R28bn of gross premiums. The situation was much the same on the long-term insurance side. By the end of 2014, the sector reported R438.9bn of gross premiums, up from R429.7bn a year earlier. Penetration in terms of the premiums-to-GDP ratio is one of the highest in the world, at over 20%. By 2016, the finance and business sector, of which the insurance sector is a part, contributed just over 20% to the GDP, as reflected in Figure 3 overleaf.
INSURANCE SECTOR EMPLOYERS AND TRADE UNIONS
INSETA
Short-Term •Short-term insurance
•Health care benefits
Long-Term
•Life insurance
•Pension / retirement funds
•Funeral insurance
Collective Investments
•Unit trusts / investments
FIA, IISA, ILA, BBF, ABIB,
BIAC, SAUMA,
BHF
FIA, FPI, SAUMA,
BBF, ABIB, BIAC,
SAFOBS, BUSOSA, BATSETA
FIA, ASISA, BBF, ABIB,
BIAC
Risk
management
services
&
auxiliary
activities,
including
insurance
brokers and
intermediaries
Professional Bodies &
Industry Ass.
FINANCIAL SECTOR CHARTER
Figure 2: Key role-players in the insurance sector environment

6 INSETA Sector Skills Plan 2017/18
Figure 3: Sectoral composition of the South African economy in 2016 Source: StatsSA, 2017 However, the South African economy unexpectedly contracted an annualised 0.7% on quarter in the first three months of 2017. Various factors pushed South Africa into a recession, the first since 2009. Downward pressure from the greater finance and business services sector was experienced by the insurance sector, as is reflected in Figure 4 below.
Figure 4: Quarterly changes in the finance and business sector’s GDP contribution (percentage) Source: StatsSA, 2017
All insurers’ embedded value has been hit hard by the rise in interest rates. The subdued economic growth locally means local insurers are looking north of the borders for growth; local insurers face stiff competition from Africa. Insurers have looked at acquisitions and are diversifying their businesses, intending to replace the local market with the broader African market. High levels of penetration in home markets and increased demand for insurance in Africa will increasingly attract developed market peers; local insurers will face competition from international players such as AXA Insurance and Prudential Insurance, many of which have bigger balance sheets and more sophisticated underwriting models than local insurers. Despite the drop reflected in Figure 4 for the first quarter of 2017, the sector has shown consistent, through variable growth in GDP contribution since 2013. The future outlook for the finance and business sector is bright; it remains the most competitive in relation to the rest of the economic sectors.

7 INSETA Sector Skills Plan 2017/18
5 Employer Profile
5.1 Number of Employers in the Sector and Sub-sectors
The South Africa Insurance Association (SAIA), which represents the interests of short-term insurers, reported 61 members as of June 2015. As of 2013, the country had 74 long-term insurers. During the 2016/17 financial year, INSETA registered 5140 companies who declared their core business to fall within the realm of the insurance sector. In Figure 5 below, the total number of employers registered for 2017 is broken down per the three sub-sector categories. This is compared with the number of employers who submitted WSPs this year per the same sub-sector categories.
Figure 5: Employers registered with INSETA versus WSPs received per sub-sector in 2017
It is evident from Figure 5 that the Short-Term Insurance sub-sector is where the majority of employers’ core business is, followed by Long-Term Insurance and then Collective Investments. The amount of employers in each of the 10 sub-sectors of the insurance sector has undergone some notable changes since 2016, as reflected in Table 5 below. Table 5: Percentage of employers per sub-sector and employer size
Sub-sector Large (150+ employees)
%
Medium (50-149
employees) %
Small (1-49 employees)
%
Small (non-levy paying) %
Overall Total %
2017 2017 2017 2017 2016 2017
Short-term insurance 26,2 23,8 21,7 48,7 23,6 35,8
Auxiliary activities 13,8 23,8 30,1 25,7 45,6 27
Insurance & pension fund 9,7 9,4 18,7 12,5 7,4 15,4
Life insurance 20,0 8,4 16,0 6,9 9,4 11,4
Funeral insurance 3,4 5,9 4,2 2,4 6,4 3,3
Pension 10,3 7,4 3,3 1,8 0,94 2,5
Health care benefits 13,1 13,9 1,7 0,6 3,4 1,5
Risk management 2,1 2,5 1,9 0,5 1,87 1,3
Unit trusts 0,0 2,5 1,9 0,5 0,7 0,9
Reinsurance 1,4 2,5 0,7 0,3 0,7 0,5
Data in each of the subsectors is relevant to that sector and not as an overall percentage. Source: WSP data, 2017/18
8 INSETA Sector Skills Plan 2017/18
From the data above, it is clear that there has been a significant increase in the number of employers in the short-term and insurance and pension fund sectors. Employer numbers also rose slightly in the life insurance and unit trusts sector. However, the auxiliary activities sector has seen a marked decline in the number of employers. The funeral insurance, health care benefits, risk management and reinsurance sectors also show a decline.
5.2 Employer Size
The largest long-term insurer in the country is Old Mutual, with 16.26% of the net premiums in 2013. It is followed by MMI Group (14.37%) and then Investec Assurance (11.68%). The largest short-term insurer is Santam, with 18.9% of gross premiums. It is followed by Guardrisk (6.4%) and then Absa (3.1%). The sector is already highly concentrated, with almost 90% of the long-term market and 44% of the short-term market in the hands of the major players such as Old Mutual and Santam (KPMG, 2016). The sector has many smaller companies, some of which are having difficulties due to increased costs related to administration and compliance. Costs have been outpacing profit and premium growth, and this is driving mergers. A moderate amount of consolidation has taken place since 2009, with at least three small insurers leaving the business. SAIA is of the opinion that we will see this trend continue. Many smaller insurers are downgrading into the micro segment, given the higher compliance costs and macro-economic challenges. Given these economic challenges and the current political ones, some see difficult times for underwriters and anticipate the emergence of new models and the rise of specialty insurers.
5.3 Employer Geographical Distribution
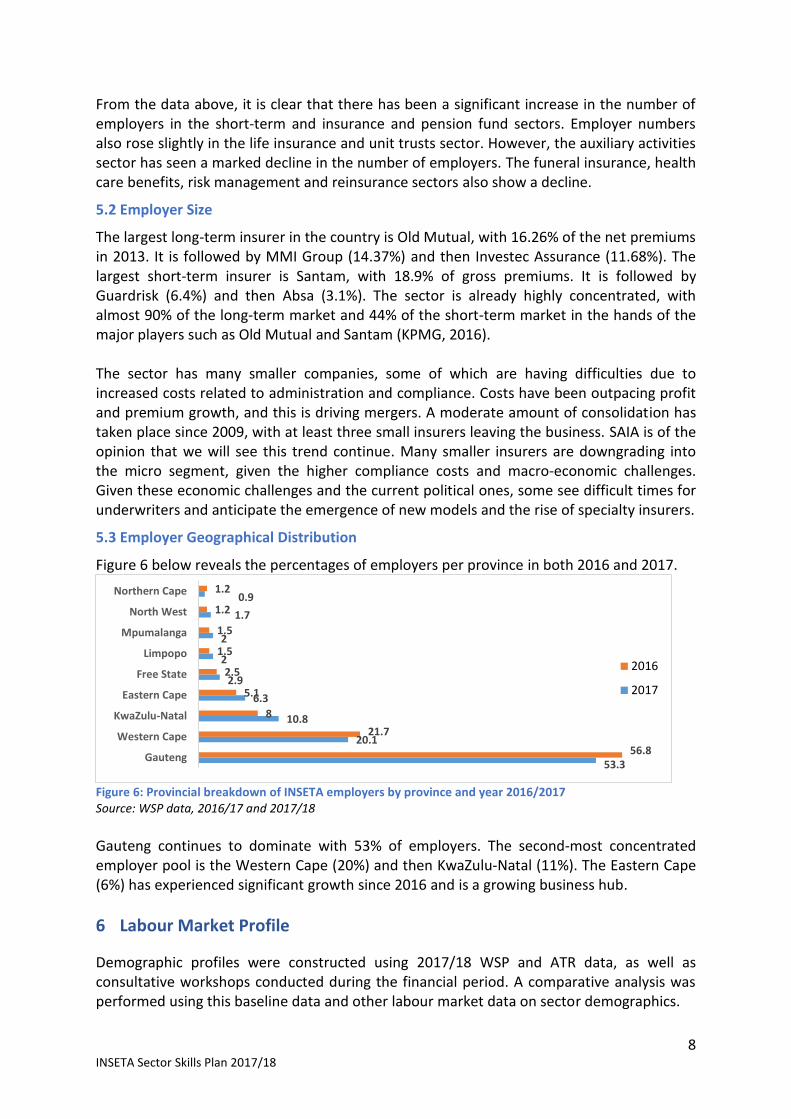
Figure 6 below reveals the percentages of employers per province in both 2016 and 2017.
Figure 6: Provincial breakdown of INSETA employers by province and year 2016/2017 Source: WSP data, 2016/17 and 2017/18
Gauteng continues to dominate with 53% of employers. The second-most concentrated employer pool is the Western Cape (20%) and then KwaZulu-Natal (11%). The Eastern Cape (6%) has experienced significant growth since 2016 and is a growing business hub.
6 Labour Market Profile
Demographic profiles were constructed using 2017/18 WSP and ATR data, as well as consultative workshops conducted during the financial period. A comparative analysis was performed using this baseline data and other labour market data on sector demographics.
53.3
20.1
10.8
6.3
2.9
2
2
1.7
0.9
56.8
21.7
8
5.1
2.5
1.5
1.5
1.2
1.2
Gauteng
Western Cape
KwaZulu-Natal
Eastern Cape
Free State
Limpopo
Mpumalanga
North West
Northern Cape
2016
2017

9 INSETA Sector Skills Plan 2017/18
6.1 Employee Numbers
The workforce represented through the 2017/18 WSP submissions is recorded at 131 670 employees, compared with last year’s 125 721 employees. This is the third consecutive quarter for which StatsSA has indicated a growth in employment: The finance and business services sector recorded the second-highest employment gains of 49 000 persons. Employment increased in the informal sector in two industries, one being the financial and business sector (StatsSA, 2017).
6.2 Employee Geographical Distribution
The geographical distribution of employees within the sector can be seen in Table 6 below. Table 6: Geographical distribution of employees 2017 by province and employer size
Data drawn from WSP submissions
2017 % 2017 numbers
overall 2017 (Small employers)
2017 (Large/ Medium employers)
Gauteng 53,3 70168 4105 66063
Western Cape 20,1 26507 1594 24 913
KwaZulu-Natal 10,8 14263 1256 13007
Eastern Cape 6,3 8318 715 7603
Free State 2,9 3779 215 3564
Limpopo 2,0 2691 112 2579
Mpumalanga 2,0 2589 184 2405
North West 1,7 2179 84 2095
Northern Cape 0,9 1176 64 1112
131,670 8,329 123,341
Source: WSP data, 2017/18
Gauteng dominates with 70168 employees in the sector based there. The second-most concentrated sector employee pool can be found in the Western Cape (26507 employees). KwaZulu-Natal is home to the third-largest employee pool with 14263 employees.
6.3 Broad Occupational Groups of Employees
Table 7 below gives an indication of the percentages of employees within the major occupational groupings of the sector. Table 7: Employees per major occupational group and employer size
Occupational group
Small employers
%
Large and Medium
employers %
Overall %
Occupational group
Small employers
%
Large and Medium
employers %
Overall %
Managers 27,8 31,6 29 Elementary Occupations
2,7 5,6 3,6
Professional 28,7 11,9 23,4 Service and Sales Workers
1,8 1,1 1,6
Clerical Support Workers
20,2 25,2 21,8 Plant and Machine Workers
1,2 1,2 1,2
Technicians and Professional Assistants
17,1 23,1 19 Skilled Agriculture, Forestry, etc*
0,4 0,3 0,4
*Skilled Agriculture, Forestry, Fishery, Craft and related trades workers Source: WSP data, 2017/18
10 INSETA Sector Skills Plan 2017/18
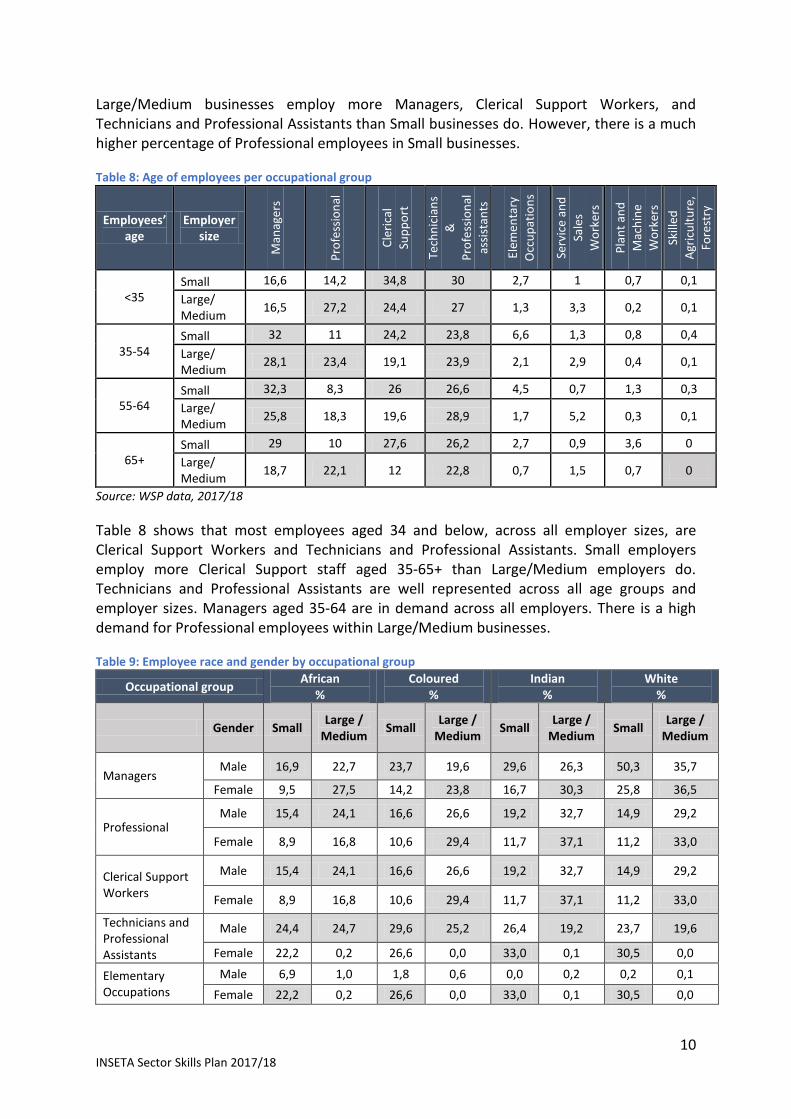
Large/Medium businesses employ more Managers, Clerical Support Workers, and Technicians and Professional Assistants than Small businesses do. However, there is a much higher percentage of Professional employees in Small businesses. Table 8: Age of employees per occupational group
Employees’ age
Employer size
Man
ager
s
Pro
fess
ion
al
Cle
rica
l
Sup
po
rt
Tech
nic
ian
s
&
Pro
fess
ion
al
assi
stan
ts
Elem
enta
ry
Occ
up
atio
ns
Serv
ice
and
Sale
s
Wo
rker
s
Pla
nt
and
Mac
hin
e
Wo
rker
s
Skill
ed
Agr
icu
ltu
re,
Fore
stry
<35 Small 16,6 14,2 34,8 30 2,7 1 0,7 0,1
Large/ Medium
16,5 27,2 24,4 27 1,3 3,3 0,2 0,1
35-54 Small 32 11 24,2 23,8 6,6 1,3 0,8 0,4
Large/ Medium
28,1 23,4 19,1 23,9 2,1 2,9 0,4 0,1
55-64 Small 32,3 8,3 26 26,6 4,5 0,7 1,3 0,3
Large/ Medium
25,8 18,3 19,6 28,9 1,7 5,2 0,3 0,1
65+ Small 29 10 27,6 26,2 2,7 0,9 3,6 0
Large/ Medium
18,7 22,1 12 22,8 0,7 1,5 0,7 0
Source: WSP data, 2017/18
Table 8 shows that most employees aged 34 and below, across all employer sizes, are Clerical Support Workers and Technicians and Professional Assistants. Small employers employ more Clerical Support staff aged 35-65+ than Large/Medium employers do. Technicians and Professional Assistants are well represented across all age groups and employer sizes. Managers aged 35-64 are in demand across all employers. There is a high demand for Professional employees within Large/Medium businesses. Table 9: Employee race and gender by occupational group
Occupational group African
% Coloured
% Indian
% White
%
Gender Small Large /
Medium Small
Large / Medium
Small Large /
Medium Small
Large / Medium
Managers Male 16,9 22,7 23,7 19,6 29,6 26,3 50,3 35,7
Female 9,5 27,5 14,2 23,8 16,7 30,3 25,8 36,5
Professional Male 15,4 24,1 16,6 26,6 19,2 32,7 14,9 29,2
Female 8,9 16,8 10,6 29,4 11,7 37,1 11,2 33,0
Clerical Support Workers
Male 15,4 24,1 16,6 26,6 19,2 32,7 14,9 29,2
Female 8,9 16,8 10,6 29,4 11,7 37,1 11,2 33,0
Technicians and Professional Assistants
Male 24,4 24,7 29,6 25,2 26,4 19,2 23,7 19,6
Female 22,2 0,2 26,6 0,0 33,0 0,1 30,5 0,0
Elementary Occupations
Male 6,9 1,0 1,8 0,6 0,0 0,2 0,2 0,1
Female 22,2 0,2 26,6 0,0 33,0 0,1 30,5 0,0

11 INSETA Sector Skills Plan 2017/18
Occupational group African
% Coloured
% Indian
% White
%
Gender Small Large /
Medium Small
Large / Medium
Small Large /
Medium Small
Large / Medium
Service and Sales Workers
Male 3,6 5,4 2,4 3,6 0,8 1,8 0,1 3,1
Female 2,3 6,5 1,5 3,3 0,0 2,4 0,8 2,5
Plant and Machine Workers
Male 7,4 0,8 1,8 0,3 1,6 0,2 0,5 1,5
Female 0,1 0,1 0,0 0,0 0,0 0,0 0,0 0,0
Skilled Agriculture, Forestry, etc*
Male 0,0 0,2 0,0 0,1 0,0 0,2 0,0 0,1
Female 0,0 0,2 0,0 0,0 0,4 0,1 0,0 0,0
*Skilled Agriculture, Forestry, Fishery, Craft and related trades workers Source: WSP data, 2017/18
Table 9 shows that there are fewer African male Managers within the Small employer group. There is a low uptake of female Managers by Small employers across the African, Coloured and Indian/Asian groups. Coloured and Indian/Asian males show similar profiles within the Manager occupation. White male Managers have the highest uptake within the Small employer environment at just over 50%. There is a significant difference with regard to male Professional employees between the Small employer and the Large/Medium employer. There is a low uptake of female Professionals by Small employers across all race groups. However, White and Indian/Asian females have the greatest representation in Large/Medium companies. It would appear that Small companies are more inclined to employ Male Clerical Support Workers across all race groups, while Large/Medium employers have a higher percentage of females. Indians show a greater uptake for all employer sizes in this category. With Technicians and Professional Assistants, the uptake of African males across Small and Large/Medium employers is very similar. However, across Indian/Asian and White male employees, there is a significant drop between the percentage working for Large/Medium employers and those working for Small employer groups. There is extremely low representation of females of all races in this occupation in Large/Medium companies. Transformation goals also entail the uptake of disabled employees. Table 10 shows the current figures for the number of disabled employees in the sector. Table 10: NSDS III transformational imperatives – focus on race and disability in the sector
Race Number of employees
with disabilities Total number of
employees National Imperatives:
Race National Imperatives:
Disability
African 476 64558
74%
Coloured 242 19729
1,31% Indian 122 12784
White 439 33870
Foreigners 1 729
1280 131670
Source: WSP data, 2017/18

12 INSETA Sector Skills Plan 2017/18
The implementation of the NSDS III is guided by seven key developmental and transformation imperatives. All skills-development initiatives are measured against these imperatives. INSETA has placed focus on two key areas of the seven imperatives, namely:
Race - Priority must be given to providing opportunities to disadvantaged South Africans, with focus on skills provision for Africans in particular and to help reduce racial inequalities in our economy and skills profile. Currently, the sector employs 74% Black people, which is not in line with the National Transformational Imperatives that are set at 85% Black employees.
Disability - Priority must be given to providing opportunities for skills training for people with various forms of physical and intellectual disabilities. Currently, the sector employs 1,3% Persons with Disabilities, which is not in line with the National Transformational Imperatives that are set at 4%.
Data in Table 10 shows that there is still much to be done in the areas highlighted. Further monitoring will be undertaken by INSETA to address these areas.
6.4 Major Sub-sector Breakdown of Employees
The data in this section reflects the characteristics of employees (in percentages) in Large and Medium companies of the sector only; this data will be collected for SMEs in the coming months and will be included in the next SSP submission. Table 11 below shows the race breakdown of employees in each of the three major sub-sectors designated by INSETA. Table 11: Employee race percentage per major sub-sector
Race African Coloured Indian White Foreign
Short-Term 40,1 15 12,1 32,1 0,7
Long-Term 56 15 7,9 20,7 0,4
Collective Investments 13,9 21,7 6,7 57,3 0,4
Source: WSP data, 2017/18
The Short- and Long-Term sub-sectors are dominated by African employees, with White employees also well represented. The majority of employees in the Collective Investments sub-sector are White, with a good representation of Coloured employees. Indian employees have the lowest representation across all sub-sectors. Table 12: Employees’ age percentage per major sub-sector
Employees’ age Short-Term Long-Term Collective Investments
<35 49,7 45 36,8
35-54 42,8 47,9 52,1
55-64 6,5 6,4 9,5
65+ 1 0,7 1,6
Source: WSP data, 2017/18
Table 12 above shows that the youth (persons under the age of 35) only dominate the Short-Term sub-sector. The vast majority of employees in the sector fall between the ages of 35 and 54. However, there is some cause for concern in the Short- and Long-Term sub-categories, where there are a significant number of employees over the age of 65. INSETA will investigate mentorship and skills transfer opportunities, as well as employers’ plans to fill transformational gaps.

13 INSETA Sector Skills Plan 2017/18
Table 13: Employees’ gender percentage per major sub-sector
Employees’ gender Short-Term Long-Term Collective Investments
Male 38,2 42,9 38
Female 61,8 57,1 62
Source: WSP data, 2017/18
Table 13 reveals that females continue to dominate all sub-sectors, in line with the NSDS lll transformational imperatives, which call for a minimum of 54% women to be represented in organisations. Table 14: Disabled employees percentage per major sub-sector
Short-Term Long-Term Collective Investments
Persons with disabilities 1 0,9 1,2
Source: WSP data, 2017/18
Table 14 shows that, although the three major sub-sectors have supported the drive to recruit persons with disabilities, there is room for improvement in this area. Whilst INSETA projects include additional support service fees for persons with disabilities, more attention needs to be paid to projects which enable persons with disabilities to enter and grow within the insurance sector.
6.5 Notable Trends
Comparing the data from the past three years shows that transformation is happening, but has still not met the required levels. This is especially noticeable in the management and professional groupings. INSETA supports the Government’s transformation imperatives to ensure that employee representation is 85% black, 54% female and 4% disabled. Women are well represented in the sector, though there needs to be more focus on the employment of persons with disabilities.
6.6 Implications for Transformation
Since 1994, South Africa has undergone significant transformation. The Employment Equity Act (No 55) of 1998 aims to eliminate unfair discrimination and implement affirmative action to enable equitable representation of employees across different race and gender groups. However, South Africa is still facing challenges in growing young professionals, especially in the insurance industry. However, industry players are optimistic about the future and believe that there is a desire to meet targets; they have largely bought into the transformation process and perceive a strong relationship between regulators and industry members. The biggest challenge is the shortage of Black entrants with the required experience and skills for professional and management roles. In research completed in 2015, the following reasons were given to explain this difficulty:
The education system is failing to produce work-ready job applicants
Needed skills are in short supply, making professionals and managers costly to recruit
In-house training is expensive and time-consuming
Poaching of employees is adding to the cost of doing business, and fostering a lack of loyalty among employees
6.7 Educational Qualifications within the Sector
INSETA will be taking a greater interest in this section of the SSP for greater clarity on entry requirements for management positions.

14 INSETA Sector Skills Plan 2017/18
Table 15: Qualifications of male employees in the sector by race and employer size (percentage)
Male employees
African Coloured Indian / Asian
White
Large / Medium
Large / Medium
Large / Medium
Large / Medium
AET Level 4/NQF Level 1 (at Grade 9/Std 7/Form 2) 0,4 0,3 1,9 0,3
Below AET Level 4/NQF Level 1 (below Grade 9/Std7/Form 2) 0,3 0,1 0,0 0,0
NQF Level 10 (Doctoral) 0,1 0,0 0,1 0,2
NQF Level 2 (up to and including Grade 10/Std8/Form 3/NTC I) 0,3 1,1 0,1 0,2
NQF Level 3 (up to and including Grade 11/Std8/Form 4/NTC II) 2,4 1,1 1,0 0,6
NQF Level 4 (up to and including Grade 12/Std8/Form 5/NTC III) 63,7 61,2 49,4 46,6
NQF Level 5 (Diploma, Certificate/NTC IV,V,VI) 13,2 10,3 15,9 14,9
NQF Level 6 (National Diploma) 4,4 5,3 7,6 6,9
NQF Level 7 (First Degree) 7,0 7,5 14,8 17,6
NQF Level 8 (Honours, Professional Degrees and Post Graduate) 1,9 2,4 5,3 10,0
NQF Level 9 (Masters) 0,6 0,6 1,5 2,5
Other 437 149 176 241
Source: WSP data, 2017/18 Table 16: Qualifications of female employees in the sector by race and employer size (percentage)
Female employees
African Coloured Indian / Asian
White
Large / Medium
Large / Medium
Large / Medium
Large / Medium
AET Level/NQF Level 1 (at Grade 9/Std 7/Form2) 0,5 0,4 2,2 0,3
Below AET Level 4/NQF Level 1 (below Grade 9/Std7/Form 2) 0,5 0,1 0,0 0,0
NQF Level 10 (Doctoral) 0,0 0,0 0,0 0,1
NQF Level 2 (up to and including Grade 10/Std8/Form 3/NTC I) 0,4 0,8 0,2 0,7
NQF Level 3 (up to and including Grade 11/Std8/Form 4/NTC II) 2,8 1,1 1,4 0,9
NQF Level 4 (up to and including Grade 12/Std8/Form 5/NTC III) 67,3 67,6 49,3 56,6
NQF Level 5 (Diploma, Certificate/NTC IV,V,VI) 12,6 10,1 11,6 11,3
NQF Level 6 (National Diploma) 5,5 7,1 9,3 8,1
NQF Level 7 (First Degree) 6,6 7,6 15,4 12,8
NQF Level 8 (Honours, Professional Degrees and Post Graduate) 1,8 2,5 5,7 6,1
NQF Level 9 (Masters) 0,4 0,5 1,8 1,3
Other 1,7 2,3 3,1 1,9
Source: WSP data, 2017/18
If one compares these 2017 educational levels with those reflected in the 2012 SSP, the following observations are made: The majority of the workforce still only has a matric; in 2012, there were more people in the sector with degrees than there are currently; more people in the sector now hold certificates and National diplomas than degrees. This could be due to several reasons: Perhaps the entry standards into the sector have become too relaxed; or people are unable to access funding for a degree; or people are struggling to meet their jobs’ required performance levels and are unable to focus on further studies.
6.8 Implications of Findings for Skills Development
In an attempt to transform the South African economy, the NSDS prescribes that at least 54% of skills development beneficiaries should be women, 85% should be black and 4% should be people with disabilities. Therefore an analysis of the race, gender, disability, youth
15 INSETA Sector Skills Plan 2017/18
and educational levels of employees in the sector is important. Educational data shows that there is a growing mismatch between the skills employers need and the talent available. This applies both to technical skills and knowledge and to employees’ capacity to learn, adapt, lead, think laterally and solve problems creatively.
7 Conclusion
Looking ahead to 2020, experts warn that although CEOs rank workforce high on their list of priorities, they are not translating concern into action (Ellyn Shook and Mark Knickrehm, Harnessing Revolution – Creating the Future Workforce). 40% of employers report talent shortages. By 2020, more than one-third of the desired skill sets of most jobs will comprise skills not yet considered crucial today. We stand on the brink of a technological revolution that will fundamentally alter the way we live, work, and relate to one another. In its scale, scope, and complexity, the transformation will be unlike anything humankind has experienced before (Klaus Schwab, The Fourth Industrial Revolution: What It Means and How to Respond). South Africa’s insurance market is undergoing the most significant transformation in its history. The introduction of Twin Peaks will cost insurers in terms of investments in technology and compliance resources. The payoff will come over time, as the sector becomes more transparent and as the benefits of more stringent regulations feed through to policies and policy holders. Despite these challenges, the insurance sector continues to contribute significantly to the broader economy. While the sector remains very competitive, INSETA must maintain strong relationships with many of the key role players laid out in the relationship map in order to ensure that this continues. An analysis of the current employer profile in the sector revealed that, whilst the larger businesses employ the most employees, this employment growth is slow. Small businesses are the future driver of the economy in South Africa. The workforce data shows that in the Management occupational category, the White racial group holds disproportionally more positions than the Black racial group. While transformational objectives are being well met in the employment of women in the sector, there is still room for improvement to meet racial targets. There is also much work still to be done to meet the targets for employment of persons with disabilities.

16 INSETA Sector Skills Plan 2017/18
CHAPTER TWO: KEY SKILLS ISSUES
1 Introduction
This chapter focuses on the key skills issues that impact the insurance sector. In 2014, INSETA commissioned research to look into the key change drivers within the sector; various professional bodies and industry associations were consulted. In 2015, the resulting report on key drivers affecting the insurance industry was released. A series of preliminary interviews conducted have shown that the majority of these change drivers are still prevalent in 2017.
2 Change Drivers
The Global megatrends that are altering the insurance landscape, according to the PwC report on the outlook of the industry for 2017, are presented in Table 17 below. Table 17: Change drivers affecting the insurance sector
Change driver Explanation
Social networks and
changing customer behaviour
In recent years, online social networking has emerged as a strong component of social interaction. Financial institutions are starting to recognise the opportunities social media can bring to their businesses. They are looking to gain a competitive advantage over other institutions while also trying to mitigate the threats posed by social media. Until recently, the sector has lagged behind some others in its comprehensive adoption of social media. However, many companies are now using social media to revolutionise the traditional business models that the finance sector has relied upon for decades.
Technology, innovation
and FinTech
Financial technology companies are generally start-ups trying to disintermediate incumbent financial systems and challenge traditional corporations that are less reliant on software. The financial technology sector is booming: The FinTech market captured over US$12 billion investments since 2015, a three-fold increase from the previous year. New start-ups are popping up at an increasing pace, and large banks and insurance companies are being pushed toward increasing digital operations in order to survive. Goldman Sachs estimates that FinTech start-ups could be taking up to $470 billion in profits alone from bigger service companies in the financial industry.
Environmental and
sustainability issues
Climate change is the most significant challenge to achieving sustainable development and it is not just a long-term issue. It is happening today, and it entails uncertainties for policy makers trying to shape the future, who are unsure what the local, regional, societal and economic impacts will be. Many decisions to be made today have long-term consequences and are sensitive to climate conditions.
Economic change and
future growth opportunities
The future may be hard to predict, but need not be hard to prepare for. Insurers are grappling with the tough new business, investment and regulatory environments that are emerging from the financial crisis. The industry also faces far broader challenges. Demographic shifts, the rise in power of the emerging markets and changing customer behaviour will all help shape the sector’s longer-term future. Insurers who can anticipate and plan for change can create their own future.
Regulatory and political
landscape
There are strong signs that Africa’s insurance industry is currently in a transformation phase, according to KPMG’s South African Insurance Survey 2015. The report says the challenges faced by businesses today are fundamentally different to those of 20-30 years ago. The global risk landscape has been marred by political conflict in both emerging and developed markets, highlighting the growing need for political risk insurance globally. Thus the underwriting of political risk insurance, locally and internationally, is a growing business.
Source: PwC, 2017
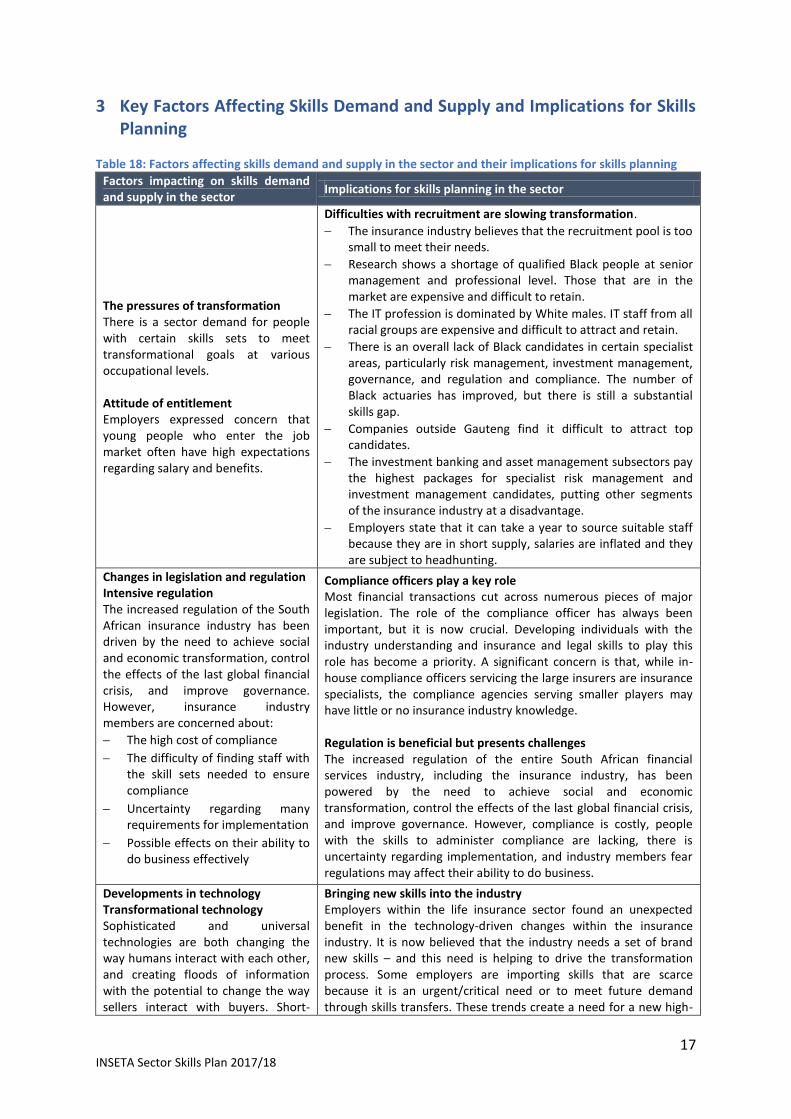
17 INSETA Sector Skills Plan 2017/18
3 Key Factors Affecting Skills Demand and Supply and Implications for Skills Planning
Table 18: Factors affecting skills demand and supply in the sector and their implications for skills planning
Factors impacting on skills demand and supply in the sector
Implications for skills planning in the sector
The pressures of transformation There is a sector demand for people with certain skills sets to meet transformational goals at various occupational levels. Attitude of entitlement Employers expressed concern that young people who enter the job market often have high expectations regarding salary and benefits.
Difficulties with recruitment are slowing transformation.
The insurance industry believes that the recruitment pool is too small to meet their needs.
Research shows a shortage of qualified Black people at senior management and professional level. Those that are in the market are expensive and difficult to retain.
The IT profession is dominated by White males. IT staff from all racial groups are expensive and difficult to attract and retain.
There is an overall lack of Black candidates in certain specialist areas, particularly risk management, investment management, governance, and regulation and compliance. The number of Black actuaries has improved, but there is still a substantial skills gap.
Companies outside Gauteng find it difficult to attract top candidates.
The investment banking and asset management subsectors pay the highest packages for specialist risk management and investment management candidates, putting other segments of the insurance industry at a disadvantage.
Employers state that it can take a year to source suitable staff because they are in short supply, salaries are inflated and they are subject to headhunting.
Changes in legislation and regulation Intensive regulation The increased regulation of the South African insurance industry has been driven by the need to achieve social and economic transformation, control the effects of the last global financial crisis, and improve governance. However, insurance industry members are concerned about:
The high cost of compliance
The difficulty of finding staff with the skill sets needed to ensure compliance
Uncertainty regarding many requirements for implementation
Possible effects on their ability to do business effectively
Compliance officers play a key role Most financial transactions cut across numerous pieces of major legislation. The role of the compliance officer has always been important, but it is now crucial. Developing individuals with the industry understanding and insurance and legal skills to play this role has become a priority. A significant concern is that, while in-house compliance officers servicing the large insurers are insurance specialists, the compliance agencies serving smaller players may have little or no insurance industry knowledge. Regulation is beneficial but presents challenges The increased regulation of the entire South African financial services industry, including the insurance industry, has been powered by the need to achieve social and economic transformation, control the effects of the last global financial crisis, and improve governance. However, compliance is costly, people with the skills to administer compliance are lacking, there is uncertainty regarding implementation, and industry members fear regulations may affect their ability to do business.
Developments in technology Transformational technology Sophisticated and universal technologies are both changing the way humans interact with each other, and creating floods of information with the potential to change the way sellers interact with buyers. Short-
Bringing new skills into the industry Employers within the life insurance sector found an unexpected benefit in the technology-driven changes within the insurance industry. It is now believed that the industry needs a set of brand new skills – and this need is helping to drive the transformation process. Some employers are importing skills that are scarce because it is an urgent/critical need or to meet future demand through skills transfers. These trends create a need for a new high-
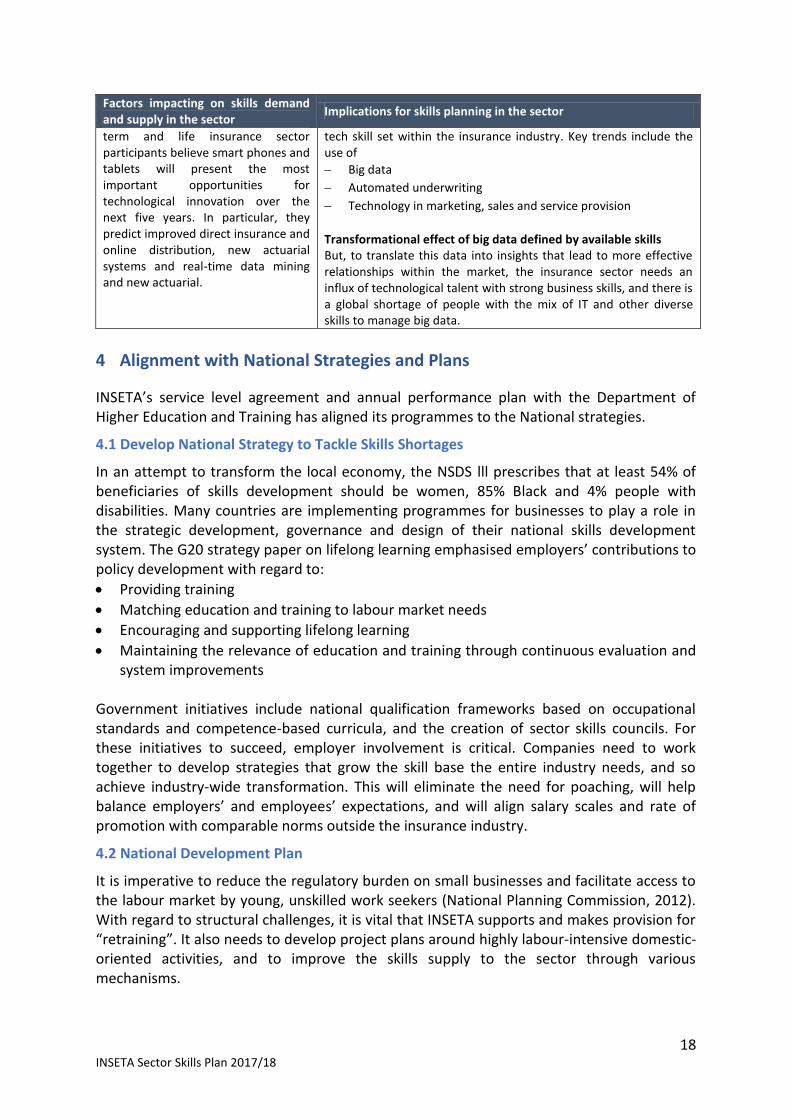
18 INSETA Sector Skills Plan 2017/18
Factors impacting on skills demand and supply in the sector
Implications for skills planning in the sector
term and life insurance sector participants believe smart phones and tablets will present the most important opportunities for technological innovation over the next five years. In particular, they predict improved direct insurance and online distribution, new actuarial systems and real-time data mining and new actuarial.
tech skill set within the insurance industry. Key trends include the use of
Big data
Automated underwriting
Technology in marketing, sales and service provision
Transformational effect of big data defined by available skills But, to translate this data into insights that lead to more effective relationships within the market, the insurance sector needs an influx of technological talent with strong business skills, and there is a global shortage of people with the mix of IT and other diverse skills to manage big data.
4 Alignment with National Strategies and Plans
INSETA’s service level agreement and annual performance plan with the Department of Higher Education and Training has aligned its programmes to the National strategies.
4.1 Develop National Strategy to Tackle Skills Shortages
In an attempt to transform the local economy, the NSDS lll prescribes that at least 54% of beneficiaries of skills development should be women, 85% Black and 4% people with disabilities. Many countries are implementing programmes for businesses to play a role in the strategic development, governance and design of their national skills development system. The G20 strategy paper on lifelong learning emphasised employers’ contributions to policy development with regard to:
Providing training
Matching education and training to labour market needs
Encouraging and supporting lifelong learning
Maintaining the relevance of education and training through continuous evaluation and system improvements
Government initiatives include national qualification frameworks based on occupational standards and competence-based curricula, and the creation of sector skills councils. For these initiatives to succeed, employer involvement is critical. Companies need to work together to develop strategies that grow the skill base the entire industry needs, and so achieve industry-wide transformation. This will eliminate the need for poaching, will help balance employers’ and employees’ expectations, and will align salary scales and rate of promotion with comparable norms outside the insurance industry.
4.2 National Development Plan
It is imperative to reduce the regulatory burden on small businesses and facilitate access to the labour market by young, unskilled work seekers (National Planning Commission, 2012). With regard to structural challenges, it is vital that INSETA supports and makes provision for “retraining”. It also needs to develop project plans around highly labour-intensive domestic-oriented activities, and to improve the skills supply to the sector through various mechanisms.

19 INSETA Sector Skills Plan 2017/18
These include:
Supporting a tax subsidy to employers by making it easier for them to hire young labour market graduates
subsidising the placement sector to identify and prepare young matriculates and place them in the work sector
Expanding learnerships and making training vouchers directly available to work seekers
Creating worker-retention schemes to offer short-term employment during periods of low demand.
INSETA’s projects need to align themselves with employment equity with an emphasis on staff training, career pathing and mobility in the workplace. This will assist with the meeting and advancing of employment equity targets. These projects need to embrace the B-BBEE charters, the codes and the B-BBEE scorecards of development finance institutions to expand Black ownership. INSETA needs to focus on small and expanding firms in the scoping of its projects as they will be responsible for the majority of new jobs that are created. For the participants in INSETA’s projects, it needs to create the skills necessary for start-ups. In collaboration with further education and training (TVET) colleges, it also needs to focus on advancing high-technology skills among SMEs. The spirit of entrepreneurship must be initiated at school level. The cost of doing business must be lowered within the economy, and barriers to entry must be reduced in various value chains. Substantial employment is created indirectly within the insurance sector through property, building maintenance, and security, personal and business services. INSETA’s SME projects should be run by well-trained former entrepreneurs with first-hand knowledge of the insurance sector. These initiatives will assist in meeting the NDP’s goal of reducing unemployment from 25 to 6%.
4.3 The New Growth Path
The NGP makes reference to workplace skills, where there is a need to improve skills in every job and target 1.2 million workers annually for certification on the job skills improvement programmes from 2013. Every SETA should aim to facilitate and co-finance training for 10% of the workplace annually (Economic Development Department, 2011b).
4.4 Human Resource Development Strategy for South Africa 2010-2030
Strategic priorities of the above strategy that impact on skills planning initiatives include:
Strategic Priority 4: To ensure that all new entrants to the labour market have access to employment-focused education and training opportunities. INSETA gives expression to this skills priority by ensuring that education and training are linked to scarce and critical skills, as well as qualifications that have general relevance to the insurance sector. It also gives preference to qualifications that are recognised by the SAQA and the QCTO.
Strategic Priority 7: To ensure that education and training outcomes are equitable in terms of race, gender, disability and geographic location. This is identical to the demographic and transformational imperatives of the NSDS III, and INSETA incorporates these variables into its projects when scoping for them to ensure that the prerequisites of the B-BBEE Act and the Financial Sector Charter (FSC) are met.
Strategic Priority 9: To meet INSETA’s skills planning needs in relation to this skills priority, where the minimum level required is NQF Level 4 (for employed and unemployed individuals). INSETA funds skills programmes for workers and unemployed youths where unit standards relevant to the insurance sector are offered.
20 INSETA Sector Skills Plan 2017/18
4.5 White Paper for Post-School Education and Training
INSETA, in line with the NSDS III, has multifaceted roles to play in the system. These roles range from working closely with TVET colleges and universities to collaborating with those institutions and with employers to promote post-school work-integrated learning. INSETA is doing this in a proactive way and has concluded memoranda of agreement with 13 TVET colleges. The insurance courses offered at community colleges will need to be pitched at a lower NQF level than those offered at TVET Colleges (Kaplan, 2014).
4.6 Strategic Integrated Projects
One of the projects which INSETA is busy implementing with regard to meeting the “demand for SIPS” is the artisan development concept (Skills for a Green Economy). The project is aimed at addressing the need for artisans to progress in their existing careers and for unemployed learners at entry level to qualify for access into the insurance sector. With support from GIZ/Skills for Green Jobs, a national consultation process with all major short-term insurance underwriters, their outsourced partners and INSETA showed that the sector is a key starting point to advocate and market solar water heating (SWH) technologies. These findings are supported in light of the new National Solar Water Heating Programme (NSWHP) and the commitments of the insurance sector based on individual memoranda of agreement between insurance underwriters and the Department of Energy.
5 Conclusion
Multiple research methods were used to identify five key change drivers and the factors influencing the skills supply and demand in the sector. The main factors affecting skills supply and demand range from legislative and regulatory changes to developments in technology. Technology will affect the seller-buyer relationship, and a need for high-tech skills has arisen within the insurance sector. The implications for skills planning caused by legislation and regulation involve the changing role of compliance officers, and the fact that there is difficulty in implementing new regulations, while a benefit of compliance is enhanced governance. National strategies and plans have been discussed in depth and all aspects relevant to INSETA’s projects have been identified. The practical aspects of the White Paper for Post-School Education and Training which affect INSETA projects have been identified. These practicalities entail entering into partnerships with universities, universities of technology and TVET colleges to promote work-integrated learning. INSETA is currently exploring the possibility of entering into partnerships with community colleges. A national strategy for tackling the skills shortage is evolving where the emphasis is on accreditation and corporate involvement. The National Development Plan is looked at from the viewpoint of entrepreneurship and ways of reducing the barriers to accessing the insurance sector. The same plan emphasises that companies must be alert to new and evolving job opportunities. The New Growth Path is based on the premise that there is a need to refine and enhance the skills in every job. The idea of co-financing is emphasised. INSETA has a project which falls under the domain of strategic integrated projects in the area of artisan development (Skills for a Green Economy). This is related to the marketing and funding of solar water heating technologies. This will create opportunities for artisans to progress in their existing careers and for unemployed learners to gain access into the insurance sector.
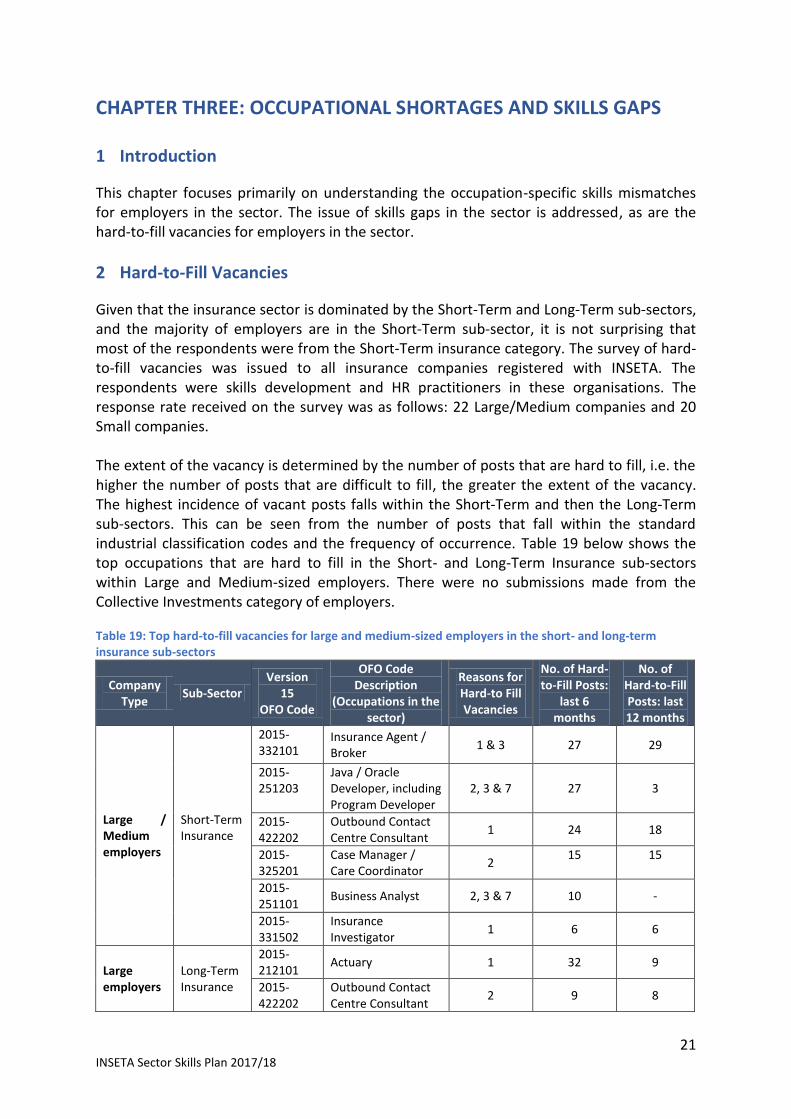
21 INSETA Sector Skills Plan 2017/18
CHAPTER THREE: OCCUPATIONAL SHORTAGES AND SKILLS GAPS
1 Introduction
This chapter focuses primarily on understanding the occupation-specific skills mismatches for employers in the sector. The issue of skills gaps in the sector is addressed, as are the hard-to-fill vacancies for employers in the sector.
2 Hard-to-Fill Vacancies
Given that the insurance sector is dominated by the Short-Term and Long-Term sub-sectors, and the majority of employers are in the Short-Term sub-sector, it is not surprising that most of the respondents were from the Short-Term insurance category. The survey of hard-to-fill vacancies was issued to all insurance companies registered with INSETA. The respondents were skills development and HR practitioners in these organisations. The response rate received on the survey was as follows: 22 Large/Medium companies and 20 Small companies. The extent of the vacancy is determined by the number of posts that are hard to fill, i.e. the higher the number of posts that are difficult to fill, the greater the extent of the vacancy. The highest incidence of vacant posts falls within the Short-Term and then the Long-Term sub-sectors. This can be seen from the number of posts that fall within the standard industrial classification codes and the frequency of occurrence. Table 19 below shows the top occupations that are hard to fill in the Short- and Long-Term Insurance sub-sectors within Large and Medium-sized employers. There were no submissions made from the Collective Investments category of employers. Table 19: Top hard-to-fill vacancies for large and medium-sized employers in the short- and long-term insurance sub-sectors
Company Type
Sub-Sector Version
15 OFO Code
OFO Code Description
(Occupations in the sector)
Reasons for Hard-to Fill Vacancies
No. of Hard-to-Fill Posts:
last 6 months
No. of Hard-to-Fill Posts: last 12 months
Large / Medium employers
Short-Term Insurance
2015-332101
Insurance Agent / Broker
1 & 3 27 29
2015-251203
Java / Oracle Developer, including Program Developer
2, 3 & 7 27 3
2015-422202
Outbound Contact Centre Consultant
1 24 18
2015-325201
Case Manager / Care Coordinator
2 15
15
2015-251101
Business Analyst 2, 3 & 7 10 -
2015-331502
Insurance Investigator
1 6 6
Large employers
Long-Term Insurance
2015-212101
Actuary 1 32 9
2015-422202
Outbound Contact Centre Consultant
2 9 8
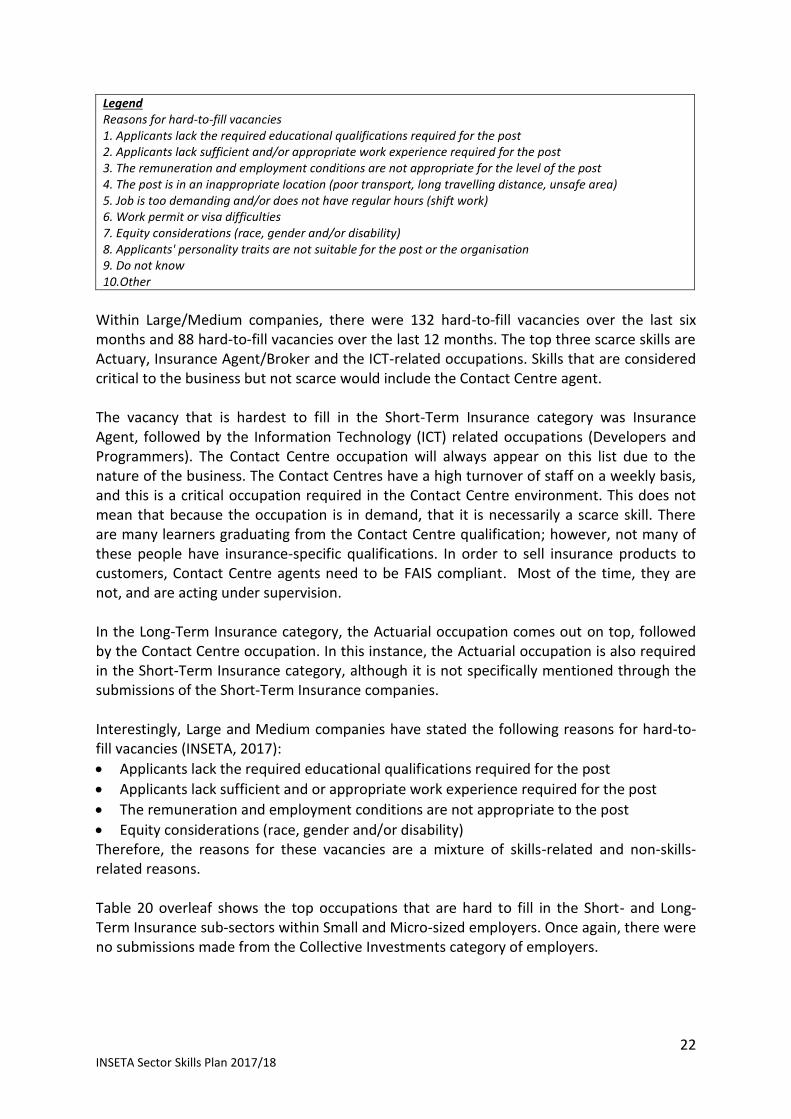
22 INSETA Sector Skills Plan 2017/18
Legend Reasons for hard-to-fill vacancies 1. Applicants lack the required educational qualifications required for the post 2. Applicants lack sufficient and/or appropriate work experience required for the post 3. The remuneration and employment conditions are not appropriate for the level of the post 4. The post is in an inappropriate location (poor transport, long travelling distance, unsafe area) 5. Job is too demanding and/or does not have regular hours (shift work) 6. Work permit or visa difficulties 7. Equity considerations (race, gender and/or disability) 8. Applicants' personality traits are not suitable for the post or the organisation 9. Do not know 10.Other
Within Large/Medium companies, there were 132 hard-to-fill vacancies over the last six months and 88 hard-to-fill vacancies over the last 12 months. The top three scarce skills are Actuary, Insurance Agent/Broker and the ICT-related occupations. Skills that are considered critical to the business but not scarce would include the Contact Centre agent. The vacancy that is hardest to fill in the Short-Term Insurance category was Insurance Agent, followed by the Information Technology (ICT) related occupations (Developers and Programmers). The Contact Centre occupation will always appear on this list due to the nature of the business. The Contact Centres have a high turnover of staff on a weekly basis, and this is a critical occupation required in the Contact Centre environment. This does not mean that because the occupation is in demand, that it is necessarily a scarce skill. There are many learners graduating from the Contact Centre qualification; however, not many of these people have insurance-specific qualifications. In order to sell insurance products to customers, Contact Centre agents need to be FAIS compliant. Most of the time, they are not, and are acting under supervision. In the Long-Term Insurance category, the Actuarial occupation comes out on top, followed by the Contact Centre occupation. In this instance, the Actuarial occupation is also required in the Short-Term Insurance category, although it is not specifically mentioned through the submissions of the Short-Term Insurance companies. Interestingly, Large and Medium companies have stated the following reasons for hard-to-fill vacancies (INSETA, 2017):
Applicants lack the required educational qualifications required for the post
Applicants lack sufficient and or appropriate work experience required for the post
The remuneration and employment conditions are not appropriate to the post
Equity considerations (race, gender and/or disability) Therefore, the reasons for these vacancies are a mixture of skills-related and non-skills-related reasons. Table 20 overleaf shows the top occupations that are hard to fill in the Short- and Long-Term Insurance sub-sectors within Small and Micro-sized employers. Once again, there were no submissions made from the Collective Investments category of employers.

23 INSETA Sector Skills Plan 2017/18
Table 20: Top hard-to-fill vacancies for small- and micro-sized employers in the short- and long-term insurance sub-sectors
Company Type
Sub Sector Version 15 OFO Code
OFO Code Description (Occupations in the sector)
Reasons for Hard-to Fill Vacancies
No. of Hard-to-Fill Posts: last 6 months
No. of Hard-to-Fill Posts: last 12 months
Micro and Small employers
Long-Term Insurance
2015-332101
Insurance agent / Broker
5 & 10 8 10
2015-241301
Financial Investment Advisor
2 & 3 7 7
2015-212101
Actuary 1 1 2
Small employers
Short-Term Insurance
2015-332102
Insurance Broker 1 & 2 2 2
Legend Reasons for hard-to-fill vacancies 1. Applicants lack the required educational qualifications required for the post 2. Applicants lack sufficient and/or appropriate work experience required for the post 3. The remuneration and employment conditions are not appropriate for the level of the post 4. The post is in an inappropriate location (poor transport, long travelling distance, unsafe area) 5. Job is too demanding and/or does not have regular hours (shift work) 6. Work permit or visa difficulties 7. Equity considerations (race, gender and/or disability) 8. Applicants' personality traits are not suitable for the post or the organisation 9. Do not know 10.Other
Within Small companies, there were 18 hard-to-fill vacancies over the last six months, and 21 hard-to-fill vacancies over the last 12 months. The top hard-to-fill vacancy for Small companies in the Long-Term Insurance category is Insurance Agent, followed by Financial Investment Advisor. Within the Short-Term Insurance category, Insurance Broker remains the top occupation, although this was the only sample received for the Short-Term Insurance category. Given more time, INSETA can reissue the survey; however, based on the historical data received, the information as its stands holds true. The sector is in urgent need of qualified Insurance Brokers and Agents. With the regulator placing pressure on the sector to have all businesses employ only qualified and registered key individuals and representatives, the market ends up with the need to poach from their competitors just to stay in business. This, in turn, affects the wages of the Broker fraternity due to the small pool of skilled people, and this is the same issue with the Actuarial occupations. With the Actuarial occupation though, employers claim that finding people of the right equity has become a major challenge with regard to recruitment. Interestingly, Small and Micro companies have stated the following reasons for hard-to-fill vacancies (INSETA, 2017):
Applicants lack the required educational qualifications required for the post
Applicants lack sufficient and/or appropriate work experience required for the post
The remuneration and employment conditions are not appropriate to the post
Job is too demanding and does not have regular hours/shift work Therefore, the reasons for these vacancies are a mixture of skills-related and non-skills-related reasons.
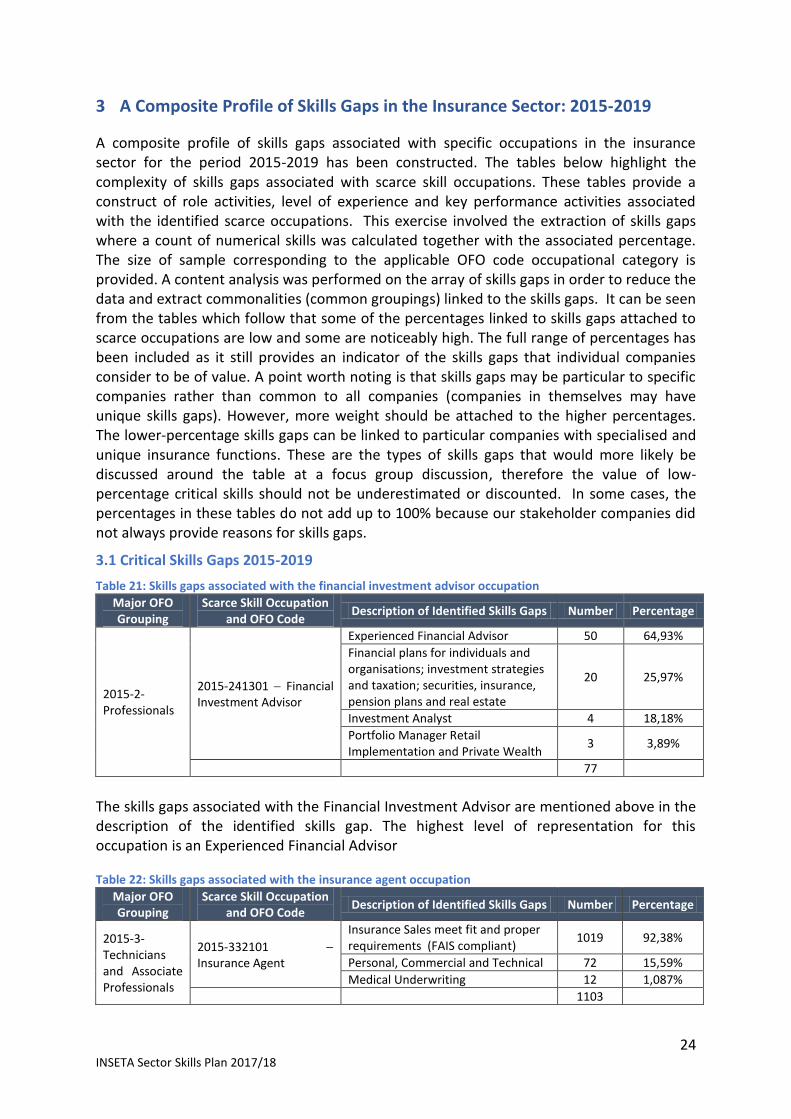
24 INSETA Sector Skills Plan 2017/18
3 A Composite Profile of Skills Gaps in the Insurance Sector: 2015-2019
A composite profile of skills gaps associated with specific occupations in the insurance sector for the period 2015-2019 has been constructed. The tables below highlight the complexity of skills gaps associated with scarce skill occupations. These tables provide a construct of role activities, level of experience and key performance activities associated with the identified scarce occupations. This exercise involved the extraction of skills gaps where a count of numerical skills was calculated together with the associated percentage. The size of sample corresponding to the applicable OFO code occupational category is provided. A content analysis was performed on the array of skills gaps in order to reduce the data and extract commonalities (common groupings) linked to the skills gaps. It can be seen from the tables which follow that some of the percentages linked to skills gaps attached to scarce occupations are low and some are noticeably high. The full range of percentages has been included as it still provides an indicator of the skills gaps that individual companies consider to be of value. A point worth noting is that skills gaps may be particular to specific companies rather than common to all companies (companies in themselves may have unique skills gaps). However, more weight should be attached to the higher percentages. The lower-percentage skills gaps can be linked to particular companies with specialised and unique insurance functions. These are the types of skills gaps that would more likely be discussed around the table at a focus group discussion, therefore the value of low-percentage critical skills should not be underestimated or discounted. In some cases, the percentages in these tables do not add up to 100% because our stakeholder companies did not always provide reasons for skills gaps.
3.1 Critical Skills Gaps 2015-2019
Table 21: Skills gaps associated with the financial investment advisor occupation
Major OFO Grouping
Scarce Skill Occupation and OFO Code
Description of Identified Skills Gaps Number Percentage
2015-2-Professionals
2015-241301 Financial Investment Advisor
Experienced Financial Advisor 50 64,93%
Financial plans for individuals and organisations; investment strategies and taxation; securities, insurance, pension plans and real estate
20 25,97%
Investment Analyst 4 18,18%
Portfolio Manager Retail Implementation and Private Wealth
3 3,89%
77
The skills gaps associated with the Financial Investment Advisor are mentioned above in the description of the identified skills gap. The highest level of representation for this occupation is an Experienced Financial Advisor Table 22: Skills gaps associated with the insurance agent occupation
Major OFO Grouping
Scarce Skill Occupation and OFO Code
Description of Identified Skills Gaps Number Percentage
2015-3-Technicians and Associate Professionals
2015-332101 Insurance Agent
Insurance Sales meet fit and proper requirements (FAIS compliant)
1019 92,38%
Personal, Commercial and Technical 72 15,59%
Medical Underwriting 12 1,087%
1103
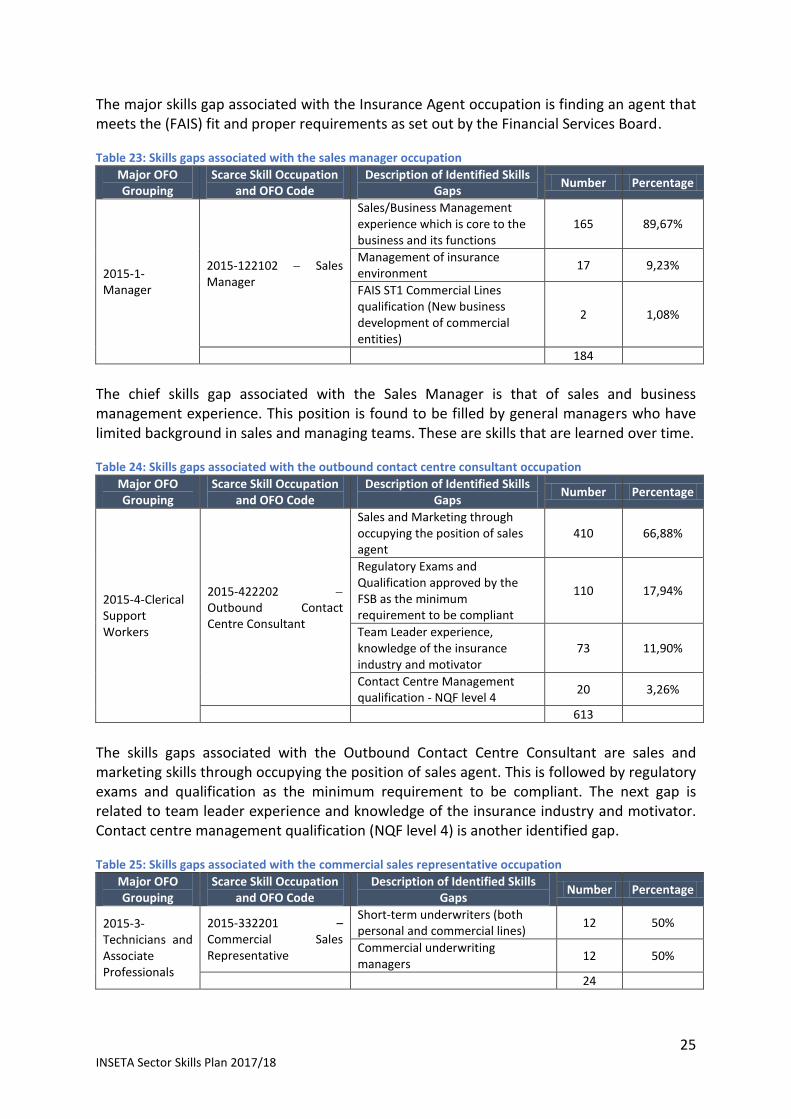
25 INSETA Sector Skills Plan 2017/18
The major skills gap associated with the Insurance Agent occupation is finding an agent that meets the (FAIS) fit and proper requirements as set out by the Financial Services Board. Table 23: Skills gaps associated with the sales manager occupation
Major OFO Grouping
Scarce Skill Occupation and OFO Code
Description of Identified Skills Gaps
Number Percentage
2015-1-Manager
2015-122102 Sales Manager
Sales/Business Management experience which is core to the business and its functions
165 89,67%
Management of insurance environment
17 9,23%
FAIS ST1 Commercial Lines qualification (New business development of commercial entities)
2 1,08%
184
The chief skills gap associated with the Sales Manager is that of sales and business management experience. This position is found to be filled by general managers who have limited background in sales and managing teams. These are skills that are learned over time. Table 24: Skills gaps associated with the outbound contact centre consultant occupation
Major OFO Grouping
Scarce Skill Occupation and OFO Code
Description of Identified Skills Gaps
Number Percentage
2015-4-Clerical Support Workers
2015-422202 Outbound Contact Centre Consultant
Sales and Marketing through occupying the position of sales agent
410 66,88%
Regulatory Exams and Qualification approved by the FSB as the minimum requirement to be compliant
110 17,94%
Team Leader experience, knowledge of the insurance industry and motivator
73 11,90%
Contact Centre Management qualification - NQF level 4
20 3,26%
613
The skills gaps associated with the Outbound Contact Centre Consultant are sales and marketing skills through occupying the position of sales agent. This is followed by regulatory exams and qualification as the minimum requirement to be compliant. The next gap is related to team leader experience and knowledge of the insurance industry and motivator. Contact centre management qualification (NQF level 4) is another identified gap. Table 25: Skills gaps associated with the commercial sales representative occupation
Major OFO Grouping
Scarce Skill Occupation and OFO Code
Description of Identified Skills Gaps
Number Percentage
2015-3-Technicians and Associate Professionals
2015-332201 – Commercial Sales Representative
Short-term underwriters (both personal and commercial lines)
12 50%
Commercial underwriting managers
12 50%
24
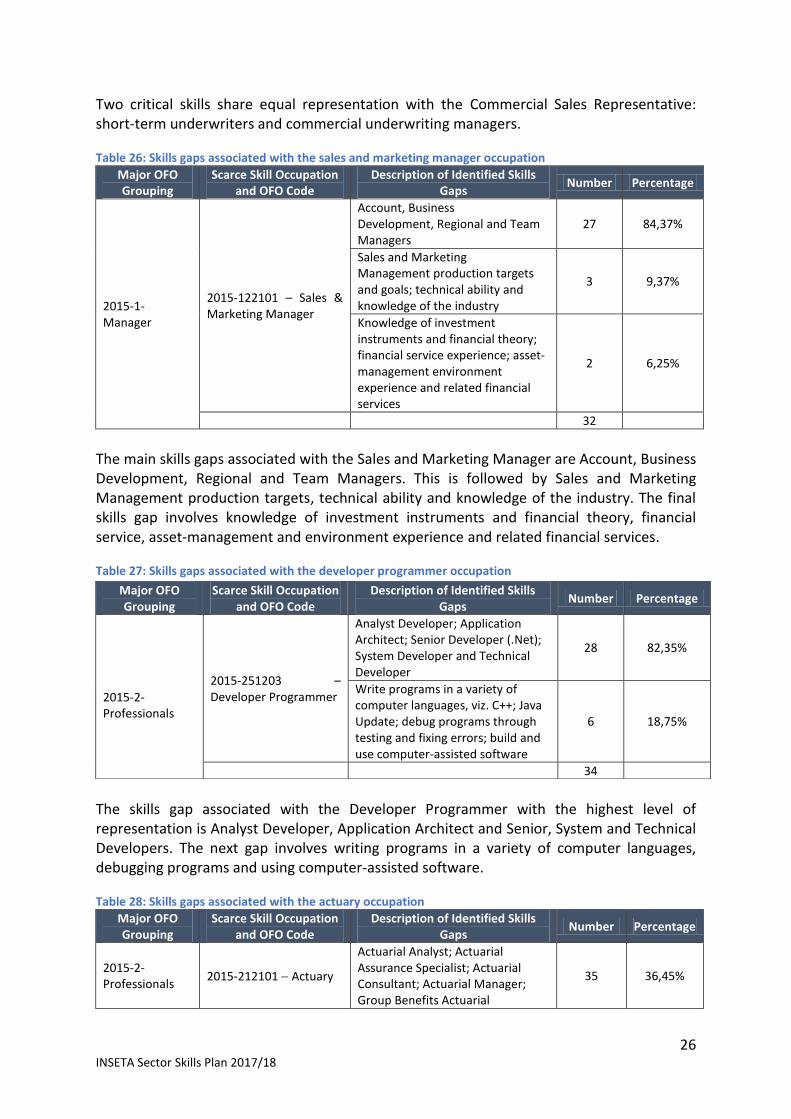
26 INSETA Sector Skills Plan 2017/18
Two critical skills share equal representation with the Commercial Sales Representative: short-term underwriters and commercial underwriting managers. Table 26: Skills gaps associated with the sales and marketing manager occupation
Major OFO Grouping
Scarce Skill Occupation and OFO Code
Description of Identified Skills Gaps
Number Percentage
2015-1-Manager
2015-122101 – Sales & Marketing Manager
Account, Business Development, Regional and Team Managers
27 84,37%
Sales and Marketing Management production targets and goals; technical ability and knowledge of the industry
3 9,37%
Knowledge of investment instruments and financial theory; financial service experience; asset-management environment experience and related financial services
2 6,25%
32
The main skills gaps associated with the Sales and Marketing Manager are Account, Business Development, Regional and Team Managers. This is followed by Sales and Marketing Management production targets, technical ability and knowledge of the industry. The final skills gap involves knowledge of investment instruments and financial theory, financial service, asset-management and environment experience and related financial services. Table 27: Skills gaps associated with the developer programmer occupation
The skills gap associated with the Developer Programmer with the highest level of representation is Analyst Developer, Application Architect and Senior, System and Technical Developers. The next gap involves writing programs in a variety of computer languages, debugging programs and using computer-assisted software. Table 28: Skills gaps associated with the actuary occupation
Major OFO Grouping
Scarce Skill Occupation and OFO Code
Description of Identified Skills Gaps
Number Percentage
2015-2-Professionals
2015-212101 Actuary
Actuarial Analyst; Actuarial Assurance Specialist; Actuarial Consultant; Actuarial Manager; Group Benefits Actuarial
35 36,45%
Major OFO Grouping
Scarce Skill Occupation and OFO Code
Description of Identified Skills Gaps
Number Percentage
2015-2- Professionals
2015-251203 – Developer Programmer
Analyst Developer; Application Architect; Senior Developer (.Net); System Developer and Technical Developer
28 82,35%
Write programs in a variety of computer languages, viz. C++; Java Update; debug programs through testing and fixing errors; build and use computer-assisted software
6 18,75%
34

27 INSETA Sector Skills Plan 2017/18
Major OFO Grouping
Scarce Skill Occupation and OFO Code
Description of Identified Skills Gaps
Number Percentage
Managers; and Management Professionals
Moses testing; VBA; C++; Actuarial studies and exams; IT skills & programming; risk calculation; unique business need
52 54,16%
Consultant: Regulator Co-ordination & Advanced Analytics
1 1,04%
Limited pool Actuaries with long-term insurance experience
8 8,33%
96
The chief skills gaps associated with an Actuary range from Moses testing to unique business need, Actuarial Analyst to Management Professionals, Actuaries with long-term insurance experience, and regulator coordination. Table 29: Skills gaps associated with the insurance administrator occupation
Major OFO Grouping
Scarce Skill Occupation and OFO Code
Description of Identified Skills Gaps
Number Percentage
2015-4-Clerical and Sales Workers
2015-431201 Insurance Administrator
Insurance Consultant with short-term insurance experience
12 80%
Qualified Engineers with underwriting experience
3 20%
15
The main skills gap associated with the Insurance Administrator occupation is Insurance Consultant with short-term insurance experience, followed by qualified Engineers with underwriting experience.
3.2 Top 10 Scarce Skills Occupations for 2017/18
Table 30: Top 10 scarce skills occupations for 2017/18
OFO Occupation and Code Number Percentage
Financial Investment Advisor - 2015-241301 1568 56,70%
Insurance Agent - 2015-332101 425 15,37%
Sales Manager - 2015-122102 205 7,41%
Outbound Contact Centre Consultant - 2015-422202 164 5,93%
Commercial Sales Representative - 2015-332201 126 4,55%
Sales and Marketing Manager - 2015-122101 124 4,48%
Developer Programmer - 2015-251203 61 2,20%
Actuary - 2015-212101 34 1,22%
Business Broker - 2015-333904 30 1,08%
Insurance Administrator - 2015-431201 28 1,01%
Total 2765
Source: WSP data, 2017/18
When one compares the above with the hard-to-fill vacancy survey that was issued earlier this year, one can see that without having the Collective Investment category contribute, we could not have seen that the Financial Investment Advisor was the top scarce skill required amongst all sub-sector categories. Insurance Agent still came out in the top two with the Contact Centre, Developer and Actuary occupations still featuring in the top 10 scarce skills

28 INSETA Sector Skills Plan 2017/18
list. The only occupation of contention is that of the Contact Centre Consultant/Agent, where more in-depth understanding and research will need to be conducted in order to confirm this area as a scarce skill.
4 Extent and Nature of Supply
4.1 The Extent of Occupational Supply in the Sector
The supply of skills into the insurance sector comes from matriculated learners, TVET graduates and Higher Education graduates. The supply of skills into the sector is hampered by the fact that the schooling system is failing in terms of supplying adequate Mathematics and Science students to enter into the insurance-specific professions that are in demand.
4.2 The Challenge of Skills Shortages
There is a growing mismatch between the skills employers need and the talent available. This applies both to technical skills and knowledge and to employees’ capacity to learn, adapt, lead, think laterally and solve problems creatively. Scarce-skill occupations identified in this chapter are those occupational categories where the majority of vacancies exist. These are the most difficult occupations to fill.
4.3 Professional Qualifications
The insurance sector is a highly professionalised sector; it is highly dependent on the professional qualifications band. A huge challenge facing insurance companies is the complexity and cost of regulation. The challenge to INSETA and other industry leaders is to find ways to make this simpler for small operators through creative solutions, training and support. Surveys and industry observers indicate the benefits of tough regulation, and the high professional standards in the sector are a positive thing. However, the roll-out of programmes like FAIS has become a challenge for industry employers to keep up with. In many instances, the insurance brokers and agents are unable to achieve the required qualifications and standards set by the FSB in order to continue working in the sector.
4.4 INSETA’s Contribution to the Supply of Skills in the Insurance Sector
Private learning provision INSETA is delegated by QCTO to perform all quality assurance functions related to the delivery, implementation and promotion of learning programmes as registered on the National Qualifications Framework (NQF) that are quality assured by INSETA. INSETA, through the Education and Training Quality Assurer (ETQA), is responsible for ensuring the following goals for learning provision in the insurance and related financial services sector:
The accreditation of skills development providers (SDPs) for specific standards or qualifications as registered on the NQF
Strengthening the implementation of a quality assurance system through the building of capacity amongst INSETA staff and stakeholders

29 INSETA Sector Skills Plan 2017/18
4.5 The State of Educational and Training Provision
INSETA is one of the key providers of the supply of new skills into the sector through the learnership mechanism. A new model is under consideration at INSETA to incorporate the regulatory exam at the end of the programme so as to guarantee access into the sector, where many are failing in this area. Table 31 below shows the throughput data since 2015 for INSETA’s education and training provision programmes. Table 31: Throughput data for INSETA’s education and training provision programmes – 2015/16 & 2016/17
Programme Strategic Objective
Title Performance
Indicator
Actual Achievement
2015/2016
Planned Target
2016/2017
Actual Achievement
2016/2017
Deviation from Planned
Targets Reasons for Deviations
Occupationally Directed Programmes
Number of youth entering learning programmes
Number of youth receiving bursaries
806 800 820 +20
Based on the need identified by universities and additional funds approved by the Board, additional bursaries were approved
Number of youth completing learning programmes
Number of youth completing bursary-funded programmes
489 700 741 +41 The achievement is consistent with the higher numbers entered in the previous financial year
Number of youth completing learnership programmes
1238 910 1156 +246 The achievement is consistent with the higher numbers entered in the previous financial year
Number of youth completing skills programmes
803 840 869 +29
The achievement is due to TVET College learners who were able to complete before expected and thus counted in this financial year
Number of youth completing internship programmes
Number of youth completing internship programmes
684 560 611 +51 The achievement is consistent with the high numbers entered in the previous financial year

30 INSETA Sector Skills Plan 2017/18
INSETA is pleased to note that targets have been well exceeded across all initiatives. Thus it is fulfilling its mandate and ensuring a steadily increasing supply of education and training for youths to enter the sector. The new supply of skills into the sector needs to take careful consideration of the regulatory requirements in order to ensure a sustainable future within this sector. What this would mean for INSETA is that programmes would need to have consideration for the regulatory board’s requirements before one can enter and practise in the sector.
4.6 QCTO Project and Occupational Qualifications
The following progress has been made with regard to occupational qualifications:
Claims Administrator Occupational Qualification development was completed in July 2015 and submitted to QCTO for approval. This qualification was tabled for presentation to the QCTO review committee meeting on 29 June 2016, then for recommendation to SAQA for approval and registration.
Development on Health Administrator Occupational Qualification is complete. This qualification was submitted to QCTO and is queued for review and recommendation.
The curriculum for Financial Services Representative Occupational Qualification was completed and sent out for industry verification. It is still to be submitted to the QCTO for review and approval.
INSETA invited QCTO officials to make presentations to currently accredited SDPs regarding accreditation with QCTO in preparation to offer occupational qualifications. Two SDPs are in final stages of accreditation with QCTO in preparation to offer the registered Underwriter occupational qualification.
According to a study conducted by INSETA in 2015, traditional training grounds have largely disappeared. Historically, the traditional, large multi-line insurers gave industry entrants an apprenticeship opportunity. With the consolidation of the industry, these opportunities have diminished. Increasingly, skills development is the responsibility of partially-trained managers with limited experience and large gaps in knowledge. With the new occupational qualifications under the QCTO, there is significant buy-in from the sector to support these types of qualifications that will address the issues of the past.
4.7 Supply Problems Experienced by Employers
Employers have indicated the need for greater retention strategies, especially employers in the Contact Centre environment. A company with a call centre of 200-500 call centre agents is, on average, employing 50-80 people weekly in order to keep up with the high turnover in the sector. Meeting employees’ need for stimulation and lifelong learning is a key function of HR management. In a study conducted in 2015 by INSETA, the findings have shown that employees are no longer loyal toward their employers and readily change jobs to improve their immediate situation. Especially now that the country is in a recession, people are looking for higher wages, whilst others are looking to hold on to their jobs in this uncertain economic climate. Figure 7 and Figure 8 overleaf show the reasons for staff turnover.
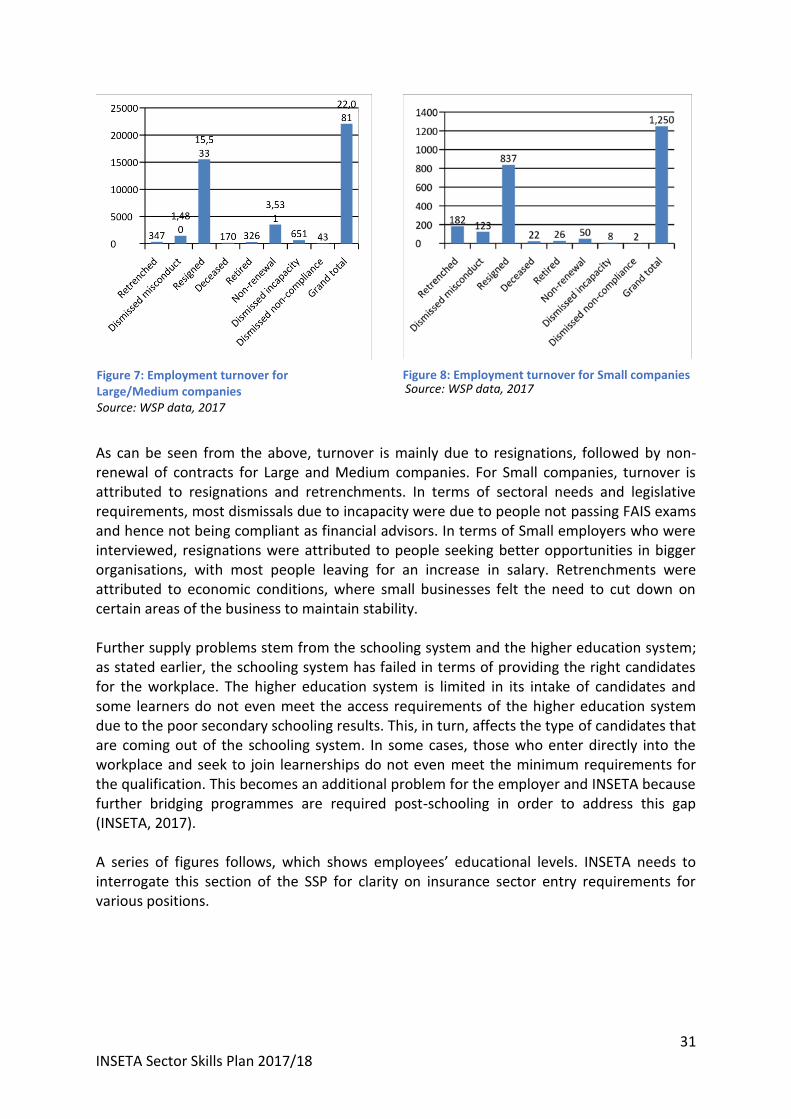
31 INSETA Sector Skills Plan 2017/18
As can be seen from the above, turnover is mainly due to resignations, followed by non-renewal of contracts for Large and Medium companies. For Small companies, turnover is attributed to resignations and retrenchments. In terms of sectoral needs and legislative requirements, most dismissals due to incapacity were due to people not passing FAIS exams and hence not being compliant as financial advisors. In terms of Small employers who were interviewed, resignations were attributed to people seeking better opportunities in bigger organisations, with most people leaving for an increase in salary. Retrenchments were attributed to economic conditions, where small businesses felt the need to cut down on certain areas of the business to maintain stability. Further supply problems stem from the schooling system and the higher education system; as stated earlier, the schooling system has failed in terms of providing the right candidates for the workplace. The higher education system is limited in its intake of candidates and some learners do not even meet the access requirements of the higher education system due to the poor secondary schooling results. This, in turn, affects the type of candidates that are coming out of the schooling system. In some cases, those who enter directly into the workplace and seek to join learnerships do not even meet the minimum requirements for the qualification. This becomes an additional problem for the employer and INSETA because further bridging programmes are required post-schooling in order to address this gap (INSETA, 2017). A series of figures follows, which shows employees’ educational levels. INSETA needs to interrogate this section of the SSP for clarity on insurance sector entry requirements for various positions.
Figure 7: Employment turnover for Large/Medium companies Source: WSP data, 2017
Figure 7: Employment turnover for Small Source: WSP data, 2017
Figure 8: Employment turnover for Small companies
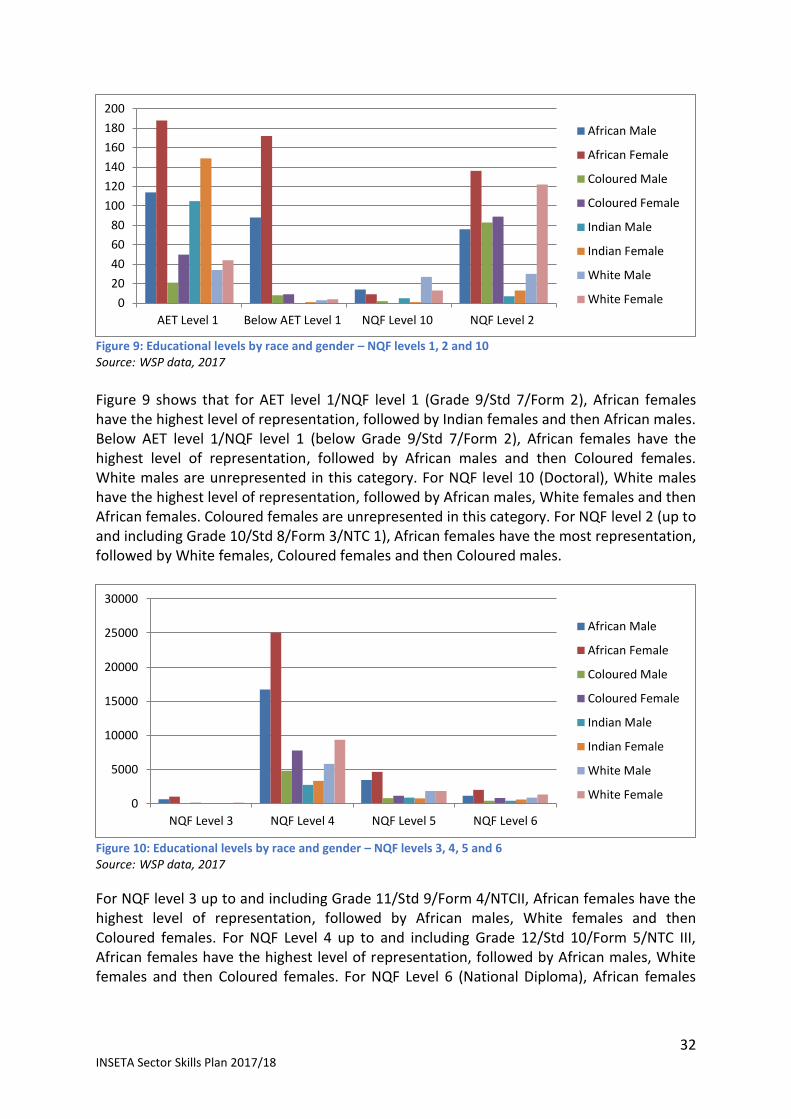
32 INSETA Sector Skills Plan 2017/18
Figure 9: Educational levels by race and gender – NQF levels 1, 2 and 10 Source: WSP data, 2017
Figure 9 shows that for AET level 1/NQF level 1 (Grade 9/Std 7/Form 2), African females have the highest level of representation, followed by Indian females and then African males. Below AET level 1/NQF level 1 (below Grade 9/Std 7/Form 2), African females have the highest level of representation, followed by African males and then Coloured females. White males are unrepresented in this category. For NQF level 10 (Doctoral), White males have the highest level of representation, followed by African males, White females and then African females. Coloured females are unrepresented in this category. For NQF level 2 (up to and including Grade 10/Std 8/Form 3/NTC 1), African females have the most representation, followed by White females, Coloured females and then Coloured males.
Figure 10: Educational levels by race and gender – NQF levels 3, 4, 5 and 6 Source: WSP data, 2017
For NQF level 3 up to and including Grade 11/Std 9/Form 4/NTCII, African females have the highest level of representation, followed by African males, White females and then Coloured females. For NQF Level 4 up to and including Grade 12/Std 10/Form 5/NTC III, African females have the highest level of representation, followed by African males, White females and then Coloured females. For NQF Level 6 (National Diploma), African females
0
20
40
60
80
100
120
140
160
180
200
AET Level 1 Below AET Level 1 NQF Level 10 NQF Level 2
African Male
African Female
Coloured Male
Coloured Female
Indian Male
Indian Female
White Male
White Female
0
5000
10000
15000
20000
25000
30000
NQF Level 3 NQF Level 4 NQF Level 5 NQF Level 6
African Male
African Female
Coloured Male
Coloured Female
Indian Male
Indian Female
White Male
White Female

33 INSETA Sector Skills Plan 2017/18
have the highest level of representation, followed by African males, White females and then White males.
Figure 11: Educational levels by race and gender – NQF levels 7, 8 and 9 Source: WSP data, 2017
For NQF Level 7 (first Degree), African females have the highest level of representation, followed by White males, White females and African males. Noteworthy is that the numbers for White males and females for first degrees are especially close to that of African females. Also worthy to note is that the numbers of Indian females who have first degrees is fairly close to that of African males. For NQF Level 8 (Honours, Professional Degrees), White males have the highest level of representation, followed by White females, African females and African males. For NQF Level 9 (Masters), White males have the highest level of representation, followed by White females, African females and African males. Interestingly, for post-graduate degrees, specifically Honours and Masters Degrees, White people still represent the highest level of representation, notwithstanding the fact that their employment numbers are still appreciably less than Black people. Therefore transformational efforts for funding must focus on higher degrees and registration of more Black people for these types of degrees.
4.8 Impact of Skills Shortages on Insurance Companies
Although many contest its nature and extent, South Africa’s skills shortage is widely regarded as a key factor that prevents the achievement of targeted growth rates. Adcorp, the labour market specialist, attributes South Africa’s skills shortage to the emigration of highly skilled workers, immigration restrictions for highly skilled foreigners, and an education system that cannot respond adequately to employment demands (Adcorp cited in Irmsa 2015). The Corporate Governance Framework Research Institute (CGFRI) states that prescriptive regulation and the lack of a skilled workforce are two significant business growth inhibitors in South Africa, with clear and direct effects on employment. According to CGFRI, 36% of business owners indicate that a lack of skills constrains their expansion plans (IRMSA, 2015).
0
500
1000
1500
2000
2500
3000
NQF 7 NQF 8 NQF 9
African Male
African Female
Coloured Male
Coloured Female
Indian Male
Indian Female
White Male
White Female

34 INSETA Sector Skills Plan 2017/18
5 PIVOTAL List
Below is INSETA’s PIVOTAL List for 2017/18, after which an explanation follows. Table 32: INSETA's PIVOTAL List 2017/18
SHO
RT-
/MED
IUM
- /L
ON
G-T
ERM
PER
IOD
OC
CU
PA
TIO
N C
OD
E
OC
CU
PA
TIO
N
SPEC
IALI
SATI
ON
/
ALT
ERN
ATI
VE
TITL
E
THE
INTE
RV
ENTI
ON
PLA
NN
ED B
Y T
HE
SETA
NQ
F LE
VEL
NQ
F A
LIG
NED
Y/N
QU
AN
TITY
NEE
DED
QU
AN
TITY
TO
BE
SUP
PO
RTE
D B
Y T
HE
SETA
0
-10
0
1
01
-10
00
1
00
1 &
AB
OV
E
C
OM
MEN
TS
Short & Medium
2017-2018
2015-241301
1) Financial Investment Advisor
Financial Agent/Financial Consultant
Training on Financial Plans for Individuals & Organizations; Investment Strategies & Taxation; Securities, Insurance, Pension Plans & Real Estate
NQF LEVELS 3-8
Y 1568 1570 X
Pivotal skills training Funding mechanisms such as learnerships, bursaries, projects & skills programmes
Short & Medium
2017-2018
2015-332101
2) Insurance Agent
Insurance Client Services Agent/Insurance Underwriter
Training on Commercial and Personal Lines insurance as well as Technical & Medical Underwriting. Focus on Fit & Proper Requirements in order to conduct effective insurance sales
NQF LEVELS 1-7
Y
425
1000
X
Pivotal funding is directed at the full range of pivotal scarce & critical skills required
Short & Medium
2017-2018
2015-122102
3) Sales Manager
Sales Executive
Training on the management of the insurance sales environment. FAIS ST1 Commercial Lines qualification (New business development of commercial entities)
NQF LEVELS 1-6
Y
205
1000
X
Funding mechanisms such as learnerships, bursaries, projects & skills programmes
Short & Medium
2017-2018
2015-422202
4) Outbound Contact Centre Consultant
Call or Contact Centre Sales Agent
Training on Contact Centre Management NQF level 4. Training on Regulatory Exams and the obtaining of a Qualification as the minimum requirement to be compliant as approved by the Financial Services Board
NQF LEVELS 1-6
Y
164
1000
X Pivotal funding is directed at the full range of pivotal scarce & critical skills required
Short & Medium
2017-2018
2015-332201
5) Commercial Sales Representative
After-Sales Service Adviser
Training on Personal & Commercial Lines underwriting for the short-term insurance industry
NQF LEVELS 4-5
Y
126
1000
X
Funding mechanisms such as learnerships, bursaries, projects & skills programmes
Short & Medium
2017-2018
2015-122101
6) Sales and Marketing Manager
Sales Executive
Training on procedures to meet Production Targets & Goals. Training on Investment Instruments & Financial Theory. Training on Financial Services & Asset Management
NQF LEVELS 1-8
Y
124
1000
X
Pivotal funding is directed at the full range of pivotal scarce & critical skills required

35 INSETA Sector Skills Plan 2017/18
Note: NQF level is pegged at a broad range rather than a single NQF level because the training interventions occur at multiple NQF levels.
5.1 Methods Used to Identify Occupations in the PIVOTAL list
Stakeholder companies who submitted WSP/ATRs for 2017/2018 identified their scarce skill occupations for this year’s band. The top ten PIVOTAL occupations were identified using the filter facility on MS Excel, and a count and percentage of the total were calculated. INSETA does not impose limitations on PIVOTAL Lists identified by stakeholder companies. It is at the discretion of companies to identify their own skills. Companies have indicated their PIVOTAL Lists for 2015-2019, as defined by the fields on the Indicium system. A consultation workshop was held in January 2017 to reaffirm the PIVOTAL List and further workshops were held in July 2017 to finalise the current PIVOTAL List. The list was then put to the Board of INSETA and approved.
SH
OR
T-/M
EDIU
M-
/LO
NG
-TER
M
PER
IOD
OC
CU
PA
TIO
N C
OD
E
OC
CU
PA
TIO
N
SPEC
IALI
SATI
ON
/
ALT
ERN
ATI
VE
TITL
E
THE
INTE
RV
ENTI
ON
PLA
NN
ED B
Y T
HE
SETA
NQ
F LE
VEL
NQ
F A
LIG
NED
Y/N
Q
UA
NTI
TY N
EED
ED
Q
UA
NTI
TY T
O B
E SU
PP
OR
TED
BY
TH
E
SETA
0-1
00
1
01
-10
00
1
00
1 &
AB
OV
E
C
OM
MEN
TS
Short & Medium
2017-2018
2015-251203
7) Developer Programmer
ICT Developer/Applications Developer
Training to develop high-level system developers, such as analyst, architect & technical developers. Training on writing programs in variety computer languages, such as C++ and Java Update
NQF LEVELS 2-7
Y
61
1000
X
Insufficient no. of Sales & Marketing Managers with suitable critical skills
Short & Medium
2017-2018
2015-212101
8) Actuary
Actuary Manager/Average Adjuster
Training of Actuaries to undertake Moses testing, VBA & C++ programming & Risk Calculations. Training of qualified actuaries to obtain long-term business experience
NQF LEVELS 2-9
Y
34
1000
X
Pivotal funding is directed at the full range of pivotal scarce & critical skills required
Short & Medium
2017-2018
2015-333904
9) Business Broker
Business Agent
Training of Business Brokers to obtain advanced short-term insurance experience
NQF LEVEL 4
Y
30
1000
X
Funding mechanisms, such as learnerships, bursaries, projects & skills programmes
Short & Medium
2017-2018
2015-431201
10) Insurance Administrator
Insurance Brokering Clerk/Assistant
Training of existing Insurance Consultants to obtain short-term insurance experience. Training of Engineers to obtain underwriting experience
NQF LEVELS 1-7
Y
28
1000
X
Pivotal funding is directed at the full range of pivotal scarce & critical skills required
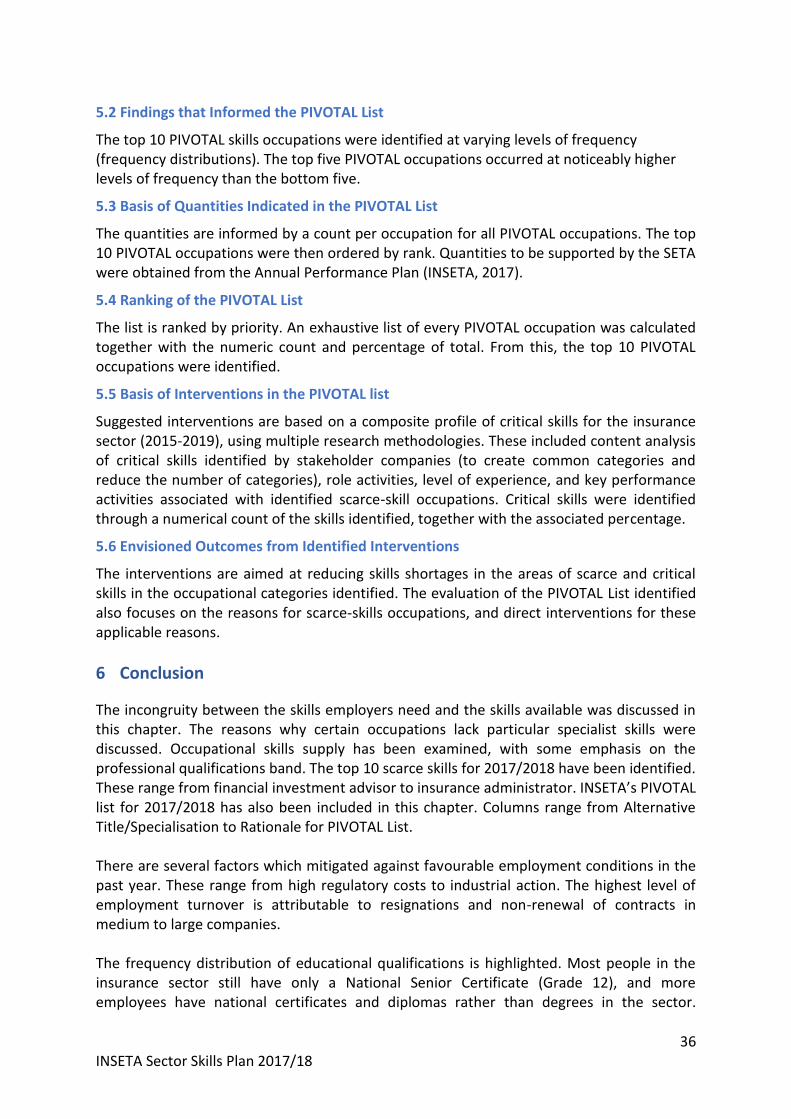
36 INSETA Sector Skills Plan 2017/18
5.2 Findings that Informed the PIVOTAL List
The top 10 PIVOTAL skills occupations were identified at varying levels of frequency (frequency distributions). The top five PIVOTAL occupations occurred at noticeably higher levels of frequency than the bottom five.
5.3 Basis of Quantities Indicated in the PIVOTAL List
The quantities are informed by a count per occupation for all PIVOTAL occupations. The top 10 PIVOTAL occupations were then ordered by rank. Quantities to be supported by the SETA were obtained from the Annual Performance Plan (INSETA, 2017).
5.4 Ranking of the PIVOTAL List
The list is ranked by priority. An exhaustive list of every PIVOTAL occupation was calculated together with the numeric count and percentage of total. From this, the top 10 PIVOTAL occupations were identified.
5.5 Basis of Interventions in the PIVOTAL list
Suggested interventions are based on a composite profile of critical skills for the insurance sector (2015-2019), using multiple research methodologies. These included content analysis of critical skills identified by stakeholder companies (to create common categories and reduce the number of categories), role activities, level of experience, and key performance activities associated with identified scarce-skill occupations. Critical skills were identified through a numerical count of the skills identified, together with the associated percentage.
5.6 Envisioned Outcomes from Identified Interventions
The interventions are aimed at reducing skills shortages in the areas of scarce and critical skills in the occupational categories identified. The evaluation of the PIVOTAL List identified also focuses on the reasons for scarce-skills occupations, and direct interventions for these applicable reasons.
6 Conclusion
The incongruity between the skills employers need and the skills available was discussed in this chapter. The reasons why certain occupations lack particular specialist skills were discussed. Occupational skills supply has been examined, with some emphasis on the professional qualifications band. The top 10 scarce skills for 2017/2018 have been identified. These range from financial investment advisor to insurance administrator. INSETA’s PIVOTAL list for 2017/2018 has also been included in this chapter. Columns range from Alternative Title/Specialisation to Rationale for PIVOTAL List. There are several factors which mitigated against favourable employment conditions in the past year. These range from high regulatory costs to industrial action. The highest level of employment turnover is attributable to resignations and non-renewal of contracts in medium to large companies. The frequency distribution of educational qualifications is highlighted. Most people in the insurance sector still have only a National Senior Certificate (Grade 12), and more employees have national certificates and diplomas rather than degrees in the sector.

37 INSETA Sector Skills Plan 2017/18
INSETA, through its ETQA division and under the jurisdiction of the QCTO, focuses on the cultivation of quality assurance criteria among its SDPs that meet the highest standards of excellence and which ultimately culminate in a best practice model. The developments in relation to the role of ETQA and the development of occupational qualifications, together with the QCTO, have been outlined.
38 INSETA Sector Skills Plan 2017/18
CHAPTER FOUR: SECTOR PARTNERSHIPS
1 Introduction
In this chapter, all INSETA partners are introduced and described. The effectiveness of these partnerships in the sector, with particular reference to TVET colleges, Employers, Professional Bodies and Industry Associations, is assessed. INSETA has also formed sector partnerships with public higher educational institutions, the South African Qualifications Authority (SAQA) and other SETAs such as EWSETA. Our partnerships are reflected in the projects that INSETA runs, in particular those during 2016 and 2017.
2 Existing Partnerships
Figure 12 below represents INSETA’s current partnerships and related projects. Thereafter, Table 33 provides a further explanation of these partnerships and their present status.
Table 33: Description of INSETA’s current partnerships and their status
Description of the Partnership Status of the Partnership
TVET Colleges
Partners: Umfolozi, Vuselela, West Coast, Coastal, False Bay, Gert Sibanda, Ingwe, Letaba, Majuba, Mnambithi, Motheo, Northern Cape rural, Northern Cape urban, South Cape, Taletso, Thekwini, Tshwane North, South West Gauteng, Buffalo City, Cape Town, Flavius Mareka, Tshwane South, Ekurhuleni West, Port Elizabeth, Ikhala, East Cape Midland, Maluti, Orbit, Mthashana This 2015 project targeted learners in TVET Colleges.
This partnership is working well. INSETA has begun lecturer development from 2016 to ensure that lecturers are trained as assessors and moderators. INSETA will be rolling out the insurance-specific qualifications in the TVET colleges from 2019, after development and capacitation matters have been addressed within the TVET college system.
Roll out of insurance qualifications
200 university students funded
2016/17
Development of qualifications
A progression plan to help learners to progress from learnerships to internship to bursary and
extended learning in the workplace
Developments of qualifications
Figure 12: INSETA’s current partnerships and related projects
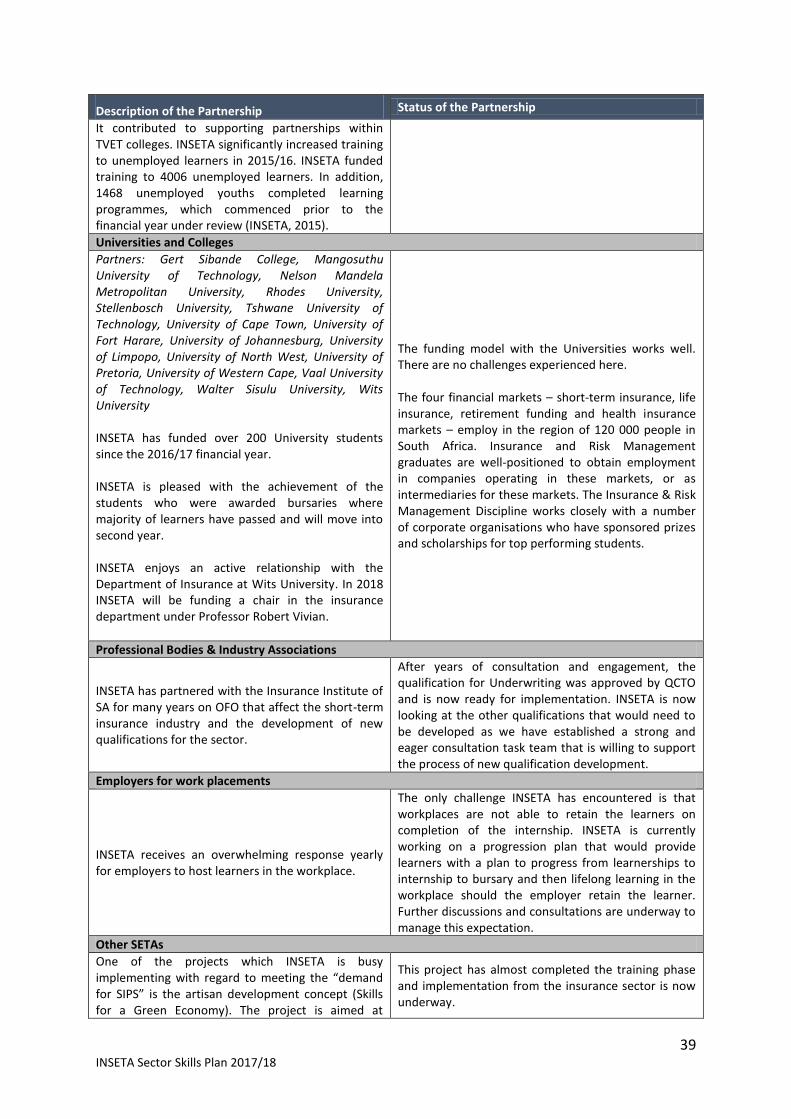
39 INSETA Sector Skills Plan 2017/18
Description of the Partnership Status of the Partnership
It contributed to supporting partnerships within TVET colleges. INSETA significantly increased training to unemployed learners in 2015/16. INSETA funded training to 4006 unemployed learners. In addition, 1468 unemployed youths completed learning programmes, which commenced prior to the financial year under review (INSETA, 2015).
Universities and Colleges
Partners: Gert Sibande College, Mangosuthu University of Technology, Nelson Mandela Metropolitan University, Rhodes University, Stellenbosch University, Tshwane University of Technology, University of Cape Town, University of Fort Harare, University of Johannesburg, University of Limpopo, University of North West, University of Pretoria, University of Western Cape, Vaal University of Technology, Walter Sisulu University, Wits University INSETA has funded over 200 University students since the 2016/17 financial year. INSETA is pleased with the achievement of the students who were awarded bursaries where majority of learners have passed and will move into second year. INSETA enjoys an active relationship with the Department of Insurance at Wits University. In 2018 INSETA will be funding a chair in the insurance department under Professor Robert Vivian.
The funding model with the Universities works well. There are no challenges experienced here. The four financial markets – short-term insurance, life insurance, retirement funding and health insurance markets – employ in the region of 120 000 people in South Africa. Insurance and Risk Management graduates are well-positioned to obtain employment in companies operating in these markets, or as intermediaries for these markets. The Insurance & Risk Management Discipline works closely with a number of corporate organisations who have sponsored prizes and scholarships for top performing students.
Professional Bodies & Industry Associations
INSETA has partnered with the Insurance Institute of SA for many years on OFO that affect the short-term insurance industry and the development of new qualifications for the sector.
After years of consultation and engagement, the qualification for Underwriting was approved by QCTO and is now ready for implementation. INSETA is now looking at the other qualifications that would need to be developed as we have established a strong and eager consultation task team that is willing to support the process of new qualification development.
Employers for work placements
INSETA receives an overwhelming response yearly for employers to host learners in the workplace.
The only challenge INSETA has encountered is that workplaces are not able to retain the learners on completion of the internship. INSETA is currently working on a progression plan that would provide learners with a plan to progress from learnerships to internship to bursary and then lifelong learning in the workplace should the employer retain the learner. Further discussions and consultations are underway to manage this expectation.
Other SETAs
One of the projects which INSETA is busy implementing with regard to meeting the “demand for SIPS” is the artisan development concept (Skills for a Green Economy). The project is aimed at
This project has almost completed the training phase and implementation from the insurance sector is now underway.
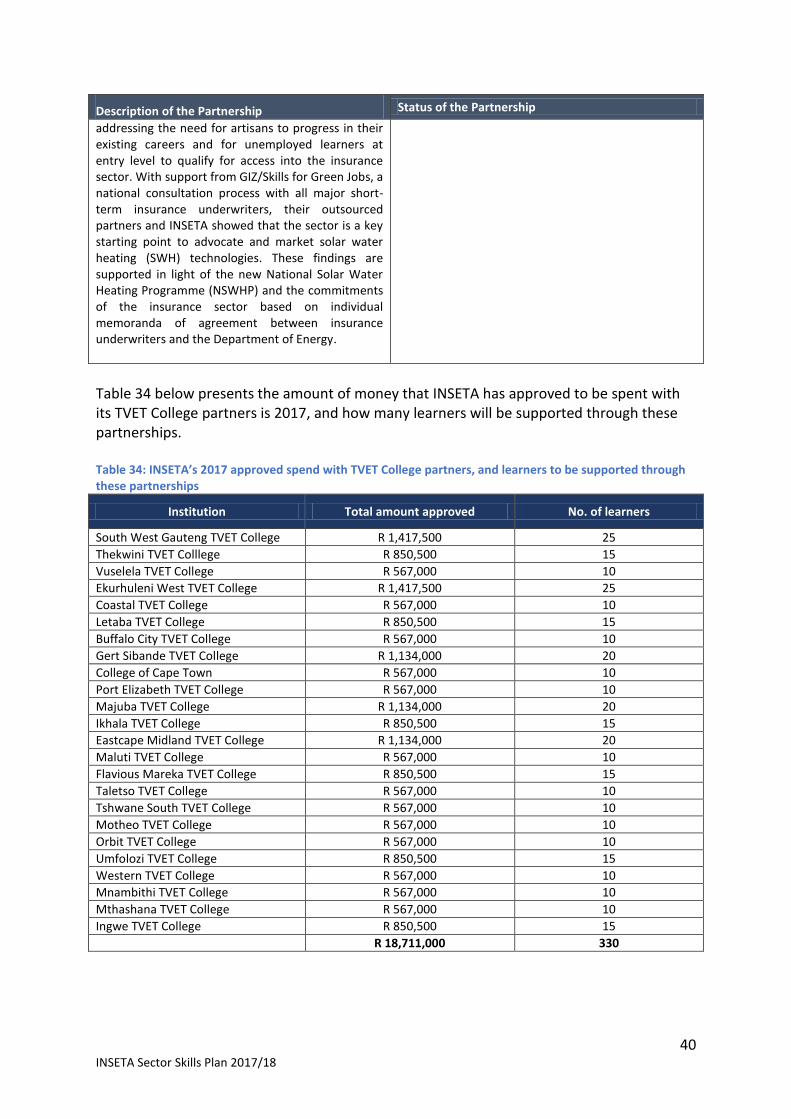
40 INSETA Sector Skills Plan 2017/18
Description of the Partnership Status of the Partnership
addressing the need for artisans to progress in their existing careers and for unemployed learners at entry level to qualify for access into the insurance sector. With support from GIZ/Skills for Green Jobs, a national consultation process with all major short-term insurance underwriters, their outsourced partners and INSETA showed that the sector is a key starting point to advocate and market solar water heating (SWH) technologies. These findings are supported in light of the new National Solar Water Heating Programme (NSWHP) and the commitments of the insurance sector based on individual memoranda of agreement between insurance underwriters and the Department of Energy.
Table 34 below presents the amount of money that INSETA has approved to be spent with its TVET College partners is 2017, and how many learners will be supported through these partnerships. Table 34: INSETA’s 2017 approved spend with TVET College partners, and learners to be supported through these partnerships
Institution Total amount approved No. of learners
South West Gauteng TVET College R 1,417,500 25
Thekwini TVET Colllege R 850,500 15
Vuselela TVET College R 567,000 10
Ekurhuleni West TVET College R 1,417,500 25
Coastal TVET College R 567,000 10
Letaba TVET College R 850,500 15
Buffalo City TVET College R 567,000 10
Gert Sibande TVET College R 1,134,000 20
College of Cape Town R 567,000 10
Port Elizabeth TVET College R 567,000 10
Majuba TVET College R 1,134,000 20
Ikhala TVET College R 850,500 15
Eastcape Midland TVET College R 1,134,000 20
Maluti TVET College R 567,000 10
Flavious Mareka TVET College R 850,500 15
Taletso TVET College R 567,000 10
Tshwane South TVET College R 567,000 10
Motheo TVET College R 567,000 10
Orbit TVET College R 567,000 10
Umfolozi TVET College R 850,500 15
Western TVET College R 567,000 10
Mnambithi TVET College R 567,000 10
Mthashana TVET College R 567,000 10
Ingwe TVET College R 850,500 15
R 18,711,000 330

41 INSETA Sector Skills Plan 2017/18
2.1 Problems Experienced
Usually the partnerships formed within projects present a common set of problems:
A project may not be sustainable because of insufficient candidate support. As a consequence, the partnership formed within the project is disrupted, and may only resume once the conditions required for continuance of the project are attained.
Partnerships within the project team and with all key role players may become strained because of poor delivery of project deliverables. This may also occur when the memoranda of understanding are not properly monitored and prescribed progress reports are not submitted. Strain within partnerships between institutions can also happen when the one institution does not provide prescribed documentation on time and these results in delays in payments for projects.
2.2 Strengthening Partnerships
Partnerships between institutions and within the project team can be strengthened by ensuring that the project deliverables are met. INSETA has established project consultation groups in-house to discuss project concerns and how these can be addressed. The risk meetings on projects are a key component that assists in addressing and strengthening project weaknesses.
2.3 INSETA’s Model of an Ideal Partnership
Figure 13 below represents INSETA’s model of an ideal partnership (adapted from Stephen Key, Co-Founder of inventRight and Author of the “One Simple Idea” Series).
Figure 13: INSETA’s model of an ideal partnership
The success of a business depends on its ability to forge and maintain productive partnerships. Creating the perfect partnership takes understanding, significant effort and above all, a sincere desire to make it work. INSETA’s five-step plan to creating the perfect partnership involves the follows key principles: 1. Determine everyone’s strengths and weaknesses 2. Discuss your short, medium and long-term goals upfront 3. Define all roles explicitly and ensure sound project management
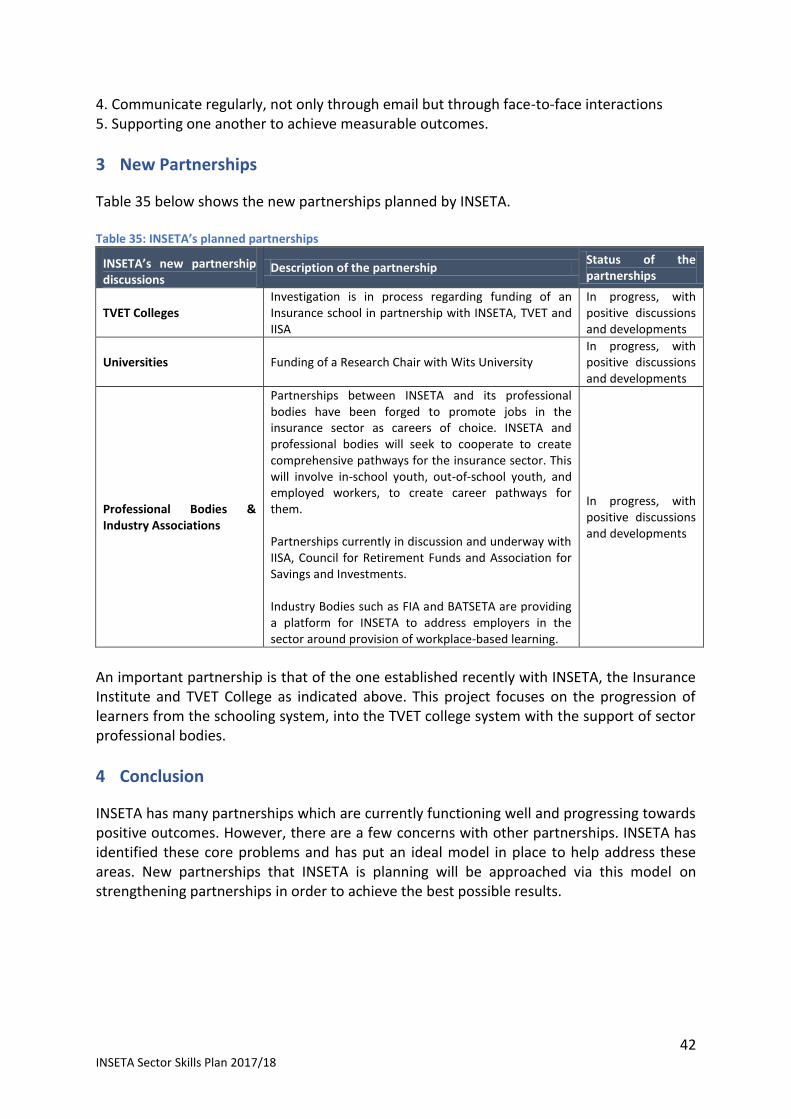
42 INSETA Sector Skills Plan 2017/18
4. Communicate regularly, not only through email but through face-to-face interactions 5. Supporting one another to achieve measurable outcomes.
3 New Partnerships
Table 35 below shows the new partnerships planned by INSETA. Table 35: INSETA’s planned partnerships
INSETA’s new partnership discussions
Description of the partnership Status of the partnerships
TVET Colleges Investigation is in process regarding funding of an Insurance school in partnership with INSETA, TVET and IISA
In progress, with positive discussions and developments
Universities Funding of a Research Chair with Wits University In progress, with positive discussions and developments
Professional Bodies & Industry Associations
Partnerships between INSETA and its professional bodies have been forged to promote jobs in the insurance sector as careers of choice. INSETA and professional bodies will seek to cooperate to create comprehensive pathways for the insurance sector. This will involve in-school youth, out-of-school youth, and employed workers, to create career pathways for them. Partnerships currently in discussion and underway with IISA, Council for Retirement Funds and Association for Savings and Investments. Industry Bodies such as FIA and BATSETA are providing a platform for INSETA to address employers in the sector around provision of workplace-based learning.
In progress, with positive discussions and developments
An important partnership is that of the one established recently with INSETA, the Insurance Institute and TVET College as indicated above. This project focuses on the progression of learners from the schooling system, into the TVET college system with the support of sector professional bodies.
4 Conclusion
INSETA has many partnerships which are currently functioning well and progressing towards positive outcomes. However, there are a few concerns with other partnerships. INSETA has identified these core problems and has put an ideal model in place to help address these areas. New partnerships that INSETA is planning will be approached via this model on strengthening partnerships in order to achieve the best possible results.
43 INSETA Sector Skills Plan 2017/18
CHAPTER FIVE: SKILLS PRIORITY ACTIONS
1 Introduction
In this chapter, findings from all the previous chapters are summarised in order to inform identified skill priority actions for the sector.
2 Findings from Previous Chapters
Chapter 1
The sector is highly competitive and contributes significantly to the GDP.
INSETA received data from 1231 employers in the 2017/18 WSP /ATR submissions.
The number of employers has increased since 2016, with the majority categorised as Small businesses and the vast majority based in Gauteng.
SMEs remain a key driver of economic growth and development.Transformation is gradually occurring across all major groups and occupations. The sector as a whole employs more Blacks (African, Coloureds and Indian) than Whites and at each occupational level. However, in the management category, Whites still hold the majority of positions.
The majority of workers in the insurance sector are women.
Most of the workforce in the sector only has a Grade 12 National Senior Certificate. In 2012, more people had degrees in the sector than at present. Currently, more persons hold certificates and national diplomas (post-schooling) than degrees.
Older members of the workforce own a large part of the knowledge and skills that employers need.
Chapter 2
Social networks are revolutionising traditional business models and changing customer behaviour.
Financial technology companies are on the rise and insurance companies are being pushed towards increasing digital operations in order to survive.
Environmental and sustainability issues are creating uncertainties for policy makers who do not know what the local, regional, societal and economic impacts will be.
New business, investment and regulatory environments, demographic shifts and the rise in power of the emerging markets will all shape the sector’s longer-term future.
The underwriting of political risk insurance, locally and internationally, is a dynamic and growing business.
There is a sector demand for people with certain skills sets to meet transformational goals at various occupational levels.Difficulties with recruitment are slowing transformation. The insurance industry believes the recruitment pool is too small to meet its needs.
The education system is not meeting industry needs and is failing to produce work-ready job applicants.
Regulatory changes improve governance, but compliance is costly, people with the skills to administer compliance are lacking, there is uncertainty regarding implementation, and industry members fear regulations may affect their ability to do business.
44 INSETA Sector Skills Plan 2017/18
A significant concern is that, while in-house compliance officers servicing large insurers are insurance specialists, compliance agencies serving smaller players may have little or no insurance industry knowledge.
The sector needs an influx of technological talent with strong business skills, and there is a global shortage of people with the mix of IT and other skills to manage big data.
Some employers are importing skills that are scarce because it is an urgent or critical need, or to meet future demand through skills transfer.
INSETA’s projects are well-aligned with National Strategies and Plans.
INSETA is currently exploring the possibility of entering into partnerships with community colleges.
INSETA’s SWH strategic integrated project will create opportunities for artisans to progress in their existing careers and for unemployed learners to gain access into the insurance sector.
Chapter 3
There were 132 hard-to-fill vacancies in Large/Medium companies and 18 hard-to-fill vacancies in Small companies in the last six months.
There were 88 hard-to-fill vacancies for Large/Medium companies and 21 hard-to-fill vacancies in Small companies in the last 12 months.
Financial Investment Advisor, Insurance Agent/Broker and Actuarial professional are the hardest vacancies to fill in Small, Medium and Large companies.
There is a growing mismatch between the skills employers need and the talent available. This applies both to technical skills and knowledge and to employees’ capacity to learn, adapt, lead, think laterally and solve problems creatively.
There is a growing demand within the corporate environment for high-level professionals.
The schooling system has failed in terms of providing the right candidates for the workplace. Some learners do not meet the access requirements of the Higher Education system due to poor schooling results.
Turnover is mainly due to resignations, followed by non-renewal of contracts in Large and Medium-sized companies. For Small companies, turnover is mainly attributed to the resignations and retrenchments. Most dismissals are due to people not passing the FAIS exams and hence not meeting the compliance requirements as financial advisors.
Chapter 4
1468 unemployed youths completed learning programmes.
Over 200 University students were funded in the 2016/17 financial year by INSETA. Over 330 TVET College students will be funded in the 2017/18 financial year.
The funding model with the universities is working well.
INSETA receives an overwhelming response from employers annually to host interns. Challenges faced are that employers are unable to employ interns after the internship programme is completed.
Partnerships within the project team can be strengthened by ensuring that the project deliverables are met.
45 INSETA Sector Skills Plan 2017/18
3 Recommended Actions
3.1 Skills Priorities for the Sector
INSETA’s skills priority actions are directed by the foundation that is set by the NSDS III, and are set by the goals of this same strategy. They include increased access to occupationally-directed programmes, better use of workplace skills development, training and support provided to sector cooperatives, Small enterprises and non-governmental organisations, and enhancing career and vocational guidance. Three of INSETA’s programmes (youth, education and development; addressing the need for scarce and critical skills; and Small and Micro-enterprise development) determine the direction of its skills priorities. INSETA’s skills priorities can be seen from the type of projects that are executed. Advance the employability potential of young adults Equip unemployed youths (18-34 years old) with the means to secure a job and a brighter future through education and training. This is achieved through year-on-year funding increases to applicable projects that advance the employability potential of young adults. This support takes various forms in the projects that are run, such as skills programmes for unemployed youths, bursaries for youths not in employment (in collaboration with the National Student Financial Aid Scheme), SME learnerships and internships. Strive to meet transformation targets Assist in tangible ways with the transformation of the insurance sector. One way in which this is realised is through the selection of candidates for bursaries and skills programmes to satisfy the NSDS III principle as follows: Black (85%), Women (54%) and people with Disabilities (4%). Several INSETA projects are geared towards addressing transformational issues. Alleviate the scarce and critical skills in the sector Promote the alleviation of scarce and critical skills in the insurance sector by developing new qualifications through QCTO. This is also achieved through funding applications for bursaries, learnerships and internships, and providing PIVOTAL programmes to support the alleviation of scarce and critical skills. Supporting the professionalization of the sector Foster the development of FSPs by supporting them in their endeavours to obtain FAIS Act credits and pass the regulatory examinations. INSETA gives other tangible expression to this priority through the development of learning material training around FAIS, namely Key Individuals and Representatives manuals. As a SETA, it has also given credence to this objective by developing a national Recognition of Prior Learning option for FSPs, which has the support of the FSB and was developed jointly with SAQA. Supporting rural development initiatives through partnership with cooperatives Promote the development of micro-cooperatives, in particular burial societies. INSETA assists burial societies to register as cooperatives and equips them with skills through the training of burial societies. All INSETA’s projects are evaluated for their degree of risk: high, medium or low. A risk register is in place in which the level of risk is recorded, and how the level of risk can be reduced through applying various interventions.
46 INSETA Sector Skills Plan 2017/18
3.2 Measures to Support National Strategies and Plans
All INSETA’s Discretionary Grant programmes must comply with the key developmental and transformational imperatives of the NSDS III, namely equity profile, class and geography. B-BBEE and the FSC drive the transformation of the sector. INSETA needs to support Small Black business because of the poor state of transformation in this area, which is exacerbated by structural barriers to entry. This support will require concerted efforts and substantial resources. One of the key pillars being investigated by the Human Capital Project for the insurance industry is transformation (INSETA, 2014b). INSETA’s SSP imparts vital substance to Strategic Goal 3: better use of workplace-based skills development through various projects. The Business and System Analysis, Year 13 QCTO Pilot Underwriters, INSETA National Skills Broker Network and Employment Portal, and SME projects are all geared towards alleviating scarce or critical skill shortages and unemployment. INSETA also contributes to the burial society movement and, in turn, to Strategic Goal 4: training and support provided to sector cooperatives, small enterprises and non-governmental organisations. This is achieved by measuring target variables, identifying recent legislation that is relevant to burial societies and stokvels, and encouraging implementation of legislation. The SSP strategically targets geographic regions where burial societies need to be increased. INSETA’s SSP also contributes to Strategic Goal 5: building career and vocational guidance. This is achieved through its plan to adopt a multifaceted approach to career and vocational guidance through empirical analysis of the various elements. The SSP needs to evaluate the current career guidance calendar and appraise whether additional items need to be added. In addition, the SSP needs to evaluate statistics and trends from Goal 4.8 (career paths are mapped to qualifications in all sectors and sub-sectors and are communicated effectively). The SSP must identify relevant elements of the legislative framework and incorporate this into the current strategic plan (INSETA, 2014c). Aspects of the National Development Plan, the New Growth Path and associated National Youth Accord, and the HRDSA (Department of Education, 2009) are all considered when scoping projects. These projects include placing youths in employment through various mechanisms, promoting and developing SMEs, SETAs co-financing training with employers, setting targets to achieve a credible mechanism for skills planning, and meeting demographic and transformational imperatives. Tangible operational measures are put in place through INSETA projects, which wholeheartedly support the goals of the NSDS III, the NDP and the HRDSA 2010-2030.
4 Conclusion
Central conclusions are drawn from the five chapters. What is noteworthy in Chapter 1 is the continuing growth of employers and employees in the sector, though transformational targets still need to be met. Critical to Chapter 2 is that difficulties are experienced with recruitment in the insurance sector and this affects transformation. Compliance was also identified as a troublesome issue. Another polemic which raises concern is the large number
47 INSETA Sector Skills Plan 2017/18
of entry-level workers entering the insurance sector versus the huge need for skilled workers in the same sector. A point worth mentioning from Chapter 3 is the incongruity between the skills employers need and the talent that is available. In Chapter 4, it was highlighted that INSETA has a diverse range of sector partnerships, which include partnerships with TVET colleges, public higher educational institutions, private stakeholder companies, SAQA; and partnerships through projects. New partnerships with professional associations must include the creation of insurance career pathways for the insurance sector. In Chapter 5, five skills priorities were identified. These range from equipping unemployed youth (18-34) with a means to find a job and a brighter future to the promotion and development of micro-cooperatives. Measures to support national strategies and plans include input from discretionary grant programmes, the role of the INSETA SSP, and supporting sector cooperatives as required by the NSDS III. INSETA was in a strong position to facilitate skills plans, with levy income rising by R46 million from the 2014/15 financial year (R371 million) to the 2015/16 financial year (R417 million). In 2016/17, INSETA saw a slight decline in the projected levy income and will remain cautious when budgeting for the 2018/19 financial year. INSETA-funded projects and grant expenditure for the year was R362.8 million. INSETA’s skills blueprint is its SSP, which it regularly updates to keep abreast of trends such as those noted by PWC (2016). During the year, the SSP was again brought up to date with, among other information, the latest scarce and critical skills findings that inform interventions and ensure their relevance to the needs of the market and the plans of the government. In implementing the plan, INSETA promotes the seven NSDS III transformational imperatives. Insurance requires increasingly professional intermediate and high-level occupationally-specific qualifications, such as underwriter, claims assessor, risk manager and actuary. These roles will meet the demands of a competitive and challenging market and enable it to cope with increasingly stringent regulatory requirements. INSETA is committed to supporting the sector to achieve this raised level of qualification, by increasing access to occupationally-directed programmes and to a range of qualifications that meet scarce and critical skills needs. One of a number of catalytic interventions during the year under review was the continuation of our ground-breaking broker development programme, launched towards the end of the previous financial year. It is helping to fill a pressing need in the marketplace. The programme was crafted to cultivate Small to Medium Black brokerages and expand the supply and quality of scarce and high-priority skills, while enriching the industry and fostering transformation. Run in partnership with the Association for Savings and Investments South Africa (ASISA), the project entailed a 12-month development, training and mentorship programme. Concurrently, research was undertaken to gauge the feasibility of a shared-services model including classroom-based education that will ensure optimal, scalable and sustainable approaches to broker development in the future. This project has had a real impact, as evidenced by a growth in revenue and profitability of the eight brokerages involved, as well as the formation of impactful partnerships of beneficiary brokerages. INSETA has also provided support for those who must comply with the “fit and proper” requirements of the FAIS Act. Discussions are in progress on anticipated legislation and will be examined in terms of INSETA’s mandate with the sector and the FSB. A customised “captains of industry” programme was run successfully with a view to creating cutting-edge leadership attributes and management skills for current industry drivers.
48 INSETA Sector Skills Plan 2017/18
REFERENCE LIST
1. BusinessTech. 2015. South African salaries in 2015: what people earn. [Online]. Available at: http://businesstech.co.za/news/general/84863/south-african-salaries-in-2015-what-people-earn/ [Accessed 15 April 2016].
2. BusinessTech. 2016. South Africa projected economic growth to 2024 [Online]. Available at: http://businesstech.co.za/news/general/109577/this-map-shows-south-africas-projected-economic-growth-to-2024/ [Accessed 4 July 2016].
3. Career Junction. 2016. [Website]. Available at: https://www.careerjunction.co.za. 4. Cooperative agreement between INSETA and GIZ on the roll-out of solar water heating
technologies, 2016. [Unpublished]. 5. Deacon and Associates. 2014. Status of skills in the insurance industry. 6. Department of Education. 2009. Human resource development strategy for South Africa
(HRDSA) 2010–2030. Pretoria: Department of Education. 7. Economic Development Department. 2011. New growth path: Framework. [Online].
Available at: http://www.economic.gov.za/communications/51-publications/151-the-new-growth-path-framework [Accessed 18 April 2016].
8. Egan, V. 2009. Environmental constraints on small enterprises in Tanzania: a case study of the retail, electrical, retail clothing and travel industries in Dar Es Salaam. Proceedings of the 2009 International Academy of African American Business (IAABD), Kampala, Uganda 19-23 May.
9. Exco INSETA Artisan development concept – Skills for a Green Economy, 2015. [Unpublished].
10. Financial Services Board. 2017. Role FSB Brochure. [Online]. Available at: https://www.fsb.co.za/Pages/Results.aspx?k=role%20of%20the%20fsb [Accessed 28 May 2017]
11. Harper, D. 2015. iTOO sponsors new learning centre for Insurance Institute of SA. [Online]. Available at: http://www.fanews.co.za/article/training-learnerships/42 [Accessed 18 April 2016].
12. INSETA. 2014a. Annual performance plan September 2014 version 10. Johannesburg: INSETA.
13. INSETA. 2014b. Sector skills plan 30 September 2014. Johannesburg: INSETA. 14. INSETA. 2014c. Strategic plan August 2014 version 6. Johannesburg: INSETA. 15. INSETA. 2014d. Insider, January. Johannesburg: INSETA. 16. INSETA. 2014e. Insider, February. Johannesburg: INSETA. 17. INSETA. 2014f. Insider, March. Johannesburg: INSETA. 18. INSETA. 2014g. Insider, July. Johannesburg: INSETA. 19. INSETA. 2014h. Annual report 2013/14. Johannesburg: INSETA. 20. INSETA. 2015a. Project management information, April. Johannesburg: INSETA. 21. INSETA. 2015b. Research report 2014/15 – Final combined report – Overview of
transformation and skills availability in the South African insurance sector. Johannesburg: INSETA.
22. Institute of Risk Management South Africa (IRMSA). 2015. Risk report. South African risks. Johannesburg: IRMSA.
23. Jakalase, U. 2015. Learning provision and the role of the ETQA. [Unpublished].
49 INSETA Sector Skills Plan 2017/18
24. Kaplan, E. 2015. A concise determination and analysis of selected key elements of the White Paper on post school education and training; launch of The White Paper on Post School Education and Training [Unpublished].
25. Kaplan, E. 2016. 10 questions submitted to the SETA support directorate at the department of higher education and training. Pretoria: DHET.
26. Kesper, A. 2001. Failing or not aiming to grow? Manufacturing SMEs and their contribution to employment growth in South Africa. Urban Forum, 12 (2): 171-330.
27. Kongolo, M. 2010. Job creation versus job shedding and the role of SMEs in economic development. African Journal of Business Management, 4 (11): 2288-2295.
28. KPMG, 2016. South African Insurance Survey. 29. Ladzani, W. and Netswera, G. 2009. Support for rural small businesses in Limpopo
Province, South Africa. Development Southern Africa, 26 (2): 225-239. 30. National Planning Commission. 2012. National development plan 2030. Our future –
make it work. [Online]. Available at: http://www.poa.gov.za/news/Documents/ 31. NPC%20National%20Development%20Plan%20Vision%202030%20-lo-res.pdf [Accessed
19 April 2016]. 32. Peele, T. 2016. QCTO and occupational qualifications. Johannesburg: INSETA.
Unpublished. 33. Price Waterhouse Coopers (PwC). 2015. Insuring African growth. Insurance industry
analysis. [Online]. Available at: https://www.pwc.co.za/en/assets/pdf/insurance-industry-analysis-2015.pdf [Accessed 14 April 2016].
34. Price Waterhouse Coopers (PwC). 2016. Risk management and regulatory compliance. [Online]. Available at: http://www.pwc.co.za/en/risk-management-and-regulatory-compliance/index.jhtml [Accessed 14 April 2016].
35. PSG. 2017. Introduction to Collective Investments. [Online]. Available at: https://www.psg.co.za/support/tutorials/introduction-to-collective-investments. [Accessed 10 June 2017].
36. Republic of South Africa. 2014. List of occupations in high demand. No. 38174. Government Gazette. [Online]. Available at: ttp://www.careerhelp.org.za/download_files/education-training/ List_of_occupations_in_high_demand_2014.pdf [Accessed 19 April 2016].
37. Statistics South Africa. 2016. Statistical release P0441 Gross domestic product. Fourth quarter 2015 [Online]. Available at: http://www.fin24.com/Economy/sa-shed-15-000-jobs-in-first-three-months-of-2016-stats-sa-20160704
38. Statistics South Africa. 2017. Statistical release P02011 Quarterly Labour Force Survey 2017 [Online]. Available at: http://www.statssa.gov.za.


![Chapter 2 SiC Materials and Processing Technology€¦ · 34 2 SiC Materials and Processing Technology Table 2.1 Key electrical parameters of SiC [1] Property 4H-SiC 6H-SiC 3C-SiC](https://img.pdfslide.us/doc/110x75/5f4fd11797ddad63bf719816/chapter-2-sic-materials-and-processing-technology-34-2-sic-materials-and-processing.jpg)