Embed Size (px)
Citation preview
INSETA TRACER STUDY
Final Learnerships
Findings Report
Prepared by:
Urban-Econ
Development Economists
Lake View Office Park
137 Muckleneuk Street
Brooklyn, 0181
Tel: 012 342 8686
E-mail: [email protected]
2
INSETA TRACER STUDY – LEARNERSHIPS FINDINGS REPORT
Table of Contents
1. Background and Introduction ............................................................................................................................................ 9
1.1 Purpose and outcomes of the study ...................................................................................................................... 9
1.2 INSETA Workplace-based Learning Programmes ............................................................................................... 10
2. Methodology ...................................................................................................................................................................... 11
2.1 Target population and sampling approach ....................................................................................................... 11
2.2 Research instruments and survey procedure ..................................................................................................... 12
2.3 Data analysis .......................................................................................................................................................... 12
2.4 Interpretation of results .......................................................................................................................................... 13
3. INSETA Learnership Programme ....................................................................................................................................... 14
3.1 INSETA Supported Learnership Programmes ....................................................................................................... 14
3.2 Programme description ......................................................................................................................................... 16
3.3 Profile of learnership beneficiaries ....................................................................................................................... 17
3.4 Learnership beneficiary responses ....................................................................................................................... 20
3.4.1 Learnership information .................................................................................................................................... 20
3.4.2 Employment outcomes of the learnership respondents ............................................................................... 22
3.4.3 Knowledge and skills gained during the learnership ..................................................................................... 33
3.4.4 Perceived impact of the programme on beneficiaries ................................................................................ 35
3.4.5 Respondents’ perceptions of the learnership ................................................................................................ 39
4. Findings and Recommendations ..................................................................................................................................... 41
4.1 Key research findings ............................................................................................................................................. 41
4.2 Recommendations ................................................................................................................................................ 42
References ............................................................................................................................................................................... 43
3
INSETA TRACER STUDY – LEARNERSHIPS FINDINGS REPORT
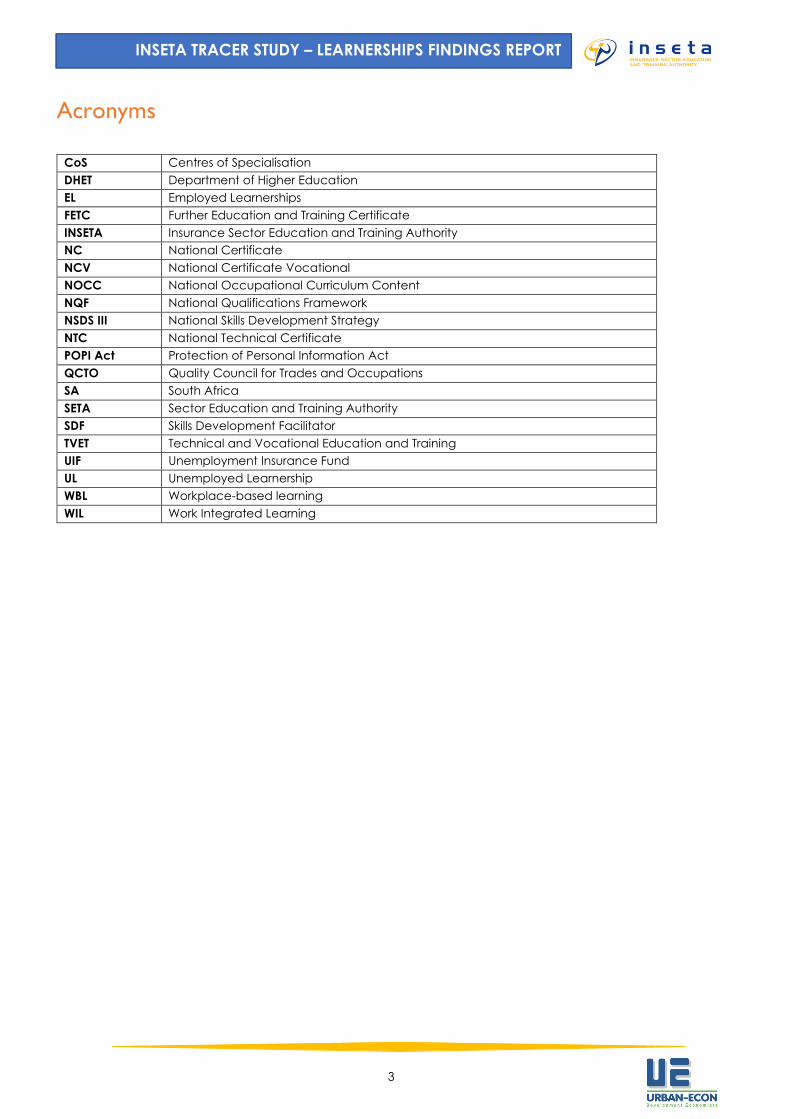
Acronyms
CoS Centres of Specialisation
DHET Department of Higher Education
EL Employed Learnerships
FETC Further Education and Training Certificate
INSETA Insurance Sector Education and Training Authority
NC National Certificate
NCV National Certificate Vocational
NOCC National Occupational Curriculum Content
NQF National Qualifications Framework
NSDS III National Skills Development Strategy
NTC National Technical Certificate
POPI Act Protection of Personal Information Act
QCTO Quality Council for Trades and Occupations
SA South Africa
SETA Sector Education and Training Authority
SDF Skills Development Facilitator
TVET Technical and Vocational Education and Training
UIF Unemployment Insurance Fund
UL Unemployed Learnership
WBL Workplace-based learning
WIL Work Integrated Learning
4
INSETA TRACER STUDY – LEARNERSHIPS FINDINGS REPORT
Glossary
Beneficiary: Refers to an individual who completed a work-based learning programme (in
this case, learnership programme).
Bursaries for workers: Bursaries are financial need-based awards and are available to learners who
applied to Public Higher Education Institutions (universities and TVET colleges)
only. Bursary funding covers tuition costs only and is capped at R30 000 for
degrees; R10 000 for diplomas; and R6 000 for TVET College Certificate courses.
Employed learnership (EL): Employed learnerships are available to employed individuals. The EL
beneficiary must be employed by a levy-paying or non-levy-paying employer
in the Insurance or related services sector. The EL beneficiary does not receive
a stipend, however, R20 000 is allocated to tuition costs.
Employer or host
organisation:
The organisation where the beneficiary was contractually employed or
‘hosted’ to undertake work-based learning (WBL) in order to complete the
learnership programme.
Employment status: A catchall phrase used in the report to capture the destinations of learners who
completed the learnership programme of 2016/17 and refers to any type of
activity as categorised in the survey questionnaire about what they were doing
after the learnership programme in 2018, particularly.
Financial situation: The term as used in the report refers to the respondents’ perceptions of their
financial outcomes following participation in the learnership programme. The
responses were captured through open-ended responses, which differs from
the more objective responses about their gross monthly incomes and income
increases captured through closed questions.
Internship: Internships are open to unemployed persons only. The programme promotes
work experience for unemployed youth by providing them the opportunity to
apply their theoretical training in the workplace. The programme runs for 3, 6
or 12 consecutive months through an employment contract between the
employer or host organisation and the beneficiary. Beneficiaries with a matric
plus qualification receive a stipend of R4 500; those with a degree receive
R6 500.
Learnership programme: Refers to a structured work-based learning programme that includes
theoretical and workplace learning that leads to a registered qualification. The
programme typically runs for a minimum of 12 consecutive months and is
offered to both unemployed persons and employed persons. See Employed
learnership (EL) and Unemployed learnership (UL).
Participant: Refers to an individual who participated in a work-based learning programme
(in this case, learnership programme). See also Beneficiary.
Population size: The total number of the learning programme participants.
Respondent: Refers to a beneficiary who completed the survey.
Sampling frame: The total number of learning programme participants with contactable details.
Sample size: The predetermined total number of participants drawn from the population
size in order to conduct the survey questionnaire.
Total population: All those who graduated from the 2016/17 learnership programme.

5
INSETA TRACER STUDY – LEARNERSHIPS FINDINGS REPORT
Training provider: Refers to an accredited training centre or organisation in partnership with
INSETA to provide sector-related training to candidates of a learning
programme. The training provider takes care of all the administration related
to the beneficiary’s qualification.
Unemployed learnership
(UL):
Unemployed learnerships are available to unemployed youth. The learner
enters into a fixed-term employment contract to achieve workplace learning
while studying towards an NQF registered qualification. The UL beneficiary
receives a stipend of up to R4 000 and tuition costs are covered up to R20 000.
6
INSETA TRACER STUDY – LEARNERSHIPS FINDINGS REPORT
Executive Summary
The executive summary details the key results from the tracking and tracing survey on beneficiaries of the 2016/17
intervention period for the Learnership learning programme in the Insurance sector.
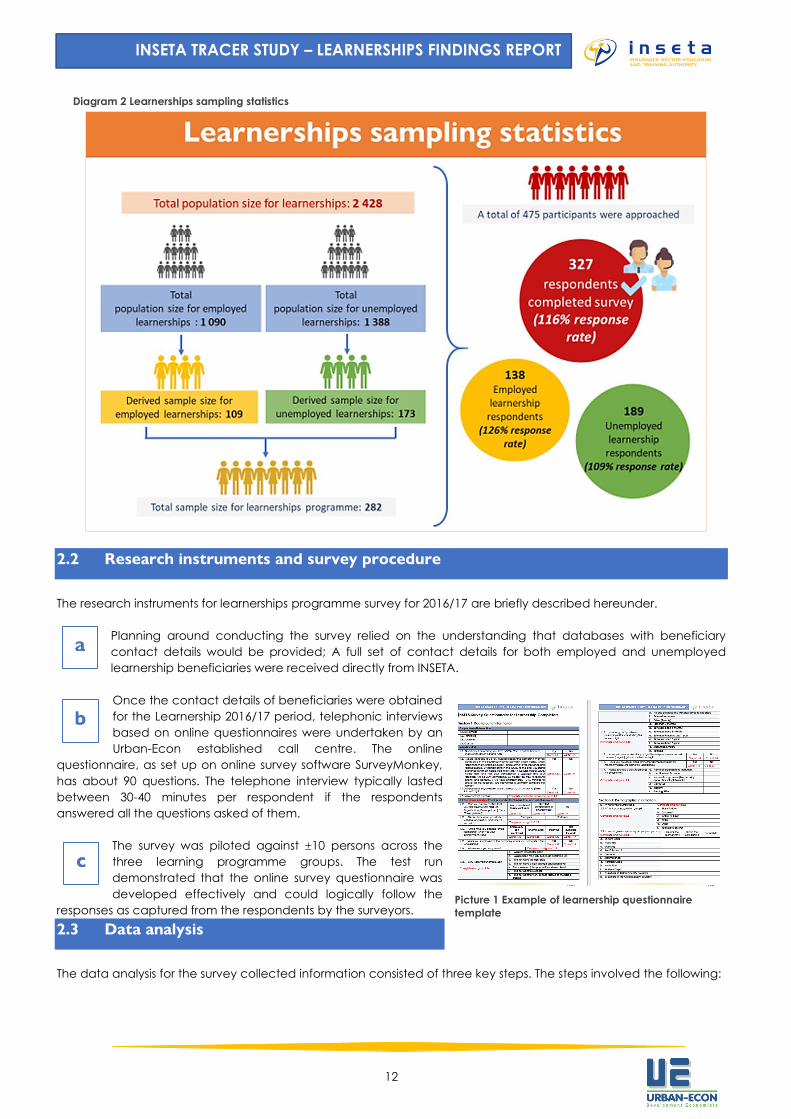
Below are the key sampling statistics for the learnership tracking and tracing that was conducted.
• Total sample: 283
o Unemployed learnerships (UL) split: 173
o Employed learnerships (EL) split: 109
• A total of 475 respondents were contacted
• Total achieved/completed survey: 327 (116% response rate):
o Unemployed learnerships (UL) split: 189 (109% response rate)
o Employed learnerships (EL) split: 138 (126% response rate)
• Usable contacts: 2 521
• Number of calls made: 1 146
• Average number of calls to get a complete survey: ±4
Based on the above statistics, the basis for the research for the learnership programme was without limitations.
Employment outcome of learnerships respondents
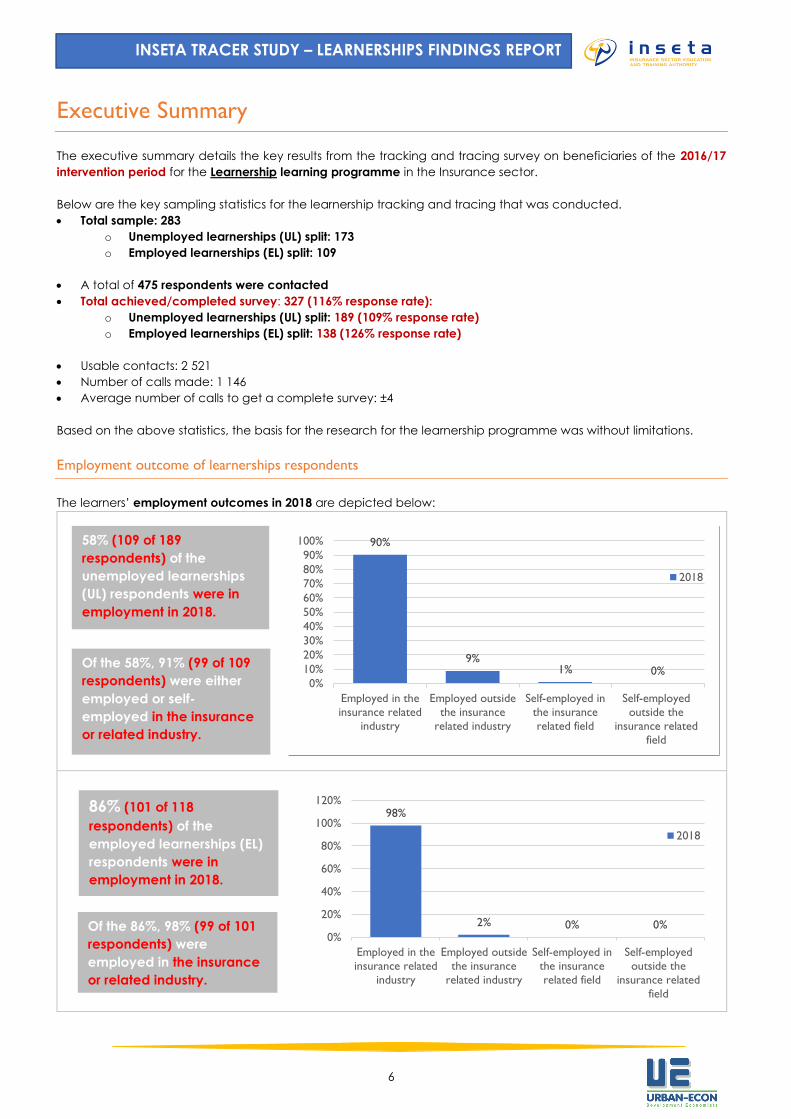
The learners’ employment outcomes in 2018 are depicted below:
90%
9%1% 0%
0%
10%
20%
30%
40%
50%
60%
70%
80%
90%
100%
Employed in the
insurance related
industry
Employed outside
the insurance
related industry
Self-employed in
the insurance
related field
Self-employed
outside the
insurance related
field
2018
98%
2% 0% 0%0%
20%
40%
60%
80%
100%
120%
Employed in the
insurance related
industry
Employed outside
the insurance
related industry
Self-employed in
the insurance
related field
Self-employed
outside the
insurance related
field
2018
58% (109 of 189
respondents) of the
unemployed learnerships
(UL) respondents were in
employment in 2018.
Of the 58%, 91% (99 of 109
respondents) were either
employed or self-
employed in the insurance
or related industry.
86% (101 of 118
respondents) of the
employed learnerships (EL)
respondents were in
employment in 2018.
Of the 86%, 98% (99 of 101
respondents) were
employed in the insurance
or related industry.
7
INSETA TRACER STUDY – LEARNERSHIPS FINDINGS REPORT
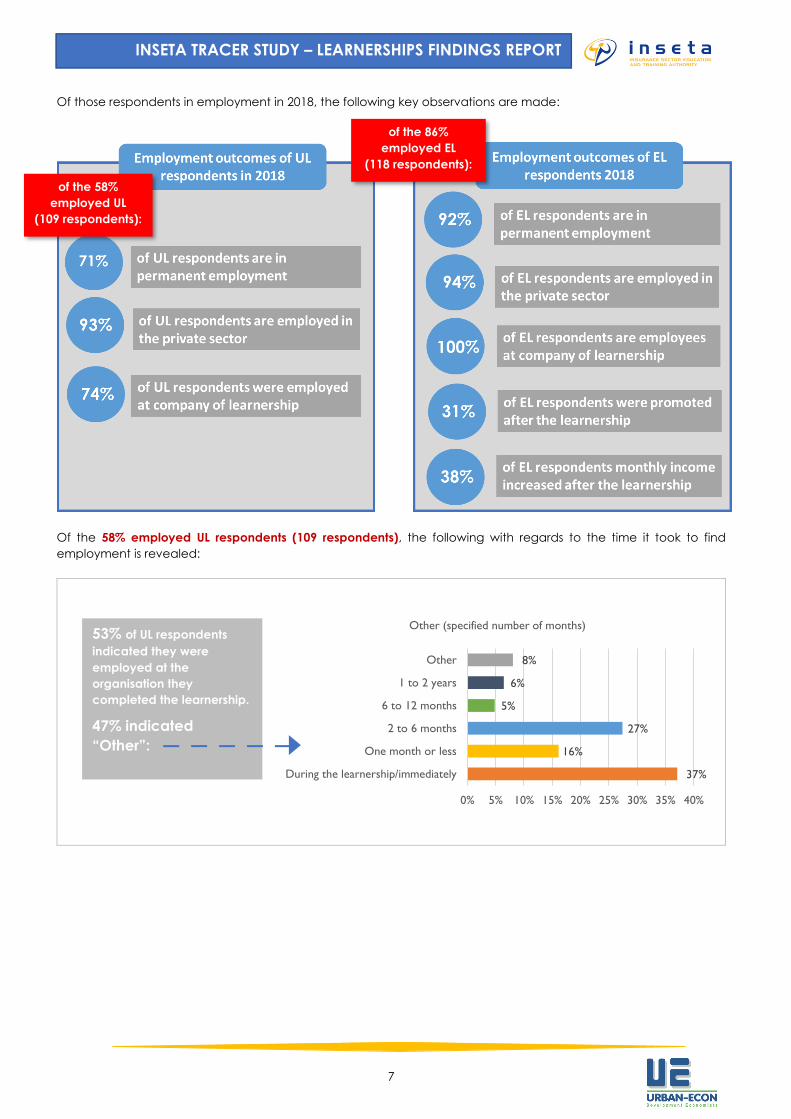
Of those respondents in employment in 2018, the following key observations are made:
Of the 58% employed UL respondents (109 respondents), the following with regards to the time it took to find
employment is revealed:
37%
16%
27%
5%
6%
8%
0% 5% 10% 15% 20% 25% 30% 35% 40%
During the learnership/immediately
One month or less
2 to 6 months
6 to 12 months
1 to 2 years
Other
Other (specified number of months)53% of UL respondents
indicated they were
employed at the
organisation they
completed the learnership.
47% indicated
“Other”:
of the 58%
employed UL
(109 respondents):
of the 86%
employed EL
(118 respondents):
8
INSETA TRACER STUDY – LEARNERSHIPS FINDINGS REPORT
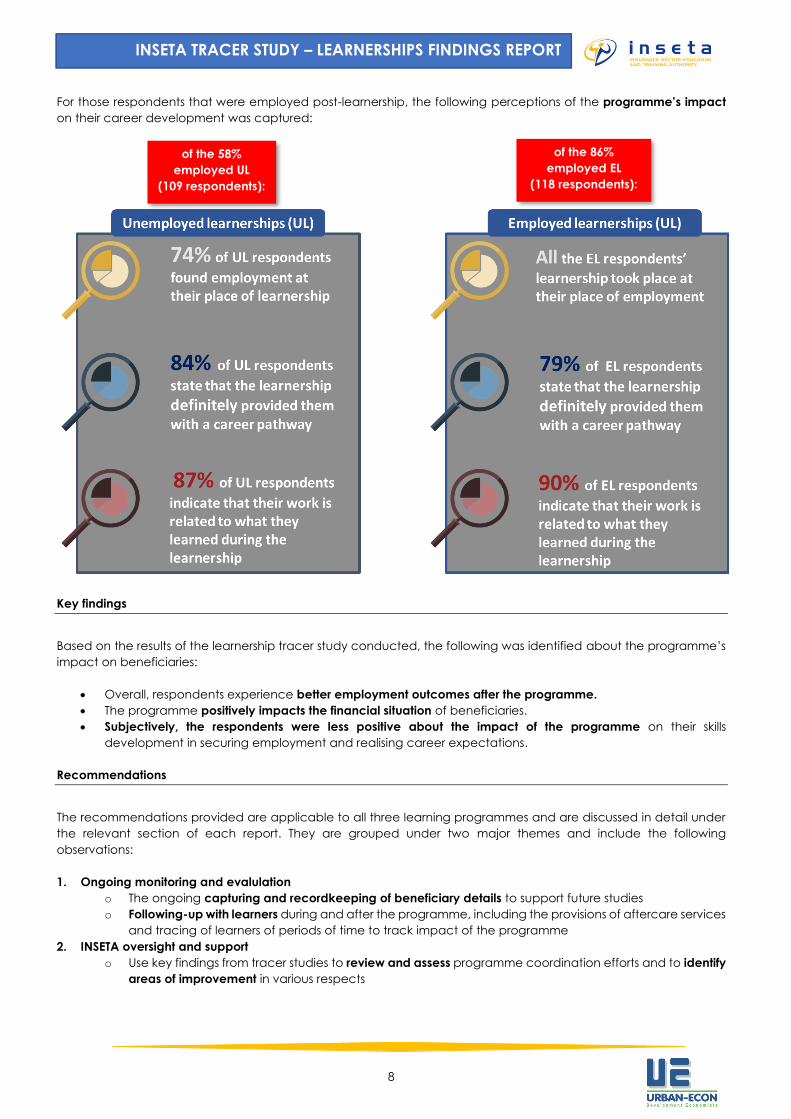
For those respondents that were employed post-learnership, the following perceptions of the programme’s impact
on their career development was captured:
Key findings
Based on the results of the learnership tracer study conducted, the following was identified about the programme’s
impact on beneficiaries:
• Overall, respondents experience better employment outcomes after the programme.
• The programme positively impacts the financial situation of beneficiaries.
• Subjectively, the respondents were less positive about the impact of the programme on their skills
development in securing employment and realising career expectations.
Recommendations
The recommendations provided are applicable to all three learning programmes and are discussed in detail under
the relevant section of each report. They are grouped under two major themes and include the following
observations:
1. Ongoing monitoring and evalulation
o The ongoing capturing and recordkeeping of beneficiary details to support future studies
o Following-up with learners during and after the programme, including the provisions of aftercare services
and tracing of learners of periods of time to track impact of the programme
2. INSETA oversight and support
o Use key findings from tracer studies to review and assess programme coordination efforts and to identify
areas of improvement in various respects
of the 58%
employed UL
(109 respondents):
of the 86%
employed EL
(118 respondents):
9
INSETA TRACER STUDY – LEARNERSHIPS FINDINGS REPORT
1. Background and Introduction
This report details the findings from the tracking and tracing survey on beneficiaries of the 2016/17 Learnership
learning programme in the Insurance sector.
1.1 Purpose and outcomes of the study
The National Skills Development Strategy (NSDS III) is aimed at improving the effectiveness and efficiency of the skills
development system by implementing eight strategic goals, designed to address the eight key identified challenges
faced by South Africa. One of these goals is to encourage better use of workplace-based skills development, aimed
at developing a capable workforce.
To determine whether this goal is being achieved, it is necessary for the SETAs to build an empirical basis for
implementing, monitoring and evaluating programs to address the goals of the NSDS III. It was indicated on
1 April 2018 that SETAs must undertake impact research inclusive of tracer studies and regularly produce their findings.
The current tracer study seeks to respond to this requirement.
The tracer study investigates the destinations of learners who completed INSETA-funded Workplace Based Learning
(WBL) programmes, including internships, bursaries and learnerships. The study serves to explore the key features,
trends, challenges and outcomes of skills interventions in the respective sub-sectors of the Insurance SETA, as follows:
• Short-term insurance,
• Life insurance,
• Insurance and pension funding,
• Risk management,
• Unit trusts,
• Administration of health care benefits,
• Funeral insurance,
• Reinsurance,
• Pension funding, and
• Activities that are auxiliary to financial intermediation (INSETA 2018).
The outcome of the tracer study is to determine whether a type of programme is achieving its mission and to
demonstrate its outcomes. In line with this, the findings from the tracer study will provide INSETA with key information
regarding learners who participated and completed WBL programmes in the last 12-24 months, including:
• Employment status (employed, self-employed and unemployed);
• Employment rates;
• Match between qualifications attained and occupations;
• Nature of employment, in terms of employment sector or types of employment (e.g. formal or informal);
tenure (part-time or full-time, contract or permanent); salary level; benefits (UIF, pension, medical aid,
allowances); and
• Further study.
Fundamentally, the research study assists in further developing a sustainable skills development strategy for the
Insurance SETA. The study reveals information for the following concerns:
• Whether the implemented WBL programmes improved the skills and knowledge for employed beneficiaries;
• Whether the WBL programmes facilitated access to and entry into careers within the Insurance sector for
those who were unemployed; and
• Whether the WBL programmes facilitated access to and entry into self-employment.
The current report provides the complete findings for the Learnership Programme. The report is the first of three stand-
alone reports and is provided for each of the learning programmes. The results of the Bursaries and Internship
Programmes have been compiled into separate reports.
10
INSETA TRACER STUDY – LEARNERSHIPS FINDINGS REPORT
1.2 INSETA Workplace-based Learning Programmes
Workplace-based learning programmes in South Africa comprise internships, learnerships, and apprenticeships. In
line with the NSDS III, these programmes form part of a skills development system that aims to address skills
development challenges and improve workplace training in the country.
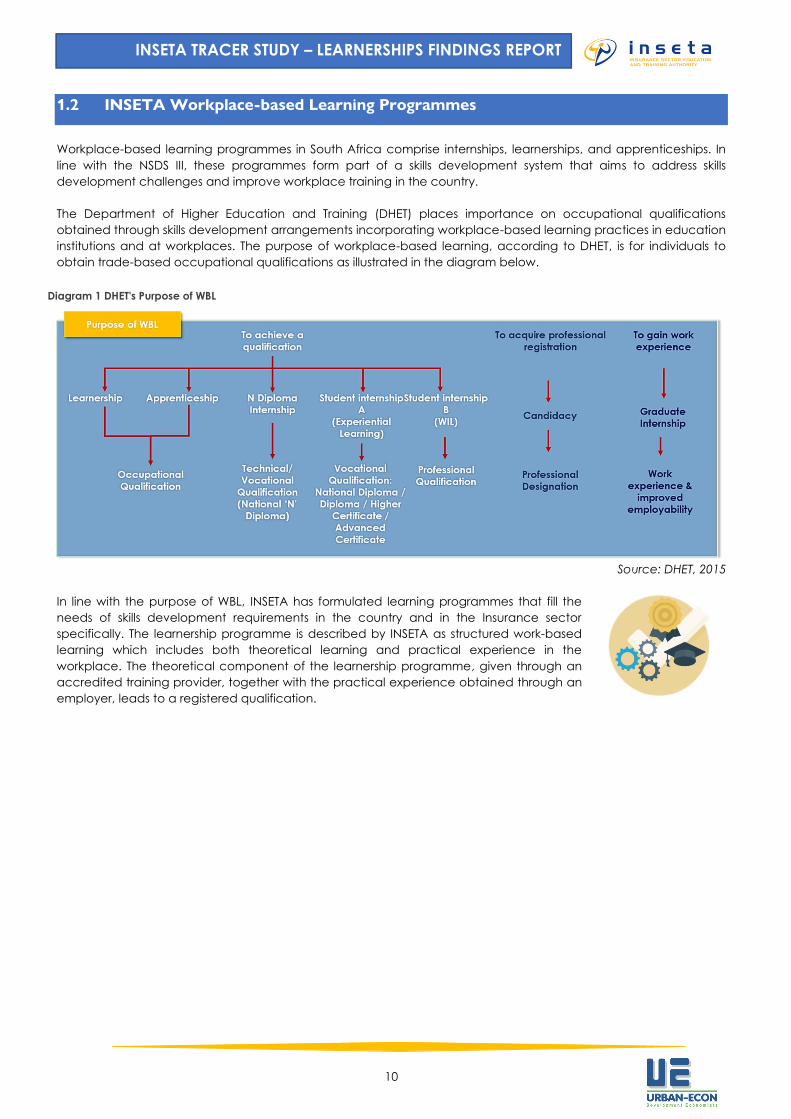
The Department of Higher Education and Training (DHET) places importance on occupational qualifications
obtained through skills development arrangements incorporating workplace-based learning practices in education
institutions and at workplaces. The purpose of workplace-based learning, according to DHET, is for individuals to
obtain trade-based occupational qualifications as illustrated in the diagram below.
Source: DHET, 2015
In line with the purpose of WBL, INSETA has formulated learning programmes that fill the
needs of skills development requirements in the country and in the Insurance sector
specifically. The learnership programme is described by INSETA as structured work-based
learning which includes both theoretical learning and practical experience in the
workplace. The theoretical component of the learnership programme, given through an
accredited training provider, together with the practical experience obtained through an
employer, leads to a registered qualification.
Diagram 1 DHET's Purpose of WBL
11
INSETA TRACER STUDY – LEARNERSHIPS FINDINGS REPORT
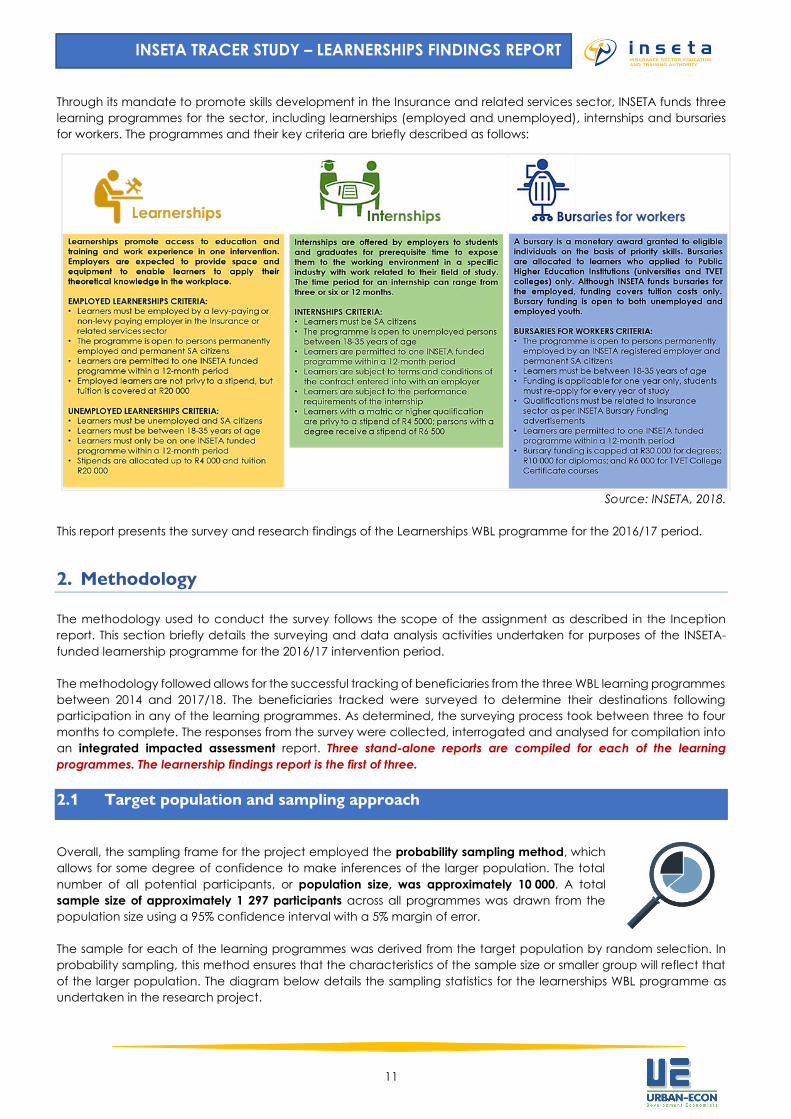
Through its mandate to promote skills development in the Insurance and related services sector, INSETA funds three
learning programmes for the sector, including learnerships (employed and unemployed), internships and bursaries
for workers. The programmes and their key criteria are briefly described as follows:
Source: INSETA, 2018.
This report presents the survey and research findings of the Learnerships WBL programme for the 2016/17 period.
2. Methodology
The methodology used to conduct the survey follows the scope of the assignment as described in the Inception
report. This section briefly details the surveying and data analysis activities undertaken for purposes of the INSETA-
funded learnership programme for the 2016/17 intervention period.
The methodology followed allows for the successful tracking of beneficiaries from the three WBL learning programmes
between 2014 and 2017/18. The beneficiaries tracked were surveyed to determine their destinations following
participation in any of the learning programmes. As determined, the surveying process took between three to four
months to complete. The responses from the survey were collected, interrogated and analysed for compilation into
an integrated impacted assessment report. Three stand-alone reports are compiled for each of the learning
programmes. The learnership findings report is the first of three.
2.1 Target population and sampling approach
Overall, the sampling frame for the project employed the probability sampling method, which
allows for some degree of confidence to make inferences of the larger population. The total
number of all potential participants, or population size, was approximately 10 000. A total
sample size of approximately 1 297 participants across all programmes was drawn from the
population size using a 95% confidence interval with a 5% margin of error.
The sample for each of the learning programmes was derived from the target population by random selection. In
probability sampling, this method ensures that the characteristics of the sample size or smaller group will reflect that
of the larger population. The diagram below details the sampling statistics for the learnerships WBL programme as
undertaken in the research project.
12
INSETA TRACER STUDY – LEARNERSHIPS FINDINGS REPORT
2.2 Research instruments and survey procedure
The research instruments for learnerships programme survey for 2016/17 are briefly described hereunder.
Planning around conducting the survey relied on the understanding that databases with beneficiary
contact details would be provided; A full set of contact details for both employed and unemployed
learnership beneficiaries were received directly from INSETA.
Once the contact details of beneficiaries were obtained
for the Learnership 2016/17 period, telephonic interviews
based on online questionnaires were undertaken by an
Urban-Econ established call centre. The online
questionnaire, as set up on online survey software SurveyMonkey,
has about 90 questions. The telephone interview typically lasted
between 30-40 minutes per respondent if the respondents
answered all the questions asked of them.
The survey was piloted against 10 persons across the
three learning programme groups. The test run
demonstrated that the online survey questionnaire was
developed effectively and could logically follow the
responses as captured from the respondents by the surveyors.
2.3 Data analysis
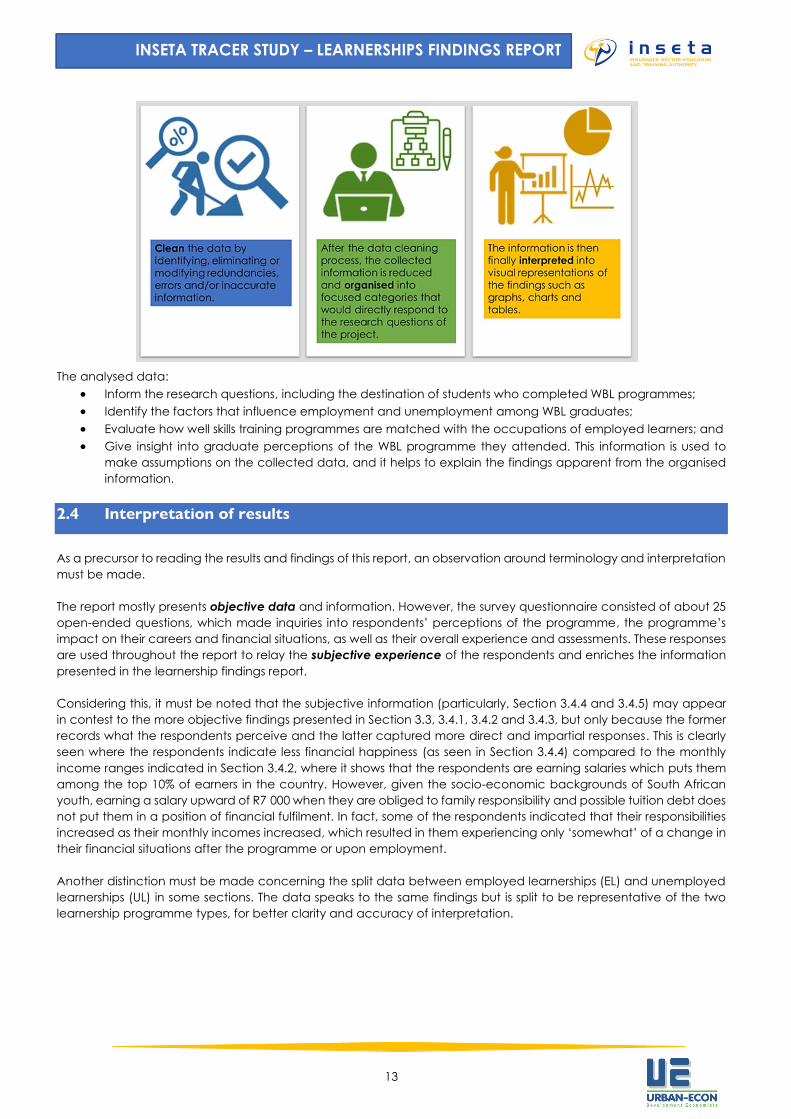
The data analysis for the survey collected information consisted of three key steps. The steps involved the following:
Diagram 2 Learnerships sampling statistics
Picture 1 Example of learnership questionnaire
template
13
INSETA TRACER STUDY – LEARNERSHIPS FINDINGS REPORT
The analysed data:
• Inform the research questions, including the destination of students who completed WBL programmes;
• Identify the factors that influence employment and unemployment among WBL graduates;
• Evaluate how well skills training programmes are matched with the occupations of employed learners; and
• Give insight into graduate perceptions of the WBL programme they attended. This information is used to
make assumptions on the collected data, and it helps to explain the findings apparent from the organised
information.
2.4 Interpretation of results
As a precursor to reading the results and findings of this report, an observation around terminology and interpretation
must be made.
The report mostly presents objective data and information. However, the survey questionnaire consisted of about 25
open-ended questions, which made inquiries into respondents’ perceptions of the programme, the programme’s
impact on their careers and financial situations, as well as their overall experience and assessments. These responses
are used throughout the report to relay the subjective experience of the respondents and enriches the information
presented in the learnership findings report.
Considering this, it must be noted that the subjective information (particularly, Section 3.4.4 and 3.4.5) may appear
in contest to the more objective findings presented in Section 3.3, 3.4.1, 3.4.2 and 3.4.3, but only because the former
records what the respondents perceive and the latter captured more direct and impartial responses. This is clearly
seen where the respondents indicate less financial happiness (as seen in Section 3.4.4) compared to the monthly
income ranges indicated in Section 3.4.2, where it shows that the respondents are earning salaries which puts them
among the top 10% of earners in the country. However, given the socio-economic backgrounds of South African
youth, earning a salary upward of R7 000 when they are obliged to family responsibility and possible tuition debt does
not put them in a position of financial fulfilment. In fact, some of the respondents indicated that their responsibilities
increased as their monthly incomes increased, which resulted in them experiencing only ‘somewhat’ of a change in
their financial situations after the programme or upon employment.
Another distinction must be made concerning the split data between employed learnerships (EL) and unemployed
learnerships (UL) in some sections. The data speaks to the same findings but is split to be representative of the two
learnership programme types, for better clarity and accuracy of interpretation.
14
INSETA TRACER STUDY – LEARNERSHIPS FINDINGS REPORT
3. INSETA Learnership Programme
This section of the report provides an overview of the learnership programmes offered by INSETA and details a
summarised description of the programme as funded by INSETA and the expectations it holds for all parties involved.
The section then presents the results from the learnership survey conducted in the month of July 2019.
3.1 INSETA Supported Learnership Programmes
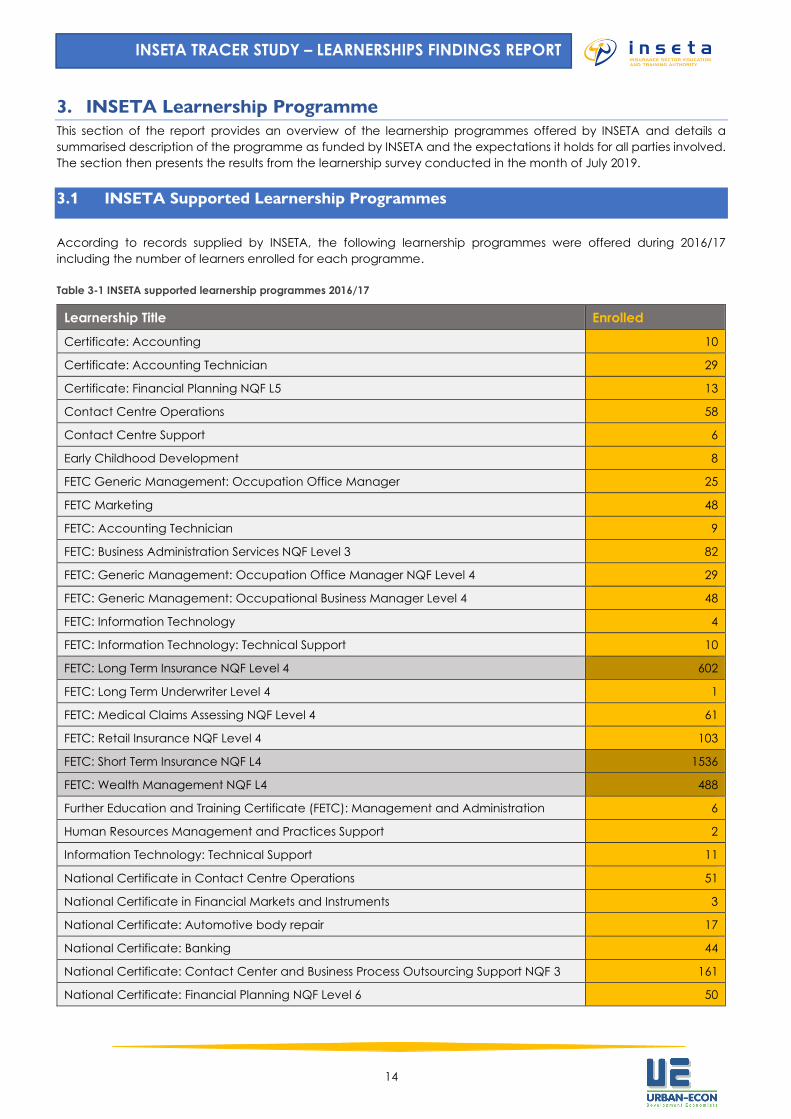
According to records supplied by INSETA, the following learnership programmes were offered during 2016/17
including the number of learners enrolled for each programme.
Table 3-1 INSETA supported learnership programmes 2016/17
Learnership Title Enrolled
Certificate: Accounting 10
Certificate: Accounting Technician 29
Certificate: Financial Planning NQF L5 13
Contact Centre Operations 58
Contact Centre Support 6
Early Childhood Development 8
FETC Generic Management: Occupation Office Manager 25
FETC Marketing 48
FETC: Accounting Technician 9
FETC: Business Administration Services NQF Level 3 82
FETC: Generic Management: Occupation Office Manager NQF Level 4 29
FETC: Generic Management: Occupational Business Manager Level 4 48
FETC: Information Technology 4
FETC: Information Technology: Technical Support 10
FETC: Long Term Insurance NQF Level 4 602
FETC: Long Term Underwriter Level 4 1
FETC: Medical Claims Assessing NQF Level 4 61
FETC: Retail Insurance NQF Level 4 103
FETC: Short Term Insurance NQF L4 1536
FETC: Wealth Management NQF L4 488
Further Education and Training Certificate (FETC): Management and Administration 6
Human Resources Management and Practices Support 2
Information Technology: Technical Support 11
National Certificate in Contact Centre Operations 51
National Certificate in Financial Markets and Instruments 3
National Certificate: Automotive body repair 17
National Certificate: Banking 44
National Certificate: Contact Center and Business Process Outsourcing Support NQF 3 161
National Certificate: Financial Planning NQF Level 6 50
15
INSETA TRACER STUDY – LEARNERSHIPS FINDINGS REPORT
National Certificate: Generic Management 30
National Certificate: Generic Management: General Management Level 5 92
National Certificate: Information Technology (System Development) 45
National Certificate: Information Technology: End User Computing 175
National Certificate: Management 52
National Certificate: Spray Painting 6
National Certificate: Wealth Management NQF Level 5 867
National Certificate: Wholesale and Retail Operations 11
NC: Contact Centre and Business Process Outsourcing Support 54
NC: Financial Services Administrator NQF Level 3 73
NC: Financial Services NQF Level 2 43
Pharmacist Assistant 15
Project Management 18
Secretarial Administration 21
Short Term Insurance: Commercial/Industrial Underwriter NQF Level 4 2
Grand Total 5019
Source: INSETA, 2018.
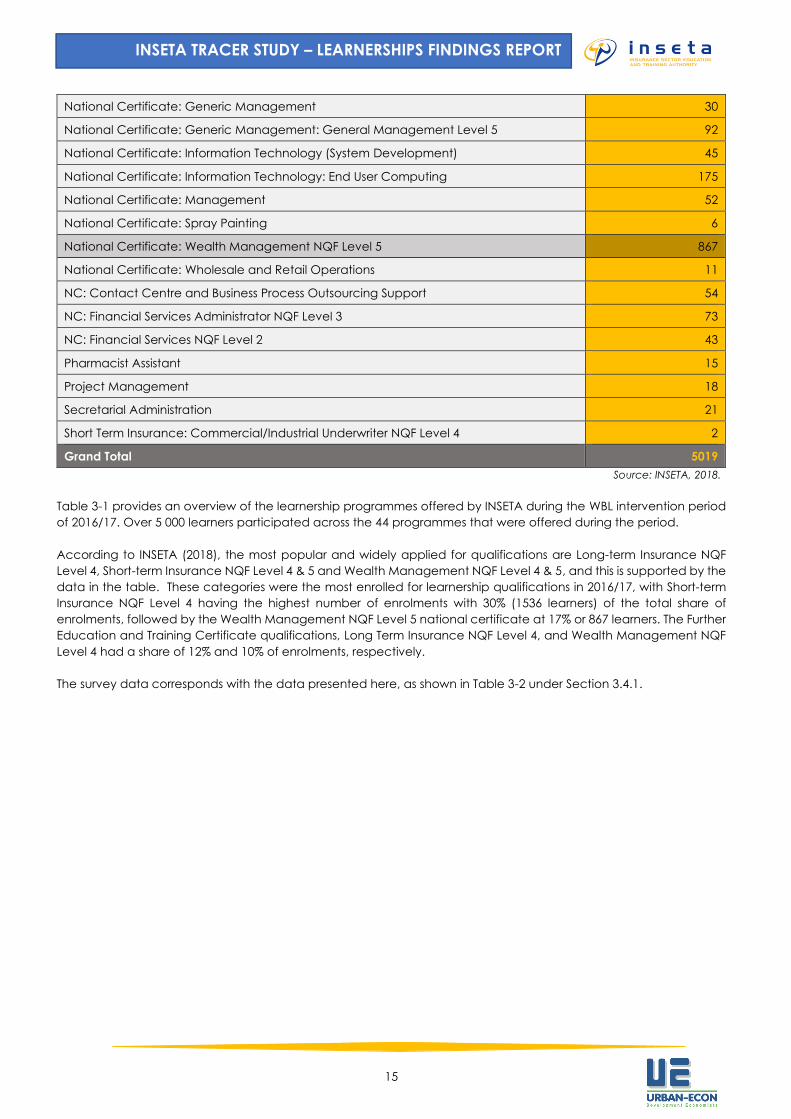
Table 3-1 provides an overview of the learnership programmes offered by INSETA during the WBL intervention period
of 2016/17. Over 5 000 learners participated across the 44 programmes that were offered during the period.
According to INSETA (2018), the most popular and widely applied for qualifications are Long-term Insurance NQF
Level 4, Short-term Insurance NQF Level 4 & 5 and Wealth Management NQF Level 4 & 5, and this is supported by the
data in the table. These categories were the most enrolled for learnership qualifications in 2016/17, with Short-term
Insurance NQF Level 4 having the highest number of enrolments with 30% (1536 learners) of the total share of
enrolments, followed by the Wealth Management NQF Level 5 national certificate at 17% or 867 learners. The Further
Education and Training Certificate qualifications, Long Term Insurance NQF Level 4, and Wealth Management NQF
Level 4 had a share of 12% and 10% of enrolments, respectively.
The survey data corresponds with the data presented here, as shown in Table 3-2 under Section 3.4.1.
16
INSETA TRACER STUDY – LEARNERSHIPS FINDINGS REPORT
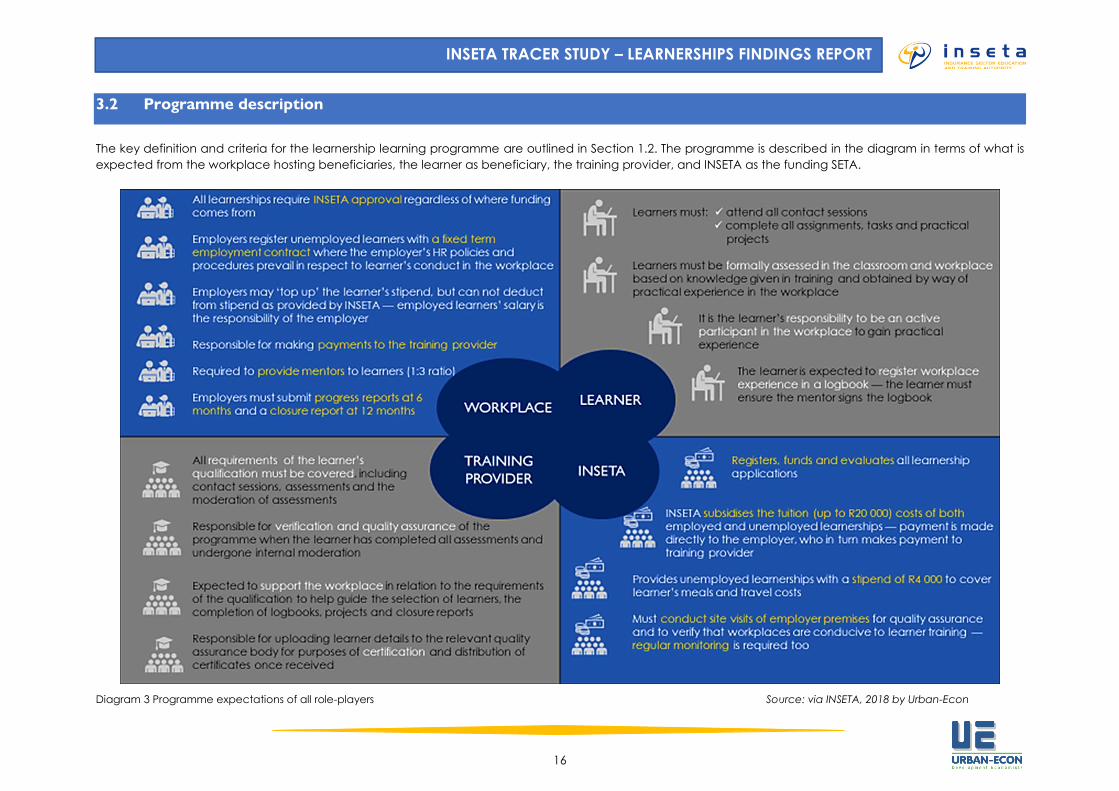
3.2 Programme description
The key definition and criteria for the learnership learning programme are outlined in Section 1.2. The programme is described in the diagram in terms of what is
expected from the workplace hosting beneficiaries, the learner as beneficiary, the training provider, and INSETA as the funding SETA.
Diagram 3 Programme expectations of all role-players Source: via INSETA, 2018 by Urban-Econ
17
INSETA TRACER STUDY – LEARNERSHIPS FINDINGS REPORT
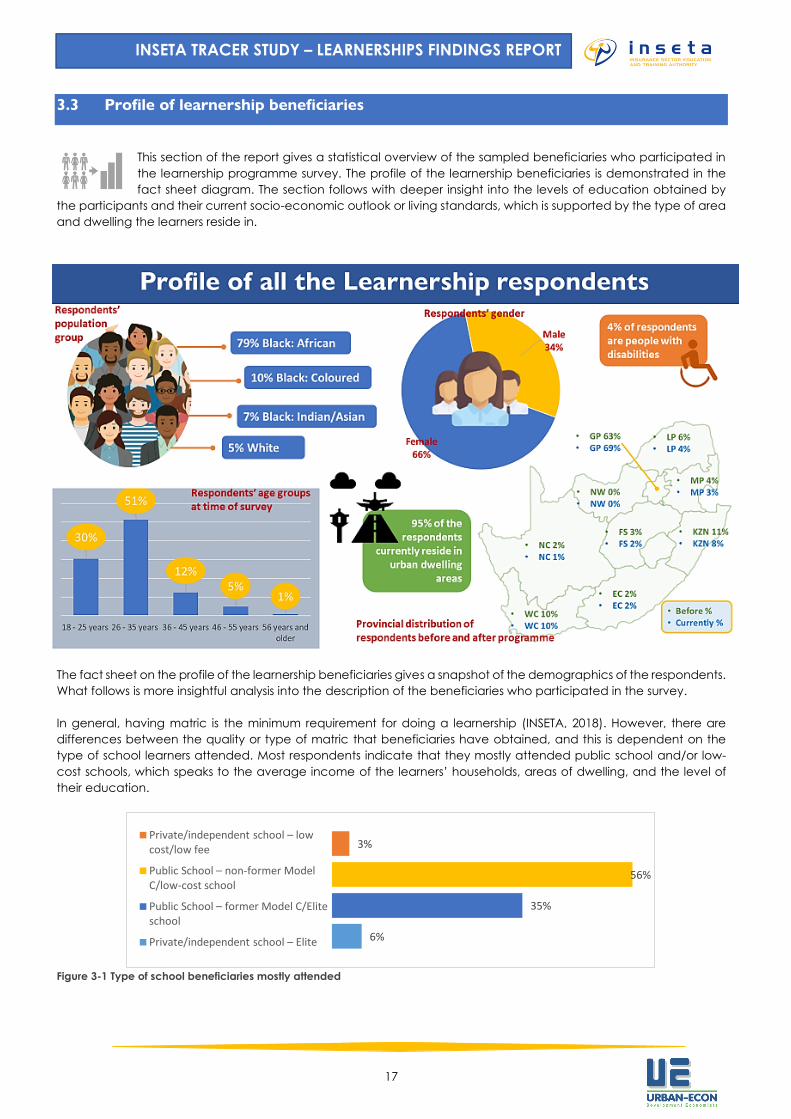
3.3 Profile of learnership beneficiaries
This section of the report gives a statistical overview of the sampled beneficiaries who participated in
the learnership programme survey. The profile of the learnership beneficiaries is demonstrated in the
fact sheet diagram. The section follows with deeper insight into the levels of education obtained by
the participants and their current socio-economic outlook or living standards, which is supported by the type of area
and dwelling the learners reside in.
The fact sheet on the profile of the learnership beneficiaries gives a snapshot of the demographics of the respondents.
What follows is more insightful analysis into the description of the beneficiaries who participated in the survey.
In general, having matric is the minimum requirement for doing a learnership (INSETA, 2018). However, there are
differences between the quality or type of matric that beneficiaries have obtained, and this is dependent on the
type of school learners attended. Most respondents indicate that they mostly attended public school and/or low-
cost schools, which speaks to the average income of the learners’ households, areas of dwelling, and the level of
their education.
Figure 3-1 Type of school beneficiaries mostly attended
6%
35%
56%
3%Private/independent school – low cost/low fee
Public School – non-former Model C/low-cost school
Public School – former Model C/Elite school
Private/independent school – Elite
18
INSETA TRACER STUDY – LEARNERSHIPS FINDINGS REPORT
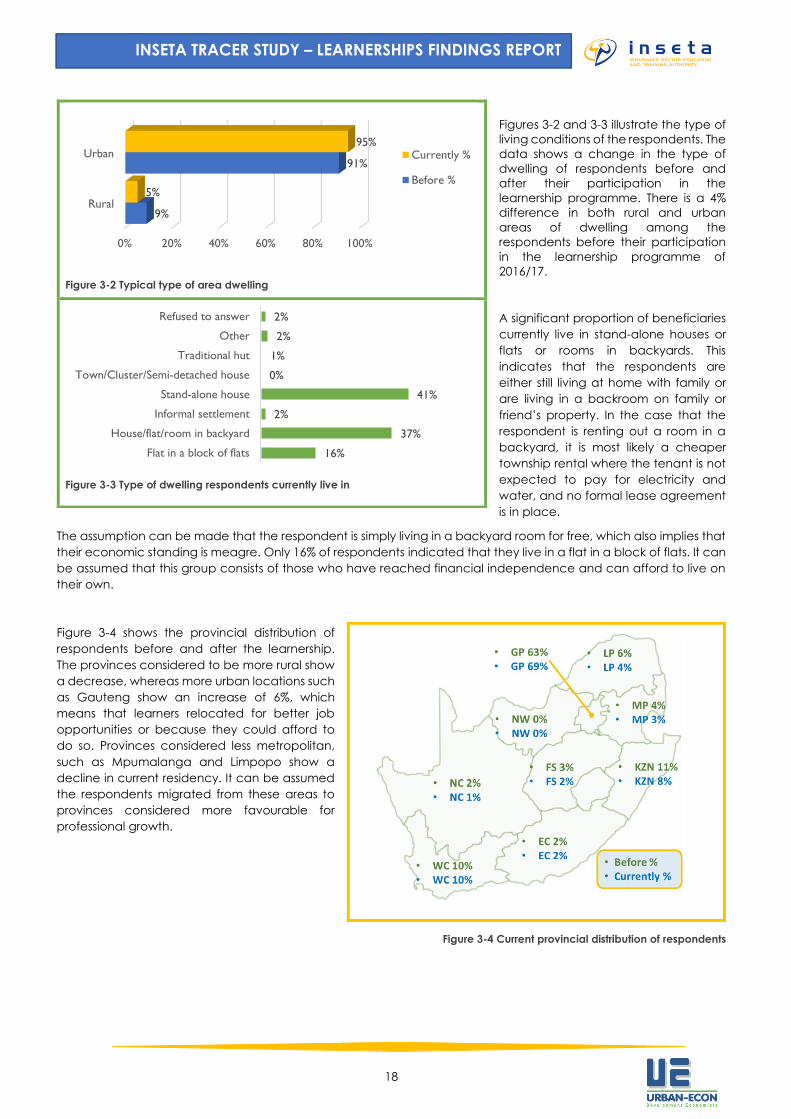
Figures 3-2 and 3-3 illustrate the type of
living conditions of the respondents. The
data shows a change in the type of
dwelling of respondents before and
after their participation in the
learnership programme. There is a 4%
difference in both rural and urban
areas of dwelling among the
respondents before their participation
in the learnership programme of
2016/17.
A significant proportion of beneficiaries
currently live in stand-alone houses or
flats or rooms in backyards. This
indicates that the respondents are
either still living at home with family or
are living in a backroom on family or
friend’s property. In the case that the
respondent is renting out a room in a
backyard, it is most likely a cheaper
township rental where the tenant is not
expected to pay for electricity and
water, and no formal lease agreement
is in place.
The assumption can be made that the respondent is simply living in a backyard room for free, which also implies that
their economic standing is meagre. Only 16% of respondents indicated that they live in a flat in a block of flats. It can
be assumed that this group consists of those who have reached financial independence and can afford to live on
their own.
Figure 3-4 shows the provincial distribution of
respondents before and after the learnership.
The provinces considered to be more rural show
a decrease, whereas more urban locations such
as Gauteng show an increase of 6%, which
means that learners relocated for better job
opportunities or because they could afford to
do so. Provinces considered less metropolitan,
such as Mpumalanga and Limpopo show a
decline in current residency. It can be assumed
the respondents migrated from these areas to
provinces considered more favourable for
professional growth.
Figure 3-4 Current provincial distribution of respondents
Figure 3-2 Typical type of area dwelling
Figure 3-3 Type of dwelling respondents currently live in
0% 20% 40% 60% 80% 100%
Rural
Urban
9%
91%
5%
95%Currently %
Before %
16%
37%
2%
41%
0%
1%
2%
2%
Flat in a block of flats
House/flat/room in backyard
Informal settlement
Stand-alone house
Town/Cluster/Semi-detached house
Traditional hut
Other
Refused to answer
19
INSETA TRACER STUDY – LEARNERSHIPS FINDINGS REPORT
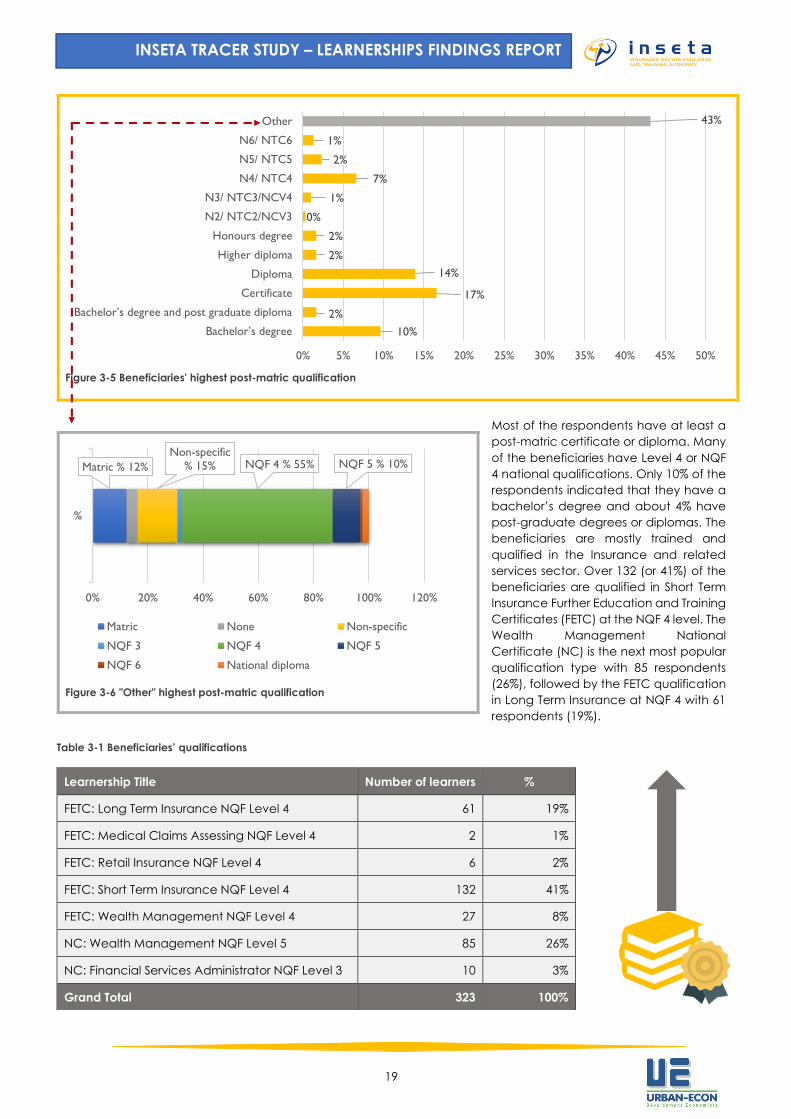
Figure 3-5 Beneficiaries' highest post-matric qualification
Most of the respondents have at least a
post-matric certificate or diploma. Many
of the beneficiaries have Level 4 or NQF
4 national qualifications. Only 10% of the
respondents indicated that they have a
bachelor’s degree and about 4% have
post-graduate degrees or diplomas. The
beneficiaries are mostly trained and
qualified in the Insurance and related
services sector. Over 132 (or 41%) of the
beneficiaries are qualified in Short Term
Insurance Further Education and Training
Certificates (FETC) at the NQF 4 level. The
Wealth Management National
Certificate (NC) is the next most popular
qualification type with 85 respondents
(26%), followed by the FETC qualification
in Long Term Insurance at NQF 4 with 61
respondents (19%).
Table 3-1 Beneficiaries’ qualifications
10%
2%
17%
14%
2%
2%
0%
1%
7%
2%
1%
43%
0% 5% 10% 15% 20% 25% 30% 35% 40% 45% 50%
Bachelor’s degree
Bachelor’s degree and post graduate diploma
Certificate
Diploma
Higher diploma
Honours degree
N2/ NTC2/NCV3
N3/ NTC3/NCV4
N4/ NTC4
N5/ NTC5
N6/ NTC6
Other
Figure 3-6 "Other" highest post-matric qualification
Learnership Title Number of learners %
FETC: Long Term Insurance NQF Level 4 61 19%
FETC: Medical Claims Assessing NQF Level 4 2 1%
FETC: Retail Insurance NQF Level 4 6 2%
FETC: Short Term Insurance NQF Level 4 132 41%
FETC: Wealth Management NQF Level 4 27 8%
NC: Wealth Management NQF Level 5 85 26%
NC: Financial Services Administrator NQF Level 3 10 3%
Grand Total 323 100%
Matric % 12%
Non-specific
% 15% NQF 4 % 55% NQF 5 % 10%
0% 20% 40% 60% 80% 100% 120%
%
Matric None Non-specific
NQF 3 NQF 4 NQF 5
NQF 6 National diploma
20
INSETA TRACER STUDY – LEARNERSHIPS FINDINGS REPORT
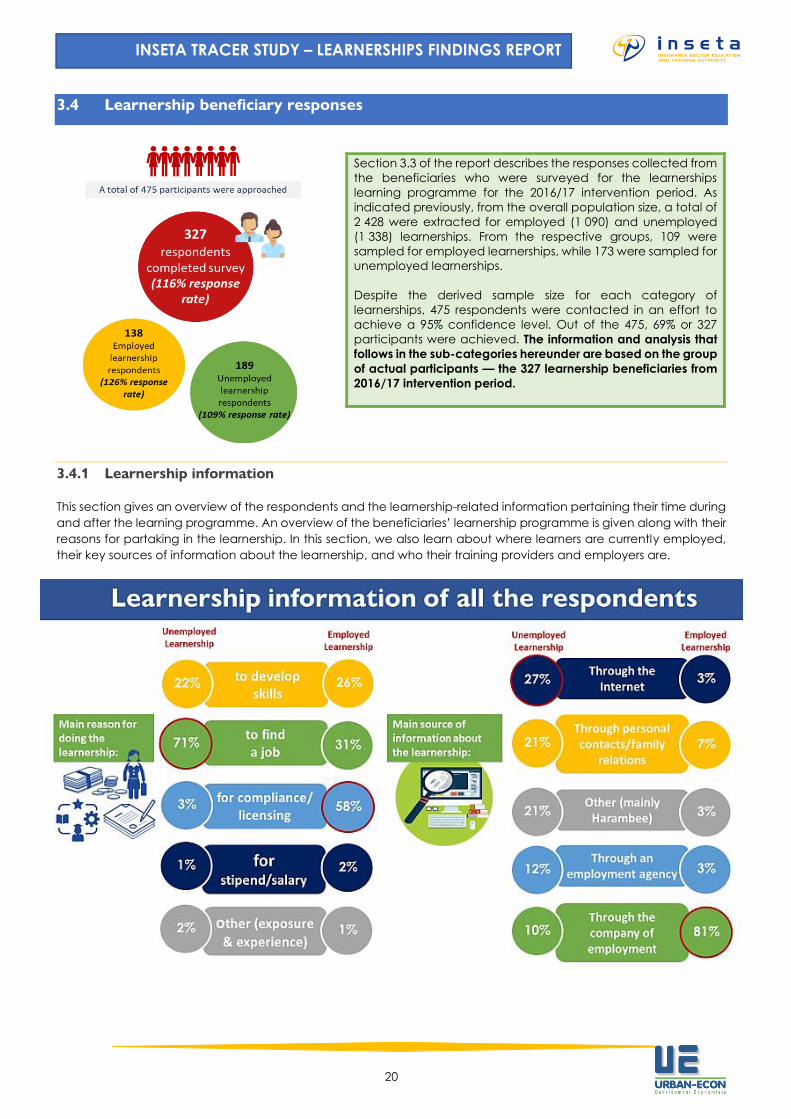
3.4 Learnership beneficiary responses
3.4.1 Learnership information
This section gives an overview of the respondents and the learnership-related information pertaining their time during
and after the learning programme. An overview of the beneficiaries’ learnership programme is given along with their
reasons for partaking in the learnership. In this section, we also learn about where learners are currently employed,
their key sources of information about the learnership, and who their training providers and employers are.
Section 3.3 of the report describes the responses collected from
the beneficiaries who were surveyed for the learnerships
learning programme for the 2016/17 intervention period. As
indicated previously, from the overall population size, a total of
2 428 were extracted for employed (1 090) and unemployed
(1 338) learnerships. From the respective groups, 109 were
sampled for employed learnerships, while 173 were sampled for
unemployed learnerships.
Despite the derived sample size for each category of
learnerships, 475 respondents were contacted in an effort to
achieve a 95% confidence level. Out of the 475, 69% or 327
participants were achieved. The information and analysis that
follows in the sub-categories hereunder are based on the group
of actual participants — the 327 learnership beneficiaries from
2016/17 intervention period.
21
INSETA TRACER STUDY – LEARNERSHIPS FINDINGS REPORT
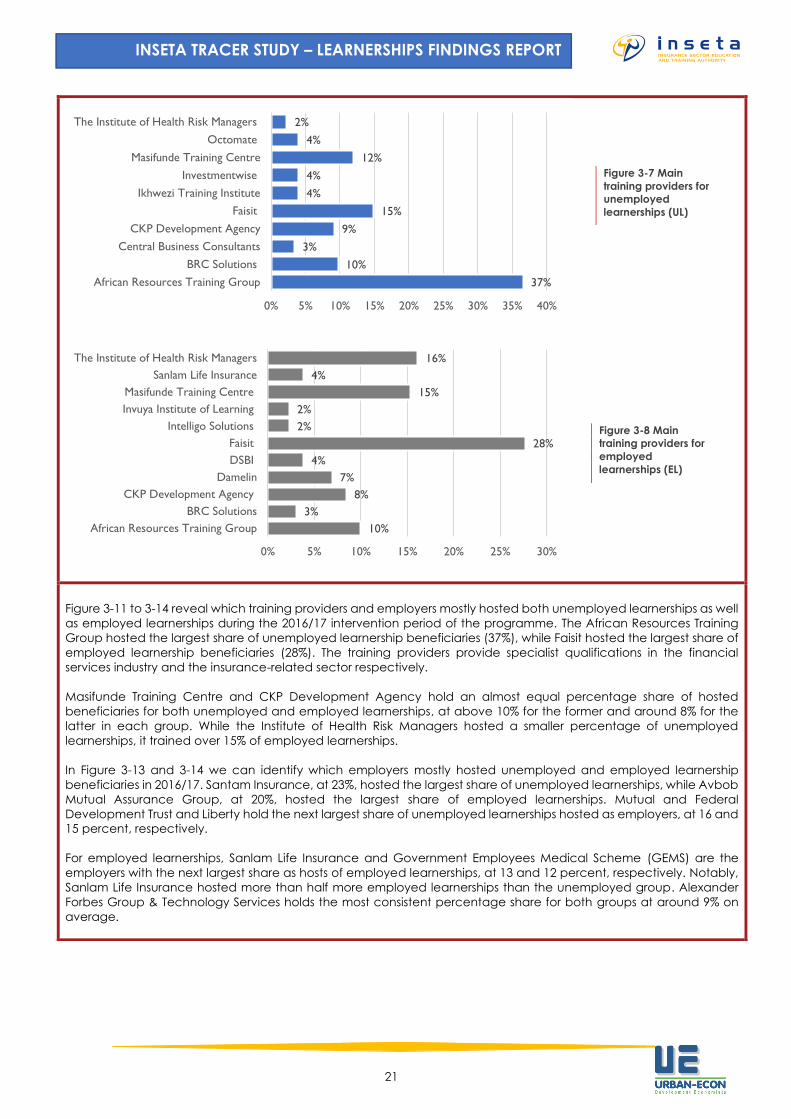
Figure 3-11 to 3-14 reveal which training providers and employers mostly hosted both unemployed learnerships as well
as employed learnerships during the 2016/17 intervention period of the programme. The African Resources Training
Group hosted the largest share of unemployed learnership beneficiaries (37%), while Faisit hosted the largest share of
employed learnership beneficiaries (28%). The training providers provide specialist qualifications in the financial
services industry and the insurance-related sector respectively.
Masifunde Training Centre and CKP Development Agency hold an almost equal percentage share of hosted
beneficiaries for both unemployed and employed learnerships, at above 10% for the former and around 8% for the
latter in each group. While the Institute of Health Risk Managers hosted a smaller percentage of unemployed
learnerships, it trained over 15% of employed learnerships.
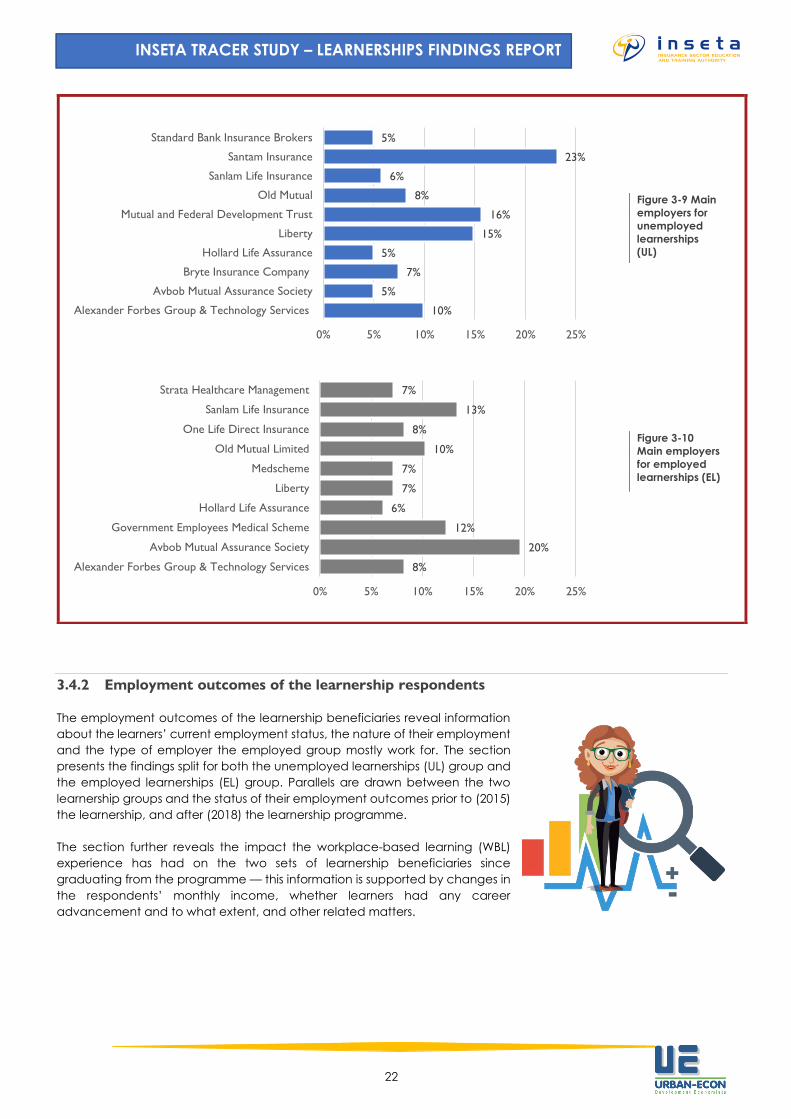
In Figure 3-13 and 3-14 we can identify which employers mostly hosted unemployed and employed learnership
beneficiaries in 2016/17. Santam Insurance, at 23%, hosted the largest share of unemployed learnerships, while Avbob
Mutual Assurance Group, at 20%, hosted the largest share of employed learnerships. Mutual and Federal
Development Trust and Liberty hold the next largest share of unemployed learnerships hosted as employers, at 16 and
15 percent, respectively.
For employed learnerships, Sanlam Life Insurance and Government Employees Medical Scheme (GEMS) are the
employers with the next largest share as hosts of employed learnerships, at 13 and 12 percent, respectively. Notably,
Sanlam Life Insurance hosted more than half more employed learnerships than the unemployed group. Alexander
Forbes Group & Technology Services holds the most consistent percentage share for both groups at around 9% on
average.
37%
10%
3%
9%
15%
4%
4%
12%
4%
2%
African Resources Training Group
BRC Solutions
Central Business Consultants
CKP Development Agency
Faisit
Ikhwezi Training Institute
Investmentwise
Masifunde Training Centre
Octomate
The Institute of Health Risk Managers
0% 5% 10% 15% 20% 25% 30% 35% 40%
10%
3%
8%
7%
4%
28%
2%
2%
15%
4%
16%
African Resources Training Group
BRC Solutions
CKP Development Agency
Damelin
DSBI
Faisit
Intelligo Solutions
Invuya Institute of Learning
Masifunde Training Centre
Sanlam Life Insurance
The Institute of Health Risk Managers
0% 5% 10% 15% 20% 25% 30%
Figure 3-7 Main
training providers for
unemployed
learnerships (UL)
Figure 3-8 Main
training providers for
employed
learnerships (EL)
22
INSETA TRACER STUDY – LEARNERSHIPS FINDINGS REPORT
3.4.2 Employment outcomes of the learnership respondents
The employment outcomes of the learnership beneficiaries reveal information
about the learners’ current employment status, the nature of their employment
and the type of employer the employed group mostly work for. The section
presents the findings split for both the unemployed learnerships (UL) group and
the employed learnerships (EL) group. Parallels are drawn between the two
learnership groups and the status of their employment outcomes prior to (2015)
the learnership, and after (2018) the learnership programme.
The section further reveals the impact the workplace-based learning (WBL)
experience has had on the two sets of learnership beneficiaries since
graduating from the programme — this information is supported by changes in
the respondents’ monthly income, whether learners had any career
advancement and to what extent, and other related matters.
10%
5%
7%
5%
15%
16%
8%
6%
23%
5%
Alexander Forbes Group & Technology Services
Avbob Mutual Assurance Society
Bryte Insurance Company
Hollard Life Assurance
Liberty
Mutual and Federal Development Trust
Old Mutual
Sanlam Life Insurance
Santam Insurance
Standard Bank Insurance Brokers
0% 5% 10% 15% 20% 25%
8%
20%
12%
6%
7%
7%
10%
8%
13%
7%
Alexander Forbes Group & Technology Services
Avbob Mutual Assurance Society
Government Employees Medical Scheme
Hollard Life Assurance
Liberty
Medscheme
Old Mutual Limited
One Life Direct Insurance
Sanlam Life Insurance
Strata Healthcare Management
0% 5% 10% 15% 20% 25%
Figure 3-9 Main
employers for
unemployed
learnerships
(UL)
Figure 3-10
Main employers
for employed
learnerships (EL)
23
INSETA TRACER STUDY – LEARNERSHIPS FINDINGS REPORT
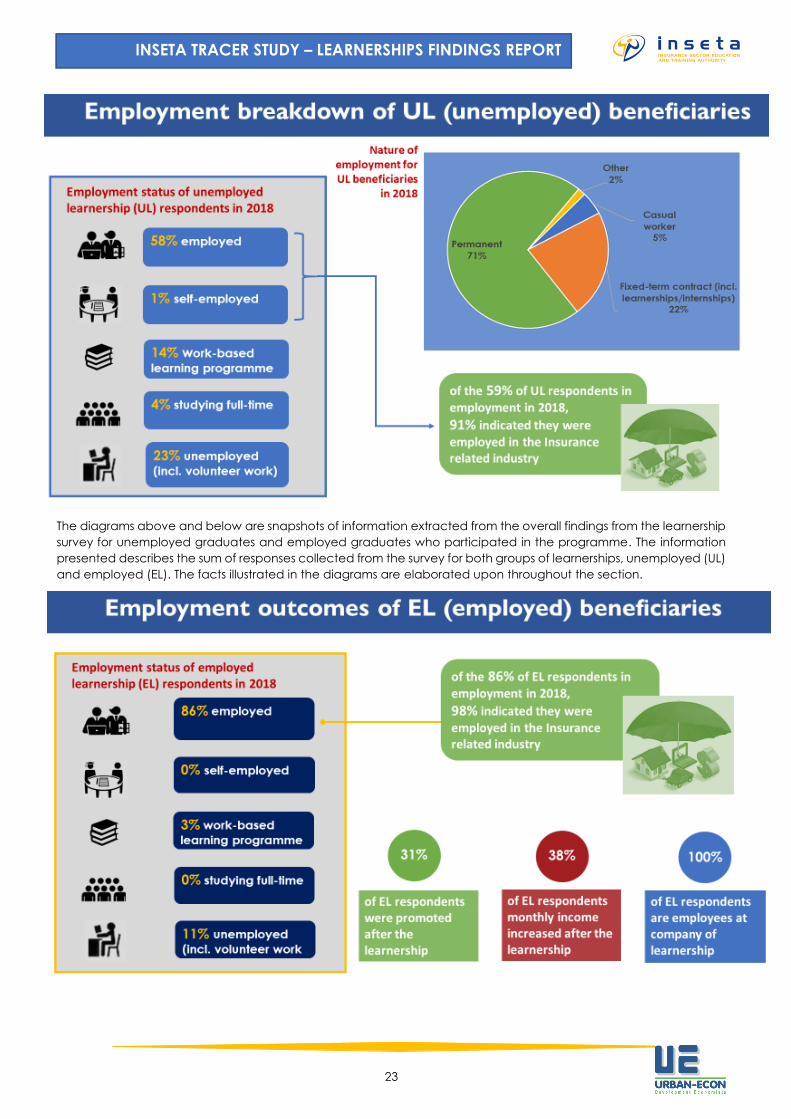
The diagrams above and below are snapshots of information extracted from the overall findings from the learnership
survey for unemployed graduates and employed graduates who participated in the programme. The information
presented describes the sum of responses collected from the survey for both groups of learnerships, unemployed (UL)
and employed (EL). The facts illustrated in the diagrams are elaborated upon throughout the section.
24
INSETA TRACER STUDY – LEARNERSHIPS FINDINGS REPORT
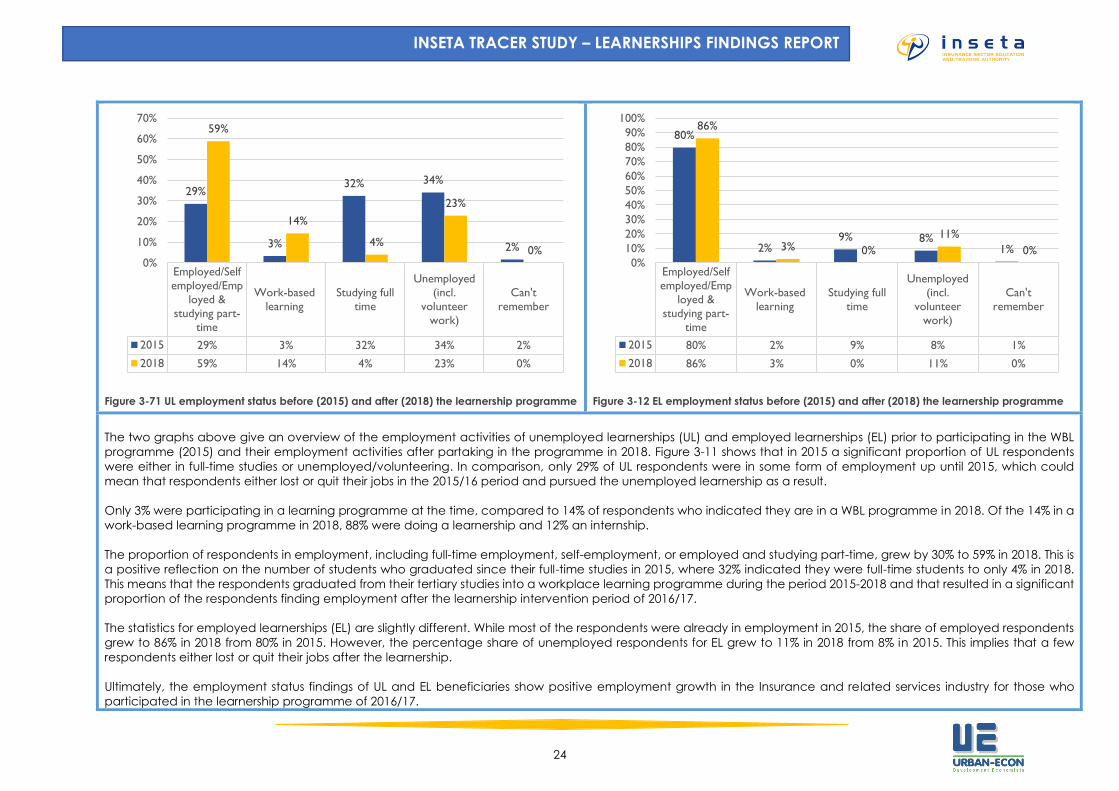
Figure 3-71 UL employment status before (2015) and after (2018) the learnership programme
Figure 3-12 EL employment status before (2015) and after (2018) the learnership programme
The two graphs above give an overview of the employment activities of unemployed learnerships (UL) and employed learnerships (EL) prior to participating in the WBL
programme (2015) and their employment activities after partaking in the programme in 2018. Figure 3-11 shows that in 2015 a significant proportion of UL respondents
were either in full-time studies or unemployed/volunteering. In comparison, only 29% of UL respondents were in some form of employment up until 2015, which could
mean that respondents either lost or quit their jobs in the 2015/16 period and pursued the unemployed learnership as a result.
Only 3% were participating in a learning programme at the time, compared to 14% of respondents who indicated they are in a WBL programme in 2018. Of the 14% in a
work-based learning programme in 2018, 88% were doing a learnership and 12% an internship.
The proportion of respondents in employment, including full-time employment, self-employment, or employed and studying part-time, grew by 30% to 59% in 2018. This is
a positive reflection on the number of students who graduated since their full-time studies in 2015, where 32% indicated they were full-time students to only 4% in 2018.
This means that the respondents graduated from their tertiary studies into a workplace learning programme during the period 2015-2018 and that resulted in a significant
proportion of the respondents finding employment after the learnership intervention period of 2016/17.
The statistics for employed learnerships (EL) are slightly different. While most of the respondents were already in employment in 2015, the share of employed respondents
grew to 86% in 2018 from 80% in 2015. However, the percentage share of unemployed respondents for EL grew to 11% in 2018 from 8% in 2015. This implies that a few
respondents either lost or quit their jobs after the learnership.
Ultimately, the employment status findings of UL and EL beneficiaries show positive employment growth in the Insurance and related services industry for those who
participated in the learnership programme of 2016/17.
Employed/Self
employed/Emp
loyed &
studying part-
time
Work-based
learning
Studying full
time
Unemployed
(incl.
volunteer
work)
Can't
remember
2015 29% 3% 32% 34% 2%
2018 59% 14% 4% 23% 0%
29%
3%
32% 34%
2%
59%
14%
4%
23%
0%0%
10%
20%
30%
40%
50%
60%
70%
Employed/Self
employed/Emp
loyed &
studying part-
time
Work-based
learning
Studying full
time
Unemployed
(incl.
volunteer
work)
Can't
remember
2015 80% 2% 9% 8% 1%
2018 86% 3% 0% 11% 0%
80%
2%9% 8%
1%
86%
3% 0%
11%
0%0%
10%
20%
30%
40%
50%
60%
70%
80%
90%
100%
25
INSETA TRACER STUDY – LEARNERSHIPS FINDINGS REPORT
Figure 3-13 UL employed/self-employed in the industry in 2018
Figure 3-14 EL employed/self-employed in the industry in 2018
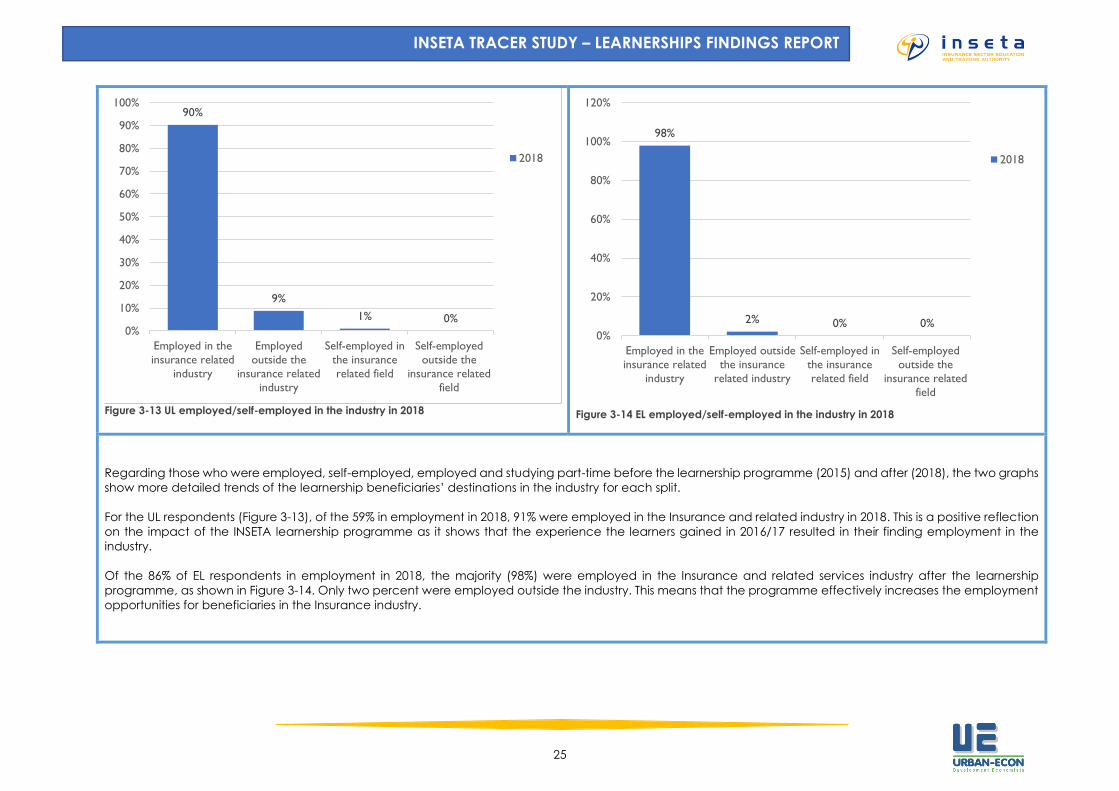
Regarding those who were employed, self-employed, employed and studying part-time before the learnership programme (2015) and after (2018), the two graphs
show more detailed trends of the learnership beneficiaries’ destinations in the industry for each split.
For the UL respondents (Figure 3-13), of the 59% in employment in 2018, 91% were employed in the Insurance and related industry in 2018. This is a positive reflection
on the impact of the INSETA learnership programme as it shows that the experience the learners gained in 2016/17 resulted in their finding employment in the
industry.
Of the 86% of EL respondents in employment in 2018, the majority (98%) were employed in the Insurance and related services industry after the learnership
programme, as shown in Figure 3-14. Only two percent were employed outside the industry. This means that the programme effectively increases the employment
opportunities for beneficiaries in the Insurance industry.
90%
9%
1% 0%0%
10%
20%
30%
40%
50%
60%
70%
80%
90%
100%
Employed in the
insurance related
industry
Employed
outside the
insurance related
industry
Self-employed in
the insurance
related field
Self-employed
outside the
insurance related
field
2018
98%
2% 0% 0%0%
20%
40%
60%
80%
100%
120%
Employed in the
insurance related
industry
Employed outside
the insurance
related industry
Self-employed in
the insurance
related field
Self-employed
outside the
insurance related
field
2018
26
INSETA TRACER STUDY – LEARNERSHIPS FINDINGS REPORT
The above information will now be complemented with more detailed findings for each of the learnership groups.
The data below address the reasons the respondents are in their current employment status, and where applicable,
describe the circumstances under which they are either employed, self-employed or even studying. For the
unemployed learnerships (UL), we specifically examine how long they were unemployed prior to the learnership, how
soon after completion they found employment, and the length of their current employment. Information is also
presented on the professional and income growth (or lack thereof) the unemployed and employed learnership
respondents have achieved since partaking in the workplace-based learning programme of the 2016/17 intervention
period.
FURTHER INSIGHT INTO EMPLOYMENT OUTCOMES FOR UNEMPLOYED LEARNERSHIPS (UL)
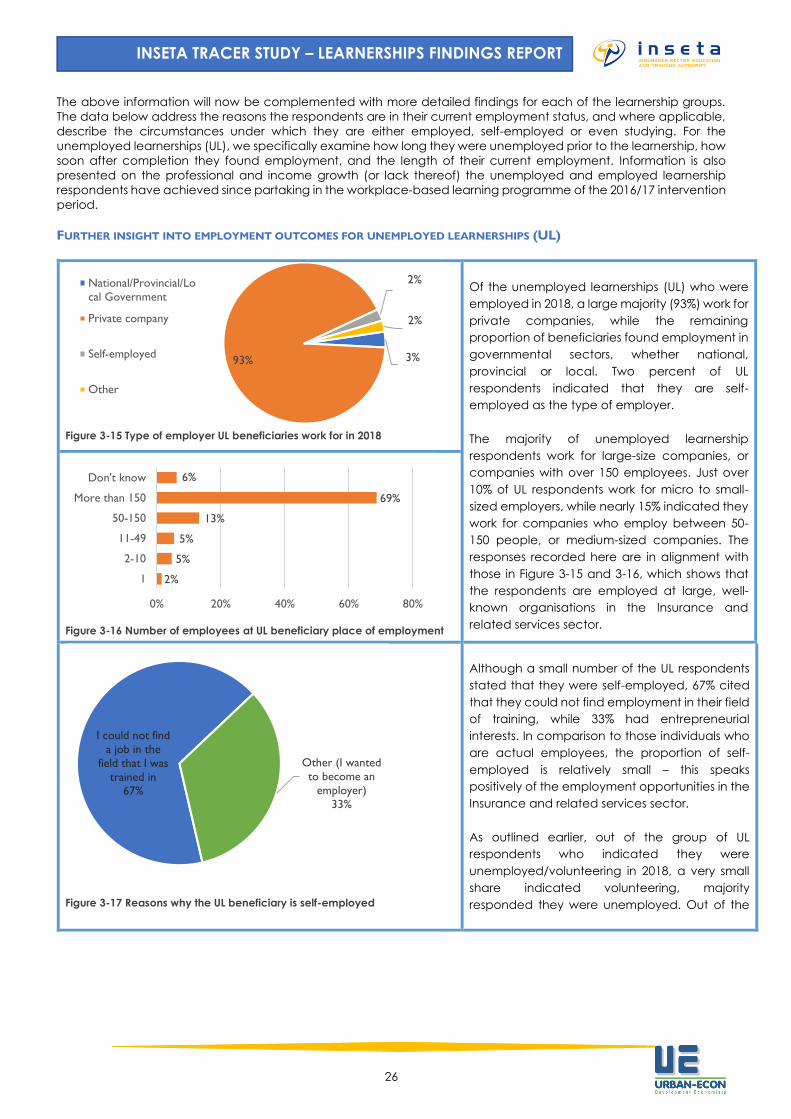
Figure 3-15 Type of employer UL beneficiaries work for in 2018
Of the unemployed learnerships (UL) who were
employed in 2018, a large majority (93%) work for
private companies, while the remaining
proportion of beneficiaries found employment in
governmental sectors, whether national,
provincial or local. Two percent of UL
respondents indicated that they are self-
employed as the type of employer.
The majority of unemployed learnership
respondents work for large-size companies, or
companies with over 150 employees. Just over
10% of UL respondents work for micro to small-
sized employers, while nearly 15% indicated they
work for companies who employ between 50-
150 people, or medium-sized companies. The
responses recorded here are in alignment with
those in Figure 3-15 and 3-16, which shows that
the respondents are employed at large, well-
known organisations in the Insurance and
related services sector. Figure 3-16 Number of employees at UL beneficiary place of employment
Figure 3-17 Reasons why the UL beneficiary is self-employed
Although a small number of the UL respondents
stated that they were self-employed, 67% cited
that they could not find employment in their field
of training, while 33% had entrepreneurial
interests. In comparison to those individuals who
are actual employees, the proportion of self-
employed is relatively small – this speaks
positively of the employment opportunities in the
Insurance and related services sector.
As outlined earlier, out of the group of UL
respondents who indicated they were
unemployed/volunteering in 2018, a very small
share indicated volunteering, majority
responded they were unemployed. Out of the
3%93%
2%
2%
National/Provincial/Lo
cal Government
Private company
Self-employed
Other
2%
5%
5%
13%
69%
6%
0% 20% 40% 60% 80%
1
2-10
11-49
50-150
More than 150
Don't know
I could not find
a job in the
field that I was
trained in
67%
Other (I wanted
to become an
employer)
33%
27
INSETA TRACER STUDY – LEARNERSHIPS FINDINGS REPORT
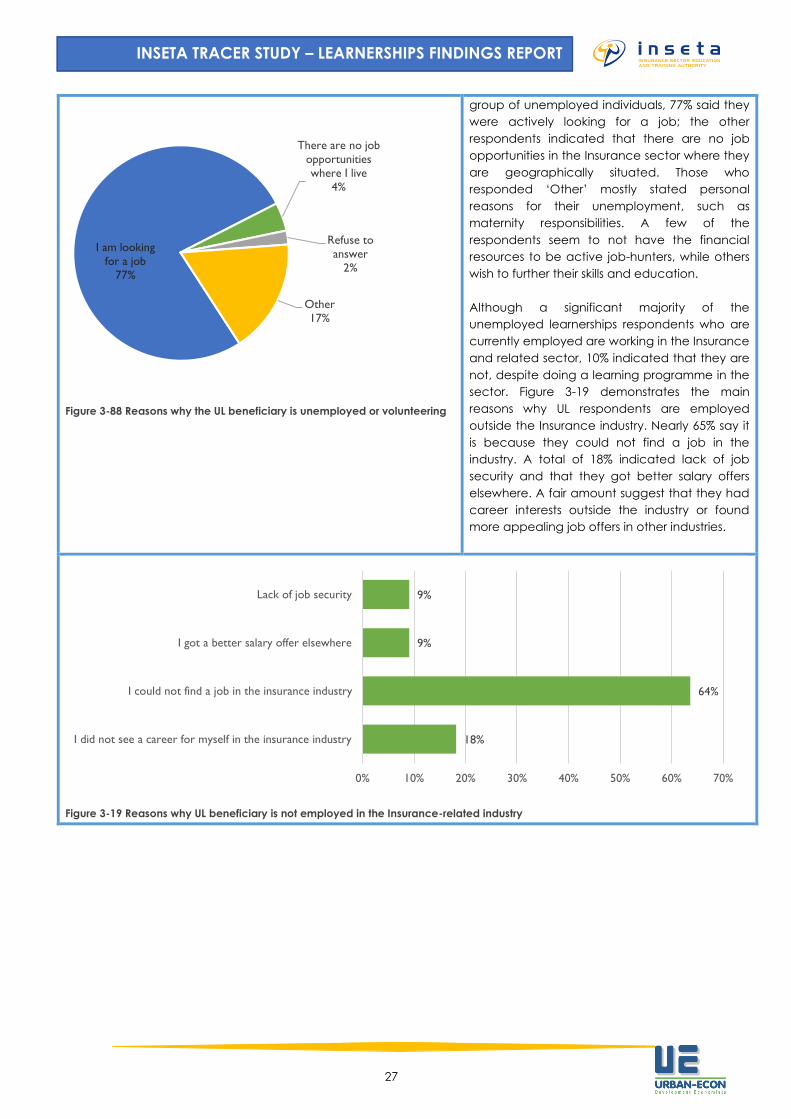
Figure 3-88 Reasons why the UL beneficiary is unemployed or volunteering
group of unemployed individuals, 77% said they
were actively looking for a job; the other
respondents indicated that there are no job
opportunities in the Insurance sector where they
are geographically situated. Those who
responded ‘Other’ mostly stated personal
reasons for their unemployment, such as
maternity responsibilities. A few of the
respondents seem to not have the financial
resources to be active job-hunters, while others
wish to further their skills and education.
Although a significant majority of the
unemployed learnerships respondents who are
currently employed are working in the Insurance
and related sector, 10% indicated that they are
not, despite doing a learning programme in the
sector. Figure 3-19 demonstrates the main
reasons why UL respondents are employed
outside the Insurance industry. Nearly 65% say it
is because they could not find a job in the
industry. A total of 18% indicated lack of job
security and that they got better salary offers
elsewhere. A fair amount suggest that they had
career interests outside the industry or found
more appealing job offers in other industries.
Figure 3-19 Reasons why UL beneficiary is not employed in the Insurance-related industry
I am looking
for a job
77%
There are no job
opportunities
where I live
4%
Refuse to
answer
2%
Other
17%
18%
64%
9%
9%
0% 10% 20% 30% 40% 50% 60% 70%
I did not see a career for myself in the insurance industry
I could not find a job in the insurance industry
I got a better salary offer elsewhere
Lack of job security
28
INSETA TRACER STUDY – LEARNERSHIPS FINDINGS REPORT
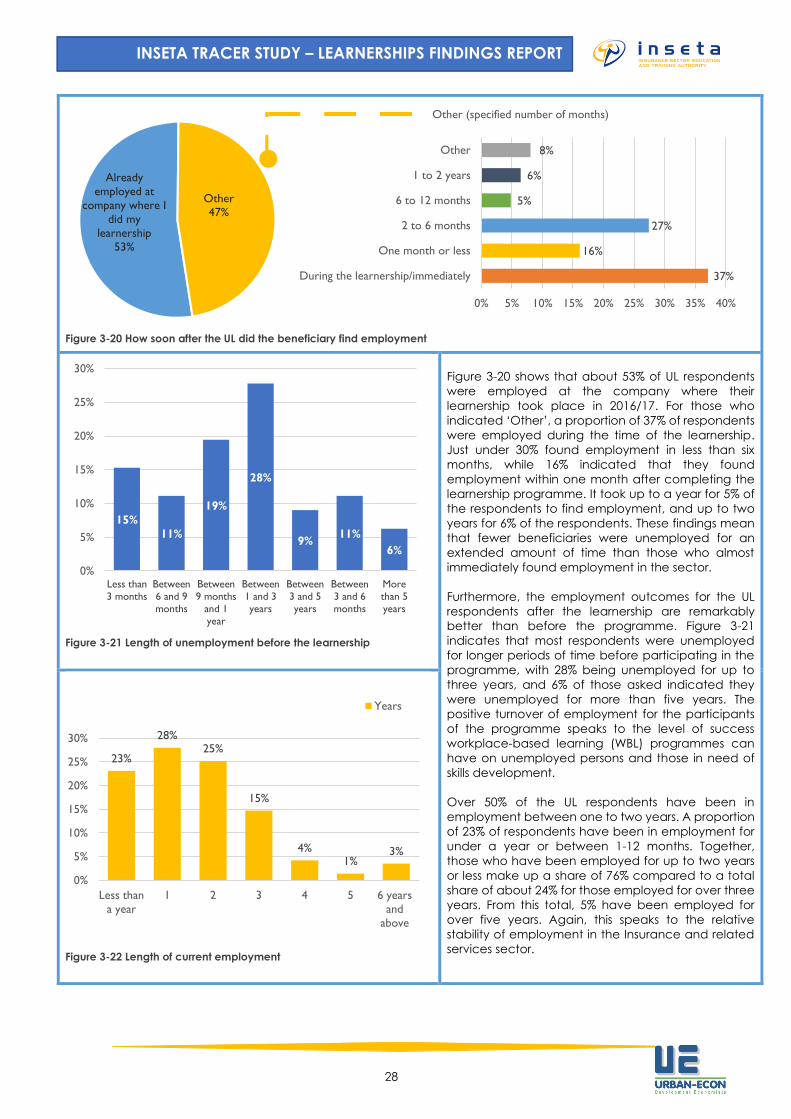
Figure 3-20 How soon after the UL did the beneficiary find employment
Figure 3-21 Length of unemployment before the learnership
Figure 3-20 shows that about 53% of UL respondents
were employed at the company where their
learnership took place in 2016/17. For those who
indicated ‘Other’, a proportion of 37% of respondents
were employed during the time of the learnership.
Just under 30% found employment in less than six
months, while 16% indicated that they found
employment within one month after completing the
learnership programme. It took up to a year for 5% of
the respondents to find employment, and up to two
years for 6% of the respondents. These findings mean
that fewer beneficiaries were unemployed for an
extended amount of time than those who almost
immediately found employment in the sector.
Furthermore, the employment outcomes for the UL
respondents after the learnership are remarkably
better than before the programme. Figure 3-21
indicates that most respondents were unemployed
for longer periods of time before participating in the
programme, with 28% being unemployed for up to
three years, and 6% of those asked indicated they
were unemployed for more than five years. The
positive turnover of employment for the participants
of the programme speaks to the level of success
workplace-based learning (WBL) programmes can
have on unemployed persons and those in need of
skills development.
Over 50% of the UL respondents have been in
employment between one to two years. A proportion
of 23% of respondents have been in employment for
under a year or between 1-12 months. Together,
those who have been employed for up to two years
or less make up a share of 76% compared to a total
share of about 24% for those employed for over three
years. From this total, 5% have been employed for
over five years. Again, this speaks to the relative
stability of employment in the Insurance and related
services sector. Figure 3-22 Length of current employment
Already
employed at
company where I
did my
learnership
53%
Other
47%
37%
16%
27%
5%
6%
8%
0% 5% 10% 15% 20% 25% 30% 35% 40%
During the learnership/immediately
One month or less
2 to 6 months
6 to 12 months
1 to 2 years
Other
Other (specified number of months)
15%
11%
19%
28%
9%11%
6%
0%
5%
10%
15%
20%
25%
30%
Less than3 months
Between6 and 9
months
Between9 months
and 1
year
Between1 and 3
years
Between3 and 5
years
Between3 and 6
months
Morethan 5
years
23%
28%25%
15%
4%1%
3%
0%
5%
10%
15%
20%
25%
30%
Less than
a year
1 2 3 4 5 6 years
and
above
Years
29
INSETA TRACER STUDY – LEARNERSHIPS FINDINGS REPORT
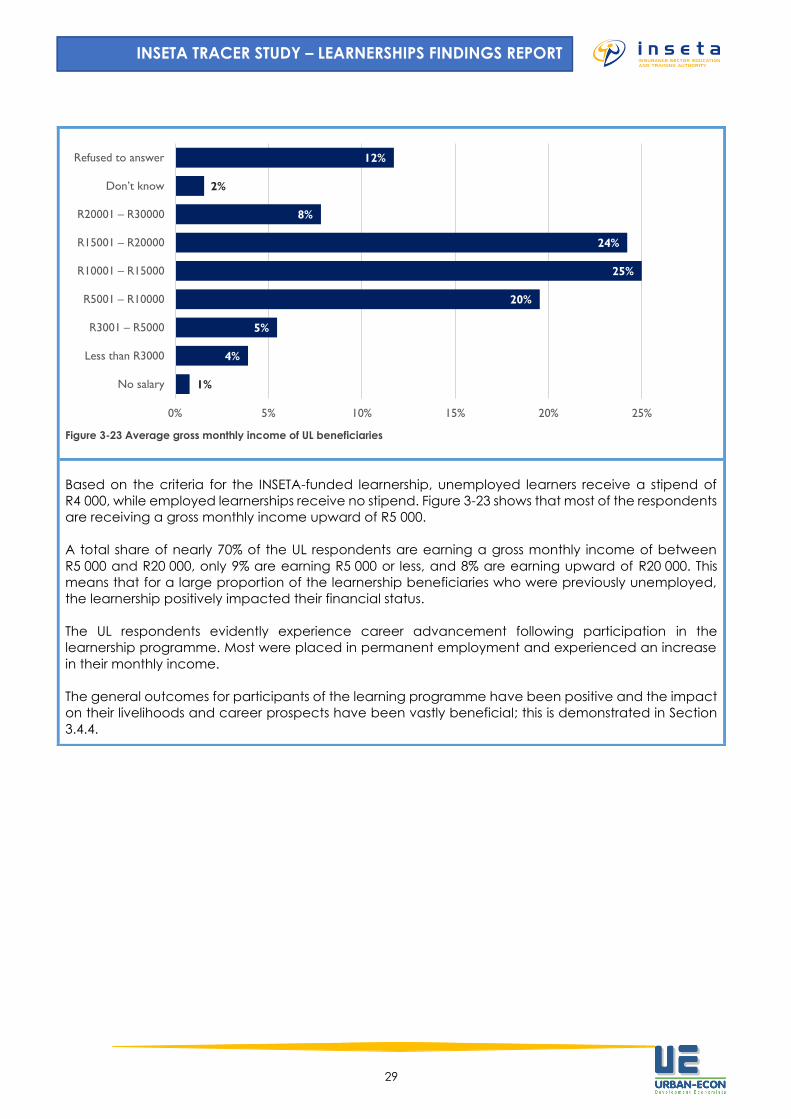
Figure 3-23 Average gross monthly income of UL beneficiaries
Based on the criteria for the INSETA-funded learnership, unemployed learners receive a stipend of
R4 000, while employed learnerships receive no stipend. Figure 3-23 shows that most of the respondents
are receiving a gross monthly income upward of R5 000.
A total share of nearly 70% of the UL respondents are earning a gross monthly income of between
R5 000 and R20 000, only 9% are earning R5 000 or less, and 8% are earning upward of R20 000. This
means that for a large proportion of the learnership beneficiaries who were previously unemployed,
the learnership positively impacted their financial status.
The UL respondents evidently experience career advancement following participation in the
learnership programme. Most were placed in permanent employment and experienced an increase
in their monthly income.
The general outcomes for participants of the learning programme have been positive and the impact
on their livelihoods and career prospects have been vastly beneficial; this is demonstrated in Section
3.4.4.
1%
4%
5%
20%
25%
24%
8%
2%
12%
0% 5% 10% 15% 20% 25% 30%
No salary
Less than R3000
R3001 – R5000
R5001 – R10000
R10001 – R15000
R15001 – R20000
R20001 – R30000
Don’t know
Refused to answer
30
INSETA TRACER STUDY – LEARNERSHIPS FINDINGS REPORT
FURTHER INSIGHT INTO EMPLOYMENT OUTCOMES FOR EMPLOYED LEARNERSHIPS (EL)
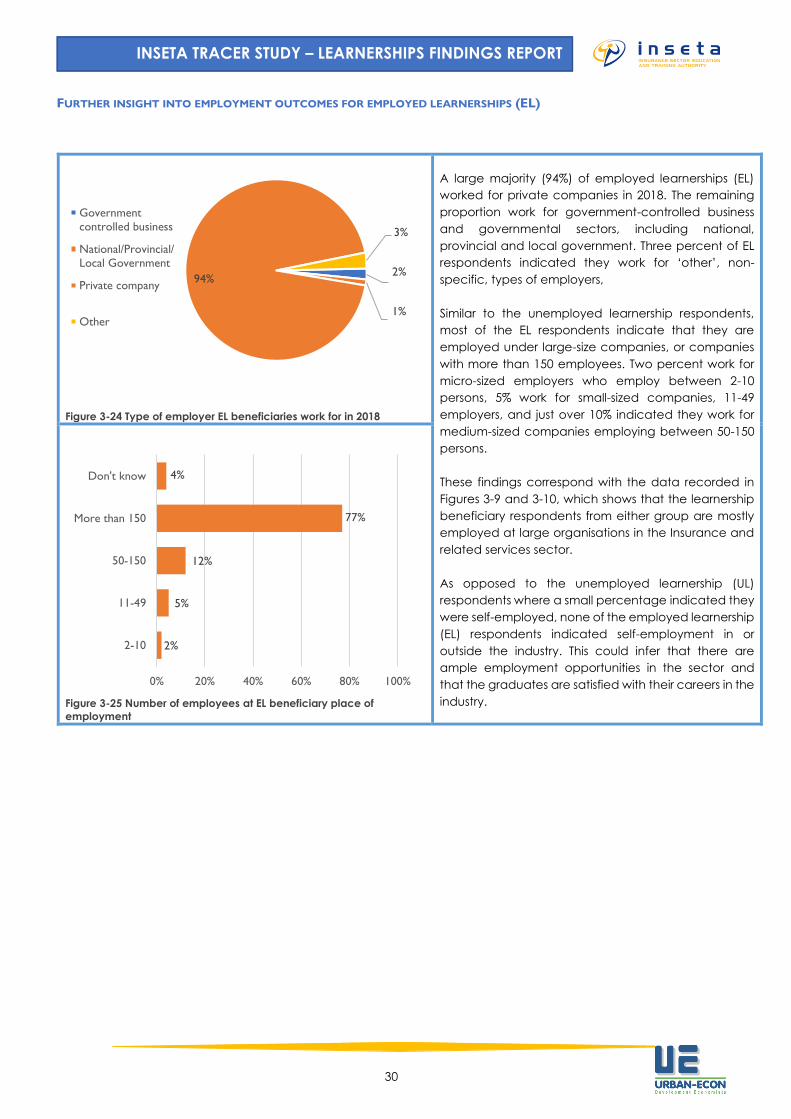
Figure 3-24 Type of employer EL beneficiaries work for in 2018
A large majority (94%) of employed learnerships (EL)
worked for private companies in 2018. The remaining
proportion work for government-controlled business
and governmental sectors, including national,
provincial and local government. Three percent of EL
respondents indicated they work for ‘other’, non-
specific, types of employers,
Similar to the unemployed learnership respondents,
most of the EL respondents indicate that they are
employed under large-size companies, or companies
with more than 150 employees. Two percent work for
micro-sized employers who employ between 2-10
persons, 5% work for small-sized companies, 11-49
employers, and just over 10% indicated they work for
medium-sized companies employing between 50-150
persons.
These findings correspond with the data recorded in
Figures 3-9 and 3-10, which shows that the learnership
beneficiary respondents from either group are mostly
employed at large organisations in the Insurance and
related services sector.
As opposed to the unemployed learnership (UL)
respondents where a small percentage indicated they
were self-employed, none of the employed learnership
(EL) respondents indicated self-employment in or
outside the industry. This could infer that there are
ample employment opportunities in the sector and
that the graduates are satisfied with their careers in the
industry.
Figure 3-25 Number of employees at EL beneficiary place of
employment
2%
1%
94%
3%
Government
controlled business
National/Provincial/
Local Government
Private company
Other
2%
5%
12%
77%
4%
0% 20% 40% 60% 80% 100%
2-10
11-49
50-150
More than 150
Don't know
31
INSETA TRACER STUDY – LEARNERSHIPS FINDINGS REPORT
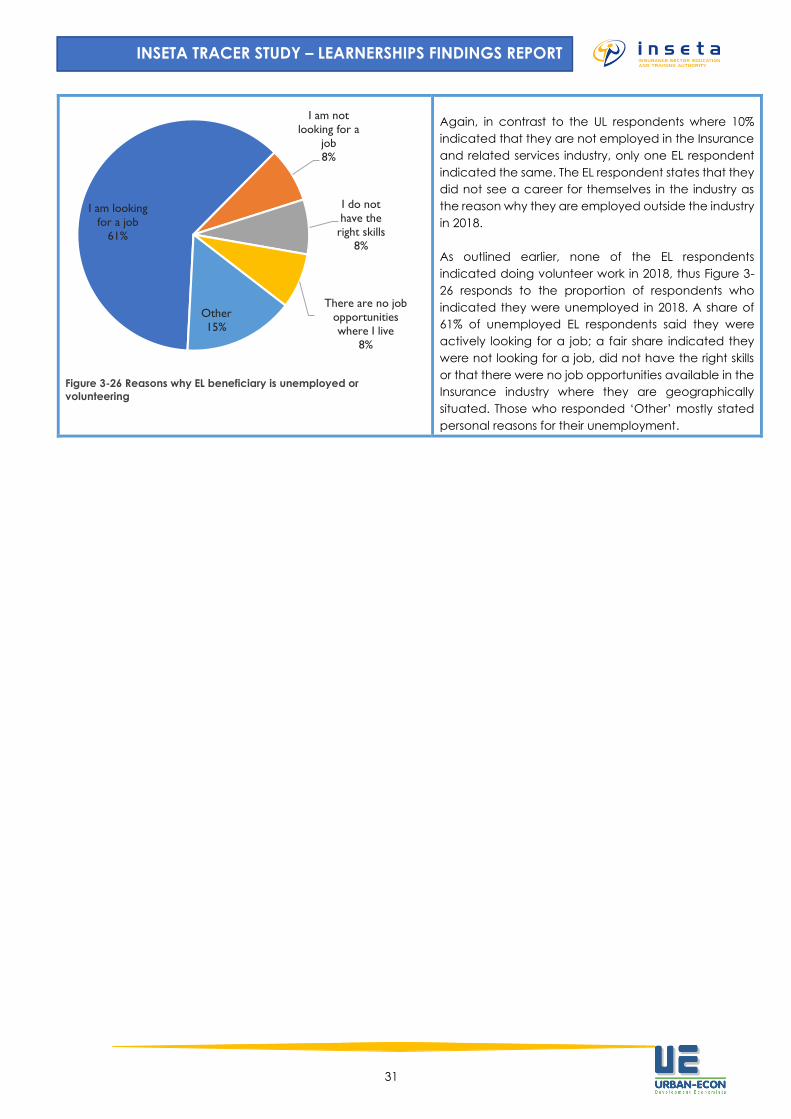
Figure 3-26 Reasons why EL beneficiary is unemployed or
volunteering
Again, in contrast to the UL respondents where 10%
indicated that they are not employed in the Insurance
and related services industry, only one EL respondent
indicated the same. The EL respondent states that they
did not see a career for themselves in the industry as
the reason why they are employed outside the industry
in 2018.
As outlined earlier, none of the EL respondents
indicated doing volunteer work in 2018, thus Figure 3-
26 responds to the proportion of respondents who
indicated they were unemployed in 2018. A share of
61% of unemployed EL respondents said they were
actively looking for a job; a fair share indicated they
were not looking for a job, did not have the right skills
or that there were no job opportunities available in the
Insurance industry where they are geographically
situated. Those who responded ‘Other’ mostly stated
personal reasons for their unemployment.
I am looking
for a job
61%
I am not
looking for a
job
8%
I do not
have the
right skills
8%
There are no job
opportunities
where I live
8%
Other
15%
32
INSETA TRACER STUDY – LEARNERSHIPS FINDINGS REPORT
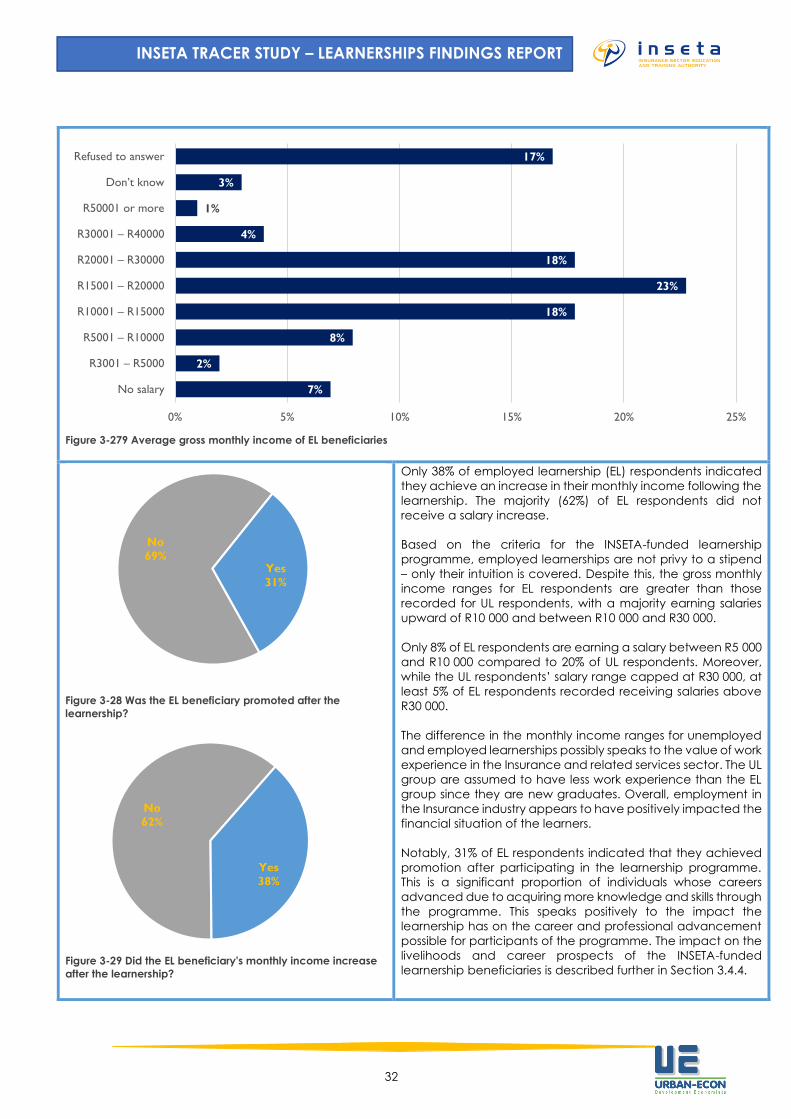
Figure 3-279 Average gross monthly income of EL beneficiaries
Figure 3-28 Was the EL beneficiary promoted after the
learnership?
Figure 3-29 Did the EL beneficiary's monthly income increase
after the learnership?
Only 38% of employed learnership (EL) respondents indicated
they achieve an increase in their monthly income following the
learnership. The majority (62%) of EL respondents did not
receive a salary increase.
Based on the criteria for the INSETA-funded learnership
programme, employed learnerships are not privy to a stipend
– only their intuition is covered. Despite this, the gross monthly
income ranges for EL respondents are greater than those
recorded for UL respondents, with a majority earning salaries
upward of R10 000 and between R10 000 and R30 000.
Only 8% of EL respondents are earning a salary between R5 000
and R10 000 compared to 20% of UL respondents. Moreover,
while the UL respondents’ salary range capped at R30 000, at
least 5% of EL respondents recorded receiving salaries above
R30 000.
The difference in the monthly income ranges for unemployed
and employed learnerships possibly speaks to the value of work
experience in the Insurance and related services sector. The UL
group are assumed to have less work experience than the EL
group since they are new graduates. Overall, employment in
the Insurance industry appears to have positively impacted the
financial situation of the learners.
Notably, 31% of EL respondents indicated that they achieved
promotion after participating in the learnership programme.
This is a significant proportion of individuals whose careers
advanced due to acquiring more knowledge and skills through
the programme. This speaks positively to the impact the
learnership has on the career and professional advancement
possible for participants of the programme. The impact on the
livelihoods and career prospects of the INSETA-funded
learnership beneficiaries is described further in Section 3.4.4.
7%
2%
8%
18%
23%
18%
4%
1%
3%
17%
0% 5% 10% 15% 20% 25%
No salary
R3001 – R5000
R5001 – R10000
R10001 – R15000
R15001 – R20000
R20001 – R30000
R30001 – R40000
R50001 or more
Don’t know
Refused to answer
No
69%Yes
31%
No
62%
Yes
38%
33
INSETA TRACER STUDY – LEARNERSHIPS FINDINGS REPORT
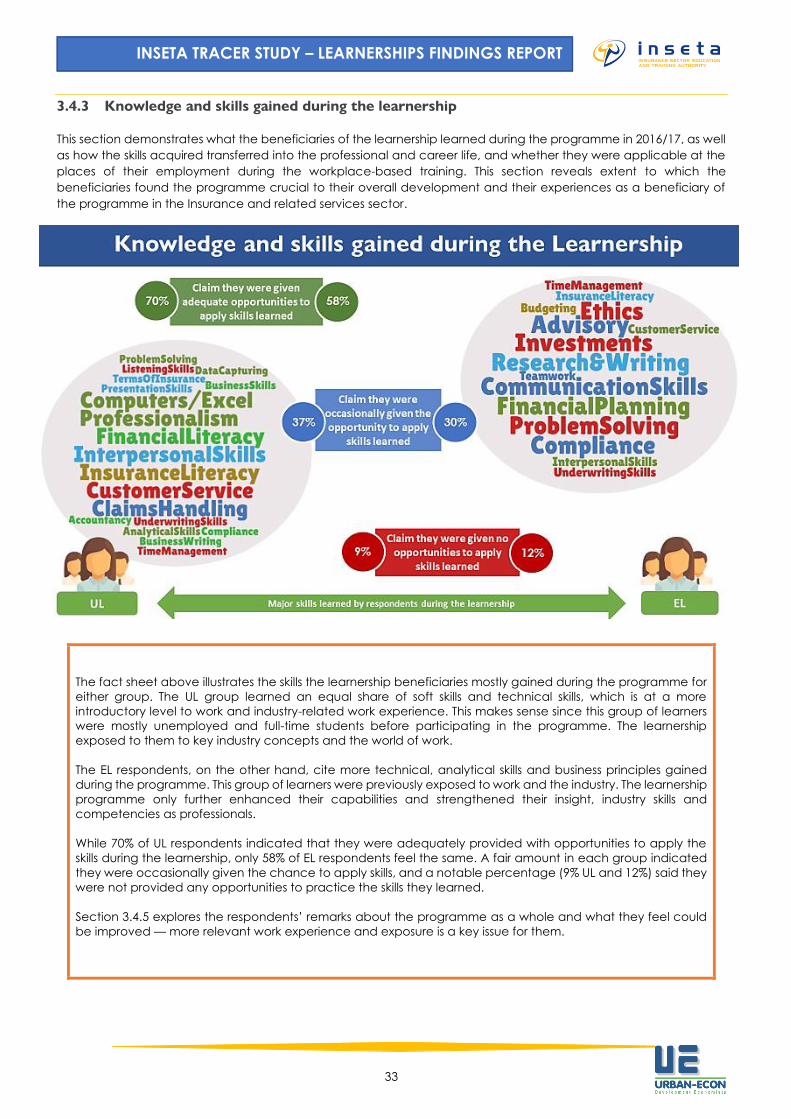
3.4.3 Knowledge and skills gained during the learnership
This section demonstrates what the beneficiaries of the learnership learned during the programme in 2016/17, as well
as how the skills acquired transferred into the professional and career life, and whether they were applicable at the
places of their employment during the workplace-based training. This section reveals extent to which the
beneficiaries found the programme crucial to their overall development and their experiences as a beneficiary of
the programme in the Insurance and related services sector.
The fact sheet above illustrates the skills the learnership beneficiaries mostly gained during the programme for
either group. The UL group learned an equal share of soft skills and technical skills, which is at a more
introductory level to work and industry-related work experience. This makes sense since this group of learners
were mostly unemployed and full-time students before participating in the programme. The learnership
exposed to them to key industry concepts and the world of work.
The EL respondents, on the other hand, cite more technical, analytical skills and business principles gained
during the programme. This group of learners were previously exposed to work and the industry. The learnership
programme only further enhanced their capabilities and strengthened their insight, industry skills and
competencies as professionals.
While 70% of UL respondents indicated that they were adequately provided with opportunities to apply the
skills during the learnership, only 58% of EL respondents feel the same. A fair amount in each group indicated
they were occasionally given the chance to apply skills, and a notable percentage (9% UL and 12%) said they
were not provided any opportunities to practice the skills they learned.
Section 3.4.5 explores the respondents’ remarks about the programme as a whole and what they feel could
be improved — more relevant work experience and exposure is a key issue for them.
34
INSETA TRACER STUDY – LEARNERSHIPS FINDINGS REPORT
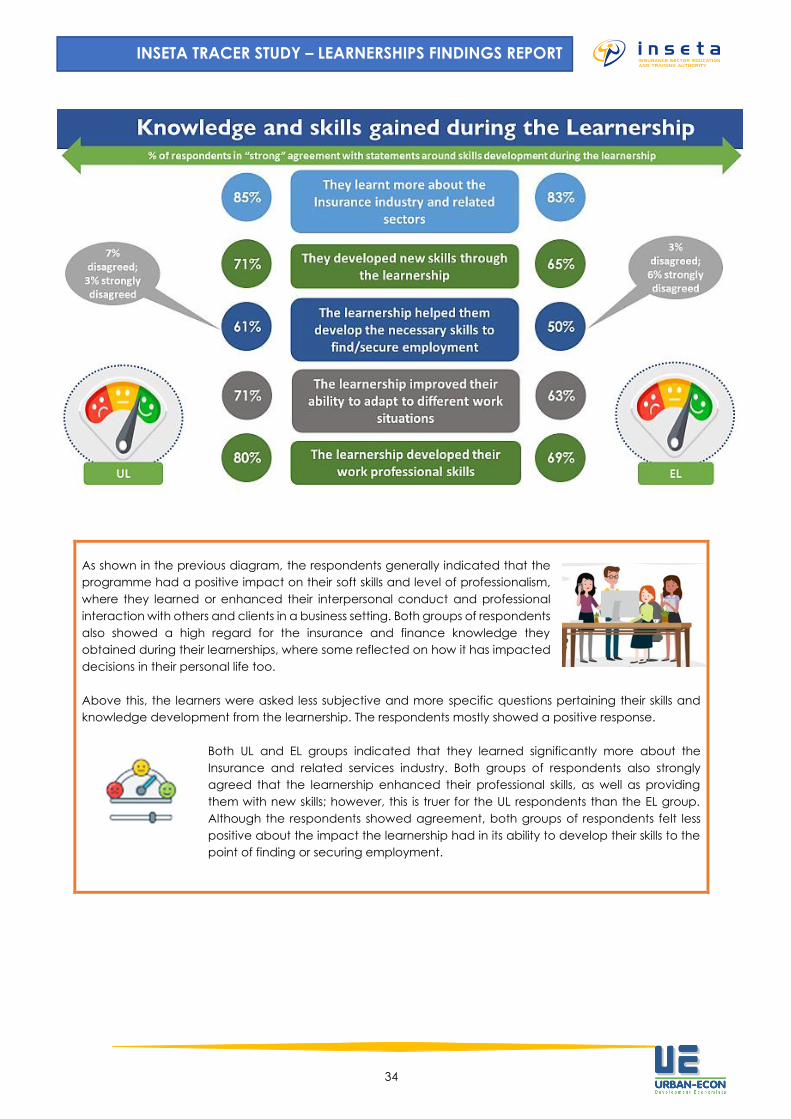
As shown in the previous diagram, the respondents generally indicated that the
programme had a positive impact on their soft skills and level of professionalism,
where they learned or enhanced their interpersonal conduct and professional
interaction with others and clients in a business setting. Both groups of respondents
also showed a high regard for the insurance and finance knowledge they
obtained during their learnerships, where some reflected on how it has impacted
decisions in their personal life too.
Above this, the learners were asked less subjective and more specific questions pertaining their skills and
knowledge development from the learnership. The respondents mostly showed a positive response.
Both UL and EL groups indicated that they learned significantly more about the
Insurance and related services industry. Both groups of respondents also strongly
agreed that the learnership enhanced their professional skills, as well as providing
them with new skills; however, this is truer for the UL respondents than the EL group.
Although the respondents showed agreement, both groups of respondents felt less
positive about the impact the learnership had in its ability to develop their skills to the
point of finding or securing employment.
35
INSETA TRACER STUDY – LEARNERSHIPS FINDINGS REPORT
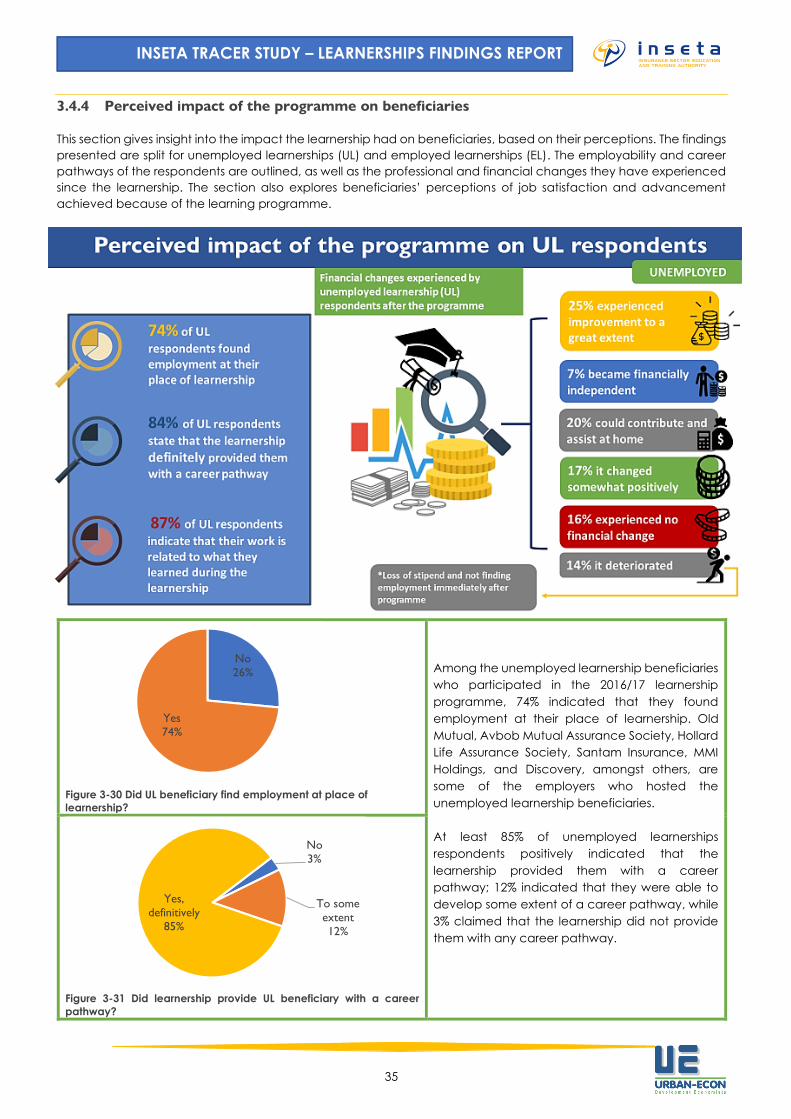
3.4.4 Perceived impact of the programme on beneficiaries
This section gives insight into the impact the learnership had on beneficiaries, based on their perceptions. The findings
presented are split for unemployed learnerships (UL) and employed learnerships (EL). The employability and career
pathways of the respondents are outlined, as well as the professional and financial changes they have experienced
since the learnership. The section also explores beneficiaries’ perceptions of job satisfaction and advancement
achieved because of the learning programme.
Figure 3-30 Did UL beneficiary find employment at place of
learnership?
Among the unemployed learnership beneficiaries
who participated in the 2016/17 learnership
programme, 74% indicated that they found
employment at their place of learnership. Old
Mutual, Avbob Mutual Assurance Society, Hollard
Life Assurance Society, Santam Insurance, MMI
Holdings, and Discovery, amongst others, are
some of the employers who hosted the
unemployed learnership beneficiaries.
At least 85% of unemployed learnerships
respondents positively indicated that the
learnership provided them with a career
pathway; 12% indicated that they were able to
develop some extent of a career pathway, while
3% claimed that the learnership did not provide
them with any career pathway.
Figure 3-31 Did learnership provide UL beneficiary with a career
pathway?
No
26%
Yes
74%
No
3%
To some
extent
12%
Yes,
definitively
85%
36
INSETA TRACER STUDY – LEARNERSHIPS FINDINGS REPORT
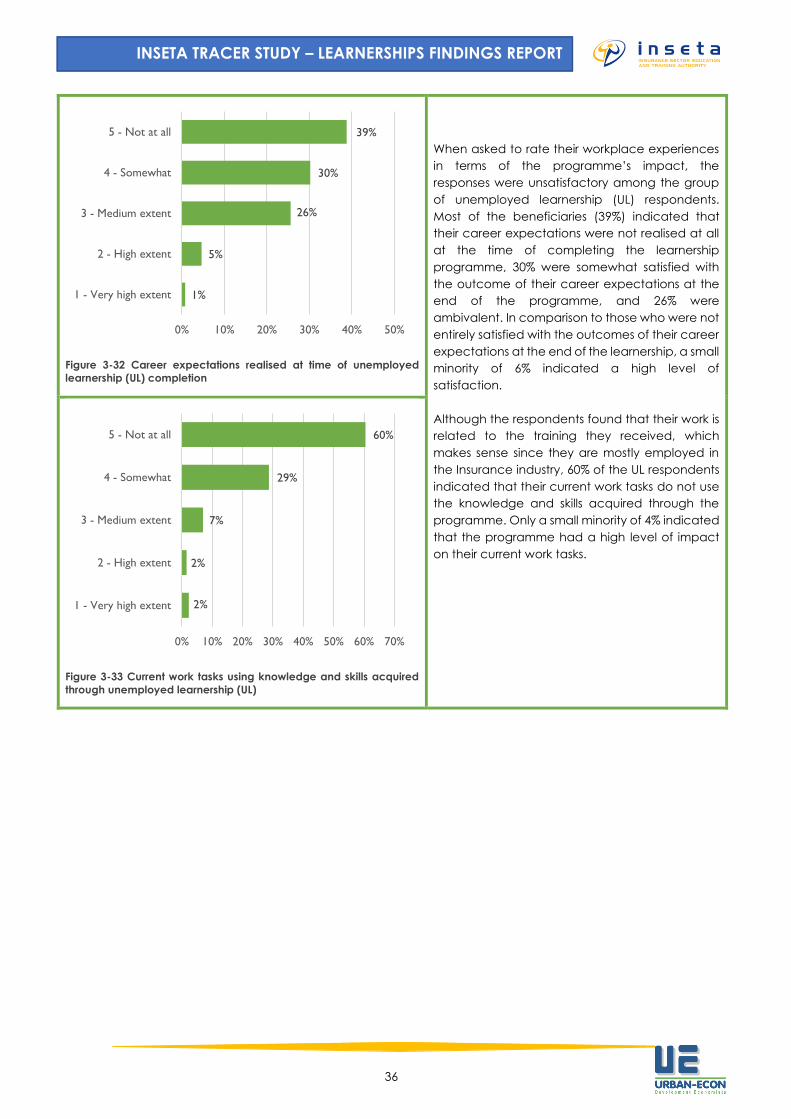
Figure 3-32 Career expectations realised at time of unemployed
learnership (UL) completion
When asked to rate their workplace experiences
in terms of the programme’s impact, the
responses were unsatisfactory among the group
of unemployed learnership (UL) respondents.
Most of the beneficiaries (39%) indicated that
their career expectations were not realised at all
at the time of completing the learnership
programme, 30% were somewhat satisfied with
the outcome of their career expectations at the
end of the programme, and 26% were
ambivalent. In comparison to those who were not
entirely satisfied with the outcomes of their career
expectations at the end of the learnership, a small
minority of 6% indicated a high level of
satisfaction.
Although the respondents found that their work is
related to the training they received, which
makes sense since they are mostly employed in
the Insurance industry, 60% of the UL respondents
indicated that their current work tasks do not use
the knowledge and skills acquired through the
programme. Only a small minority of 4% indicated
that the programme had a high level of impact
on their current work tasks.
Figure 3-33 Current work tasks using knowledge and skills acquired
through unemployed learnership (UL)
1%
5%
26%
30%
39%
0% 10% 20% 30% 40% 50%
1 - Very high extent
2 - High extent
3 - Medium extent
4 - Somewhat
5 - Not at all
2%
2%
7%
29%
60%
0% 10% 20% 30% 40% 50% 60% 70%
1 - Very high extent
2 - High extent
3 - Medium extent
4 - Somewhat
5 - Not at all
37
INSETA TRACER STUDY – LEARNERSHIPS FINDINGS REPORT
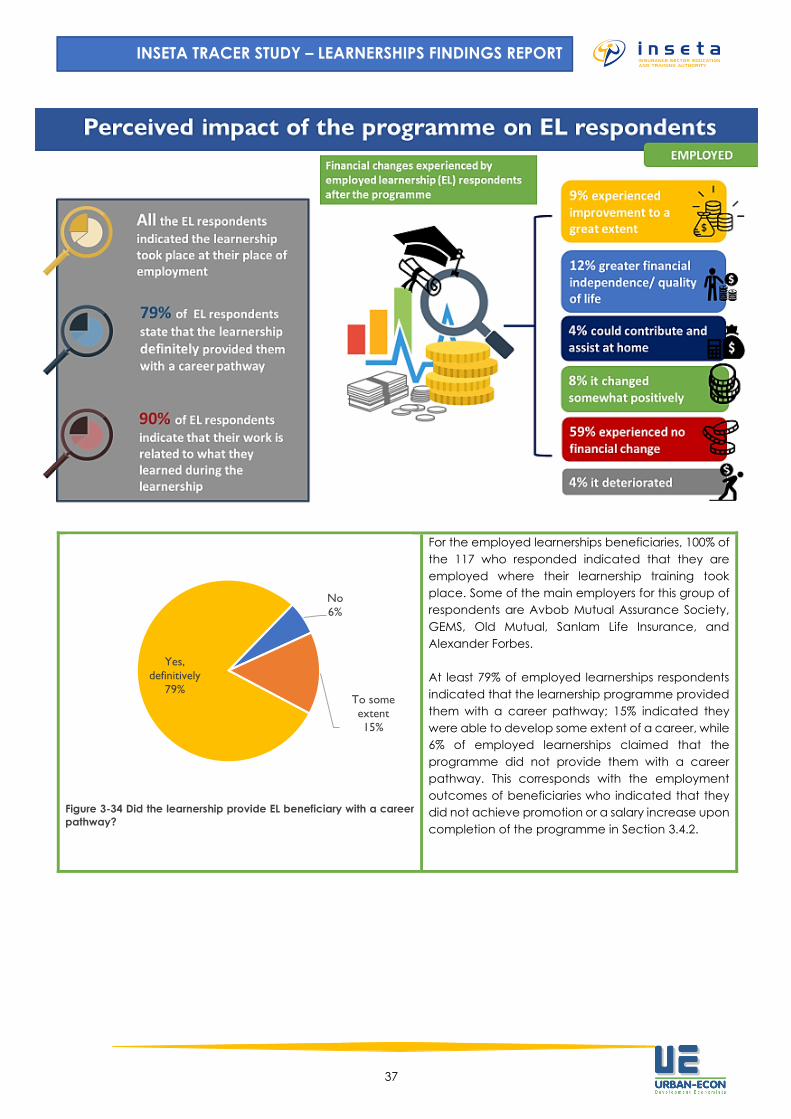
Figure 3-34 Did the learnership provide EL beneficiary with a career
pathway?
For the employed learnerships beneficiaries, 100% of
the 117 who responded indicated that they are
employed where their learnership training took
place. Some of the main employers for this group of
respondents are Avbob Mutual Assurance Society,
GEMS, Old Mutual, Sanlam Life Insurance, and
Alexander Forbes.
At least 79% of employed learnerships respondents
indicated that the learnership programme provided
them with a career pathway; 15% indicated they
were able to develop some extent of a career, while
6% of employed learnerships claimed that the
programme did not provide them with a career
pathway. This corresponds with the employment
outcomes of beneficiaries who indicated that they
did not achieve promotion or a salary increase upon
completion of the programme in Section 3.4.2.
No
6%
To some
extent
15%
Yes,
definitively
79%
38
INSETA TRACER STUDY – LEARNERSHIPS FINDINGS REPORT
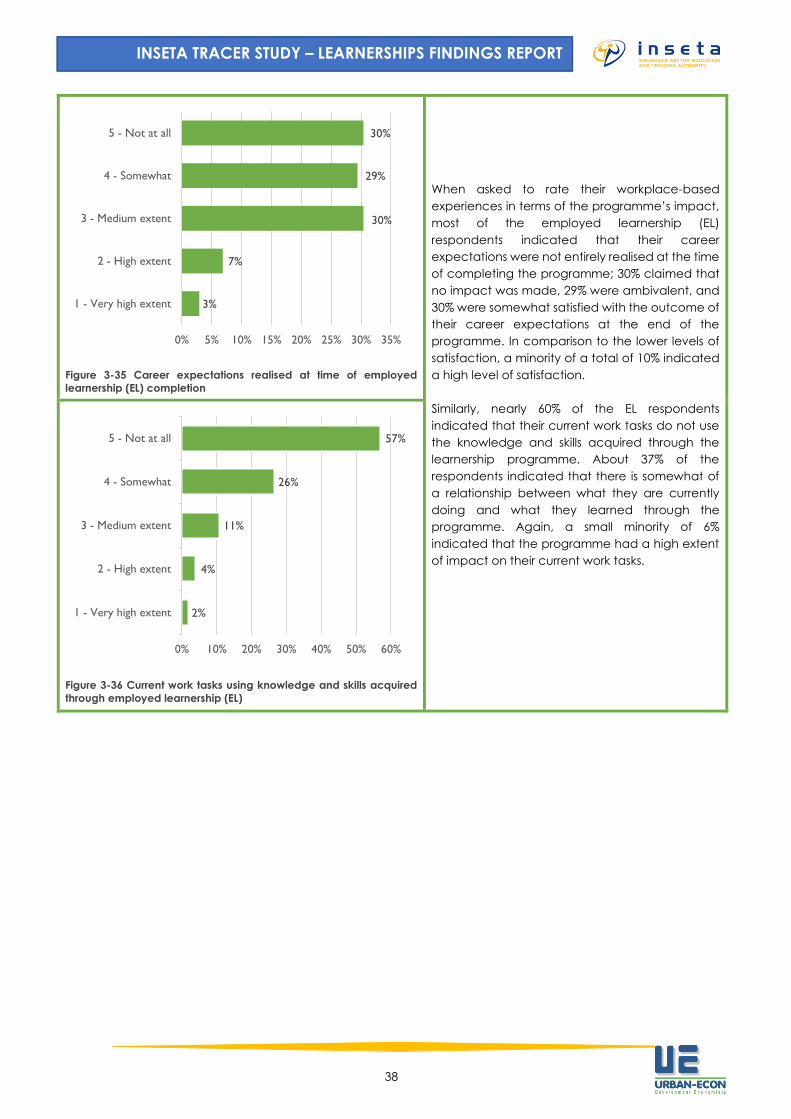
Figure 3-35 Career expectations realised at time of employed
learnership (EL) completion
When asked to rate their workplace-based
experiences in terms of the programme’s impact,
most of the employed learnership (EL)
respondents indicated that their career
expectations were not entirely realised at the time
of completing the programme; 30% claimed that
no impact was made, 29% were ambivalent, and
30% were somewhat satisfied with the outcome of
their career expectations at the end of the
programme. In comparison to the lower levels of
satisfaction, a minority of a total of 10% indicated
a high level of satisfaction.
Similarly, nearly 60% of the EL respondents
indicated that their current work tasks do not use
the knowledge and skills acquired through the
learnership programme. About 37% of the
respondents indicated that there is somewhat of
a relationship between what they are currently
doing and what they learned through the
programme. Again, a small minority of 6%
indicated that the programme had a high extent
of impact on their current work tasks.
Figure 3-36 Current work tasks using knowledge and skills acquired
through employed learnership (EL)
3%
7%
30%
29%
30%
0% 5% 10% 15% 20% 25% 30% 35%
1 - Very high extent
2 - High extent
3 - Medium extent
4 - Somewhat
5 - Not at all
2%
4%
11%
26%
57%
1 - Very high extent
2 - High extent
3 - Medium extent
4 - Somewhat
5 - Not at all
0% 10% 20% 30% 40% 50% 60%
39
INSETA TRACER STUDY – LEARNERSHIPS FINDINGS REPORT
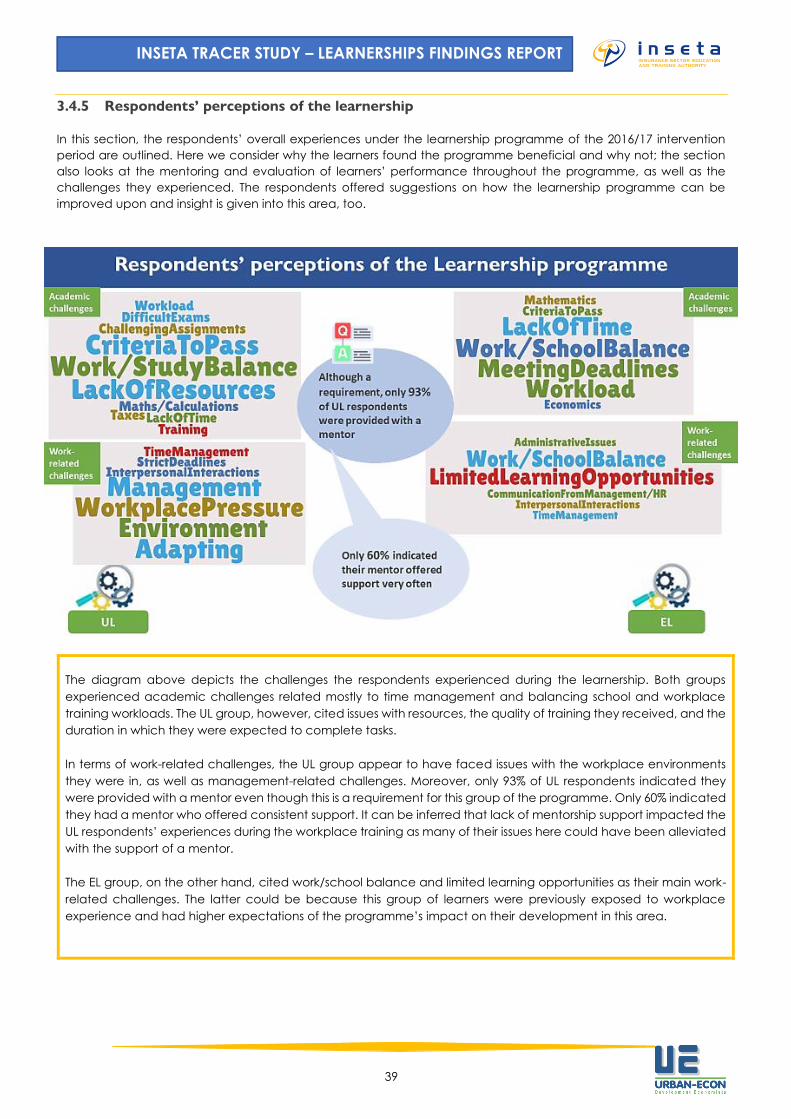
3.4.5 Respondents’ perceptions of the learnership
In this section, the respondents’ overall experiences under the learnership programme of the 2016/17 intervention
period are outlined. Here we consider why the learners found the programme beneficial and why not; the section
also looks at the mentoring and evaluation of learners’ performance throughout the programme, as well as the
challenges they experienced. The respondents offered suggestions on how the learnership programme can be
improved upon and insight is given into this area, too.
The diagram above depicts the challenges the respondents experienced during the learnership. Both groups
experienced academic challenges related mostly to time management and balancing school and workplace
training workloads. The UL group, however, cited issues with resources, the quality of training they received, and the
duration in which they were expected to complete tasks.
In terms of work-related challenges, the UL group appear to have faced issues with the workplace environments
they were in, as well as management-related challenges. Moreover, only 93% of UL respondents indicated they
were provided with a mentor even though this is a requirement for this group of the programme. Only 60% indicated
they had a mentor who offered consistent support. It can be inferred that lack of mentorship support impacted the
UL respondents’ experiences during the workplace training as many of their issues here could have been alleviated
with the support of a mentor.
The EL group, on the other hand, cited work/school balance and limited learning opportunities as their main work-
related challenges. The latter could be because this group of learners were previously exposed to workplace
experience and had higher expectations of the programme’s impact on their development in this area.
40
INSETA TRACER STUDY – LEARNERSHIPS FINDINGS REPORT
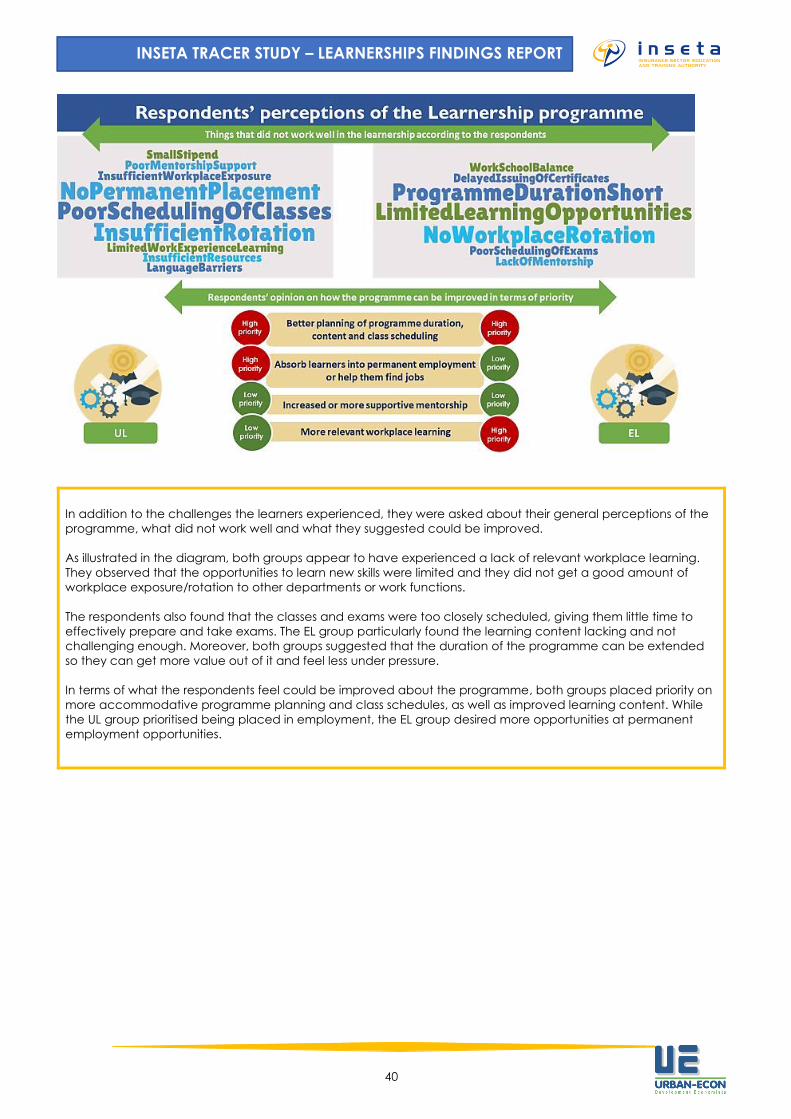
In addition to the challenges the learners experienced, they were asked about their general perceptions of the
programme, what did not work well and what they suggested could be improved.
As illustrated in the diagram, both groups appear to have experienced a lack of relevant workplace learning.
They observed that the opportunities to learn new skills were limited and they did not get a good amount of
workplace exposure/rotation to other departments or work functions.
The respondents also found that the classes and exams were too closely scheduled, giving them little time to
effectively prepare and take exams. The EL group particularly found the learning content lacking and not
challenging enough. Moreover, both groups suggested that the duration of the programme can be extended
so they can get more value out of it and feel less under pressure.
In terms of what the respondents feel could be improved about the programme, both groups placed priority on
more accommodative programme planning and class schedules, as well as improved learning content. While
the UL group prioritised being placed in employment, the EL group desired more opportunities at permanent
employment opportunities.
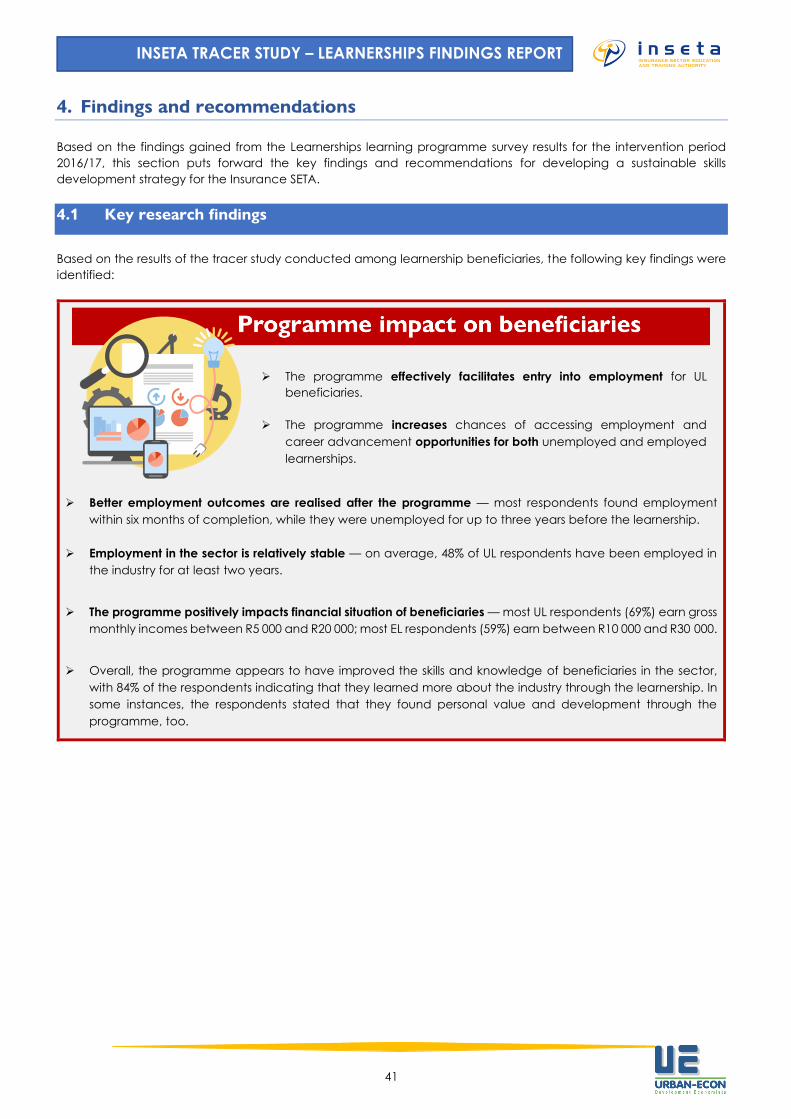
41
INSETA TRACER STUDY – LEARNERSHIPS FINDINGS REPORT
4. Findings and recommendations
Based on the findings gained from the Learnerships learning programme survey results for the intervention period
2016/17, this section puts forward the key findings and recommendations for developing a sustainable skills
development strategy for the Insurance SETA.
4.1 Key research findings
Based on the results of the tracer study conducted among learnership beneficiaries, the following key findings were
identified:
➢ Better employment outcomes are realised after the programme — most respondents found employment
within six months of completion, while they were unemployed for up to three years before the learnership.
➢ Employment in the sector is relatively stable — on average, 48% of UL respondents have been employed in
the industry for at least two years.
➢ The programme positively impacts financial situation of beneficiaries — most UL respondents (69%) earn gross
monthly incomes between R5 000 and R20 000; most EL respondents (59%) earn between R10 000 and R30 000.
➢ Overall, the programme appears to have improved the skills and knowledge of beneficiaries in the sector,
with 84% of the respondents indicating that they learned more about the industry through the learnership. In
some instances, the respondents stated that they found personal value and development through the
programme, too.
➢ The programme effectively facilitates entry into employment for UL
beneficiaries.
➢ The programme increases chances of accessing employment and
career advancement opportunities for both unemployed and employed
learnerships.
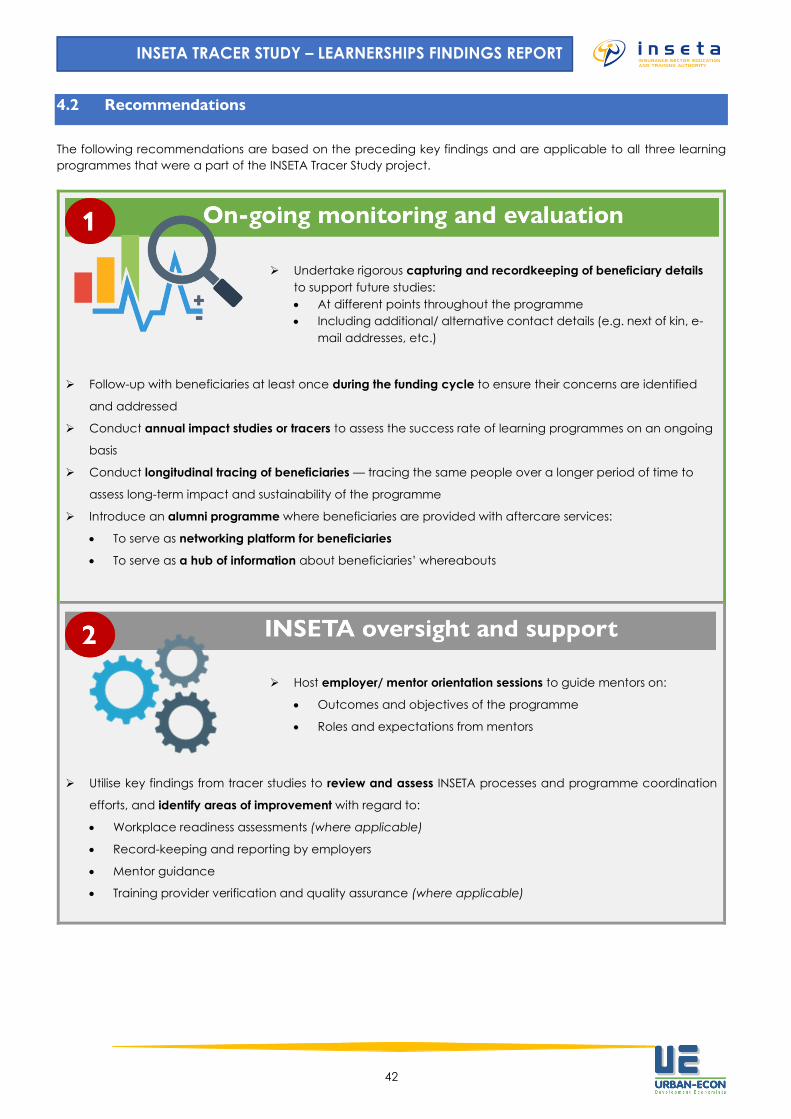
42
INSETA TRACER STUDY – LEARNERSHIPS FINDINGS REPORT
4.2 Recommendations
The following recommendations are based on the preceding key findings and are applicable to all three learning
programmes that were a part of the INSETA Tracer Study project.
➢ Follow-up with beneficiaries at least once during the funding cycle to ensure their concerns are identified
and addressed
➢ Conduct annual impact studies or tracers to assess the success rate of learning programmes on an ongoing
basis
➢ Conduct longitudinal tracing of beneficiaries — tracing the same people over a longer period of time to
assess long-term impact and sustainability of the programme
➢ Introduce an alumni programme where beneficiaries are provided with aftercare services:
• To serve as networking platform for beneficiaries
• To serve as a hub of information about beneficiaries’ whereabouts
➢ Utilise key findings from tracer studies to review and assess INSETA processes and programme coordination
efforts, and identify areas of improvement with regard to:
• Workplace readiness assessments (where applicable)
• Record-keeping and reporting by employers
• Mentor guidance
• Training provider verification and quality assurance (where applicable)
➢ Host employer/ mentor orientation sessions to guide mentors on:
• Outcomes and objectives of the programme
• Roles and expectations from mentors
➢ Undertake rigorous capturing and recordkeeping of beneficiary details
to support future studies:
• At different points throughout the programme
• Including additional/ alternative contact details (e.g. next of kin, e-
mail addresses, etc.)

43
INSETA TRACER STUDY – LEARNERSHIPS FINDINGS REPORT
References
DHET, 2015. A Workplace Based Learning (WPBL) Policy: The National Perspective. Pretoria: Department of Higher
Education and Training.
Government Gazette, 2018. “Sector Education and Training Authorities (SETAs) Workplace Based Learning
Programme Agreement Regulations,” 16 November, 641 part 1 of 2(42037), pp. 39-71.
INSETA, 2018. “Core Business: Learning,” [Online] https://www.inseta.org.za/core-business-
process/learning/#documents
INSETA, 2019. “Complete OFO,” Version 17 OFO Codes. [Online] https://www.google.com/search?client=firefox-b-
d&q=INSETA+ofo+codes