Embed Size (px)
Citation preview

1 August 2016

1
FOREWORD
The Board of INSETA is fully aware of the challenges expressed around previous SETA Sector Skills Plans. The concerns around reliability, accuracy and validity is shared in its’ sentiments with the changing environment in the Insurance industry and the landscapes of the SETAs under review, the Board of INSETA has risen to the challenge of ensuring a credible, insightful and high quality Sector Skills Plan for 2016/2017 that reflects the complex dynamics of the insurance sector and the challenges in meeting national, economic and social goals. The 2016 Sector Skills Plan produced by INSETA underpins the industry strategies where they exist and serves as a driving force to improve skills planning and productivity in the sector. This SSP also underpins the government’s agenda of reducing unemployment and combating inequality and alleviating poverty. The aim of this SSP is to ensure that this document is used as a source of reference by all stakeholders concerned with:
The workforce profile of the Insurance sub sectors
The supply and demands for skills wihin the insurance sector
Employment trends
Industry transformation and various occupational levels, and
Responding to the national agenda.
In responding to the expectations of the DHET, the Board of INSETA boasts the following viewpoints on this 2016 SSP:
The foundation of this SSP is rich in evidence –based research;
Compounded by a wealth of sub sector stakeholder inputs,
Focused on the state of skills in the sector; and
Research powerful enough to provide clear and reliable direction to INSETA towards
discretionary grant spend to support industry and economic goals.
The INSETA inhouse turnaround strategy to produce this Sector Skills Plan has yielded positive results in the eyes of the Board. To this end, we endorse this Sector Skills Plan of 2016. INSETA BOARD CHAIRMAN

2
COVER PAGE 30 July 2016 Ms Weziwe Sikaka Department of Higher Education and Training Dear Ms Sikaka It is with pleasure that I present the InSETA’s Sector Skills Plan (SSP) 2016 to the DHET. In this year’s submission of the SSP, InSETA has positioned itself to become an authority on labour market analysis in the insurance sector. This was only achieved through a strong employer-led process. Inseta has furthermore, taken the responsibility to up-skill its internal capacity on Labour Market systems and tools that will assist with research and development and data analysis. These are some of the noticeable updates in this year’s SSP. We are certain that the current form of the SSP sets out an agreed sector strategy to address skills needs. InSETA, in turn, has a central role to play in supporting the insurance sector to meet its skills needs. New theoretical input has been added throughout the August 2016 SSP. The Executive Summary not only summarizes the content of the 5 chapters but is coupled to the objectives of the National Development Plan. A separate section on research methodology has been positioned before chapter 1 as requested by the department, along with the inclusion of the PIVOTAL list. The Continuous Improvement Plan (CIP) has been rewritten according to the DHET CIP matters template. In terms of what has been done differently in relation to the CiP of 2015, the Seta also has embarked on a Strategic Integrated Project in collaboration with GIZ (skills for green jobs), the Construction SETA and the short-term insurance industry as well as the Dept. of Energy, are in discussion around replacing electric geysers with solar water heating systems. This project which is still in the early stages of discussions will provide training opportunities for apprentice and qualified plumbers who want to pursue this trade at TVET colleges. We are confident that this Sector Skills Plan will add impetus to the skills development initiatives activated by our Seta and give direction to them. We have no doubt that this SSP will become the key planning tool for skills forecasting and development within the insurance and related-services sector. _______________________________ SANDRA DUNN – INSETA CEO

3
ACRONYMS ABIB Association for Black Insurance Brokers
ASISA Association of Savings and Investment South Africa
ATR Annual Training Report
B-BBEE Broad-based Black Economic Empowerment
BBF Black Brokers Forum
BUSOSA Burial Society of South Africa
CEO Chief Executive Officer
CIPRO Companies and Intellectual Property Registration Office
CPI Consumer Price Index
CRFSA Council of Retirement Funds for South Africa
FAB Funeral Assistance Business
FIA Financial Advisory and Intermediary Association
FAIS Financial Advisory Intermediary Services
FET Further education and training
FETI Further Education and Training Institute
FPI Financial Planning Institute
FSB Financial Services Board
FSC Financial Sector Charter
FSP Financial service providers
GDP Gross domestic product
HEI Higher Educational Institution
HEMIS Higher Education Management Information System
HRDSA Human Resource Development Strategy for South Africa
ICT Information and communication technologies
IISA Insurance Institute of South Africa
ILA Institute of Loss Adjustors
InSETA Insurance Sector Education and Training Authority
JSE Johannesburg Stock Exchange
MoA Memorandum of Agreement
NC(V) National Certificate (Vocational)
NDP National Development Plan
NGP New Growth Path
NMMU Nelson Mandela Metropolitan University
NQF National Qualifications Framework
NSC National Senior Certificate
NSDS National Skills Development Strategy
NSFAS National Student Financial Aid Scheme
OFO Organising Framework for Occupations
PESTEL Political, economic, social, technological, environmental and legislative
PIVOTAL Professional, vocational, technical and academic learning
QCTO Quality Council for Trade and Occupations
RPL Recognition of Prior Learning
SAFOBS South African Federation of Burial Societies
SAIA South African Insurance Association
SAQA South African Qualifications Authority
SAUMA South African Underwriting Managers Association
SETA Sector Education and Training Authority
SIC Standard industrial classification
SMME Small, medium and micro-enterprises
SSP Sector Skills Plan
SWOT Strengths, weaknesses, opportunities and threats
TVET Technical, vocational, education and training
UMA Underwriting Managers Association
WSP Workplace Skills Plan

4
EXECUTIVE SUMMARY
The InSETA sector skills plan is what one can refer to as a program of action of the InSETA. This goes hand in hand with the common goal of all South Africans, the National Development Plan (NDP), which offers a long-term perspective. As a long-term strategic plan, it serves four broad objectives:
Overarching goals for what we want to achieve by 2030. Building consensus on the key obstacles to us achieving these goals and what needs to be
done to overcome those obstacles. Providing a shared long-term strategic framework within which more detailed planning
can take place in order to advance the long-term goals set out in the NDP. Creating a basis for making choices about how best to use limited resources.
The Plan aims to ensure that all South Africans attain a decent standard of living through the elimination of poverty and reduction of inequality. Given the mission and vision of the country as a whole, the InSETA skills development plan compliments the above targets by explaining the profile of the insurance sector and the role of the InSETA and its’ partners in the implementation of different programs. Detailed information is drawn on how InSETA disburses its funds in terms of the skills development levies act. Within the document great emphasis is given to the commitment of the InSETA in eroding unemployment in the South African economy through the insurance sector modification. Focusing on the problem of scarce and critical skills, dealing with the current high unemployment which is largely due to the mismatch of skills supplied by our labour force and what the labour market demands.
The InSETA has also clasas rified its’ intentions and rules of engagement with the public by emphasizing the point of working collectively with FET colleges, universities, private and public sector with the framework of theory and practice. By prioritizing and supporting the objectives of the SETAs sector as a whole and thereby facilitating curriculum and qualification design to be more responsive to industry demands through:
Providing quality lecturer, facilitator or trainer
Providing access to appropriate learning material
Providing relevant student information and support
Developing partnerships between public and private sector
Ensuring safe and productivity workplace with staff members who are able to sustain
quality skills and training provision that is responsive to industry demands.
On this new skill development plan document, the focus has not changed from the previous NSDS, but the emphasis of this new national skills development strategy, has indeed changed from the earlier versions of the NSDS. With an interactive skills planning approach, this has led to new performance evolution programs being put in place. When overviewing this skills developmental plan one can also question the planned program of action, given the knowledge of the financial system and the fundamental objectives of financial management. The international financial system is governed by theories which are relevant in

5
financial management but are also centred around maximizing some variable. For instance , maximizing profit, the value of the firm, the share price, shareholder wealth or company growth are often cited as important objectives of financial management. At the outset it is necessary to establish which variable should be maximized, if necessary, at the expense of others. We generally accept this in practice, as investors have expectations regarding the future. It is often possible to quantify such future expectations and express them as a single current value. Much of financial management is based on this concept, often referred to as the discounting of a series of expected future cash flows so that they may be expressed in single aggregated present value. Within this concept the question of which variable to maximize arises in the INSETA skill development plan where variable under concern is the welfare of others, which will make it either difficult or challenging for InSETA programs to work in the financial sector. There must be also a broader initiative where the focus is not only to the insurance sector but on an educational program that will bridge the gap between the general public and the whole financial sector where an attempt is made to restore public confidence in our financial system which was the main reason why the financial crisis was survived. Chapter 1 examines the 10 Sector Industrial Classification codes (SIC), that are represented by InSETA. These being Short Term, Long Term, Reinsurance, Pension Funds, Healthcare , Funeral, Unit trusts and Intermediaries. The intermediaries are represented by the brokers. The occupations identified in the Organising Framework for Occupations (OFO), represent a category that encompasses a number of jobs or specialisations within the various sub sectors. This chapter focuses on the scope of coverage within all sub sectors and gives an analysis of the major role players, the economic performance, and a detailed overview of the employer and employee profile within the sector. A comparative analysis, was done of the 2010 and 2012 InSETA data and interestingly, noticeable trends and progress were made around transformation at certain occupational levels, viz. gender at certain occupational levels and the progress of education within the sector, to mention but a few. Other important statistical areas worth mentioning is the statistics on people approaching retirement in the sector ( 55 – 65 yrs of age) and those over the retirement age (65+ yrs of age), as well as looking at the Youth Versus the Adults in the sector in relation to the retirement statistics. Feedback from sector partners on these alarming statistics have yielded discussions ong overdue in the sector. This too is in line with the regulatory requirements of the Financial Services Board which stresses the need for succession planning in the sector, where there is little happening from the information provided. In summary, concern is now around what can be done to address all these issues over the coming years so as prevent have businesses closing down especially SMEs and key posts having to be filled in the case of the larger companies. This could result in setbacks for business in the area of productivity. Overall economically, the sector is performing well, despite the challenges experienced in the economy and the high number of jobs lost in Quarter 1 of this year. In relation to economic performance, the percentage of real GDP varied depending on whether it was seasonally adjusted and annualised or the unadjusted market prices for Quarter 1 of 2015. The finance sector performed particularly well, and was second only to mining with regard to industry growth rates. Nominal GDP values and the contributions of the finance sector (of which the insurance sector is part), to GDP performed particularly well.

6
The economic performance of the long-term insurance industry was reviewed. Various economic factors are weighing down on consumers and the growth prospects of this industry. It was highlighted that the short-term insurance industry showed significantly improved results during 2015/16. Claims ratios decreased and underwriting margins increased due to a reduction in claims because of the absence of catastrophes. It is useful to look at the percentage representation of companies within each SIC code, because this indicates on which subcategory of insurance InSETA needs to focus its training service offerings. We also looked at major occupational groupings broken down according to race and its implications for transformation and skills development. Chapter 2 includes a discussion of the change drivers in relation to the supply and demand and the alignment with national strategies and plans. This chapter includes a table which clearly outlines the factors impacting on skills demand and supply in the sector and the implications for skills planning. Chapter 3 shows that the supply of skills for the insurance sector comes from entry and experienced levels. It is stressed that the need for the supply of skills for the insurance sector comes from TVET colleges, but for this to happen, the curriculum design at these colleges would have to be amended. The type of scarce occupations that are required by the insurance sector from 2016 to 2017, is also highlighted. It is also emphasised how critical skills are linked to the skills programmes. A new addition to the SSP June 2016, has been the development of a composite profile of critical skills for the period 2015 to 2019. Employment trends have been the most interesting in this section showing a steady growth of employment in this sector in comparison to any other sector. The PIVOTAL list has been included and it must be noted that this document has been widely discussed with the sector and endorsed. Chapter 4 highlights all the Iexisiting partnerships with the SETA. The successes and challenges of these are explained as well. What is in the pipeline with regards to new partnerships is also discussed in this chapter. The partnerships revolve around the following: registering burial societies as cooperatives, the human capital project and the financial code, making workplaces available for learnerships, making small businesses B-BBEE compliant and successful, as well as promoting the insurance sector as a career of choice. In Chapter 5, findings from previous chapters are identified. It also identifies the skills priorities arrived at from the goals of the NSDSIII. The measures that InSETA has taken to support national strategies and plans are discussed. In Summary, chapters 1 to 5 detail the updates since the 2015 SSP submission, and the focus now will now be on planning towards the skills shortages and addressing these in the SETAs upcoming strategic session.

7
TABLE OF CONTENTS
ACRONYMS .............................................................................................................................................................. 3
EXECUTIVE SUMMARY ............................................................................................................................................. 4
RESEARCH PROCESS AND METHODS ................................................................................................................ 10
RESEARCH METHODOLOGY FOR 2016/2017 SECTOR SKILLS PLAN ......................................................................... 10
CHAPTER ONE: SECTOR PROFILE ............................................................................................................................ 12
1. INTRODUCTION .................................................................................................................................................. 12
1.1 SCOPE OF COVERAGE .................................................................................................................................... 12
1.1.1 PERCENTAGE REPRESENTATION IN SIC CODES AND ITS IMPLICATIONS FOR SKILLS DEVELOPMENT .............. 13
1.2 KEY ROLE-PLAYERS ....................................................................................................................................... 13
1.3 ECONOMIC PERFORMANCE OF THE SECTOR .................................................................................................... 14
1.4 EMPLOYER PROFILE ......................................................................................................................................... 15
1.5 SUB SECTOR DISTRIBUTION – EMPLOYER DISTRIBUTION ................................................................................. 17
1.6 LABOUR MARKET PROFILE – LARGE AND MEDIUM EMPLOYERS DATA ............................................................ 19
1.7 LABOUR MARKET PROFILE – SMALL EMPLOYERS DATA ................................................................................... 20
1.8 POPULATION GROUP BY RACE AND OCCUPATION .......................................................................................... 22
1.8.1 IMPLICATIONS OF THE ABOVE RESULTS FOR TRANSFORMATION.................................................................. 22
1.9 GENDER BY ORGANISATIONAL SIZE ................................................................................................................. 23
1.10 CONCLUSIONS ............................................................................................................................................... 24
CHAPTER 2: KEY SKILLS ISSUES ............................................................................................................................... 25
2.1 CHANGE DRIVERS ............................................................................................................................................. 25
2.2 MAJOR FACTORS AFFECTING SKILLS DEMAND AND SUPPLY AND THE IMPLICATIONS OF THESE FOR PLANNING IN THE SECTOR ....................................................................................................................................................... 25
2.3 APPROACH TO THE RESEARCH IN THIS CHAPTER .......................................................................................... 26
2.4 ALIGNMENT WITH NATIONAL STRATEGIES AND PLANS ................................................................................ 26
2.4.1 NATIONAL PLANS AND STRATEGIES IN THE INSURANCE SECTOR AND THE IMPLICATIONS FOR SKILLS PLANNING? ............................................................................................................................................................ 26
2.4.1.1 DEVELOP NATIONAL STRATEGY TO TACKLE SKILLS SHORTAGE .................................................................. 26
2.5 NATIONAL DEVELOPMENT PLAN ...................................................................................................................... 27
2.6 THE NEW GROWTH PATH ................................................................................................................................. 27
2.7 WHITE PAPER FOR POST-SCHOOL EDUCATION AND TRAINING ........................................................................ 27
2.8 STRATEGIC INTEGRATED PROJECTS (SIPS) ........................................................................................................ 28
2.9 CONCLUSIONS .................................................................................................................................................. 28
CHAPTER 3: EXTENT OF SKILLS MISMATCHES ......................................................................................................... 30
3.1 EXTENT AND NATURE OF DEMAND .................................................................................................................. 30
3.2 SKILLS NEEDED – OCCUPATIONS IN DEMAND AND REASON FOR DEMAND ..................................................... 30

8
3.3 OCCUPATIONAL WAGE TRENDS ....................................................................................................................... 31
3.4 EMPLOYMENT TRENDS .................................................................................................................................... 31
3.5 CONDITIONS OF EMPLOYMENT IN THE INSURANCE SECTOR ............................................................................ 34
3.6 MIGRATION AND ITS IMPACT ON THE INSURANCE SECTOR ............................................................................. 35
3.7 THE EXTENT OF OCCUPATIONAL SKILLS SUPPLY IN THE SECTOR ...................................................................... 35
3.7.1 PROFESSIONAL QUALIFICATIONS .................................................................................................................. 35
3.7.2 THE STATE OF EDUCATION AND TRAINING PROVISION ................................................................................. 35
3.7.2.1 FAILING EDUCATION SYSTEM ..................................................................................................................... 35
3.7.2.2 TRAINING CHALLENGES .............................................................................................................................. 36
3.7.2.3 HELP TRANSFORM THE EDUCATION SYSTEM ............................................................................................. 36
3.7.2.4 SUPPORT SKILLS DEVELOPMENT ................................................................................................................ 37
3.7.2.5 SUPPLY PROBLEMS FACED BY EMPLOYERS ................................................................................................. 37
RETENTION CHALLENGES ....................................................................................................................................... 37
3.8 EXTENT OF SCARCITIES ..................................................................................................................................... 38
3.9 SKILLS GAPS WITHIN THE INSURANCE SECTOR THAT REQUIRE IMPROVEMENT ............................................ 40
3.9.1 COMPOSITE PROFILE OF CRITICAL SKILLS IN THE INSURANCE SECTOR BETWEEN 2015 AND 2019 ................. 41
3.9.2 REASONS ADVANCED FOR CRITICAL SKILLS ....................................................................................... 42
3.9.3 IMPACT OF SKILLS SHORTAGES ON INSURANCE COMPANIES ................................................................... 42
3.10 PIVOTAL SKILLS LIST ....................................................................................................................................... 43
3.13 PIVOTAL TRAINED BENEFICIARIES 1ST
JANUARY 2015 TO 31ST
DECEMBER 2015............................................. 46
3.14 CONCLUSIONS ................................................................................................................................................ 46
CHAPTER 4 SECTOR PARTNERSHIPS ....................................................................................................................... 48
INTRODUCTION ..................................................................................................................................................... 48
4.1 PROJECTS REFLECTING TVET COLLEGE PARTNERSHIPS ..................................................................................... 48
4.3 HOW SUCCESSFUL ARE THESE PARTNERSHIPS? ................................................................................................ 51
4.4 WHAT IS WORKING WELL WITH THESE PARTNERSHIPS? .......................................................................... 51
4.5 PROBLEMS EXPERIENCED WITH THESE PARTNERSHIPS ................................................................................. 52
4.6 HOW CAN PARTNERSHIPS BE STRENGTHENED? ............................................................................................ 52
4.7 WHAT NEW PARTNERSHIPS ARE NEEDED FOR THE SECTOR? ........................................................................ 52
CHAPTER 5 SKILLS PRIORITY ACTIONS .................................................................................................................... 53
INTRODUCTION ..................................................................................................................................................... 53
5.1 MEASURES TO SUPPORT NATIONAL STRATEGIES AND PLANS ...................................................................... 54
5.2 FINDINGS FROM PREVIOUS CHAPTERS ......................................................................................................... 55
CHAPTER 1 ........................................................................................................................................................................ 55 CHAPTER 2 ........................................................................................................................................................................ 56 CHAPTER 3 ........................................................................................................................................................................ 57 CHAPTER 4 ........................................................................................................................................................................ 58
BIBLIOGRAPHY ....................................................................................................................................................... 60

9
LIST OF TABLES Table 3 Inseta's Sic codes 2016 13 Table 4 Professional bodies and the associated categories under which they fall 14 Table 5 Large, medium and small levy and non-levy paying organizations (employers) in the insurance and related
services sector 16 Table 6 Organization size by number of employees 16 Table 7 OFO major group broken down by race and 'other' for large/medium levy-paying companies 1 January
2016 to 31 December 2016 19 Table 8 OFO major group broken down by race and 'other' for small levy-paying companies 1 January 2016-31
December 2016 20 Table 9 Factors affecting skills supply and demand in the insurance sector 25 Table 10 National list of occupations in high demand in 2014 relevant to the insurance sector 30 Table 11 South African insurance related occupations in 2015 31 Table 12 Top 10 Scarce skills for 2016 2017 38 Table 13 Reasons for scarce skill occupations in 2016 2017 39 Table 14 Skills programmes that address scarce & critical skills 40 Table 15 Critical skills which are allied to scarce skills for the financial investment advisor 2015-2019 41 Table 16 Critical skills which are allied to scarce skills for the insurance agent 2015-2019 41 Table 17 Critical skills which are allied to scarce skills for the call centre salesperson 42 Table 18 Inseta Pivotal Skills List for 2016 2017 43 Table 19 Pivotal Programmes for 2015 2016 46 Table 20 Work-based funding experience Memoranda of Agreement with TVET colleges 50 Table 21 Delivery and Invoicing schedule Error! Bookmark not defined.
LIST OF FIGURES
Figure 2 Subsector distribution by employer 17 Figure 3 Provincial breakdown in small levy-paying companies 18 Figure 4 Provincial breakdown in large medium levy-paying companies 18 Figure 5 Population Group by Race and Occupation 22 Figure 6 Gender by Organizational Size 23 Figure 7 Gender by Occupation 23

10
RESEARCH PROCESS AND METHODS
Research Methodology for 2016/2017 Sector Skills Plan
Introduction A human capital research project which was undertaken under the domain of Inseta project research where the angle focused on in the answer, is on the critical research methodological aspects. What did this study include which was incorporated into the 2016/2017 Sector Skills plan? An overview of transformation and skills availability in the South African insurance sector including the short-term, life and social security sector (last-mentioned sector includes retirement funding, healthcare and funeral insurance). a. Nature (Design) of the study (Qualitative or Quantitative)
The research design included the use of desktop research, 2 variant interview protocols (discussion guide and telephonic questionnaire), and the use of a web-based questionnaire survey in order to achieve the brief and objectives set for this study, which is outlined below. The scope of this study’s objectives necessitated the use of both exploratory (qualitative) and explanatory (statistical) research gathered from a broad range of sources. b. Objectives of study
Determine the status of transformation in the subsectors of the insurance industry served by Inseta
Determine what skills are available and identify skills shortages
Highlight areas that offer job creation opportunities
Identify gaps between existing and needed levels of qualification and skill
Define industry expectations regarding how to address these gaps c. Data collection tool/s
Multiple data collection tools were used. The research commenced with a briefing session with senior members of the insurance industry representative bodies. Based on their input, the discussion guide was designed that was used during in-depth face-to-face interviews with corporate decision-makers. The outcomes of these interviews informed the design of the questionnaire used in telephonic interviews with companies with 50 or more employees. Finally, a web-based self-completion questionnaire was created that gathered input from SMMEs within the insurance industry. d. Sample size and scope of the study
The sample size was the determining factor in deciding what type of methodology to use. In-depth face-to-face interviews with 58 senior representatives of leading organisations
Structured telephonic interviews with 228 senior representatives of smaller organisations
A web-based survey focused on 4000 SMME levy and non-levy paying members

11
The scoping of this study commenced with an evaluation of the background of the South African insurance industry. Here the focus was on the trends in transformation and skills development, and observations regarding the availability of skills within the insurance sector. It provided a basis for subsequent studies focusing on specific industry needs. The scope of this study follows Inseta’s breakdown of the insurance sector. Inseta’s membership is dominated by the short-term insurance, retirement funding, and life insurance sectors. More than a third of Inseta’s members play various auxiliary roles to the industry, but most are small companies and individual consultants operating within the SMME sector. For this reason the following sectors comprised the scope of this study: short-term, life-insurance and the social security industries. Reinsurance, risk management and intermediaries are included in the subsectors that they serve. e. List of data sources and data sets analyzed
Sectors of the industry stratified according to levy-paying and non-levy paying companies (WSP/ATR data 2013-2014). This analysis determined what sectors of the insurance industry were included in this research study. f. Time frame of the study (when was the study undertaken? Covering which period?
From March 2014 to December 2015. Conclusion The primary focus of the answer to this question is on the research methodological aspects of this human capital study. References InSETA Research Report 2014/15 – Final Combined Report – Overview of Transformation and Skills Availability in the South African Insurance Sector.

12
CHAPTER ONE: SECTOR PROFILE
1. Introduction The purpose of the Sector Profile is to present the profile of the Insurance sector and its sub-sectors in terms of the labour market profile and how the sector has been evolving over time. This chapter also looks at these companies from the perspective of their classification according to various standard industrial classification (SIC) codes or also known to many as sub-sector codes. This chapter provides an overview of the scope of coverage of the sector, the key role-players (their contributions to the sector) and the sectors economic performance. The economic performance of the sector was drafted based on data provided by Statistics South Africa and compared against other credible sector economic performance reports. Demographic profiles were constructed using but not limited to data from the 2016/17 Workplace Skills Plan (WSP) and Annual Training Report (ATR), as well as consultative workshops planned during the course of the financial period. A comparative analysis was done with this baseline data against other Labour Market data on the sector demographics. Due to the InSETA not being the only SETA representing companies within the Insurance Sector, and also not holding the full representation of every company within the insurance sector, it was imperative that we gather as much data sources to provide a more inclusive representation of the insurance and related services sector.
1.1 Scope of Coverage The Insurance and related services sector has evolved rapidly over the past 5 years, growing and developing as a major player in the South African economy. The Insurance and related services sector is clustered within the economic group category of “Finance, Real Estate and Business Services with the latest GDP statistics showing this sector to be the highest contributor to GDP in comparison to all other sectors. InSETAs sector includes 10 categories of the Standard Industrial Classification (SIC). Some of the economic activities described under the 10 SIC codes featured below are similar and, in order to facilitate more meaningful data, InSETA is in the process of re-categorising the subsectors for better data usage. The SIC code of “Insurance and pension funds” as well as, “Activities Auxiliary to Financial Intermediation” includes all insurance brokers and financial intermediaries that cut across a range of the other SIC codes. For this reason, the data and explanations are rearranged into the main categories of Short Term, Long Term, Health and Pension. Where a financial Intermediaries core business is not defined under one SIC code only, their data is then placed into the category of “Activities Auxiliary to Financial Intermediation”

13
Table 1 InSETA's Sic codes 2016
Sub Sector SIC Codes
Unit trusts 81901
Risk management 81902
Insurance & pension fund (except compulsory social security)
82100
Life insurance 82110
Pension funding 82120
Health care benefits 82131
Short-term insurance 82191
Funeral insurance 82192
Reinsurance 82193
Auxiliary activities (includes brokers and intermediaries) 83000
(Insurance Sector Education and Training Authority, 2016)
1.1.1 Percentage representation in SIC codes and its implications for skills development The level of representation of insurance companies within the various SIC a code is useful in the sense that it indicates where InSETA should direct its skills, developmental efforts and interventions. Obviously, an SIC code with a low level of insurance representation does not merit the same level of attention as an SIC code with a high level of attention. Also, when the SETA is planning for internships, bursaries, learnerships and skills programmes, the focus must be on the inclusion of those qualifications that are linked to those areas of insurance and SIC codes that command higher representation. Furthermore, the planning for qualification inclusion needs to go even further by looking at the percentage representation of SIC codes in large/medium core broker companies, small core broker companies, large/medium core training provider companies and small core training provider companies because SIC codes vary among them. As the Insurance SETA, InSETA could even advise its training provider companies on which qualifications they should focus, and align this to their target market, given the variant distribution of SIC codes.
1.2 Key role-players The insurance and related services sector is well organised through professional bodies and industry associations. InSETA is able to remain relevant and meet the demands of the sector through these partnerships which has been developed through the SETAs license period. InSETA partnerships reflected in Table 4 below are made up of these main innovators.

14
Table 2 Professional bodies and the associated categories under which they fall
Category Body Role of the Body in the sector Regulator Financial Services Board (FSB ) Regulator to all Finance, Non- Banking and
Insurance sector employers
Industry associations Association of Savings and Investment South Africa (ASISA) South African Underwriting Managers Association (SAUMA) Underwriting Managers Association (UMA) South African Insurance Association (SAIA)
Underwriting agency Short Term Life Insurance
Intermediaries subsector Financial Advisory and Intermediary Association (FIA) Black Brokers Forum (BBF) Association for Black Insurance Brokers (ABIB) Funeral Assistance Business (FAB) South African Federation of Burial Societies (SAFOBS) Burial Society of South Africa (BUSOSA)
Funeral subsector Short Term Subsector Activities Auxiliary to Financial Intermediation Life Insurance Healthcare benefits administration
Professional bodies Insurance Institute of South Africa (IISA) Institute of Loss Adjustors (ILA) Financial Planning Institute (FPI) Council of Retirement Funds for South Africa (CRFSA) Board of Healthcare Funders
Healthcare benefits and administration Life Insurance Short Term
Source: InSETA, 2016
1.3 Economic performance of the Sector The Insurance sector forms part of the broader financial services sector – the Finance, Real Estate and Business services sector. The total contribution of the Insurance specific sector is unable to be calculated because of the Insurance sector being clustered within the Finance, real estate and business services sector. According to BusinessTech (2016), South Africa is expected to face a tough economic year, with growth for 2016 expected to be less than 1%. The main contributors to the increase in economic activity in 2015 were finance, real estate and business services (0.6 of a percentage point), the mining and quarrying industry and the wholesale, retail and motor trade; catering and accommodation industry (each contributing 0.2 of a percentage point). Based on the latest statistics released, the Insurance sector – which forms part of the Finance, Real Estate and Business services sectors contribution to GDP is 0.4%
The Insurance sector, which forms part of the Finance, real estate and business services sector, continues to remain the largest contributor to GDP in comparison to other economic sectors.

15
The largest industries, as measured by their nominal value added in 2015, were as follows: Finance, real estate and business services – 20.9%; General government – 17.4%; Wholesale, retail and motor trade; catering and accommodation – 15.0%; and Manufacturing – 13.0%.
In terms of the sectors current performance, there was a 4% decline in earnings for the quarter ended March 2016 – from R545bn to R523bn. These decreases were recorded in all industries, except the business services industry which the Insurance sector forms part of. (Fin24.com, 2016 ). Employment declined by 0.2% to 9.2 million people in the formal non-agricultural sector of the economy. The Quarterly Labour Force Survey showed that the largest percentage of job losses took place in the retail, hotel and restaurant sector. In the retail trade sector, 27 000 jobs were lost, while 7 000 people were retrenched in the hotels and restaurants industry. Employment in the mining sector contracted for the sixth consecutive quarter by 4 000 employees in the first quarter of 2016. The Insurance sector which forms part of the Finance and Business services lost 9 000 jobs after employment rose by 42 000 in the last quarter of 2015. In terms of the future outlook for the country and the sector, cost-estimation site, HowMuch.net has drawn up map with countries scaled to show how each one’s predicted growth rate through 2024 compares to the rest of the world. The projections are based on a study of “economic complexity” run by the Centre for International Development at Harvard University.
The study captures the diversity and sophistication of productive capabilities embedded in a country’s exports, to generate the growth projections. Leading researcher, Ricardo Haussmann, said that gains in economic complexity have historically translated into higher incomes and growth. The research shows that India is expected to see the biggest growth to 2024, averaging 7% annually, followed by a number of African nations – Uganda, Kenya, Tanzania, Egypt and Madagascar – all close to 6%.
The projected data for South Africa is slightly less optimistic at 3.7% average per year to 2024, however, it is a vast improvement on current and expected growth trends – just 0.9% in 2016. Growth is expected to be only 1.8% in 2017, according to the International Monetary Fund. (Business Tech, 2016c)
In summary, the statistics above and those of 2016 recently released by STATS SA, shows that the Finance, real estate and business services sector remains the most competitive in relation to the rest of the economic sectors.
1.4 Employer profile
InSETA received data from 943 employers out of a total of 3415 employers in the 2016/17 WSP /ATR submissions. These 943 employers are represented by both levy and non-levy payers. These also employ a total workforce of 156 968 employees. Some of the limitations in conducting this analysis were in identifying which employers fall within the correct subsector categories. Whilst the FSB have only registered a certain number of short-term and long-term insurers, it is found that employers, mostly intermediaries, have categorised themselves

16
under the short-term and long-term category. This has skewed our statistics in terms of subsector representation. However, the INSETA plans to engage with DHET in 2017 to rearrange subsector codes with the insurance sector. Once employers fall within the correct subsectors, more accurate analysis can be conducted. Table 3 Large, medium and small levy and non-levy paying organizations (employers) in the insurance and related services sector
Type 2016 Total Registered Employers
Total Registered Employers who submitted data during the 2016 WSP period
Large ( 150 + employees ) 210 195
Medium ( 50 – 149 employees ) 208 139
Small ( 1 – 49 employees ) 2997 609
Total 3415 943
(Insurance Sector Education and Training Authority WSP data, 2016)
Table 5 above shows that there are 3415 levy and non-levy paying companies registered with the INSETA in 2016. The data shows that the total registered large businesses (210) employs the smallest (6893) workforce in the sector and the Small businesses (2997) are the employers of the largest workforce (259 837)(Table 6). Table 4 Organization size by number of employees
Type 2016 Employee data for the 3415 registered employers
2016 WSP
Data received from 943 employers
Large ( 150 + employees ) 6 893 1 678
Medium ( 50 – 149 employees )
149 520 4 554
Small ( 1 – 49 employees ) 259 837 150 736
Total 416 250 156 968 (Insurance Sector Education and Training Authority WSP data, 2016)
Kesper, (2001) and Ladzani et al, (2001) state that in Japan most of the businesses are SMMEs and their employees are members of free market and strong market economy. SMMEs do not only provide support for the regional economy through employment, but are also responsible to a day-to-day life of most Japanese. According to Ladzani and Netswera (2001), other countries such as the People’s Republic of China and Taiwan have reported that their SMMEs sector accounts for between 60% and 88% of the national total income. To confirm that SMMEs are the engine of economic growth and development in any economy, in many of the countries referred to, have ensured the vibrancy of the SMME sector and this engine has succeeded significantly in reducing unemployment and promoting the standard of living. SMMEs encourage entrepreneurship, (Kongolo, 2010). Egna (2009) confirms that the small businesses also make a contribution to job creation and poverty alleviation strategies in both the rural and the urban

17
work force, thereby bringing stability and innovation in the entire economy. South Africa has taken a serious stance on the support to the SME sector by establishing a Small Business Development Unit in government. However, with the current instability of the South African economy, the focus now shifts to the retention of employment through any means necessary.
1.5 Sub sector distribution – Employer Distribution It can be seen from Figure 2 below that the Auxiliary activities which includes brokers and intermediaries sector, has the highest level of representation, followed by Short term insurance, life insurance, Insurance and pension funds, funeral, healthcare followed by the rest.
Figure 2 Subsector distribution by employer
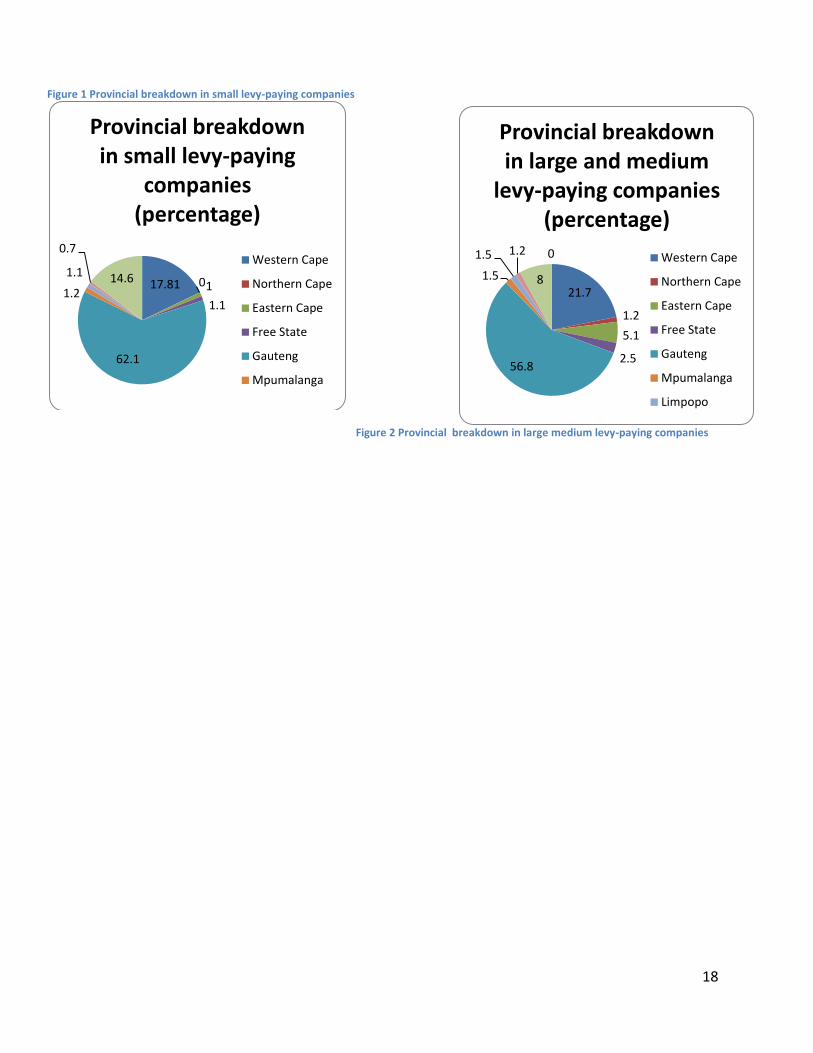
Figures 3 and 4 below show the provincial spread of all employers. Majority of the employers being based in Gauteng, followed by Western Cape and then KwaZulu Natal. The Eastern Cape appears to be a growing business hub. InSETA currently has representatives within the public colleges in the Eastern Cape. If InSETA is to ensure that we have a country-wide presence, we will need to ensure that there is a national presence through partnering with other SETAs or placing representatives in the province to ensure that skills development opportunities are reaching even the most remote of areas.
0.70%
1.87%
7.40%
9.40% 0.94%
3.40%
23.60%
6.40% 0.70%
45.60%
Percentage Unit trusts
Risk management
Insurance & pension fund (exceptcompulsory social security)Life insurance
Pension funding
Health care benefits
Short-term insurance
Funeral insurance
18
Figure 1 Provincial breakdown in small levy-paying companies
Figure 2 Provincial breakdown in large medium levy-paying companies
17.81 0 1
1.1
62.1
1.2
1.1
0.7
14.6
Provincial breakdown in small levy-paying
companies (percentage)
Western Cape
Northern Cape
Eastern Cape
Free State
Gauteng
Mpumalanga
21.7
1.2
5.1
2.5 56.8
1.5
1.5 1.2
8
0
Provincial breakdown in large and medium
levy-paying companies (percentage)
Western Cape
Northern Cape
Eastern Cape
Free State
Gauteng
Mpumalanga
Limpopo

19
1.6 Labour market profile – Large and Medium Employers Data From the table below, Technicians & Associated Professionals have the highest level of representation among large/medium employers (38,617) followed by Clerical Support Workers (31,225), by Professionals (27,936), Managers (15,621), Service & Sales Workers (2,412), Elementary Occupations (855), Skilled & related trade workers (581), and Plant & Machine Operators (371). Among Technicians & Associated Professionals, Africans (24,895) have the highest level of representation, followed by Whites (6,651), Coloureds (4,262), Indians (2,687) and Others (132). Table 5 OFO major group broken down by race and 'other' for large/medium levy-paying companies 1 January 2016 to 31 December 2016
OFO major group
African African female
African disabled
Coloured Coloured female
Coloured disabled
Indian Indian female
Indian White male
White female
White disabled
Other male
Other female
Other disabled
Total male
Total Total disabled male male male disabled female
Managers 2088 2194 30 890 1204 27 1006 1006 18 3524 3518 77 119 72 0 7627 7994 152
Professionals 4536 6114 55 1876 1968 47 1648 1539 27 5463 4547 109 166 79 2 13689 14247 240
Technicians
and
associated
professionals
9455 15440 77 1668 2594 35 1210 1477 25 2427 4224 90 65 57 2 14825 23792 229
Service and
sales 682 630 2 234 253 1 90 57 1 212 250 1 2 2 0 1220 1192 4
Clerical
support
workers
4888 10229 289 2240 5212 158 1186 2215 39 1004 4177 128 24 24 0 9342 21883 614
Skilled and
related
trades
workers
55 8 0 6 2 0 2 1 0 6 1 0 0 0 0 569 12 0
Elementary
occupations 170 578 2 25 63 0 6 2 0 3 3 0 4 1 0 208 647 2

20
Plant and
machine
operators
297 31 0 17 7 0 10 0 0 9 0 0 0 0 0 333 38 0
Total 15547 1247 455 1172 1529 268 2300 1066 110 3661 4478 405 380 235 4 18079 69805 1241
1.7 Labour market profile – Small Employers Data From the table below, Clerical support workers (2591) have the highest level of representation among small levy-paying companies, followed by Clerical Support Workers (2591), Technicians & Associated Professionals (2586), Managers (1561), Professionals (968), Elementary Occupations (271), Service & Sales Workers (174), and skilled & related trade workers (40). Among Technicians & Associated Professionals Whites have the highest level of representation, followed by Africans (382), Coloureds (238), Indians (197) and Others (11). Table 6 OFO major group broken down by race and 'other' for small levy-paying companies 1 January 2016-31 December 2016
OFO major group
African male
African female
African disabled
Coloured male
Coloured female
Coloured disabled
Indian male
Indian female
Indian disabled
White male
White female
White disabled
Foreign Male
Foreign female
Foreign disabled
Total male
Total female
Total disabled
Managers
76 71 1 56 72 0 23 64 1 693 497 0 5 4 0 853 708 2
Professionals
77 90 0 27 47 0 35 39 0 349 297 2 5 2 0 493 475 2
Technicians
and
associated
professionals
204 178 14 60 178 1 52 147 0 513 1067 17 7 4 0 836 1750 32
Service and
sales
workers
41 22 0 6 25 0 21 22 0 11 24 0 0 2 0 79 95 0
Clerical
support
workers
178 481 3 56 280 2 39 148 3 175 1224 20 3 7 0 451 2140 28

21
Skilled and
related
trades
workers
15 1 0 14 4 1 0 0 0 1 5 0 0 0 0 30 10 1
Elementary
occupations
65 181 0 1 17 0 1 0 0 1 4 0 0 1 0 68 203 0
Plant and
machine
operators
65 5 0 2 0 0 2 0 0 4 0 0 0 0 0 73 5 0
Total 721 1029 18 222 623 4 173 420 4 1747 3118 39 20 20 0 2883 5210 65

22
1.8 POPULATION GROUP BY RACE and OCCUPATION Among Technicians and Associated Professional the Black group (31956) has a greater number of employees than the White group (6651) as indicated in the table below. Among Professionals the Black group (17,873) has a greater number of employees than the White group. Among the Management group the Black group (8445) has more employees than the White group (7042).
Figure 3 Population Group by Race and Occupation
1.8.1 IMPLICATIONS OF THE ABOVE RESULTS FOR TRANSFORMATION These findings indicate that transformation has occurred across all major groups. The sector as a whole employs more Blacks (African, Coloured, Indian) than Whites in the sector and at each occupational level, however, in the Management category, Whites still hold the majority of positions against each of the other race groups when broken down per racial grouping. According to the WSP data of 2012 – 2016, only 1% of the total workforce is represented by persons with disabilities. InSETA needs to take a stronger stance to meet the National Transformational imperatives of employment of persons with disabilities in this sector. New fubding models need to address this. NOTICABLE TRENDS – If one compares this data with that of the sector data of 3 years ago, it was evident that transformation was happening, however, not at the relevant occupational levels of Management, Technicans and Professionals. 8 years ago, the sector data showed that the sector employed majority Whites at the levels of Management, Technicans and Professionals. Africans now exceed the Whites in the occupational category of Technicians and Professionals.
0 5000 10000 15000 20000 25000 30000 35000
Management
Professionals
Technicians and Associate professionals
Service and Sales workers
Clerical support workers
Skilled and related trade workers
Elementary occupations
Plant and Machine operators & Assemblers
Foreigners
Whites
Blacks

23
With the InSETAs support against Governments transformations imperatives (to support 85% Black, 54% Women and 4 % Disabled), it is clear that the SETAs initiatives have made an impact in the sector.
1.9 GENDER BY ORGANISATIONAL SIZE The Majority of workers in the Insurance sector are women, within both the large and small organisations. Women are well represented in the Management and Professional occupational category as can be seen from the graphs below. These comments are also shared by the Financial and Banking SETAs who show the similar representation.
Figure 4 Gender by Organizational Size
Females (69805) are more represented in large/medium companies than males (47313) Among small employers the same trend occurs females (5594) have a higher representation than males (3009). Figure 5 Gender by Occupation
(WSP/ATR Data, 2016)
0
20000
40000
60000
80000
Large Employers (50 + employees)
Small Employers (1 - 49 employees )
Gender by Organisational Size
Male
Female
8732
860
24108
25613
14733
22
1288
43
0 10000 20000 30000
MANAGERS
ELEMENTARY…
CLERICAL SUPPORT…
TECHNICIANS AND…
PROFESSIONALS
SKILLED…
SERVICE AND…
PLANT AND…
Gender by Occupation
Female
Male

24
Among Professionals females (14733) are represented by a greater number than males (14187). Among clerical support workers. Among Clerical Support Workers females (24108) are present in higher numbers than males (9798).
1.10 Conclusions It is the intention to reclassify standard industrial classification codes within the insurance sector because some of the broad sic codes overlap with sic codes, e.g. activities auxiliary ary to financial intermediation. Sic codes within the insurance sector range from unit trust to reinsurance. It is advanced that training within the insurance sector must be directed at those sic codes which command a higher level of representation. InSETA has partnerships with professional bodies ranging from regulators to intermediaries. The insurance sector falls under the finance, real estate and business services sector and this sector made the greatest contribution to economic activity during 2015. The insurance sector which forms part of the business service industry did not experience a decline in earnings for the quarter ended March 2016. Gains in economic complexity usually translate into more growth and predictions with regard to this phenomenon have been made until 2014 but South Africa has fared less well in this regard than countries such as India. Finance, real estate and the business services sector is more competitive than any of the other economic sectors within the South African context. 27.6% of InSETA’s registered employers submitted workplace skills plans for the period 2016-2017. An anomaly within the insurance sector is that large businesses employ the smallest number of employees and the smallest employers employ the largest number of employees. It is contended that small business should be the future driver of the economy in South Africa and it is hoped that South Africa will achieve the same successes as what has been achieved in Japan with SMMEs. The subsectors of the insurance sector vary in terms of their level of representation. Provincial representation of employers between the provinces differs. The distribution of occupational categories varies between large and medium and small levy-paying companies. Also the distribution of race among the various occupational groupings varies between large/medium and small levy-paying companies. Among the Management occupational category the White group holds proportionally more positions than the Black Group.

25
CHAPTER 2: KEY SKILLS ISSUES
2.1 Change drivers According to a report commissioned by InSETA around change drivers affecting the insurance industry, five key trends mentioned below are driving change in the insurance industry:
Social, political and economic pressure toward transformation (covered in a separate section)
Legislative and regulatory changes
Developments in technology
Changes in the competitor environment
New market opportunities
Technology is changing human interactions at all levels. Sophisticated and ubiquitous technologies are both changing the way humans interact with each other and with their providers, and creating floods of information with the potential to change the way sellers interact with buyers. These trends are creating a need for a new, high-tech skill set within the Insurance industry. Key trends include:
Big data
Automated underwriting
Greater use of technology in marketing, sales and service provision
2.2 Major factors affecting skills demand and supply and the implications of these for planning in the sector Table 7 Factors affecting skills supply and demand in the insurance sector
Changes in legislation and regulation Intensive regulation The increased regulation of the South African insurance industry has been driven by the need to achieve social and economic transformation, control the effects of the last global financial crisis, and improve governance. However, insurance industry members are concerned about: The high cost of compliance
The difficulty of finding staff with the skill sets needed to ensure compliance
Uncertainty regarding many requirements for implementation
Possible effects on their ability to do business effectively
Compliance officer plays a key role. Most financial transactions cut across numerous pieces of major legislation. The role of the compliance officer has always been important, but it is now crucial. Developing individuals with the industry understanding and insurance and legal skills to play this role has become a priority. A significant concern is that, while in-house compliance officers servicing the large insurers are insurance specialists, the compliance agencies serving smaller players may have little or no insurance industry knowledge. Regulation beneficial but presents challenges. The increased regulation of the entire South African financial services industry, including the insurance industry, has been powered by the need

26
to achieve social and economic transformation, control the effects of the last global financial crisis, and improve governance. However, compliance is costly, people with the skills to administer compliance are lacking, there is uncertainty regarding implementation, and industry members fear regulations may affect their ability to do business.
Developments in technology Transformational technology. Sophisticated and ubiquitous technologies are both changing the way humans interact with each other, and creating floods of information with the potential to change the way sellers interact with buyers. Short-term and life insurance sector participants believe smart phones and tablets will present the most important opportunities for technological innovation over the next five years.
Bringing new skills into the industry.Respondents within the life insurance sector found an unexpected benefit in the technology-driven changes within the insurance industry. They believe the industry now needs a set of brand new skills – and they say this need is helping to drive the transformation process.
2.3 Approach to the Research in this Chapter InSETA commissioned an in-depth study over the period of 2014 to 2015 to review and analyse the status of skills development within the insurance industry. A multiple methodology approach was used. This study involved: Desktop research that drew on industry data, published InSETA data, and proprietary data accessed by LDA for use in this project;
In-depth face-to-face interviews with 58 senior representatives of leading organisations
within each of the industries covered by InSETA;
Structured telephonic interviews with 228 senior representatives of large and medium
levy paying organisations; and
A web-based survey distributed to 4 000 small, medium and micro enterprise levy and
non-levy paying members.
2.4 Alignment with national strategies and plans
2.4.1 National plans and strategies in the Insurance Sector and the implications for skills planning?
2.4.1.1 Develop national strategy to tackle skills shortage
27
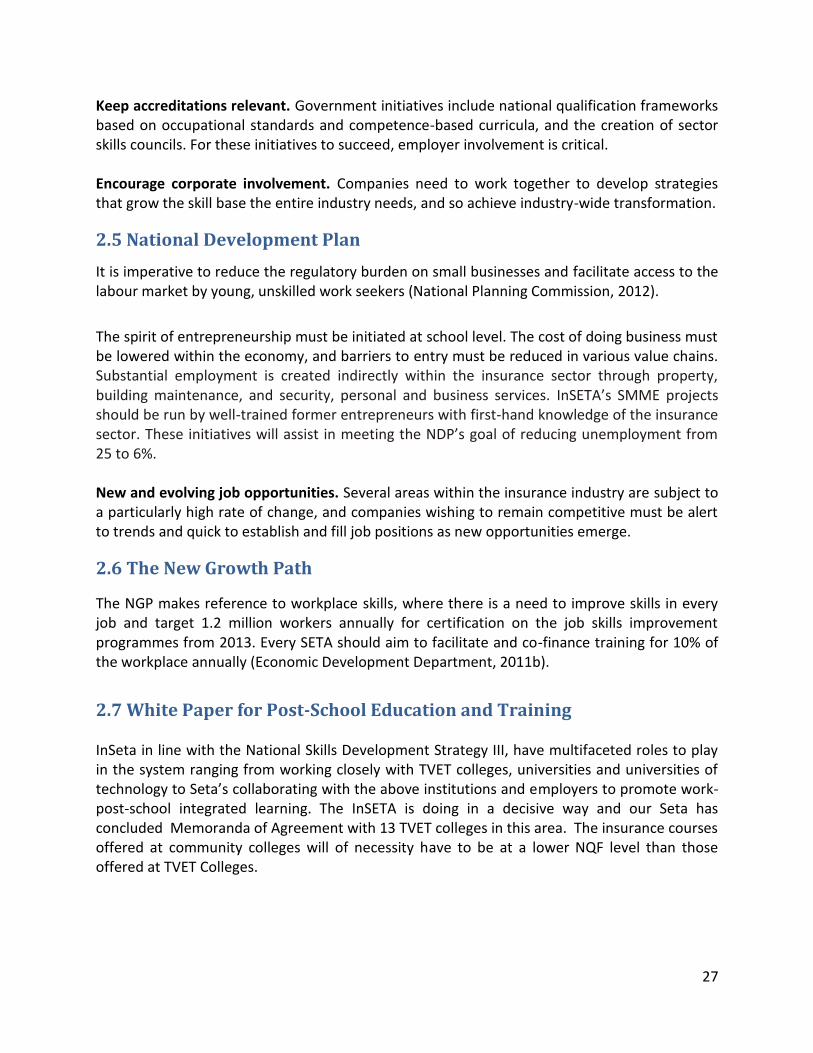
Keep accreditations relevant. Government initiatives include national qualification frameworks based on occupational standards and competence-based curricula, and the creation of sector skills councils. For these initiatives to succeed, employer involvement is critical. Encourage corporate involvement. Companies need to work together to develop strategies that grow the skill base the entire industry needs, and so achieve industry-wide transformation.
2.5 National Development Plan
It is imperative to reduce the regulatory burden on small businesses and facilitate access to the labour market by young, unskilled work seekers (National Planning Commission, 2012).
The spirit of entrepreneurship must be initiated at school level. The cost of doing business must be lowered within the economy, and barriers to entry must be reduced in various value chains. Substantial employment is created indirectly within the insurance sector through property, building maintenance, and security, personal and business services. InSETA’s SMME projects should be run by well-trained former entrepreneurs with first-hand knowledge of the insurance sector. These initiatives will assist in meeting the NDP’s goal of reducing unemployment from 25 to 6%. New and evolving job opportunities. Several areas within the insurance industry are subject to a particularly high rate of change, and companies wishing to remain competitive must be alert to trends and quick to establish and fill job positions as new opportunities emerge.
2.6 The New Growth Path
The NGP makes reference to workplace skills, where there is a need to improve skills in every job and target 1.2 million workers annually for certification on the job skills improvement programmes from 2013. Every SETA should aim to facilitate and co-finance training for 10% of the workplace annually (Economic Development Department, 2011b).
2.7 White Paper for Post-School Education and Training InSeta in line with the National Skills Development Strategy III, have multifaceted roles to play in the system ranging from working closely with TVET colleges, universities and universities of technology to Seta’s collaborating with the above institutions and employers to promote work- post-school integrated learning. The InSETA is doing in a decisive way and our Seta has concluded Memoranda of Agreement with 13 TVET colleges in this area. The insurance courses offered at community colleges will of necessity have to be at a lower NQF level than those offered at TVET Colleges.

28
2.8 Strategic Integrated Projects (SIPS) One of the projects which the InSETA is busy implementing with regard to meeting the “demand for SIPS” is the artisan development concept (Skills for a Green Economy). The project is aimed at addressing the need for Artisans to progress in their existing careers and for unemployed learners at entry level to qualify for access into the Insurance Sector. The research methods used to identify the change drivers are identified and discussed.
With support from GIZ/Skills for Green Jobs, a national consultation process with all major short-term insurance underwriters, their outsource partners and the INSETA revealed that the sector is a significant starting point for advocating and marketing of Solar Water Heating (SWH) technologies (Building green skills for South Africa). These findings are supported in light of the new National Solar Water Heating Programme (NSWHP) and the commitments of the insurance sector based on individual MOA’s between insurance underwriters and the Department of Energy (DoE). This is an opportunity to provide learners with work place experience that is much needed in the country. It is hereby proposed that InSETA ‒ in liaison with their short-term insurance stakeholders, Institute of Plumbing South Africa (IOPSA)/ Plumbing Industry Registration Board (PIRB) and the Construction Education and Training Authority (CETA) ‒ partner for purposes of a special project.
2.9 Conclusions
Research initiated by InSETA has identified 5 key change drivers. These are the change drivers
which impact on supply and demand in the insurance sector. These range from legislative and
regulatory changes to developments in technology. Technology will affect the seller/buyer
relationship. A need for high-tech skills has arisen within the insurance sector. Various factors
have been identified which impact on skills supply and demand and have implications for skills
planning. Critical ones which are outlined here are changes in legislation and regulation and
developments in technology. The implications for skills planning vis-à-vis legislation and
regulation is looked at from the perspectives of the changing role of the compliance officer and
also that the same phenomenon is double-sided in that it yields benefits but also brings
challenges at the same time. An example of a challenge is the difficult posed for implementing
regulation and a benefit. A benefit of compliance is enhanced governance.
Technology brings with it, a requirement for a new set of skills which will accelerate
transformation in the insurance sector.

29
Multiple research methods were used to identify change drivers and the factors influencing the
supply and demand for labour. These ranged from face-to-face interviews to a web-based
survey.
With respect to national strategies and plans these have been discussed in depth and all
relevant aspects pertinent to the project aspects of our Seta have been identified. The practical
aspects of the White Paper for Post School Education and Training which have impact on the
InSETA projects have been identified.
A national strategy for tackling the skills shortage is evolving where the emphasis is on
accreditation and corporate involvement. The National Development Plan is looked at from the
viewpoint of entrepreneurship and ways of reducing the barriers to accessing the insurance
sector. The same plan emphasizes that companies must be alert to new and evolving job
opportunities.
The New Growth Path is based on the premise that there is a need to refine and enhance the
skills in every job. It is emphasized the element of co-financing.
The practicalities of the White Paper for Post-School Education and Training is looked at from
the viewpoint of entering into partnerships with universities, universities of technology and
technical, vocational and educational training colleges especially from the perspective of work-
integrated learning. Also exploring the possibility of entering into partnerships with community
colleges.
The Seta also has a project which falls under the domain of Strategic Integrated Projects (SIPS)
in the area of artisan development (Skills for a Green Economy). This is related to the marketing
and funding of solar water heating technologies. This will create opportunities for artisans to
progress in their existing careers and for unemployed learners to gain access into the insurance
sector.

30
CHAPTER 3: EXTENT OF SKILLS MISMATCHES After having profiled the sector in chapter 1 and the people employed within it, and focusing on the key issues driving change, this chapter focuses primarily on understanding the occupation specific skills mismatches for employers in the sector. The issues of skills gaps in the sector will also be addressed.
3.1 Extent and nature of demand The Challenge of the Skills Shortage There is a growing mismatch between the skills employers need and the talent available. This applies both to technical skills and knowledge and to employees’ capacity to learn, adapt, lead, think laterally and solve problems creatively. A highly represented scarce skill occupations identified in this chapter are the occupational categories where the majority of vacancies exist. These are the most difficult occupations to fill. Table 8 National list of occupations in high demand in 2014 relevant to the insurance sector
Occupational title Occupational code
Sales and marketing manager 122101
Actuary 212101
Financial investment advisor 241301
Information and communication technologies (ICT) systems analyst
251101
From the national list of occupations in high demand for 2015, the above occupations have relevance for the insurance sector (Republic of South Africa, 2015). The occupation of ICT systems analyst is found in both InSETA’s 2015/16 and 2016/17 scarce skills lists for the sector.
3.2 Skills needed – Occupations in demand and reason for demand Specialist skills. There is a growing demand within the corporate environment for high-level professionals. In 2012 the most sought-after executive professional positions were specialist underwriters and actuaries, followed by capital management and risk management professionals. Non-executive directors and audit committee members were also in high demand.
Larger companies reported a shortage of actuarial skills, sales & distribution, and middle and senior management
Medium-sized companies reported a shortage of sales & distribution, IT skills and CRM managers
Small companies reported a shortage of actuarial and IT skills

31
3.3 Occupational wage trends Findings are based on actual salary offerings on the Career Junction website (more than 28 000 jobs monthly) for the latest measurable period (fourth quarter of 2014 and first quarter of 2015). According to Career Junction, the best-paid employees in South Africa are those in ICT fields, with many salaries stretching to over R45 000 per month (Career Junction, 2016). Notably, salaries in Gauteng were found to be 20 to 30% higher than in the Western Cape and KwaZulu-Natal (BusinessTech, 2015). All the above occupations and their associated salaries are directly related to the scarce skills lists from 2013 to 2017, which follow later in this chapter. It can be seen from the table that the salary level depends on the status, skill and seniority requirements of each occupation. The lower the status, skills requirements and seniority of the position, the lower the salary. Conversely, the higher the status, skill requirements and seniority associated with the occupation, the greater the salary. For example, the actuarial profession has the highest salary associated with it at senior level, while at skilled level, the salary associated with the occupation of ICT systems analyst exceeds that of an actuary. Table 9 South African insurance related occupations in 2015
Occupation From Skilled Senior To Skilled Senior
Client and customer support R9 677 R12 767 R11 411 R15 653
Call centre operator R9 937 R13 404 ** **
Call centre supervisor R13 714 R18 333 R20 250 R25 278
Financial advisory R22 274 R27 106 R30 635 R39 120
Actuary R27 833 R34 475 R39 259 R52 315
Insurance administration and sales R14 565 R18 736 ** **
Insurance advisory R13 920 R18 175 ** **
Underwriting R18 850 R23 632 R27 646 R34 750
Software development R26 982 R34 415 R35 297 R43 965
Systems analysis R32 580 R39 625 R40 621 R48 383
Marketing assistance R13 571 R17 375 ** **
Short-term life and medical insurance
Brokering R12 435 R16 258 ** **
Sales management R23 062 R28 587 R36 623 R43 733
3.4 EMPLOYMENT TRENDS InSETA has used the employment data received over the past seven years to determine the employment trend over time. The employment trend depicted below shows that the sector had 102 907 employees in the sector seven years ago. Over time (2010 – 2013), the sector increased in employment numbers. Between 2013 and 2014, there were 10 271 job lost, which is probably attributed to the FSB placed a regulatory deadline on the sector, which required all representatives to be FAIS compliant (Fit and Proper). Employees, who were non- compliant, were disciplined and fired or retrenched based on the feedback provided by the sector stakeholders. InSETA partnered with the FSB and various professional bodies and industry

32
associations like IISA, BBF, FPI and ASISA to ensure that more people would not lose their jobs and received training to retain their positions. Those who had lost their jobs were also supported through workshops runs by InSETA across the country to enable the representatives to rewrite the exams and get back into the industry. Despite the current economic conditions the insurance sector remains stable.
Figure 8 Employment Trends 2010-2016
(WSP Data, 2016)
1 2 3 4 5 6 7 8
Series1 0 2010 2011 2012 2013 2014 2015 2016
Series2 102908 106589 111840 112396 102125 142449 156968
020000400006000080000
100000120000140000160000180000
Employment Trends 2010 - 2016

33
(Large & Medium - WSP Data, 2016) (SME - WSP Data, 2016) Figure 9 Employment Turnover for Large Medium Companies Figure 10 Employment Turnover for Small Companies
From the Large and Medium Employer table above, it can be seen that, turnover is highest represented for resignations, followed by the non-renewal of contracts. In terms of sectoral needs and legislative requirements, it was found that most dismissals due to incapacity were due to people not passing their FAIS exams and hence not being compliant as a financial advisor. In terms of small employers who were interviewed, resignations were attributed to people seeking better opportunities in bigger organisations, majority of people left for a mere increase in salary. Retrenchments were attributed to economic conditions, where small businesses felt the need to cut down on certain areas of the business in order to maintain stability.
347 1 480
15 533
170 326 3 531
651 43
22 081
0
5000
10000
15000
20000
25000
182 123
837
22 26 50 8 2
1 250
0
200
400
600
800
1000
1200
1400

34
Figure 11 Educational Qualifications
If one compares the 2016 Educational Levels with that of the 2012 Sector Skills Plan report on Education levels of the sector, the following observations were made. The majority of the workforce in the sector still only has a matric. Although in 2012, there were more people with Degrees than there are currently in the sector. Currently, post schooling, there are more persons with Certificates and National Diplomas than there are persons with Degrees. One then needs to ask the question, has the standards of entry into the sector become relaxed, or are people not able to access funding to get their degree, or are people too busy trying to meet the required performance levels of the job that they are unable to focus on a higher educational certificate? InSETA will need to look at surveying this section of the SSP for better clarity on the Insurance sector entry requirements for various positions. Interestingly, there are more females qualified than males overall.
3.5 Conditions of employment in the insurance sector The continued pressure on South African economic growth is starting to affect local insurers. Economic growth in South Africa in the past year has been weighed down by industrial action, most notably in the mining industry. High energy costs and power interruptions continue to weaken growth. High levels of unemployment, low GDP growth rates, energy constraints, tax hikes, the continued deterioration of the value of the rand, industrial action and regulatory changes all continue to weigh down on consumers and growth prospects (PwC, 2015). All the above factors affect opportunities for employment in the South African insurance industry.
0
10000
20000
30000
40000
50000
60000
70000
80000
EDUCATIONAL QUALIFICATIONS
Male
Female
Total
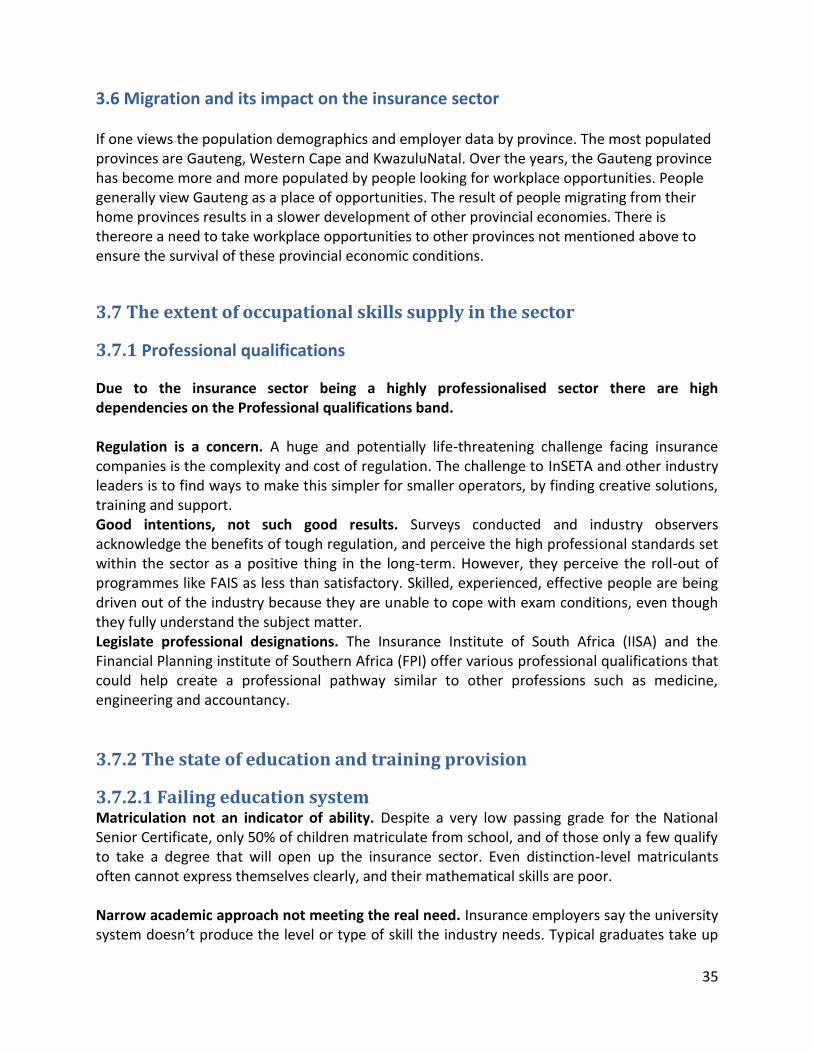
35
3.6 Migration and its impact on the insurance sector If one views the population demographics and employer data by province. The most populated provinces are Gauteng, Western Cape and KwazuluNatal. Over the years, the Gauteng province has become more and more populated by people looking for workplace opportunities. People generally view Gauteng as a place of opportunities. The result of people migrating from their home provinces results in a slower development of other provincial economies. There is thereore a need to take workplace opportunities to other provinces not mentioned above to ensure the survival of these provincial economic conditions.
3.7 The extent of occupational skills supply in the sector
3.7.1 Professional qualifications
Due to the insurance sector being a highly professionalised sector there are high dependencies on the Professional qualifications band. Regulation is a concern. A huge and potentially life-threatening challenge facing insurance companies is the complexity and cost of regulation. The challenge to InSETA and other industry leaders is to find ways to make this simpler for smaller operators, by finding creative solutions, training and support. Good intentions, not such good results. Surveys conducted and industry observers acknowledge the benefits of tough regulation, and perceive the high professional standards set within the sector as a positive thing in the long-term. However, they perceive the roll-out of programmes like FAIS as less than satisfactory. Skilled, experienced, effective people are being driven out of the industry because they are unable to cope with exam conditions, even though they fully understand the subject matter. Legislate professional designations. The Insurance Institute of South Africa (IISA) and the Financial Planning institute of Southern Africa (FPI) offer various professional qualifications that could help create a professional pathway similar to other professions such as medicine, engineering and accountancy.
3.7.2 The state of education and training provision
3.7.2.1 Failing education system Matriculation not an indicator of ability. Despite a very low passing grade for the National Senior Certificate, only 50% of children matriculate from school, and of those only a few qualify to take a degree that will open up the insurance sector. Even distinction-level matriculants often cannot express themselves clearly, and their mathematical skills are poor. Narrow academic approach not meeting the real need. Insurance employers say the university system doesn’t produce the level or type of skill the industry needs. Typical graduates take up

36
to 18 months to become productive due to their lack of workplace skills, and then are of limited use outside their area of specialty. New entrants into the job market often lack basic interview skills, etiquette and grooming, and have little ability to work within a team, solve problems, or expand their skill set into new fields. Call centres an ineffective entry point to insurance industry. Call centres tend to attract a high percentage of young Black school leavers, however there is a gap between skills at this level and those needed in other career fields within the insurance industry. Many potentially
3.7.2.2 Training challenges In-house training only a partial solution. Most employees depend on in-house training to bring new hires up to speed, rather than trying to recruit the skills they need. However this process brings its own challenges.
HR directors interviewed say a culture of entitlement limits the potential to fast track a candidate through the ranks. Often the fact of having being identified as suitable creates an expectation of frequent salary increases and other perks, while these candidates may not be diligent in acquiring the qualifications they need.
School leavers generally need substantial input to acclimate them to a work environment. This is a costly process, and employers need more cooperation from InSETA in certifying internal training programmes.
Regulatory restrictions. Promotion within the insurance industry often depends on a candidate having the qualification required by regulations.
The South African education system does not reliably produce school leavers with the capacity to achieve higher qualifications.
The cost of acquiring a qualification can be prohibitive for many employees who wish to further their careers.
Some observers believe these regulatory requirements enhance the credibility of the industry. Traditional training grounds have largely disappeared. Historically the traditional large multi-line insurers gave industry entrants an apprenticeship opportunity. With the consolidation of the industry, these opportunities have diminished. Increasingly skills development is the responsibility of partially-trained managers with limited experience and large gaps in knowledge.
3.7.2.3 Help transform the education system Promote desirable qualifications among matriculants. Activities by InSETA, life assurers and industry representative organisations to promote the insurance sector must go hand-in-hand with programmes to improve the number of candidates passing matric with the required level of skill in maths and science. Education costs more than governments can afford. As more young people complete their education, the number entering the workforce is rising while the demand for skilled workers in an increasingly globalised world is growing. The cost to a government of providing skills

37
development for all who need it are prohibitive, but research indicates that donor contributions are slowing down. Reinstate insurance college. Some respondents would like to see the reinstatement of an insurance college. They believe this would improve the industry’s professional image and attract a suitable candidates.
3.7.2.4 Support skills development Improving skills in the informal sector. According to the 2012 African Economic Outlook report, the informal and rural sectors will play an important role for young people seeking work. Areas that need attention are:
Make education systems more comprehensive and link them to the
labour market
Recognise informal apprenticeship training
Offer guidance on jobs and the labour market at all stages of the education system
Government policies must nurture entrepreneurial talent
Target the vulnerable. Skills development programmes should engage with the informal sector and vulnerable employees, to help them become more productive. Make training pay for itself. Ideally, training programmes for disadvantaged groups include income-earning opportunities, such as apprenticeships, with formal recognition of the competencies gained. Successful funding approaches. Studies have identified several types of initiatives to fund education and skills development that work even in an impoverished setting.
Global inter-sectoral partnering – a cooperative effort between global corporations, international institutions, government entities and civil society organisations that stimulates the flow of private funding into developing countries
Skills development programmes moving from international and national companies down through their supply chains
Encourage employees to overcome tough qualification requirements. There is a high dropout rate, and the industry needs to find ways to incentivise employees to complete their qualifications. As part of this process, InSETA is engaged in a joint venture with one of the larger life insurers to develop a segmented approach to a basic qualification. Candidates will receive a qualification for each segment completed of a larger BCom degree, enabling them to work and progress in their career while still studying.
3.7.2.5 Supply problems faced by employers
Retention challenges Greater need for stimulation. People are living longer and postponing retirement, and it is now the norm for people to change career paths three to five times in a lifetime. Meeting employees’ need for fresh stimulation and lifelong learning is a key function of HR management.

38
Loyalty cannot be assumed. Employees are no longer loyal toward their employers, and readily change jobs to improve their situation in the short-term. Life industry respondents report that lower-paid employees will switch jobs for as little as a R100/month salary increase, and even highly paid staff will readily change jobs to achieve short-term improvements. Job hopping an ongoing challenge. Life insurers seek to lock in their more talented staff by identifying potential candidates for training, capturing their imagination through career planning, offering ongoing in-house training, and supplying bursaries for university-level study. However in some fields the demand for skilled staff is so high that larger, more powerful employers will pay out promising young employees’ contracts and attract them with astronomical salaries. Effect on company morale. Headhunting throughout the industry results in remuneration that is out of line with other employees in similar categories. This can cause dissatisfaction among other members of staff.
3.8 Extent of scarcities It can be seen from the table below, that the occupation with the highest level of scarcity is financial investment advisor followed by insurance agent, call centre salesperson, sales and marketing manager, outbound contact centre consultant, sales manager, customer service manager, actuary, insurance broker, and developer programmer together with insurance administrator who are tied in terms of level of scarcity, as the 10th scarce skill. These are the top 10 scarce occupations for 2016/2017. Table 10 Top 10 Scarce skills for 2016 2017
OFO Occupation Code OFO Occupation Need Type Need 2016-2017 % of the Total 2015-241301 Financial Investment Advisor Black & Province 1039 42.20%
2015-332101 Insurance Agent 658 26.72%
2015-524401 Call Centre Salesperson 300 12.18%
2015-122101 Sales and Marketing Manager
202 8.20%
2015-422202 Outbound Contact Centre 73 2.96%
Consultant
2015-122102 Sales Manager 50 2.03%
2015-122105 Customer Service Manager 42 1.70%
2015-212101 Actuary 28 1.13%
2015-332102 Insurance Broker 24 0.97%
2015-251203 Developer Programmer 23 0.93%
2015-431201 Insurance Administrator 23 0.93%
Grand Total: 2462
WSP/ATR data 2016/2017
The reasons why the top 10 occupations for 2016/2017, are defined as scarce are provided under the column heading reasons for scarce occupations in column 3 of this table (Table 13 below).

39
Table 11 Reasons for scarce skill occupations in 2016 2017
OFO Occupation Code OFO Occupation
Reasons for Scarce Occupations
2015-241301 Financial Investment Advisor Business profile is growing
Employment Equity pool in industry is limited
The occupation is a core requirement for the business
2015-332101 Insurance Agent A person who has technical insurance knowledge and experience
Manage underwriting risk and maintain service levels
Growth and staff turnover
To support direct sales underwriting requirements
Replacement
A need to train call centre agents
Difficult to find FAIS Fit & Proper candidates
Putting the right insurance sales force in place does not come easy
2015-524401 Call Centre Salesperson No reason for scarce occupation provided
2015-122101 Sales and Marketing Manager Candidate not available to fill the position
Employment Equity pool in industry is limited
Compliance
2015-422202 Outbound Contact Centre Consultant Lack of skilled professionals
Compliance
Growth in business
823482015-122102 Sales Manager Leadership skills with insurance technical experience
Company is growing rapidly and there is a need to open more offices
Employment Equity
Knowledge of specific business practices
Growth and Turnover
2015-122105 Customer Service Manager Centre turnover and sales
2015-212101 Actuary Not many employment equity candidates with this skills and experience
Growth in business
Actuarial skills are always critical and scarce due to the skill level of the role
Legislative requirements for short-term Insurance business
A specialized skill
2015-332102 Insurance Broker To close the skills gaps
Advance insurance financial legal skills and knowledge
Commercial experience required
2015-251203 Developer Programmer Scarce skill
IT software developers Business
Intelligence specialists and testers difficult to source

40
Growth and turnover
Implementation of new technology
Vacancies need to be filled
2015-431201 Insurance Administrator Senior underwriters with these skills to service our clients in sub-Saharan Africa - East and West Africa
Table 12 Skills programmes that address scarce & critical skills
Skills programmes that address scarce and critical skills
Broad areas of scarce skills Employment Status
Type of Programme
Management and leadership Employed Any management and leadership development short programme that is NQF aligned, credit bearing and offered by an accredited institution that has approval to run this programme
Claims assessing Employed Any short programme that relates to this skills area and is NQF aligned, credit bearing and offered by an accredited institution that has approval to run this programme
Underwriting Employed Any short programme that relates to this skills area and is NQF aligned, credit bearing and offered by an accredited institution that has approval to run this programme
Actuaries Employed Any short programme that relates to this skills area and is NQF aligned, credit bearing and offered by an accredited institution that has approval to run this programme
Business and systems, as well as computer-based training skills
Employed Any short programme that relates to this skills area and is NQF aligned, credit bearing and offered by an accredited institution that has approval to run this programme
Advice and sales, marketing and customer care skills
Employed Any short programme that relates to this skills area and is NQF aligned, credit bearing and offered by an accredited institution that has approval to run this programme
Compliance and risk management-related skills, accounting skills
Employed Any short programme that relates to this skills area and is NQF aligned, credit bearing and offered by an accredited institution that has approval to run this programme
Indirect skills that may support the above scarce skills list, for example:
Administrative and secretarial skills Employed
Any short programme that relates to this skills area and is NQF aligned, credit bearing and offered by an accredited institution that has approval to run this programme
3.9 Skills gaps within the insurance sector that require improvement
Critical skills define and reflect the skills gaps that are evident in the insurance sector.

41
3.9.1 Composite profile of critical skills in the insurance sector between 2015 and 2019 A composite profile of critical skills associated with specific occupations in the insurance sector for the period 2013-2017 has been constructed. The tables below highlight the complexity of critical skills associated with scarce skill occupations. These tables provide a construct of role activities, level of experience and key performance activities associated with the identified scarce occupations. This exercise involved the extraction of critical skills where a count of numerical skills was calculated together with the associated percentage. The size of sample corresponding to the applicable OFO code occupational category is provided. A content analysis was performed on the array of critical skills in order to reduce the data and extract commonalities (common groupings) linked to the critical skills. It can be seen from the tables below that some of the percentages linked to critical skills attached to scarce occupations are low and some are noticeably high. The full range of percentages has been included for the following reason it still provides an indicator of the critical skills that individual companies consider to be of value. However, more weight should be attached to the higher percentages. The lower percentage critical skills can be equated with the type of critical skills linked to particular companies with specialized and unique insurance functions and the type of critical skills that would more likely be discussed around the table at a focus group discussion therefore the value of low percentage critical skills should not be underestimated. In some cases the percentages in these tables do not add up to 100% because our stakeholder companies did not always provide reasons for critical skills. Table 13 Critical skills which are allied to scarce skills for the financial investment advisor 2015-2019 Critical Skill Category Number Percentage Drawn from 4786 Financial
FAIS Compliant & Fit & Proper 4751 99.26% Investment Advisors
Financial Planning & Certified 33 0.68%
Financial Planner
Investment 1 0.02%
Employee Benefits 1 0.02%
WSP/ATR data 2016/2017
Critical skills which are aligned to the occupation of financial investment advisor range from FAIS compliant Fit & Proper (highest representation) to employee benefits (lowest representation). Second ranked critical skill for the above occupation is financial planning and certified financial planner. Table 14 Critical skills which are allied to scarce skills for the insurance agent 2015-2019 Critical Skilll Category Number Percentage Drawn from 388 Insurance
Agents
Long term insurance and risk assessment
213 54.89%
FAIS Fit and Proper required number of credits and full qualification
112 28.86%
Technical Underwriting experience and product
39 10.05%

42
knowledge; interpretation of survey reports; commercial and personal underwriting
Sales and New Business Consultant
20 5.15%
Fiduciary Consultant 4 1.03%
WSP/ATR data 2016/2017
The critical skill associated with the highest level of representation associated with the occupation of insurance agent is long term insurance and risk assessment, followed by FAIS Fit and Proper, required number of credits and full qualification, and then by technical underwriting experience and product knowledge, interpretation of survey reports, and commercial and personal underwriting. The critical skill associated with the above occupation with the lowest level of representation is Fiduciary consultant. Table 15 Critical skills which are allied to scarce skills for the call centre salesperson Critical Skill Number Percentage Drawn from 1900
Contact centre agent with FAIS Qualification
1900 100% Salespersons
WSP/ATR data 2016/2017
Only one critical skill is significantly associated with the occupation of call centre salesperson, i.e. contact centre agent with FAIS Qualification.
3.9.2 Reasons advanced for critical skills
Common reasons advanced by InSETA’s stakeholder companies for the existence of critical skills include the following: specialised skills, lack of experience and skills in the industry, growth and possible resignations, replacements, employment equity candidates and specialist skills, strategic deliveries and business operational requirements.
3.9.3 Impact of skills shortages on insurance companies
Although many contest its nature and extent, South Africa’s skills shortages are widely regarded as a key factor that prevents the achievement of targeted growth rates. Adcorp, the labour market specialist, attributes South Africa’s skills shortage to the emigration of high-skilled workers, immigration restrictions for highly skilled foreigners and an education system that is not responding adequately to the demands of the workplace. The Corporate Governance Framework Research Institute states that overly prescriptive regulation and the lack of a skilled workforce are two of the most significant business growth inhibitors in South Africa, with clear and direct impacts on employment. According to the Institute, 36% of business owners indicate that a lack of skills is constraining their expansion plans (IRMSA, 2015).

43
3.10 Pivotal Skills List Introduction Table 16 InSETA Pivotal Skills List for 2016 2017
SETAs' Pivotal Skills List - InSETA SETA NAME
SHORT/MEDIUM /LONG TERM
PERIOD
OCCUPATION CODE
OCCUPATION
SPECIALISATION/ ALTERNATIVE TITLE
INTERVENTION PLANNED BY THE SETA
NQF LEVEL
NQF ALIGNED Y/N
QUANTITY NEEDED
Quantity to be supported by SETA
0-100
101-1000
1001 & ABOVE
RATIONALE COMMENTS
InSETA
Short & Medium
2016-2017
2015-241301
1) Financial Investment Advisor
Financial Agent/Financial Consultant
Training with regard to FAIS Fit and Proper, financial planning, investments and employee benefits
NQF LEVEL 2-6 Y 1039 1100
X
Limited no. of qualified Financial Investment Advisors to fill this occupation.
Pivotal skills training Funding mechanisms , viz. learnerships, bursaries, projects & skills programmes
InSETA
Short & Medium
2016-2017
2015-332101
2) Insurance Agent
Insurance Client Services Agent/Insurance Underwriter
Training with regard to FAIS Fit and Proper, commercial and personal underwriting, risk assessment and fiduciary training
NQF LEVELS 1-8 y 658 1000
X
Limited no. of qualified Insurance agents to perform this occupation.
Pivotal funding is directed at the full range of pivotal scarce & critical skills required
InSETA
Short & Medium
2016-2017
2015-524401
3) Call Centre Salesperson
Contact Centre Agent (Interactive and Direct Marketing)
Assisting interns to obtain a FAIS Qualification in order to function as a call centre salesperson
NQF LEVEL 1 Y 300 1000
X
Insufficient no. of Call Centre Salespersons with appropriate qualifications
Funding mechanisms, viz. learnerships, bursaries, projects & skills programmes
InSETA
Short & Medium
2016-2017
2015-122101
4) Sales and Marketing Manager
Business Development Manager
Training for Sales and Marketing Managers to enhance their sales and marketing skills, viz. persuasion, prospecting, and closing skills
NQF LEVELS 1-8 Y 202 1000
X
Insufficient no. of Sales Managers with adequate insurance, technical & relationship management sales experience.
Pivotal funding is directed at the full range of pivotal scarce & critical skills required
InSETA
Short & Medium
2016-
2015-422202
5) Outbound Contact
Call or Contact
Training for FAIS, leadership and management and customer oriented
NQF LEVELS Y 73 1000
X
Insufficient no. of outbound contact
Funding mechanisms, viz.

44
2017 Centre Consultant
Centre Sales Agent
thinking 1-5 centre consultants with FAIS competency and requisite critical skills
learnerships, bursaries, projects & skills programmes
InSETA
Short & Medium
2016-2017
2015-122102
6) Sales Manager
Sales Executive
Training on the acquisition of high level insurance, financial, and sales knowledge. Training for regulatory requirements Training to become business architects
NQF LEVELS 1-6 Y 50 1000
X
Insufficient no. of sales managers with identified requisite critical skills
Pivotal funding is directed at the full range of pivotal scarce & critical skills required
InSETA
Short & Medium
2016-2017
2015-122105
7) Customer Service Manager
Client Services Manager
Training in the area of short-term insurance, customer service and problem solving.
NQF LEVELS 1-6 Y 42 1000
X
Insufficient no. of customer service managers with suitable critical skills
Funding mechanisms, viz. learnerships, bursaries, projects & skills programmes
InSETA
Short & Medium
2016-2017
2015-212101 8) Actuary
Actuary Manager/Average Adjuster
Training for funding of actuaries for the development of skills related to the calculation of actuarial risk and assisting prospective actuaries to qualify through the SAADP programme
NQF LEVELS 1-8 Y 28 1000
X
Insufficient qualified no. of partly qualified actuaries with a minimum no. of 6 exemptions.
Pivotal funding is directed at the full range of pivotal scarce & critical skills required
InSETA
Short & Medium
2016-2017
2015-332102
9) Insurance Broker
Short term insurance consultant
Training of short-term underwriters as well as assisting existing underwriters to acquire legal, financial, business and insurance knowledge
NQF LEVELS 1-7 Y 24 1000
X
Insufficient no. of qualified insurance brokers with commercial and personal lines experience
Funding mechanisms, viz. learnerships, bursaries, projects & skills programmes
InSETA
Short & Medium
2016-2017
2015-251203
10) Developer Programmer
ICT Developer/Applications Developer
Increasing the number of system and open source developers with ICT skills
NQF Levels 2-7 Y 23 1000
X
Insufficient no. of qualified developer programmers with the right mix of critical skills
Pivotal funding is directed at the full range of pivotal scarce & critical skills required
InSETA
Short & Medium
2016-2017
2015-431201
10) Insurance Administrator
Health Insurance Assessor
Increasing the number of underwriters in all subcategories of insurance
NQF Levels 1-7 Y 23 1000
X
Insufficient no. of qualified insurance administrators who are qualified underwriters
Funding mechanisms, viz. learnerships, bursaries, projects & skills programmes

45
3.11 Methods employed in identifying occupations in the pivotal skills list Stakeholder companies who submitted WSP/ATRs for 2016/2017 identified their scarce skill occupations for this year’s year band. Identified the pivotal occupations which were individually filtered on MS Excel and a count and percentage of the total was calculated. The interventions to be undertaken were informed by composite profile of critical skills developed for the insurance sector between 2015 and 2019, and the multiple research methodologies employed here were the following: a content analysis was performed on the critical skills identified by the stakeholder companies to create the common categories and reduce the number of categories; role activities, level of experience and key performance activities associated with the identified scarce occupations were isolated; and a further aspect of this methodology involved the extraction of critical skills where a count of numerical skills was calculated together with the associated percentage.
3.12 What informed the interventions indicated in the SETA PIVOTAL list?
3.12.1 What are the envisaged outcomes from the identified interventions?
To reduce the skills shortage in the areas of both scarce skill occupations and critical skills. To hone in on the reasons advanced for scarce skills occupations and where appropriate direct the interventions towards applicable reasons. 3.12.2 What consultative process did InSETA use to arrive at the pivotal occupations identified in the pivotal list? InSETA does not impose any limitations on the pivotal skills identified by our stakeholder companies. It is left to the discretion of the above companies to identify their pivotal skills. All that these companies are required to do is to provide their pivotal skills for 2015-2019 as defined by the fields on the Indicium system. 3.12.3 What are the main findings that informed the Seta pivotal list? The top 10 pivotal skills occupations were identified at varying levels of frequency (frequency distributions). The top 4 pivotal occupations occurred at noticeably higher levels of frequency than the bottom 7 (Cf. to table 30 above)
3.12.4 What informed the quantities indicated in the pivotal list? The quantities are informed by doing a count per occupations for all pivotal occupations and then identifying the top 10 pivotal occupations by through the method of rank ordering them. Quantities to be supported by the Seta were obtained from the Annual Performance Plan. 3.12.5 Is the Seta pivotal list ranked in order of priority? What informed the ranking of occupations?
Yes. An exhaustive list of every pivotal occupation was calculated together with the numeric count and percentage of total. From this, the top 10 pivotal occupations were determined.

46
3.13 Pivotal Trained Beneficiaries 1st January 2015 to 31st December 2015 The pivotal programmes which are included are listed 20 or more times when associated with occupations (occupational codes) The table below reflects the pivotal programmes which are endorsed most frequently by our large/medium stakeholder companies. Interestingly, the listings with a frequency of a 100 or more all have an insurance component to it, e.g. Further Education and Training Certificate: Short-Term Insurance. Other frequently subscribed to pivotal programmes with high levels of endorsement include: Higher Certificate: Short-Term Insurance, Certificate: Financial Planning, Bachelor of Commerce, etc. Table 17 Pivotal Programmes for 2015 2016 Pivotal Total Number of
Programme Listings 20 or more
Masters of Business Administration 51 Access Certificate Business 33 Advanced Certificate in Financial Planning 22 Bachelor of Business Administration 49 Bachelor of Commerce 97 Bachelor of Laws 32
Certificate: Financial Planning 144 Certificate: Financial Products 22 Certificate: Further Education and Training Course 30 Certificate: Law 24 Certificate: Management 39 Certificate: Management Development 29 Certificate: Senior Management Development 71 Diploma: Insurance Studies 23 Further Education and Training Certificate: Generic Management 20 Further Education and Training Certificate: Retail Insurance 26 Further Education and Training Certificate: Short-Term Insurance 153 Higher Certificate: Short-Term Insurance 150 IISA Programme in Advanced Insurance Practice (FSB044 NQF 6 120 credits 42
Master of Business Administration 33
National Certificate: Financial Planning 23 National Certificate: Generic Management 45 National Certificate: Insurance 21 National Certificate: Short Term Insurance 45 National Certificate: Wealth Management 71 Post Graduate Diploma: Financial Planning 25 WSP/ATR data 2016/2017
3.14 Conclusions The incongruity between skills employers need and that current skills available has been discussed in this chapter. The reasons for occupations in demand in particular specialist skills is discussed here. With respect to occupational wage trends it was concluded that the lower the status, skills requirements and seniority of the position, the lower the salary. Conversely, the higher the status, skill requirements and seniority associated with the occupation, the greater the salary.

47
The employment trends for the period 2010-2016 shows that employment numbers increased between 2010-2016, experiencing a decline in 2014 attributable to the Financial Service Board applying a deadline when the FAIS regulatory exams and since then employment numbers have progressively increased between 2015-2016. Highest level of employment turnover is attributable to resignations and non-renewal of contracts in large/medium companies. The frequency distribution of educational qualifications is highlighted and it was concluded that the majority of people in the insurance sector still only have a matric and there are more employees who have national certificates and diplomas rather than degrees in the sector. There are a number of factors which mitigate against favourable employment conditions in the past year. These range from high regulatory costs to industrial action. Migration has been viewed from the movement of people between the provinces to seek employment. Occupational skills supply has been looked at, with some emphasis on the professional qualifications band.
The top 10 scarce skills for 2016/2017 have been identified. These range from financial investment advisor to insurance administrator. An interesting inclusion in this chapter has been frequency of endorsement of pivotal learning programmes by our stakeholder companies. InSETA’s pivotal list for 2016/2017 has been included in this chapter. Columns range from Alternative Title/Specialization to Rationale for Pivotal skill.

48
CHAPTER 4 SECTOR PARTNERSHIPS
Introduction This chapter aims to assess the effectiveness of existing SETA partnerships in the sector, with particular reference to TVET work-based experience (WBE) internships . These work-based experience Memoranda of Agreement partnerships were entered into between the InSETA, TVET Colleges, employers and learners during 2015 and will be concluded in 2017.
4.1 Projects reflecting TVET college partnerships
4.1.1 What is the state of existing SETA partnerships? This issue is discussed in relation to various work-based experience internships that are run by InSETA. The element of how successful these internships have been is also discussed. The InSETA engages with burial societies on issues such as micro-insurance legislation with reference to its impact on the burial society industry, the registration of burial societies as cooperatives and the economic empowerment of burial societies. InSETA organises initiatives with BUSOSA and funds courses such as basic financial skills, governance, secretarial skills and basic computer literacy (InSETA, 2015). It also cooperates and engages with the FIA, SAIA, IISA and SAUMA on the Human Capital Development Project in relation to the Financial Sector Charter Code. InSETA along with the FIA, SAIA, FPI, SAUMA and IISA have partnered on various projects to develop the Short Term and Long Term insurance sector. One such project of note is the alignment of occupational codes in relation to the achievement of various programs to reach professional designations within the sub sector. InSETA works closely with the FIA to improve the supply of qualified people to industry. The FIA also encourages its members to open their workplace to InSETA-subsidised learnerships, Internships, Bursaries and Short learning programs to meet regulatory requirements set out by the FSB. (InSETA, 2015). InSETA formalised its relationship with the FIA with the conclusion of a recent Memorandum of Agreement (MoA) to promote the insurance sector among the youth in order to attract top talent to the industry. The programme is designed to help brokers build successful and sustainable businesses that comply with broader B-BBEE legislation. This programme, known as Project 100, involves a partnership between InSETA, the FIA and Santam. The reason for this initiative is that it is often difficult for smaller employers to pay enough attention to transformation due to the harsh economic realities and operational challenges their businesses face. It also addresses the crucial components of a learnership programme, namely recruitment, training and mentorship (InSETA, 2015).

49
InSETA, the IISA and the FPI have signed a MoA to partner with and promote the insurance sector as a career of choice. This historic partnership will see the parties working together to promote the insurance sector as a career of choice to in-school youths, out-of-school youths and employed workers. In this regard, the parties will seek opportunities to work together towards this initiative and specifically cooperate in the research on scarce and critical skills, while maintaining up-to-date career guidance information, creating comprehensive career pathways for the insurance sector, hosting career exhibitions and promoting careers in the insurance sector (InSETA, 2016). InSETA has a long standing relationship with the Financial Services Board (FSB), in supporting regulatory compliance for the Insurance and related services sector. In 2014 and 2015, InSETA partnered with the FSB on the FAIS project to ensure that financial advisors remain compliant through the achievement of the financial services qualifications. Since this period and well into 2016, InSETA has also been partnering with the FSB to support the Insurance and related services sector with the Regulatory Exams which had an impact on just over 10 000 Financial service providers (FSPs ). This exercise proved to be the most costly compliance requirement yet in the history of an FSPs career. With many FSPs having to retrench and discipline financial advisors who do not pass the regulatory exams. InSETA is currently partnering again with the FSB to further support FSPs and Independent Financial Advisors in their plea to be supported towards the achievement of the regulatory exams, some of whom have written these exams more than 10 times already.
4.1.1.1 Internships for TVET college learners This project targeted learners in TVET colleges who needed to be placed in workplaces to get workplace experience that would qualify them to obtain their TVET Nated-Diploma certificates. It contributed to supporting partnerships with TVET colleges (InSETA 2015a) ( The start date of this project is the 01112016 and the end date is the 31052017). This Project is aimed at addressing the need for TVET College learners to gain access into workplaces in order for them to acquire the TVET College qualifications that need workplace experience for certification. This is in line with the InSETA Strategy and Annual Performance Plan.
InSETA invited all Public TVET Colleges to apply for funding to place learners in Insurance workplaces, levy-paying and non-levy-paying. In cases where the Public TVET Colleges are in areas that do not have insurance companies, InSETA allows the TVET Colleges to place the learners in companies that have insurance departments (like retail stores) and other related financial services (like banks) that would support the Insurance sector.
Internships grants will be made available to 600 TVET College learners in all provinces, except the Northern Cape.

50
The running and funding of Internships for youth is a requirement of the National Skills Development Strategy (NSDSIII) and the National Skills Accord, in a bid to address youth unemployment and create increased access to occupationally-directed programmes. In addition, Internships for TVET College Learners are included in the InSETA Annual Performance Plan and Strategic framework.
This project aims to address the skills gap identified by potential host-employers in the insurance sector as regards Public TVET Learners, through insurance-specific Skills Programmes offered at commencement of an Internship programme; for TVET College learners that have been offered placements in the insurance sector. Training Providers already on the INSETA database who have gone through the procurement process will be used for these short programmes (InSETA 2015e). The InSETA entered into 13 work-based experience memoranda of agreements (MOAs) (InSETA 2015f) with the following TVET Colleges outlined in the table below: Table 18 Work-based funding experience Memoranda of Agreement with TVET colleges
Name of TVET College Location Start Date of MOA End Date of MOA Buffalo City College East London 01112015 31052017
Coastal Kwazulu-Natal (KZN) Toti 01112015 31052017
TVET College
College of Cape Town Cape Town 01112015 31052017
East Cape Midlands TVET College
Uitenhage 01112015 31052017
Ekurhuleni West TVET College Germiston 01112015 31052017
False Bay College TVET College Muizenberg 01112015 31052017
Gert Sibande TVET College Standerton 01112015 31052017
Ikhala TVET College Queenstown 01112015 31052017
Ingwe TVET College Mount Frere 01112015 31052017
King Hintsa TVET College Butterworth 01112015 31052017
Letaba TVET College Tzaneen 01112015 31052017
Majuba TVET College Newcastle 01112015 31052017
Maluti TVET College Bethlehem 01112015 31052017
4.2 Key MOA deliverables: The responsibilities of the Seta are detailed below:
Provide work based experience funding to graduates who have been identified by the
TVET College and approved by the Seta.
To approve the learners and the workplaces for WBE programme prior to the
commencement of the programme
To settle invoices according to the Public Management Finance Act (Act No. 1 of 1999,
as amended by Act 29 of 1999), within 30 days from receipt of duly completed invoice,
An amount of R3500 will be allocated per graduate per month and for the duration of
the WBE placement. The period of placement for WBE will be eighteen months.

51
To assist the TVET College with any engagements with insurance sector employers. This
will include any participation in workplace induction process; and
InSETA will exhibit careers in the insurance sector to attract learners from the TVET
College to the insurance industry. This exhibition will take place over one day at the
TVET College.
The responsibilities of the TVET College are detailed below: Identification and selection of insurance workplaces and learners.
The TVET College work placement officers identify insurance workplaces that are
willing to host learners for the duration of the programme. An expression of interest
form must be completed by employers.
Invite learners to apply for the InSETA WBE placement on an application form used by
the TVET college. Identify and select a shortlist through a means test which target
learners which come from a poor background. The learners selected must be
academically promising having graduated with a 60 percent or above average and are
interested in working with the insurance sector.
The learners selected must have completed qualifications which are skills in demand
in the insurance sector.. At the TVET College level these are:
N6 Business Management
N6 Financial Management
N6 Sales and Marketing
N6 Office Administration
N6 Management Assistant
With respect to gender at least 54% or higher of applicants must be female from all race
groups. Priority must be given to disabled persons from all race groups. The target for
disability is 4% but applicants in excess of this target will be welcomed. The race target
is 85% Black (African, Coloured and Indian), and 15% White.
4.3 How successful are these partnerships? InSETA’s partnerships are successful because all the preconditions of the Memoranda of agreements were met, e.g. the selection criteria. Also the activities operationalized by the deliverables are running according to schedule. Further the project plan is provided by the TVET Colleges and is refined through further discussion with InSETA.
4.4 What is working well with these partnerships? Reporting dates are being adhered to. The role players have a complete understanding of their roles and responsibilities and the approaches they must follow in order to realize them.
52
4.5 Problems experienced with these partnerships Usually, the partnerships formed within projects present a common set of problems:
A project may lose its viability to continue because of insufficient candidate support. The partnership formed within the project is disrupted as a consequence, and may only resume once the conditions required for continuance of the project are attained.
Partnerships within the project team and with all key role players may become strained because of poor delivery of project deliverables. This may also occur when the memoranda of understanding are not properly monitored and when the prescribed progress reports are not submitted.
Finally, strain within partnerships between institutions may happen when the one institution does not provide the prescribed documentation on time. This results in delays in payments for projects.
4.6 How can partnerships be strengthened? Partnerships between institutions and within the project team can be strengthened by ensuring that the project deliverables are met. This is done by:
o conducting inducting sessions with the TVET Colleges, employers and learners before
commencement of the programmes
o conducting monitoring session mid programmes
o encouraging the TVET Colleges, employers and learners to contact the INSETA should
they experience any non-compliance o the MOA during the running of the programmes.
4.7 What new partnerships are needed for the sector? Partnerships between InSETA and its professional bodies promote the insurance sector as a career of choice. InSETA and the above bodies will seek to cooperate to create comprehensive pathways for the insurance sector. This will involve in-school youths, out-of-school youths and employed workers by creating career pathways for them (InSETA 2015d).

53
CHAPTER 5 SKILLS PRIORITY ACTIONS
Introduction
InSETA’s skills priority actions are directed by the foundation that is set by the NSDS III, and are set by the goals of this same strategy, namely increased access to occupationally directed programmes, better use of workplace skills development, training and support provided to sector cooperatives, small enterprises and non-governmental organisations, and building career and vocational guidance. Three of InSETA’s programmes (youth, education and development, addressing the need for scarce and critical skills, and small and micro-enterprise development) determine the direction of its skills priorities. InSETA’s skills priorities can be seen from the type of projects that are executed. Skills Priority 1: Equip unemployed youths (18 to 34) with the means to secure a job and a brighter future through education and training. This is achieved through year-on-year funding increases to applicable projects that advance the employability potential of our youth. This support takes on various forms in the projects that are run, such as skills programmes for unemployed youths, bursaries for youths not in employment in collaboration with NSFAS, SMME learnerships and internships in 2014 and 2015. Skills Priority 2: Assist in tangible ways with the transformation of the insurance sector. One way in this is realised is through the selection of candidates for bursaries and skills programmes to satisfy the NSDS III principle as follows: black (85%), women (54%) and people with a disability (4%). Several of InSETA’s projects are geared towards addressing transformational issues. Qualifying criteria for learnerships take cognisance of key transformational imperatives. Skills Priority 3: Promote the alleviation of scarce and critical skills in the insurance sector. This is achieved by developing new qualifications through QCTO that support scarce and critical skills for the insurance sector, as well as funding applications for bursaries, learnerships and internships, providing PIVOTAL programmes to support the alleviation of scarce and critical skills, and implementation of the SETA-FET Collaboration Project Year 13. Skills Priority 4: Foster the development of FSPs by supporting them in their endeavours to obtain FAIS Act credits and pass the regulatory examinations. InSETA gives other tangible expression to this priority through the development of learning material training around FAIS, namely Key Individuals and Representatives manuals. As a SETA, it has also given credence to this objective by developing a national RPL option for FSPs, which has the support of the FSB and was developed jointly with SAQA. Skills Priority 5: Promote the development of micro-cooperatives, in particular burial societies.
54
InSETA assists burial societies to register as cooperatives and equips them with skills through the training of burial societies. All InSETA’s skills priorities are expressed in a tangible form through its projects. All its projects are evaluated for their degree of risk: high, medium or low. A risk register is also in place, where the level of risk is recorded, as well as how the level of risk can be reduced through the application of various interventions.
5.1 Measures to support national strategies and plans All InSETA’s Discretionary Grant programmes must comply with the key developmental and transformational imperatives of the NSDS III, namely equity profile, class and geography. B-BBEE and the FSC drive the transformation of the sector. InSETA needs to support small black business because of the poor state of transformation in this area, which is exacerbated by structural barriers to entry. Concerted efforts and substantial resources are needed to support small black business. One of the key pillars being investigated by the Human Capital Project for the insurance industry is transformation (InSETA, 2014b). It is argued and demonstrated that InSETA’s SSP operationally assists with the achievement of the strategic goals of the NSDS III. It does this in unique ways for each of the abovementioned strategic goals. It is argued that the SSP lends practical import to Strategic Goal 2 – increased access to occupationally directed programmes through various vehicles, competency on learnerships, internships and work-based programmes. It is contended that InSETA’s SSP imparts vital substance to Strategic Goal 3 – better use of workplace-based skills development through various projects. The Business and System Analysis, Year 13 QCTO Pilot Underwriters, InSETA National Skills Broker Network and Employment Portal, and SMME projects are all geared towards alleviating scarce and critical skill shortages, as well as unemployment. It is also maintained that InSETA contributes to the burial society movement and, in turn, to Strategic Goal 4 – training and support provided to sector cooperatives, small enterprises and non-governmental organisations. This is achieved by measuring target variables, identifying recent legislation that is relevant to burial societies and stokvels, and encouraging implementation of the legislation. Finally, the SSP establishes strategically in which geographic regions burial societies need to be increased. InSETA’s SSP also contributes to Strategic Goal 5 – building career and vocational guidance. This is achieved through its plan to adopt a multifaceted approach to career and vocational guidance by doing an empirical analysis of the various elements. The SSP needs to evaluate the current career guidance calendar and make an appraisal about whether additional items need to be added. In addition, the SSP needs to evaluate the statistics and trends from Goal 4.8 – career paths are mapped to qualifications in all sectors and subsectors and are communicated effectively. The SSP must identify the relevant elements of the legislative framework and incorporate this into the current strategic plan.

55
Aspects of the NDP, NGP and associated National Youth Accord, and the HRDSA are all considered when scoping projects. These projects include placing youths in employment by employing various mechanisms, promoting and developing SMMEs, SETAs co-financing training with employers, setting targets to achieve a credible mechanism for skills planning, and meeting demographic and transformational imperatives.
In conclusion, tangible operational measures are put in place through InSETA’s projects, which wholeheartedly support the goals of the NSDS III, the NDP and the HRDSA 2010–2030.
5.2 Findings from previous chapters
Chapter 1
The economic performance of the sector was drafted based on data provided by
Statistics South Africa and compared against other credible sector economic
performance reports
Due to the InSETA not being the only SETA representing companies within the Insurance
Sector, and also not holding the full representation of every company within the
insurance sector, it was imperative to gather as much data sources to provide a more
inclusive representation of the insurance and related services sector.
The Insurance and related services sector is clustered within the economic group
category of “Finance, Real Estate and Business Services with the latest GDP statistics
showing this sector to be the highest contributor to GDP in comparison to all other
sectors
When the SETA is planning for internships, bursaries, learnerships and skills
programmes, the focus must be on the inclusion of those qualifications that are linked
to those areas of insurance and SIC codes that command higher representation
The planning for qualification inclusion needs to go even further by looking at the
percentage representation of SIC codes in large/medium core broker companies, small
core broker companies, large/medium core training provider companies and small core
training provider companies because SIC codes vary among them
InSETA has also been partnering with the FSB to support the Insurance and related
services sector with the Regulatory Exams which had an impact on just over 10 000
Financial service providers (FSPs ). This exercise proved to be the most costly
compliance requirement yet in the history of a FSPs career. With many FSPs having to
retrench and discipline financial advisors who do not pass the regulatory exams
The total contribution of the Insurance specific sector is unable to be calculated because
of the Insurance sector being clustered within the Finance, real estate and business
services sector

56
There was also a 4% decline in earnings for the quarter ended March 2016 – from
R545bn to R523bn. These decreases were recorded in all industries, except the business
services industry
InSETA received data from 832 employers out of a total of 3415 employers in the
2016/17 WSP /ATR submissions. Some of the limitations in conducting the analysis were
in identifying which employers fall within the correct subsector categories. Whilst the
FSB have only registered a certain number of short-term and long-term insurers, we find
that employers, mostly intermediaries, have categorised themselves under the short-
term and long-term category. This has skewed our statistics in terms of subsector
representation. However, the InSETA plans to engage with DHET in 2017 to rearrange
subsector codes with the insurance sector. Once employers fall within the correct
subsectors, more accurate analysis can be conducted
Transformation has occurred across all major groups and occupations. The sector as a
whole employs more Blacks (African, Coloured, Indian) than Whites in the sector and at
each occupational level, however, in the Management category, Whites still hold the
majority of positions against each of the other race groups when broken down per racial
grouping and youth dominating the clerical occupations
The Majority of workers in the Insurance sector are women
There is an alarming amount of employees that are currently in the Reaching
Retirement (55yrs – 64yrs) age category, especially in the Management, Professional
and Technical occupational categories. The industry in partnership with InSETA needs to
urgently look at interventions to ensure that there is a new supply of personnel to fill
these posts soon
The majority of the workforce in the sector still only has a matric. Although in 2012,
there was more person with Degrees than there is currently in the sector. Currently,
post schooling, there are more persons with Certificates and National Diplomas than
there are persons with Degrees. One then needs to ask the question, has the standards
of entry into the sector become relaxed, or are people not able to access funding to get
their degree, or are people too busy trying to meet the required performance levels of
the job that they are unable to focus on a higher educational certificate?
Chapter 2
Compliance is costly and people with the skills to administer compliance are lacking
Employers want to be compliant with the B-BBEE scorecard and hence will look to
INSETA for support
Difficulties with recruitment are slowing transformation. The insurance industry believes
that the recruitment pool is too small to meet their needs

57
There is not much room for planning for skills in various occupational areas if there is a
lack of awareness of the careers in demand
Fast-track promotion can lead to weak management
Education system not meeting needs
A significant concern is that, while in-house compliance officers servicing the large
insurers are insurance specialists, the compliance agencies serving smaller players may
have little or no insurance industry knowledge
Some employers are importing skills that are scarce because it is an urgent / critical
need or to meet future demand through skills transfers
Companies and representative bodies should work together
The education system is failing to produce work-ready job applicants
Recruitment challenges: needed skills are in short supply
In-house training is expensive, and limited in what it can achieve without certification
Constant poaching, together with a lack of loyalty on the part of employees, is inflating
salaries and driving down productivity
Companies need to work together to develop strategies that grow the skill base the
entire industry needs, and so achieve industry-wide transformation
As more young people complete their education, the number entering the workforce is
rising while the demand for skilled workers in an increasingly globalised world is growing
Skills development programmes should engage with the informal sector and vulnerable
employees, to help them become more productive
Discussions held during focus group sessions showed the need to set up a curriculum
within the TVET college environment that provides bridging programmes for the
insurance industry. This will create a pool of qualified learners for recruiters
Chapter 3
There is a growing mismatch between the skills employers need and the talent available.
This applies both to technical skills and knowledge and to employees’ capacity to learn,
adapt, lead, think laterally and solve problems creatively.
There is a growing demand within the corporate environment for high-level
professionals
The continued pressure on South African economic growth is starting to affect local
insurers
Typical graduates take up to 18 months to become productive due to their lack of
workplace skills, and then are of limited use outside their area of specialty
Government policies must nurture entrepreneurial talent

58
Chapter 4
The InSETA entered into 13 work-based experience memoranda of agreements (MOAs)
At least 54% or higher of applicants must be female from all race groups. Priority must
be given to disabled persons from all race groups. The target for disability is 4% but
applicants in excess of this target will be welcomed. The race target is 85% Black
(African, Coloured and Indian), and 15% White
A project may lose its viability to continue because of insufficient candidate support. The partnership formed within the project is disrupted as a consequence, and may only resume once the conditions required for continuance of the project are attained.
Partnerships within the project team and with all key role players may become strained because of poor delivery of project deliverables. This may also occur when the memoranda of understanding are not properly monitored and when the prescribed progress reports are not submitted.
Strain within partnerships between institutions may happen when the one institution does not provide the prescribed documentation on time. This results in delays in payments for projects.
In Summary, INSETA is in a strong position to facilitate such skills plans, with levy income rising by R46 million, from R371 million for the 2014/15 financial year to R417 million for the 2015/16 financial year. INSETA funded project and grant expenditure for the year to the value of R362,8 million. INSETA’s skills bible is its sector skills plan (SSP), which it regularly updates to keep it abreast of trends such as those noted by PWC. During the year, the SSP was again brought up to date with, among other information, the latest scarce and critical skills findings that inform interventions and ensure their relevance to the needs of the market and the plans of the government. In implementing the plan, INSETA promotes the seven NSDS III developmental and transformational imperatives of race, class, gender, geography, age, disability and the HIV and Aids pandemic. The SETA also partners with various sub-sectors to focus on implementable interventions that address sustainability issues facing the sector, such as transformation, human capital development, risk management and the professionalisation of trustees and the sector as a whole. Insurance requires increasingly professional intermediate and high-level occupationally specific qualifications such as underwriter, claims assessor, risk manager, actuary, financial planner and compliance officer. These will meet the demands of a competitive and challenging market and enable it to cope with increasingly stringent regulatory demands. INSETA is committed to supporting the sector to achieve this raised level of qualifications by increasing access to occupationally directed programmes and to a range of qualifications that meet scarce and critical skills needs. INSETA also supports the transformation of the sector by providing qualifications such as wealth management through TVET colleges, which allow youngsters access to the industry.

59
Through career guidance initiatives, INSETA aims to attract youth and unemployed graduate talent to the sector. One of a number of catalytic interventions during this year under review was the continuation of our ground-breaking broker development programme launched towards the end of the previous financial year, which is helping to fill a pressing need in the marketplace. The programme was crafted to cultivate small to medium black brokerages so as to expand the supply and quality of scarce and high-priority skills, while enriching the industry and fostering transformation. Run in partnership with the Association for Savings and Investments South Africa (ASISA), the project delivered a 12-month development, training and mentorship programme. Concurrently, research was undertaken to gauge the feasibility of a shared-services model including classroom-based education that will ensure optimal, scalable and sustainable approaches to broker development in the future. This project has had real impact, as evidenced by a growth in revenue and profitability of the eight brokerages involved, as well as the formation of impactful partnerships of beneficiary brokerages. INSETA has also provided support for those who must comply with the ‘fit and proper’ requirements of the Financial and Advisory Intermediary Service (FAIS) Act. Discussions are in progress on anticipated legislation and will be looked at in terms of the SETA’s mandate with the sector and the Financial Services Board (FSB). A customised ‘captains of industry’ programme was run very successfully with a view to creating cutting-edge leadership attributes and management skills in the context of current industry drivers. The Board is particularly proud of the work that has been done during 2015/16 through the bursary programme in allocating life-changing resources to youngsters, particularly in no-fee schools. These schools are classified as quintiles one to three according to the poverty of the surrounding community and infrastructural factors. Of the 694 bursary beneficiaries to date, 372 have been from quintiles one to three: 94 from the poorest quintile, Q1; 120 from Q2 and 158 from Q3. There is tremendous human potential in our poorer and most under-resourced classrooms that would go untapped if not for programmes such as this, so this is truly putting resources where they are most needed.

60
Bibliography 10X Investments. 2016. What are the differences between a provident and a pension fund?
[Online]. Available at: https://www.10x.co.za/faq/umbrella-fund-faqs/what-are-the-differences-between-a-provident-and-a-pension-fund/ (accessed 14 April 2016).
Bates, E. 2015. Matric pass rates drop nationally. [Online]. Available at: http://www.enca.com/ south-africa/matric-pass-rate-drops-nationally (accessed 15 April 2016).
BusinessTech. 2015. South African salaries in 2015: what people earn. [Online]. Available at: http://businesstech.co.za/news/general/84863/south-african-salaries-in-2015-what-people-earn/ (accessed 15 April 2016).
BusinessTech.2016a. South African Economy in 2016 [Online]. Available at: http://businesstech.co.za/news/finance/114884/south-africa-gdp-grows-above-expectations/ (accessed 4 July 2016).
BusinessTech.2016b. South Africa GDP Growth Rate 2016 [Online]. Available at: http://www.tradingeconomics.com/south-africa/gdp-growth (accessed 4 July 2016)
BusinessTech.2016c. South Africa Projected Economic Growth to 2024 [Online]. Available at: http://businesstech.co.za/news/general/109577/this-map-shows-south-africas-projected-economic-growth-to-2024/ (accessed 4 July 2016)
Career Junction. 2016. [Website]. Available at: https://www.careerjunction.co.za. Deacon and Associates. 2014. Status of skills in the insurance industry. Department of Education. 2009. Human Resource Development Strategy for South Africa
(HRDSA) 2010–2030. Pretoria: Department of Education. Department of Higher Education and Training (DHET). 2015a. Statistics on post-school education
and training in South Africa: 2013. Pretoria: DHET. Department of Higher Education and Training (DHET). 2015b. Guidelines on the implementation
of SETA Grant Regulations. Pretoria: DHET. Department of Higher Education and Training (DHET). 2013. Management Information System
(HEMIS) database Economic Development Department. 2011a. National Skills Accord. [Online]. Available at:
http://www.economic.gov.za/communications/publications/national-skills-accord (accessed 18 April 2016).
Economic Development Department. 2011b. New Growth Path: Framework. [Online]. Available at: http://www.economic.gov.za/communications/51-publications/151-the-new-growth-path-framework (accessed 18 April 2016).
FA News. 2016 Tough road ahead for SA consumers implies weak GDP performance. ( Pakirisamy and van Papendorp, 2016)
http://www.fanews.co.za/article/economy/43/general/1198/tough-road-ahead-for-sa-consumers-implies-weak-gdp-performance/20323 ( Accessed 4 July 2016)
Harper, D. 2015. iTOO sponsors new learning centre for Insurance Institute of SA. [Online]. Available at: http://www.fanews.co.za/article/training-learnerships/42 (accessed 18 April 2016).
InSETA. 2013a. Insider, November. Johannesburg: InSETA. InSETA. 2013b. Insider, August. Johannesburg: InSETA. InSETA. 2014a. Annual Performance Plan September 2014 Version 10. Johannesburg: InSETA.

61
InSETA. 2014b. Sector Skills Plan 30 September 2014. Johannesburg: InSETA. InSETA. 2014c. Strategic Plan August 2014 Version 6. Johannesurg: InSETA. InSETA. 2014d. Insider, January. Johannesurg: InSETA. InSETA. 2014e. Insider, February. Johannesurg: InSETA. InSETA. 2014f. Insider, March 2014. Johannesurg: InSETA. InSETA. 2014g. Insider, April. Johannesurg: InSETA. InSETA. 2014h. Insider, June. Johannesurg: InSETA. InSETA. 2014i. Insider, July. Johannesurg: InSETA. InSETA. 2014j. Strategic Plan Final August 2014 Version 6. Johannesurg: InSETA. InSETA. 2014k. A career in insurance? Yep it’s for people like you. Johannesurg: InSETA. InSETA. 2014l. Annual Report 2013/14. Johannesurg: InSETA. InSETA. 2015a. Project Management Information, April. Johannesurg: InSETA. InSETA. 2015b. Project Management Information, June. Johannesurg: InSETA. InSETA. 2015c. Insider. Johannesurg: InSETA. InSETA. 2015d. Insider, June. Johannesurg: InSETA. InSETA. 2015. Workplace Skills Plan and Annual Training Report data Institute of Risk Management South Africa (IRMSA). 2015. Risk Report South African Risks. 1st
edition. Insurance Fundi. 2016. Short- or long-term insurance – who cares? [Online] Available at:
http://www.insurancefundi.co.za/short-long-term-insurance-whats-the-difference
(accessed 14 April 2016). Investopedia. 2016. What is ‘reinsurance’? [Online]. Available at: www.investopedia.com/
terms/r/reinsurance.asp (accessed 14 April 2016). Kaplan, E. 2015. 10 questions submitted to the SETA Support Directorate at the Department of
Higher Education and Training. Pretoria: DHET. KPMG. 2012. Insurance industry outlook survey. [Online] Available from:
http://www.kpmg.com/US/en/IssuesAndInsights/ArticlesPublications/Documents/2012-insurance-outlook-survey.pdf (accessed 19 April 2016).
Naidoo, N. 2016. InSETA Discretionary Grant Policy and Guidelines 2015/2016. Johannesburg: InSETA.
National Planning Commission. 2012. National Development Plan 2030. Our Future – make it work. [Online]. Available at: http://www.poa.gov.za/news/Documents/ NPC%20National%20Development%20Plan%20Vision%202030%20-lo-res.pdf (accessed 19 April 2016).
Nienaber, PM and Preiss, J. Office of the Ombudsman for long-term insurance. Perception of funeral insurance. [Online]. Available at: file:///C:/Users/ernestk/Downloads/ funeralinsurance.pdf.
Price Waterhouse Coopers (PwC). 2014a. Opportunity knocks. Insurance industry analysis. Price Waterhouse Coopers (PwC). 2014b. Opportunity knocks. Insurance industry analysis. Price Waterhouse Coopers (PwC). 2014c. Strategic and emerging trends in insurance markets in
South Africa, Kenya and Nigeria – Part 1 South Africa. Price Waterhouse Coopers (PwC). 2015. Insuring African Growth Insurance Industry Analysis.
[Online]. Available at: https://www.pwc.co.za/en/assets/pdf/insurance-industry-analysis-2015.pdf (accessed 14 April 2016).

62
Price Waterhouse Coopers (PwC). 2016. Risk management and regulatory compliance. [Online]. Available at: http://www.pwc.co.za/en/risk-management-and-regulatory-compliance/index.jhtml (accessed 14 April 2016).
RandMark 40. 2016. Types of insurance. [Online]. Available at: http://www.randmark40.com/ index.php?option=com_content&view=article&id=34&Itemid=57 (accessed 14 April 2016).
Republic of South Africa. 2014. List of occupations in high demand. No. 38174. Government Gazette. [Online]. Available at: http://www.careerhelp.org.za/download_files/education-training/ List_of_occupations_in_high_demand_2014.pdf (accessed 19 April 2016).
Standard Bank South Africa. 2016. Unit trust. [Online]. Available at: http://www.standardbank.co.za/standardbank/Personal/Investing/Unit-trusts (accessed 14 April 2016). Statistics South Africa Statistical release P0441 Gross domestic product Fourth quarter 2015 The Economic Times. 2016. Definition of ‘reinsurance’. [Online]. Available at:
economictimes.indiatimes.com/definition/reinsurance (accessed 14 April 2016). The Free Dictionary. 2016. Medical dictionary. [Online]. Available at: http://medical-
dictionary.thefreedictionary.com/Health+benefits (accessed 14 April 2016). Kongolo, M. (2010). Job creation versus job shedding and the role of SMEs in economic
development. African Journal of Business Management.
Kesper, A. (2001). Failing or not aiming to grow? Manufacturing SMMEs and their contribution
to employment growth in South Africa. Urban Forum, 12 (2):171-330.
Egan, V. (2009). Environmental constraints on small enterprises in Tanzania: a case study of the
retail, electrical, retail clothing and travel industries in Dar Es Salaam. Repositioning African
Business and Development for the 21st Century, Simon Sigué.
Ladzani, W. and Netswera, G. (2009). Support for rural small businesses in Limpopo Province,
South Africa. Development Southern Africa.
(Statistics South Africa, 2016 - http://www.fin24.com/Economy/sa-shed-15-000-jobs-in-first-three-months-of-2016-stats-sa-20160704 )