Embed Size (px)
Citation preview

1African Development Bank Group
DEVELOPMENY RESEARCH DEPARTMENT
PRESENTATION AT AERC SENIOR SEMINAR ADDIS ABABA9-10 April 2014
ILLICIT FINANCIAL FLOWS AND THE PROBLEM OF NET RESOURCE TRANSFERS FROM AFRICA (1980 – 2009)

2
Outline of the Presentation
Context Setting
Data and key definitions
Key Results
Policy Recommendations
3
Context Setting
• Africa could finance bulk of its development needs from own resources.
• Decline of external financing expected to continue.
• Significant financial outflows, both recorded and unrecorded, continue to make domestic financing seriously inadequate.
• Growing demand for more transparent processes for resource rents.
4
Data and key definitions
• Use IMF and World Bank Data as inputs in models
• Data availability dictates choice of time period
• Illicit financial flows estimated using World Bank Residual measure adjusted for trade misinvoicing

5
Data and key definitions
• NRT = Net Resource Transfers• NRecT = Net Recorded Transfers (Broad and narrow)• IFF = Illicit Financial Flows
– Normalized = Conservative or lower estimates– Nonnormalized = Robust or higher estimates
NRT = NRecT – IFF
4 resulting measures of NRT

6
Key Result – regardless of measure, Africa was net creditor to the world
7
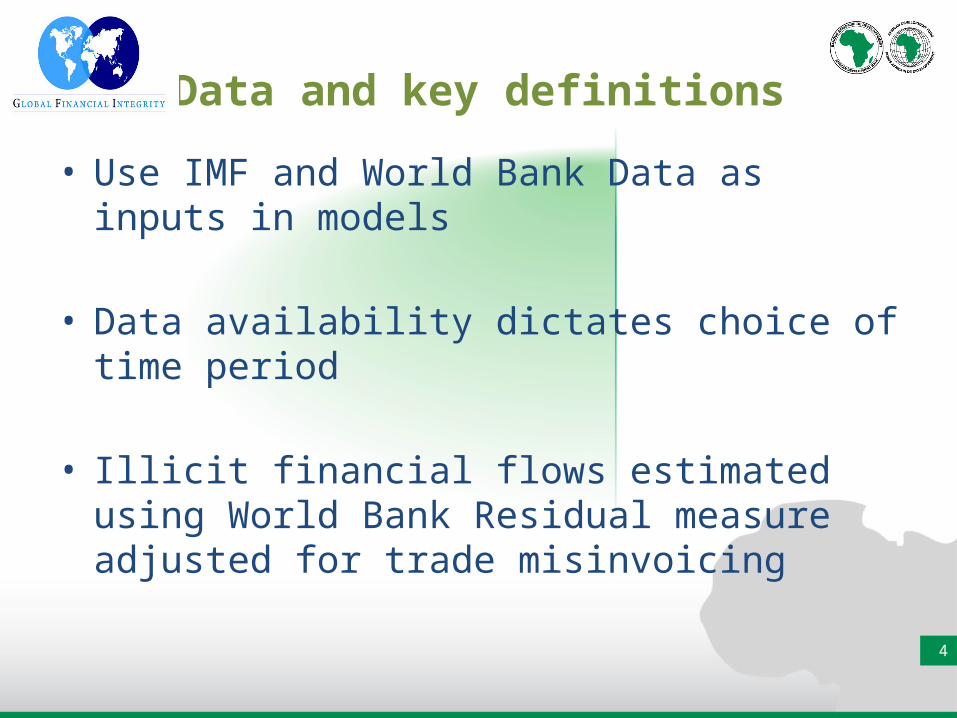
Key Results – Illicit financial flows main driver behind net drain on Africa

8
Key Results – Illicit financial flows varied by region
Cumulative Normalized IFFs (in millions of 2005 U.S dollars)
Region 1980s 1990s 2000s 1980-2009
Africa 361,621 298,155 555,279 1,215,055
North Africa 113, 397 105,567 149,908 368,873
Sub-Saharan 248,224 192,587 405,371 846,183
Horn of Africa 8,745 3,308 11,987 24,040
Great Lakes 14,244 5,702 13,091 33,037
Southern 106,805 86,501 136,713 330,019
West and Central 118,430 97,076 243,580 459,086

9
Key Results – Fuel exporters highest Illicit Financial flows (as single category)
Region 1980s 1990s 2000s 1980-2009 Fuel 92,889 117,484 284,811 495,184Non-fuel 34,275 27,970 28,499 90,744Others 234,457 152,701 241,970 629,127Total 361,621 298,155 555,279 1,215,055
HPIC 112,179 69,453 119,897 301,529
Cumulative Normalized IFFs
(in millions of 2005 U.S dollars)

10
Summary of Main results - IFFs
• Illicit financial flows (IFFs) were the main driving force behind the net drain of resources from Africa.
• Africa lost about USD 1.2 -1.3 trillion in real terms over the 30 year period, 1980-2009.
• Outflows dominated by outflows from SSA led by West and Central Africa.
• Fuel exporters dominated outflows.

11
Policy Recommendations 1
1. Restricting absorption of illicit financial
– Promotion of transparency in the financial system
– Automatic exchange of information

12
Policy Recommendations - 2
2. Curtailing the illicit financial outflows from Africa
– Resource-rich countries
– Resource-poor countries

13
Policy Recommendations -3
3. Policies to boost net recorded transfers by improving the business climate
– Strengthen rule of law and other aspects of governance to improve the business climate.
– Business-friendly measures to improve infrastructure and corporate taxation and governance.

14
For further information please contact Jennifer Mbabazi Moyo ([email protected])
Dev Kar ([email protected]) or Sarah Freitas([email protected])
THANK YOU