Embed Size (px)
Citation preview
AERC Explaining African Economic Growth Project
Revised Collins/Bosworth Growth Accounting Decompositions
March 2003
Benno J. Ndulu* and Stephen A. O’Connell**
We provide revised growth accounting decompositions based on new data series provided by S. Collins and B. Bosworth, for the period 1960-2000. The enclosed tables replace Tables 4.1 – 4.3, pages 26-37, in Ndulu and O’Connell (2000), “Background Information on Economic Growth.” We also briefly discuss new empirical work that addresses some important shortcomings in the empirical literature on human capital and economic growth. *Lead Economist, World Bank Resident Mission, Dar es Salaam and Research Associate, CSAE. **Professor of Economics, Swarthmore College, and Research Associate, CSAE.
We are grateful to Susan Collins for access to the data.
4.(revised) Collins-Bosworth growth accounting decompositions. The following tables provide revised data corresponding to section 4 of B. Ndulu and S. O’Connell “Background Information on Economic Growth,” April 2000. See Collins and Bosworth (1996) for details of the growth accounting methodology, which is also described briefly in O’Connell and Ndulu (2000), “Africa’s Growth Experience: A Focus on Sources of Growth.” The O’Connell and Ndulu papers can be accessed from O’Connell’s web page:
http://www.swarthmore.edu/SocSci/soconne1/aercgrth.html Recall that the growth decomposition is based on an aggregate production function of the form (1) ,)( 65.035.0 hLAKY ⋅= where Y is real GDP, A is total factor productivity, K is the physical capital stock, L is the labor force, and h is an index of labor quality (human capital per worker). In per-worker terms this is (2) 65.035.0 hAky = where is real GDP per worker and LYy /≡ LKk /≡ is the physical capital stock per worker. Taking logs, we obtain an exact decomposition of growth in real GDP per worker (bgn) into the contributions of physical capital per worker (bck), human capital per worker (bch), and the residual (bcr):
(3)
.)]1(ln)([ln65.0
)]1(ln)([ln*35.0)1(ln)(ln)1(ln)(ln)(
bchbckbcrthth
tktktAtAtytytbgn
++=−−+−−+
−−=−−=
Tables 4.2 and 4.3 show the decomposition by halfdecade, for five regions (Table 4.2) and for individual countries in Sub-Saharan Africa (Table 4.3). For countries included in the latter table, each country teams will receive an individual spreadsheets containing the annual data for their country. 4.1 Notes on the new data The new Collins/Bosworth growth accounting sample consists of 84 countries instead of 88. The table directly below shows the changes in coverage and regional composition relative to the original sample of 88 countries.
Revised colbos tables.doc / 04/03/03 1
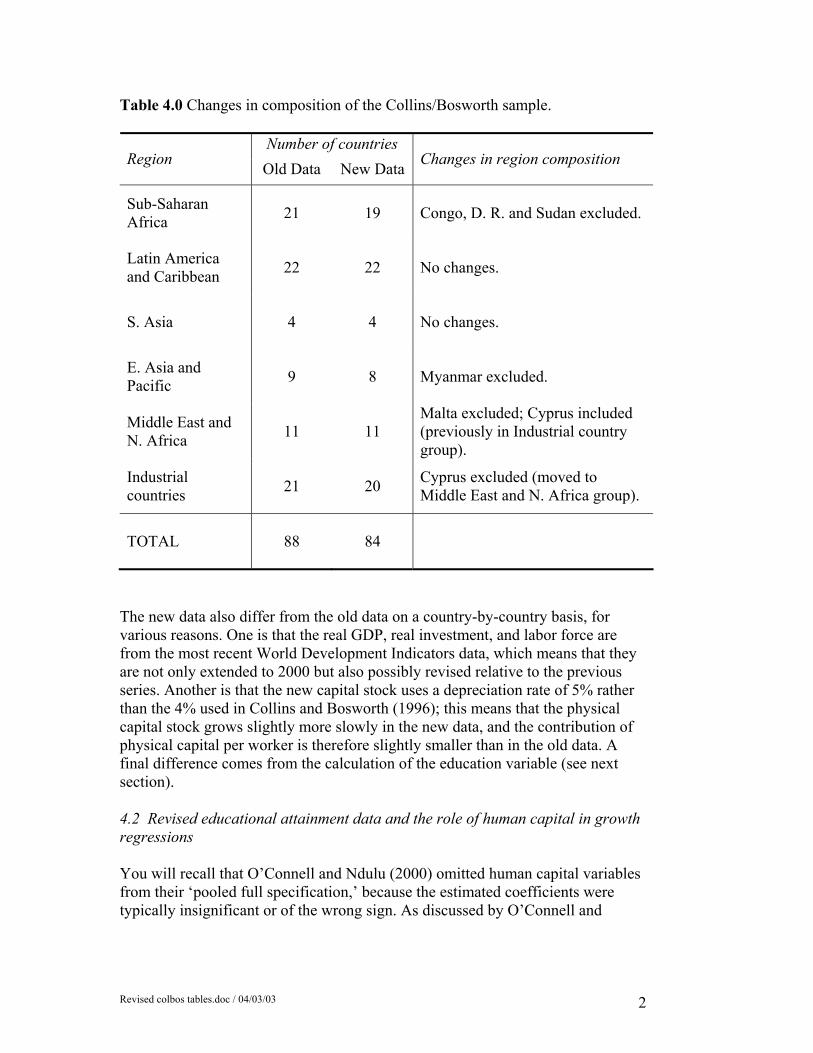
Table 4.0 Changes in composition of the Collins/Bosworth sample.
Number of countries Region Old Data New Data Changes in region composition
Sub-Saharan Africa 21 19 Congo, D. R. and Sudan excluded.
Latin America and Caribbean 22 22 No changes.
S. Asia 4 4 No changes.
E. Asia and Pacific 9 8 Myanmar excluded.
Middle East and N. Africa 11 11
Malta excluded; Cyprus included (previously in Industrial country group).
Industrial countries 21 20 Cyprus excluded (moved to
Middle East and N. Africa group).
TOTAL 88 84
The new data also differ from the old data on a country-by-country basis, for various reasons. One is that the real GDP, real investment, and labor force are from the most recent World Development Indicators data, which means that they are not only extended to 2000 but also possibly revised relative to the previous series. Another is that the new capital stock uses a depreciation rate of 5% rather than the 4% used in Collins and Bosworth (1996); this means that the physical capital stock grows slightly more slowly in the new data, and the contribution of physical capital per worker is therefore slightly smaller than in the old data. A final difference comes from the calculation of the education variable (see next section). 4.2 Revised educational attainment data and the role of human capital in growth regressions You will recall that O’Connell and Ndulu (2000) omitted human capital variables from their ‘pooled full specification,’ because the estimated coefficients were typically insignificant or of the wrong sign. As discussed by O’Connell and
Revised colbos tables.doc / 04/03/03 2
Soludo in their July 2001 memo to case study teams1, weak performance of human capital variables has been a general problem in the growth literature, particularly when high-frequency data are used (e.g., annual data or halfdecade averages). Cohen and Soto (2001) have since developed a new dataset on educational attainment that they claim is less affected by measurement error than the widely-used Barro-Lee (1993) dataset. Cohen and Soto (2001) and Soto (2002) use these data in panel growth regressions (using 10-year averages) and find that a careful treatment of collinearity and endogeneity allows one to recover statistically significant, correctly-signed, and empirically plausible effects of human capital investment on growth. They estimate a direct return to schooling of 7-10 percent, which is very close to the roughly 10 percent that is characteristic of the microeconomic literature. They conclude from this that externalities to schooling – which would raise the ‘social’ or economy-wide return to schooling above the private, microeconomic return – do not appear to be present. However, they show that if one calculates the full or “long-run” effect of an increase in educational attainment as the effect that would prevail if the ratio of physical capital to GDP were allowed to return to its original value following an increase in human capital – a calculation that therefore adds an indirect effect via additional accumulation of physical capital – then one gets a long-run impact of education on income that is somewhat larger, on the order of 12-16 percent for each additional average year of education. As described in Collins and Bosworth (1996), the Collins/Bosworth growth accounting decomposition uses a human capital variable that is constructed by applying a 7% return to years of educational attainment. The 1996 calculations used the Barro-Lee (1993) data on educational attainment. The new calculations use an average of the revised Barro-Lee data (Barro and Lee (2000)) and the new Cohen and Soto (2001) data, where possible. Using the average is appealing, because as long as the two series are unbiased and the correlation between their measurement errors is not too high and positive, the average of the two series should have smaller measurement error than either series taken alone.
1 Available on the website given in section 1 above.
Revised colbos tables.doc / 04/03/03 3
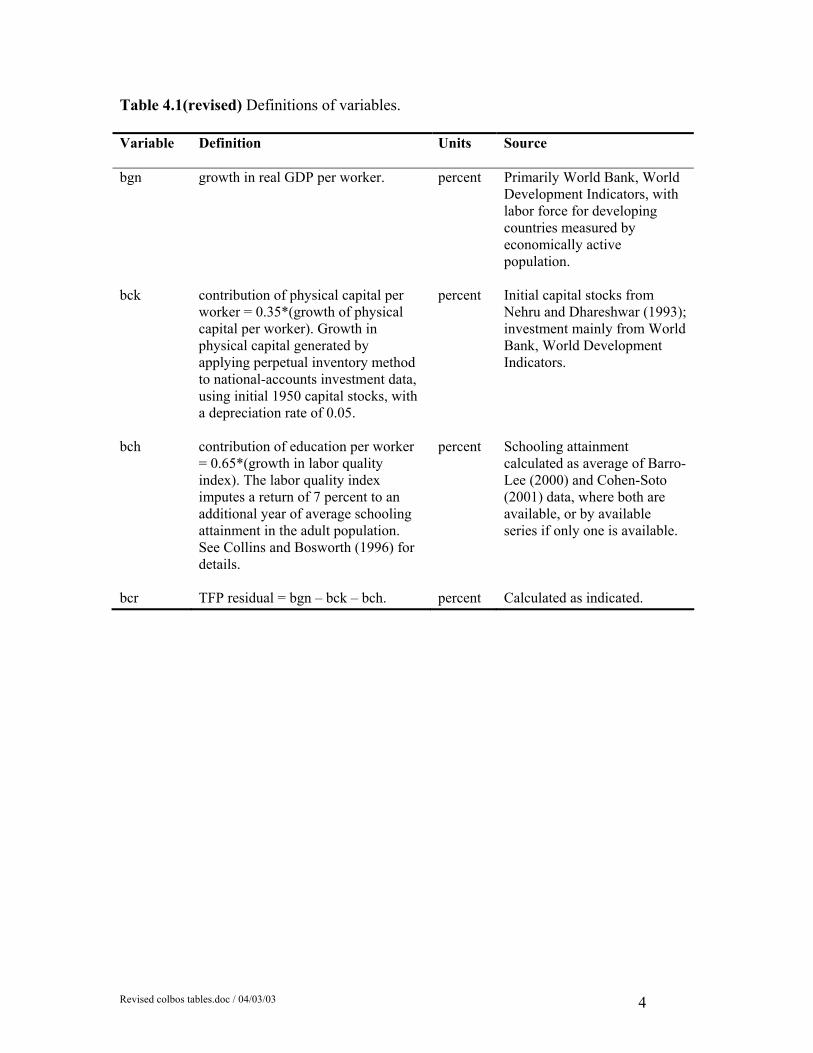
Table 4.1(revised) Definitions of variables. Variable
Definition Units Source
bgn growth in real GDP per worker.
percent Primarily World Bank, World Development Indicators, with labor force for developing countries measured by economically active population.
bck contribution of physical capital per worker = 0.35*(growth of physical capital per worker). Growth in physical capital generated by applying perpetual inventory method to national-accounts investment data, using initial 1950 capital stocks, with a depreciation rate of 0.05.
percent Initial capital stocks from Nehru and Dhareshwar (1993); investment mainly from World Bank, World Development Indicators.
bch contribution of education per worker = 0.65*(growth in labor quality index). The labor quality index imputes a return of 7 percent to an additional year of average schooling attainment in the adult population. See Collins and Bosworth (1996) for details.
percent Schooling attainment calculated as average of Barro-Lee (2000) and Cohen-Soto (2001) data, where both are available, or by available series if only one is available.
bcr TFP residual = bgn – bck – bch. percent Calculated as indicated.
Revised colbos tables.doc / 04/03/03 4
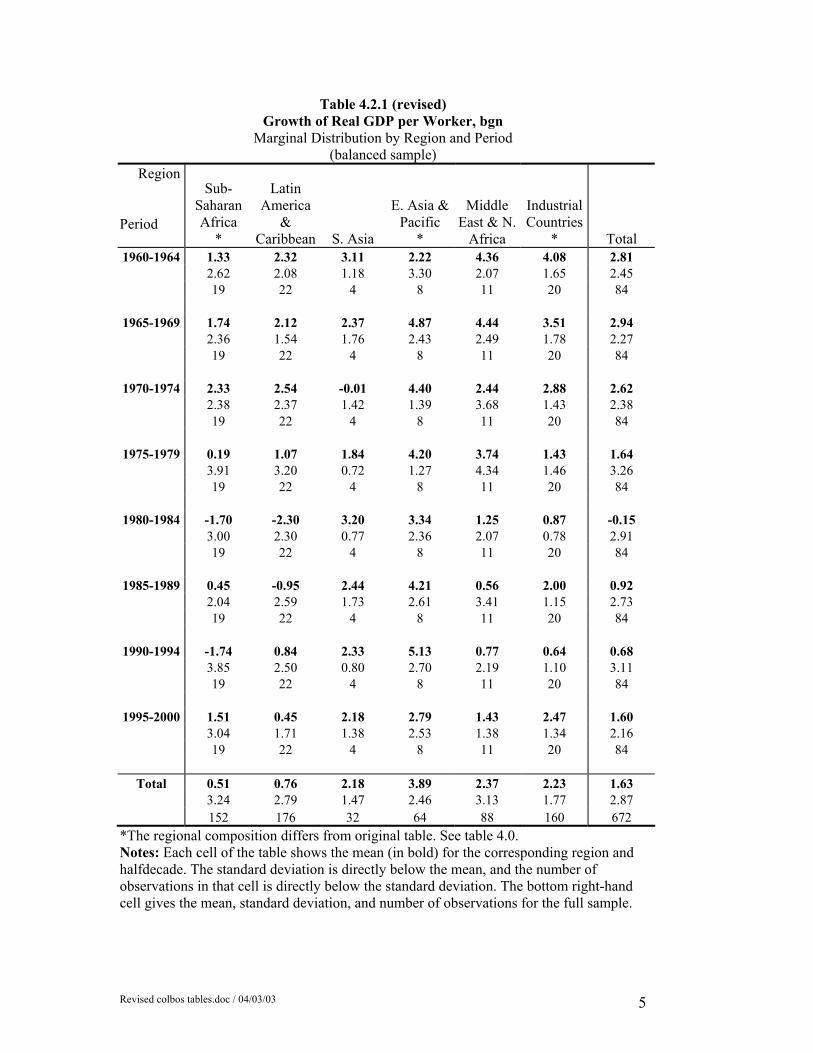
Table 4.2.1 (revised) Growth of Real GDP per Worker, bgn
Marginal Distribution by Region and Period (balanced sample)
Region Period
Sub- Saharan Africa
*
Latin America
& Caribbean S. Asia
E. Asia &Pacific
*
Middle East & N.
Africa
Industrial Countries
* Total 1960-1964 1.33 2.32 3.11 2.22 4.36 4.08 2.81
2.62 2.08 1.18 3.30 2.07 1.65 2.45 19 22 4 8 11 20 84
1965-1969 1.74 2.12 2.37 4.87 4.44 3.51 2.94 2.36 1.54 1.76 2.43 2.49 1.78 2.27 19 22 4 8 11 20 84
1970-1974 2.33 2.54 -0.01 4.40 2.44 2.88 2.62 2.38 2.37 1.42 1.39 3.68 1.43 2.38 19 22 4 8 11 20 84
1975-1979 0.19 1.07 1.84 4.20 3.74 1.43 1.64 3.91 3.20 0.72 1.27 4.34 1.46 3.26 19 22 4 8 11 20 84
1980-1984 -1.70 -2.30 3.20 3.34 1.25 0.87 -0.15 3.00 2.30 0.77 2.36 2.07 0.78 2.91 19 22 4 8 11 20 84
1985-1989 0.45 -0.95 2.44 4.21 0.56 2.00 0.92 2.04 2.59 1.73 2.61 3.41 1.15 2.73 19 22 4 8 11 20 84
1990-1994 -1.74 0.84 2.33 5.13 0.77 0.64 0.68 3.85 2.50 0.80 2.70 2.19 1.10 3.11 19 22 4 8 11 20 84
1995-2000 1.51 0.45 2.18 2.79 1.43 2.47 1.60 3.04 1.71 1.38 2.53 1.38 1.34 2.16 19 22 4 8 11 20 84
Total 0.51 0.76 2.18 3.89 2.37 2.23 1.63 3.24 2.79 1.47 2.46 3.13 1.77 2.87 152 176 32 64 88 160 672
*The regional composition differs from original table. See table 4.0. Notes: Each cell of the table shows the mean (in bold) for the corresponding region and halfdecade. The standard deviation is directly below the mean, and the number of observations in that cell is directly below the standard deviation. The bottom right-hand cell gives the mean, standard deviation, and number of observations for the full sample.
Revised colbos tables.doc / 04/03/03 5
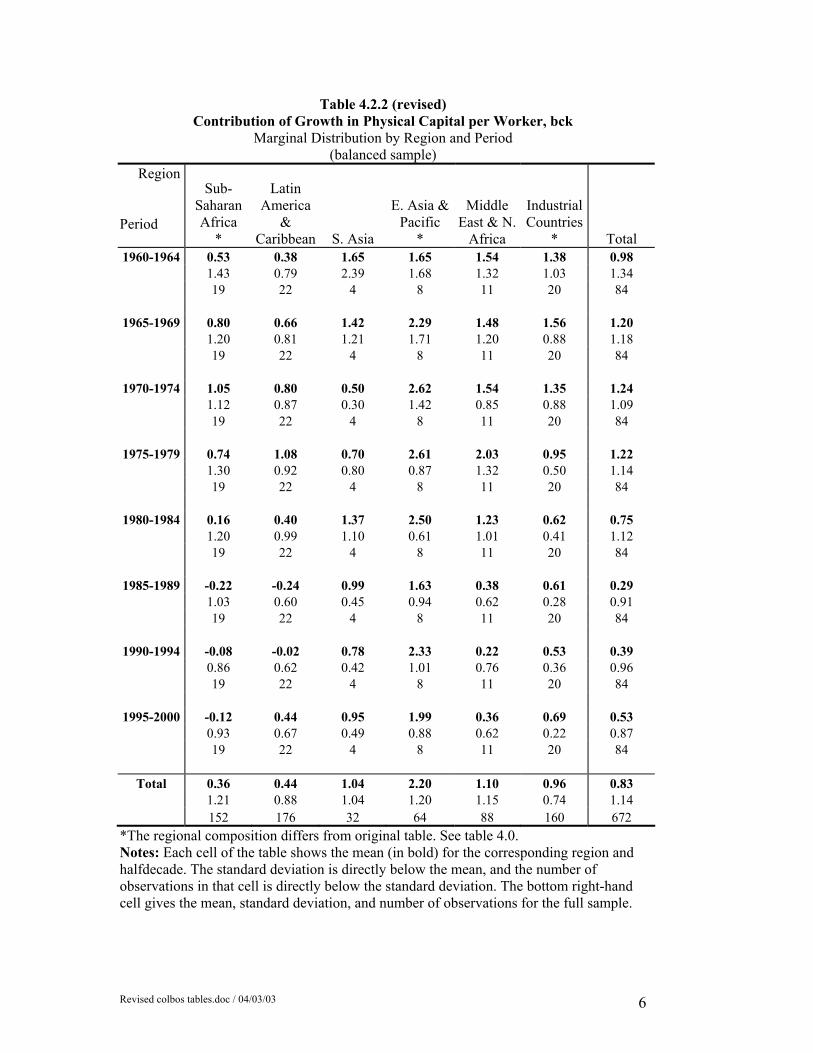
Table 4.2.2 (revised) Contribution of Growth in Physical Capital per Worker, bck
Marginal Distribution by Region and Period (balanced sample)
Region Period
Sub- Saharan Africa
*
Latin America
& Caribbean S. Asia
E. Asia &Pacific
*
Middle East & N.
Africa
Industrial Countries
* Total 1960-1964 0.53 0.38 1.65 1.65 1.54 1.38 0.98
1.43 0.79 2.39 1.68 1.32 1.03 1.34 19 22 4 8 11 20 84
1965-1969 0.80 0.66 1.42 2.29 1.48 1.56 1.20 1.20 0.81 1.21 1.71 1.20 0.88 1.18 19 22 4 8 11 20 84
1970-1974 1.05 0.80 0.50 2.62 1.54 1.35 1.24 1.12 0.87 0.30 1.42 0.85 0.88 1.09 19 22 4 8 11 20 84
1975-1979 0.74 1.08 0.70 2.61 2.03 0.95 1.22 1.30 0.92 0.80 0.87 1.32 0.50 1.14 19 22 4 8 11 20 84
1980-1984 0.16 0.40 1.37 2.50 1.23 0.62 0.75 1.20 0.99 1.10 0.61 1.01 0.41 1.12 19 22 4 8 11 20 84
1985-1989 -0.22 -0.24 0.99 1.63 0.38 0.61 0.29 1.03 0.60 0.45 0.94 0.62 0.28 0.91 19 22 4 8 11 20 84
1990-1994 -0.08 -0.02 0.78 2.33 0.22 0.53 0.39 0.86 0.62 0.42 1.01 0.76 0.36 0.96 19 22 4 8 11 20 84
1995-2000 -0.12 0.44 0.95 1.99 0.36 0.69 0.53 0.93 0.67 0.49 0.88 0.62 0.22 0.87 19 22 4 8 11 20 84
Total 0.36 0.44 1.04 2.20 1.10 0.96 0.83 1.21 0.88 1.04 1.20 1.15 0.74 1.14 152 176 32 64 88 160 672
*The regional composition differs from original table. See table 4.0. Notes: Each cell of the table shows the mean (in bold) for the corresponding region and halfdecade. The standard deviation is directly below the mean, and the number of observations in that cell is directly below the standard deviation. The bottom right-hand cell gives the mean, standard deviation, and number of observations for the full sample.
Revised colbos tables.doc / 04/03/03 6
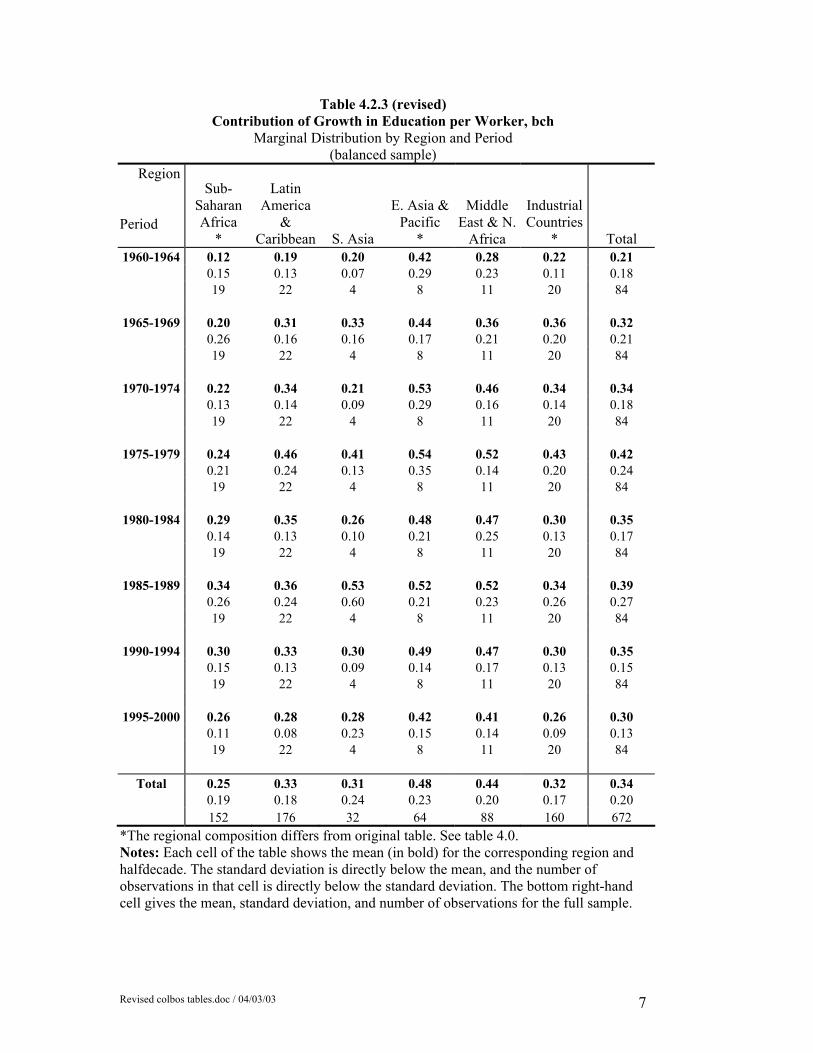
Table 4.2.3 (revised) Contribution of Growth in Education per Worker, bch
Marginal Distribution by Region and Period (balanced sample)
Region Period
Sub- Saharan Africa
*
Latin America
& Caribbean S. Asia
E. Asia &Pacific
*
Middle East & N.
Africa
Industrial Countries
* Total 1960-1964 0.12 0.19 0.20 0.42 0.28 0.22 0.21
0.15 0.13 0.07 0.29 0.23 0.11 0.18 19 22 4 8 11 20 84
1965-1969 0.20 0.31 0.33 0.44 0.36 0.36 0.32 0.26 0.16 0.16 0.17 0.21 0.20 0.21 19 22 4 8 11 20 84
1970-1974 0.22 0.34 0.21 0.53 0.46 0.34 0.34 0.13 0.14 0.09 0.29 0.16 0.14 0.18 19 22 4 8 11 20 84
1975-1979 0.24 0.46 0.41 0.54 0.52 0.43 0.42 0.21 0.24 0.13 0.35 0.14 0.20 0.24 19 22 4 8 11 20 84
1980-1984 0.29 0.35 0.26 0.48 0.47 0.30 0.35 0.14 0.13 0.10 0.21 0.25 0.13 0.17 19 22 4 8 11 20 84
1985-1989 0.34 0.36 0.53 0.52 0.52 0.34 0.39 0.26 0.24 0.60 0.21 0.23 0.26 0.27 19 22 4 8 11 20 84
1990-1994 0.30 0.33 0.30 0.49 0.47 0.30 0.35 0.15 0.13 0.09 0.14 0.17 0.13 0.15 19 22 4 8 11 20 84
1995-2000 0.26 0.28 0.28 0.42 0.41 0.26 0.30 0.11 0.08 0.23 0.15 0.14 0.09 0.13 19 22 4 8 11 20 84
Total 0.25 0.33 0.31 0.48 0.44 0.32 0.34 0.19 0.18 0.24 0.23 0.20 0.17 0.20 152 176 32 64 88 160 672
*The regional composition differs from original table. See table 4.0. Notes: Each cell of the table shows the mean (in bold) for the corresponding region and halfdecade. The standard deviation is directly below the mean, and the number of observations in that cell is directly below the standard deviation. The bottom right-hand cell gives the mean, standard deviation, and number of observations for the full sample.
Revised colbos tables.doc / 04/03/03 7
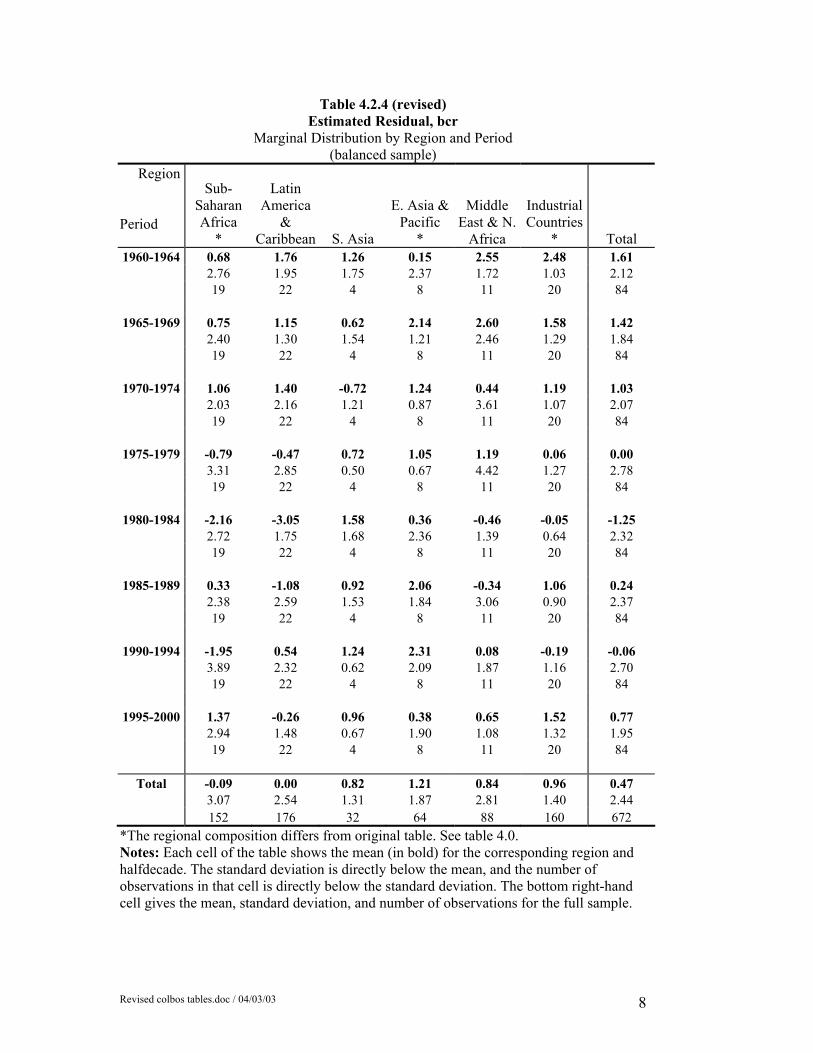
Table 4.2.4 (revised) Estimated Residual, bcr
Marginal Distribution by Region and Period (balanced sample)
Region Period
Sub- Saharan Africa
*
Latin America
& Caribbean S. Asia
E. Asia &Pacific
*
Middle East & N.
Africa
Industrial Countries
* Total 1960-1964 0.68 1.76 1.26 0.15 2.55 2.48 1.61
2.76 1.95 1.75 2.37 1.72 1.03 2.12 19 22 4 8 11 20 84
1965-1969 0.75 1.15 0.62 2.14 2.60 1.58 1.42 2.40 1.30 1.54 1.21 2.46 1.29 1.84 19 22 4 8 11 20 84
1970-1974 1.06 1.40 -0.72 1.24 0.44 1.19 1.03 2.03 2.16 1.21 0.87 3.61 1.07 2.07 19 22 4 8 11 20 84
1975-1979 -0.79 -0.47 0.72 1.05 1.19 0.06 0.00 3.31 2.85 0.50 0.67 4.42 1.27 2.78 19 22 4 8 11 20 84
1980-1984 -2.16 -3.05 1.58 0.36 -0.46 -0.05 -1.25 2.72 1.75 1.68 2.36 1.39 0.64 2.32 19 22 4 8 11 20 84
1985-1989 0.33 -1.08 0.92 2.06 -0.34 1.06 0.24 2.38 2.59 1.53 1.84 3.06 0.90 2.37 19 22 4 8 11 20 84
1990-1994 -1.95 0.54 1.24 2.31 0.08 -0.19 -0.06 3.89 2.32 0.62 2.09 1.87 1.16 2.70 19 22 4 8 11 20 84
1995-2000 1.37 -0.26 0.96 0.38 0.65 1.52 0.77 2.94 1.48 0.67 1.90 1.08 1.32 1.95 19 22 4 8 11 20 84
Total -0.09 0.00 0.82 1.21 0.84 0.96 0.47 3.07 2.54 1.31 1.87 2.81 1.40 2.44 152 176 32 64 88 160 672
*The regional composition differs from original table. See table 4.0. Notes: Each cell of the table shows the mean (in bold) for the corresponding region and halfdecade. The standard deviation is directly below the mean, and the number of observations in that cell is directly below the standard deviation. The bottom right-hand cell gives the mean, standard deviation, and number of observations for the full sample.
Revised colbos tables.doc / 04/03/03 8
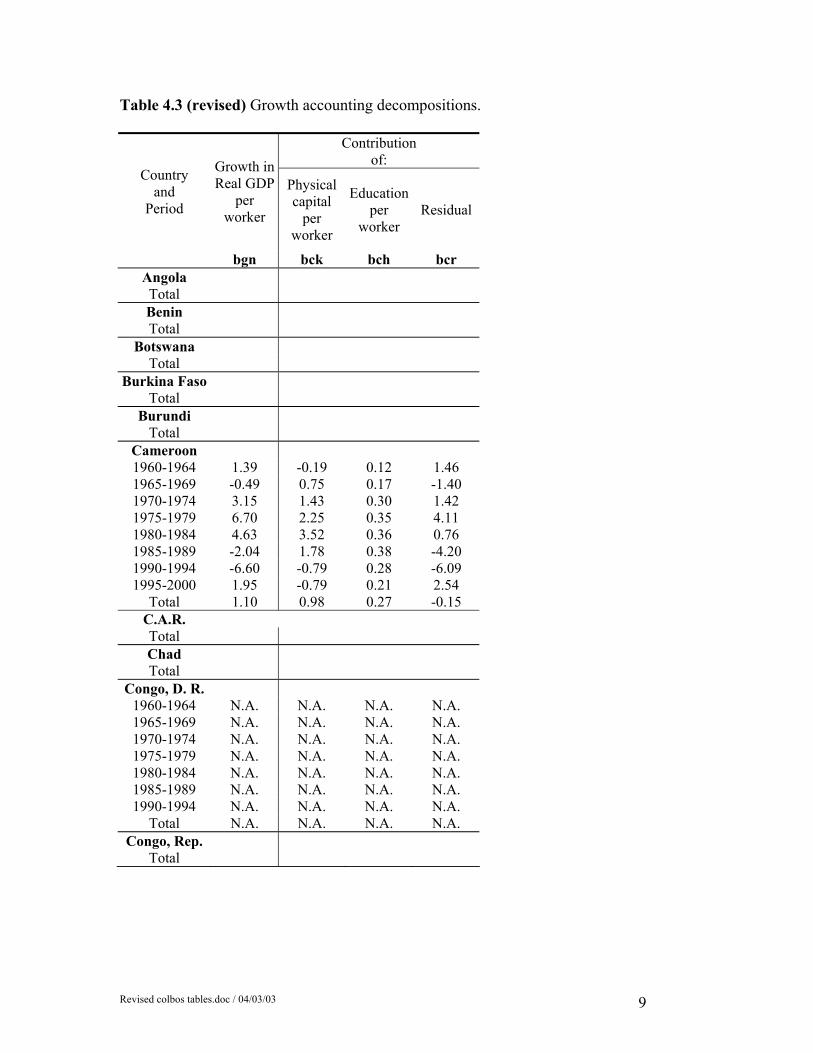
Table 4.3 (revised) Growth accounting decompositions.
Contribution of:
Country and
Period
Growth in Real GDP
per worker
Physical capital
per worker
Educationper
worker Residual
bgn bck bch bcr Angola Total Benin Total
Botswana Total
Burkina Faso Total
Burundi Total
Cameroon 1960-1964 1.39 -0.19 0.12 1.46 1965-1969 -0.49 0.75 0.17 -1.40 1970-1974 3.15 1.43 0.30 1.42 1975-1979 6.70 2.25 0.35 4.11 1980-1984 4.63 3.52 0.36 0.76 1985-1989 -2.04 1.78 0.38 -4.20 1990-1994 -6.60 -0.79 0.28 -6.09 1995-2000 1.95 -0.79 0.21 2.54
Total 1.10 0.98 0.27 -0.15 C.A.R. Total Chad Total
Congo, D. R. 1960-1964 N.A. N.A. N.A. N.A. 1965-1969 N.A. N.A. N.A. N.A. 1970-1974 N.A. N.A. N.A. N.A. 1975-1979 N.A. N.A. N.A. N.A. 1980-1984 N.A. N.A. N.A. N.A. 1985-1989 N.A. N.A. N.A. N.A. 1990-1994 N.A. N.A. N.A. N.A.
Total N.A. N.A. N.A. N.A. Congo, Rep.
Total
Revised colbos tables.doc / 04/03/03 9
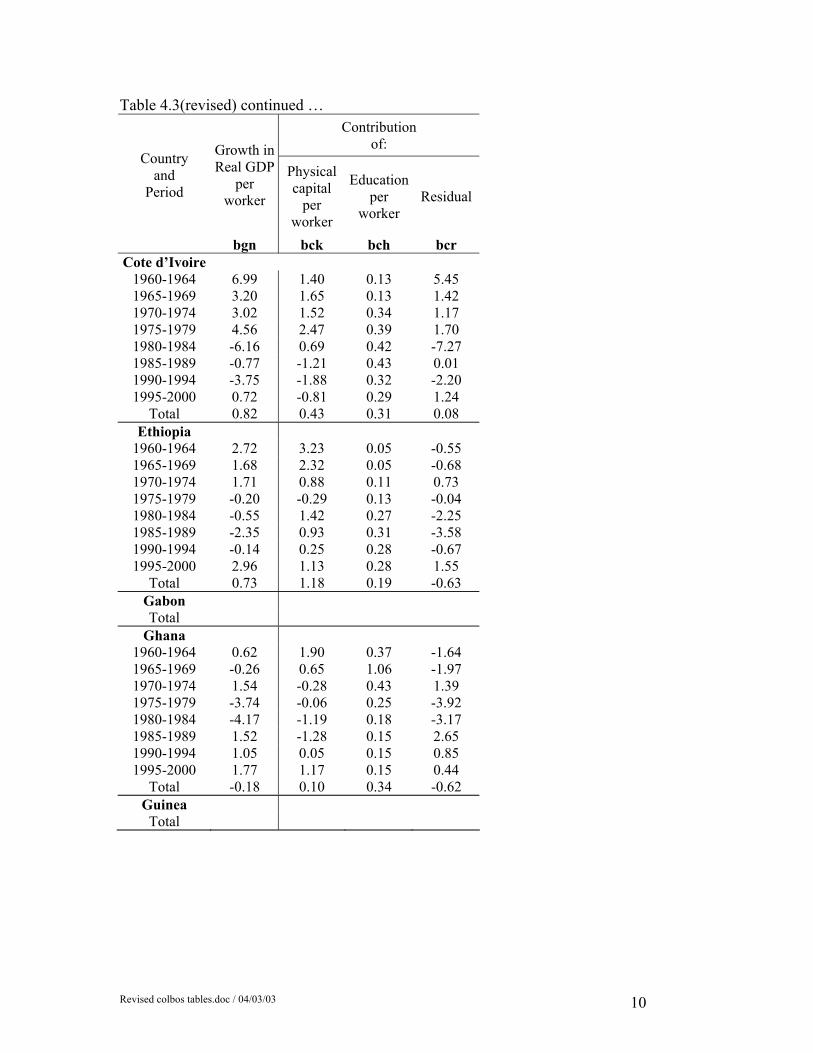
Table 4.3(revised) continued … Contribution
of: Country
and Period
Growth in Real GDP
per worker
Physical capital
per worker
Education per
worker Residual
bgn bck bch bcr Cote d’Ivoire
1960-1964 6.99 1.40 0.13 5.45 1965-1969 3.20 1.65 0.13 1.42 1970-1974 3.02 1.52 0.34 1.17 1975-1979 4.56 2.47 0.39 1.70 1980-1984 -6.16 0.69 0.42 -7.27 1985-1989 -0.77 -1.21 0.43 0.01 1990-1994 -3.75 -1.88 0.32 -2.20 1995-2000 0.72 -0.81 0.29 1.24
Total 0.82 0.43 0.31 0.08 Ethiopia
1960-1964 2.72 3.23 0.05 -0.55 1965-1969 1.68 2.32 0.05 -0.68 1970-1974 1.71 0.88 0.11 0.73 1975-1979 -0.20 -0.29 0.13 -0.04 1980-1984 -0.55 1.42 0.27 -2.25 1985-1989 -2.35 0.93 0.31 -3.58 1990-1994 -0.14 0.25 0.28 -0.67 1995-2000 2.96 1.13 0.28 1.55
Total 0.73 1.18 0.19 -0.63 Gabon Total
Ghana 1960-1964 0.62 1.90 0.37 -1.64 1965-1969 -0.26 0.65 1.06 -1.97 1970-1974 1.54 -0.28 0.43 1.39 1975-1979 -3.74 -0.06 0.25 -3.92 1980-1984 -4.17 -1.19 0.18 -3.17 1985-1989 1.52 -1.28 0.15 2.65 1990-1994 1.05 0.05 0.15 0.85 1995-2000 1.77 1.17 0.15 0.44
Total -0.18 0.10 0.34 -0.62 Guinea Total
Revised colbos tables.doc / 04/03/03 10
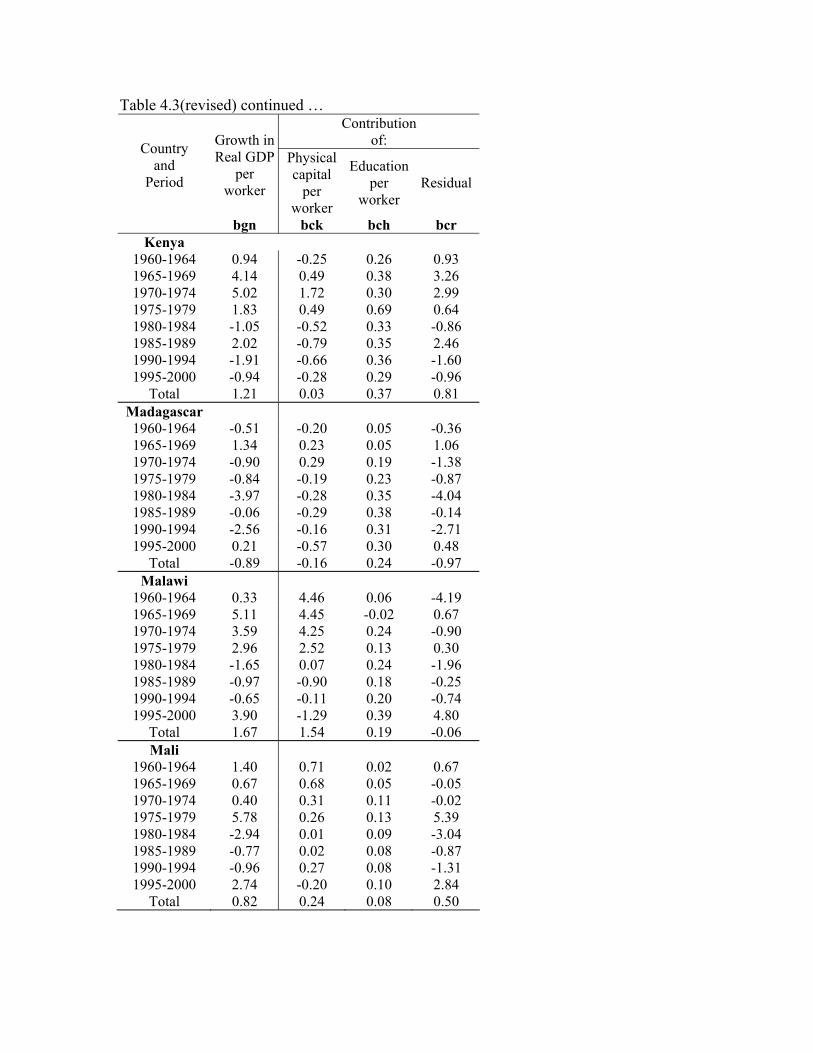
Table 4.3(revised) continued … Contribution
of: Country and
Period
Growth in Real GDP
per worker
Physical capital
per worker
Education per
worker Residual
bgn bck bch bcr Kenya
1960-1964 0.94 -0.25 0.26 0.93 1965-1969 4.14 0.49 0.38 3.26 1970-1974 5.02 1.72 0.30 2.99 1975-1979 1.83 0.49 0.69 0.64 1980-1984 -1.05 -0.52 0.33 -0.86 1985-1989 2.02 -0.79 0.35 2.46 1990-1994 -1.91 -0.66 0.36 -1.60 1995-2000 -0.94 -0.28 0.29 -0.96
Total 1.21 0.03 0.37 0.81 Madagascar 1960-1964 -0.51 -0.20 0.05 -0.36 1965-1969 1.34 0.23 0.05 1.06 1970-1974 -0.90 0.29 0.19 -1.38 1975-1979 -0.84 -0.19 0.23 -0.87 1980-1984 -3.97 -0.28 0.35 -4.04 1985-1989 -0.06 -0.29 0.38 -0.14 1990-1994 -2.56 -0.16 0.31 -2.71 1995-2000 0.21 -0.57 0.30 0.48
Total -0.89 -0.16 0.24 -0.97 Malawi
1960-1964 0.33 4.46 0.06 -4.19 1965-1969 5.11 4.45 -0.02 0.67 1970-1974 3.59 4.25 0.24 -0.90 1975-1979 2.96 2.52 0.13 0.30 1980-1984 -1.65 0.07 0.24 -1.96 1985-1989 -0.97 -0.90 0.18 -0.25 1990-1994 -0.65 -0.11 0.20 -0.74 1995-2000 3.90 -1.29 0.39 4.80
Total 1.67 1.54 0.19 -0.06 Mali
1960-1964 1.40 0.71 0.02 0.67 1965-1969 0.67 0.68 0.05 -0.05 1970-1974 0.40 0.31 0.11 -0.02 1975-1979 5.78 0.26 0.13 5.39 1980-1984 -2.94 0.01 0.09 -3.04 1985-1989 -0.77 0.02 0.08 -0.87 1990-1994 -0.96 0.27 0.08 -1.31 1995-2000 2.74 -0.20 0.10 2.84
Total 0.82 0.24 0.08 0.50
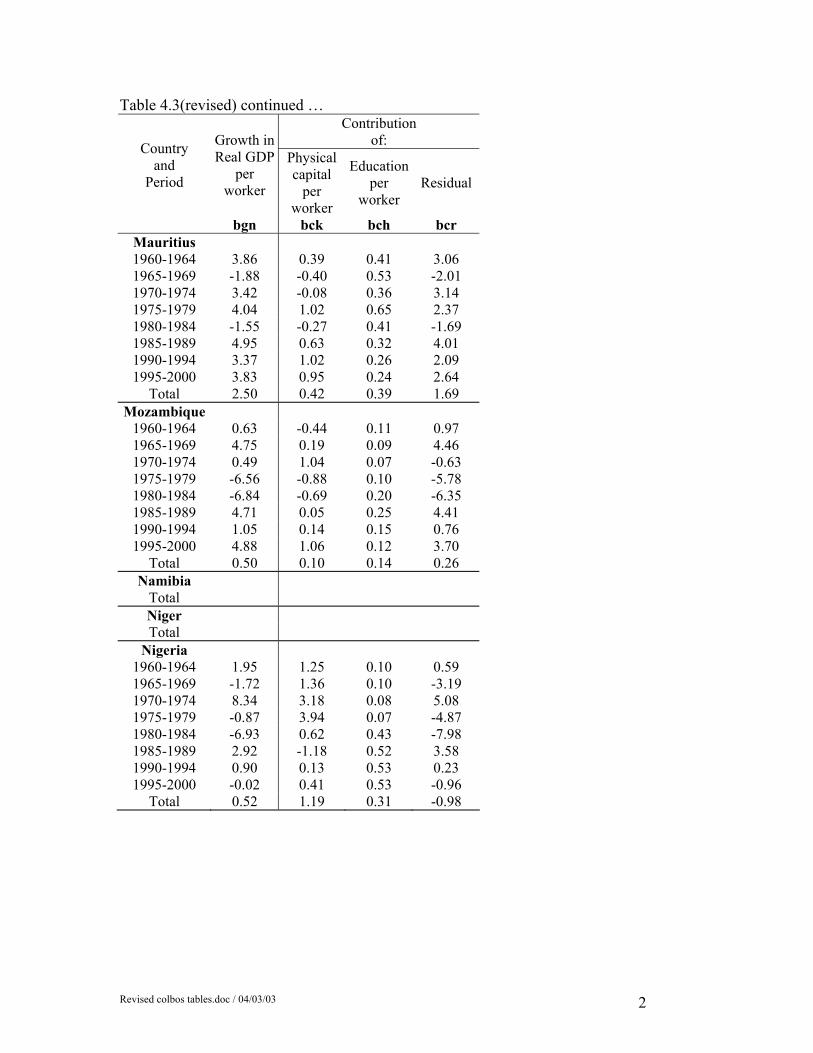
Table 4.3(revised) continued … Contribution
of: Country and
Period
Growth in Real GDP
per worker
Physical capital
per worker
Education per
worker Residual
bgn bck bch bcr Mauritius 1960-1964 3.86 0.39 0.41 3.06 1965-1969 -1.88 -0.40 0.53 -2.01 1970-1974 3.42 -0.08 0.36 3.14 1975-1979 4.04 1.02 0.65 2.37 1980-1984 -1.55 -0.27 0.41 -1.69 1985-1989 4.95 0.63 0.32 4.01 1990-1994 3.37 1.02 0.26 2.09 1995-2000 3.83 0.95 0.24 2.64
Total 2.50 0.42 0.39 1.69 Mozambique
1960-1964 0.63 -0.44 0.11 0.97 1965-1969 4.75 0.19 0.09 4.46 1970-1974 0.49 1.04 0.07 -0.63 1975-1979 -6.56 -0.88 0.10 -5.78 1980-1984 -6.84 -0.69 0.20 -6.35 1985-1989 4.71 0.05 0.25 4.41 1990-1994 1.05 0.14 0.15 0.76 1995-2000 4.88 1.06 0.12 3.70
Total 0.50 0.10 0.14 0.26 Namibia
Total Niger Total
Nigeria 1960-1964 1.95 1.25 0.10 0.59 1965-1969 -1.72 1.36 0.10 -3.19 1970-1974 8.34 3.18 0.08 5.08 1975-1979 -0.87 3.94 0.07 -4.87 1980-1984 -6.93 0.62 0.43 -7.98 1985-1989 2.92 -1.18 0.52 3.58 1990-1994 0.90 0.13 0.53 0.23 1995-2000 -0.02 0.41 0.53 -0.96
Total 0.52 1.19 0.31 -0.98
Revised colbos tables.doc / 04/03/03 2
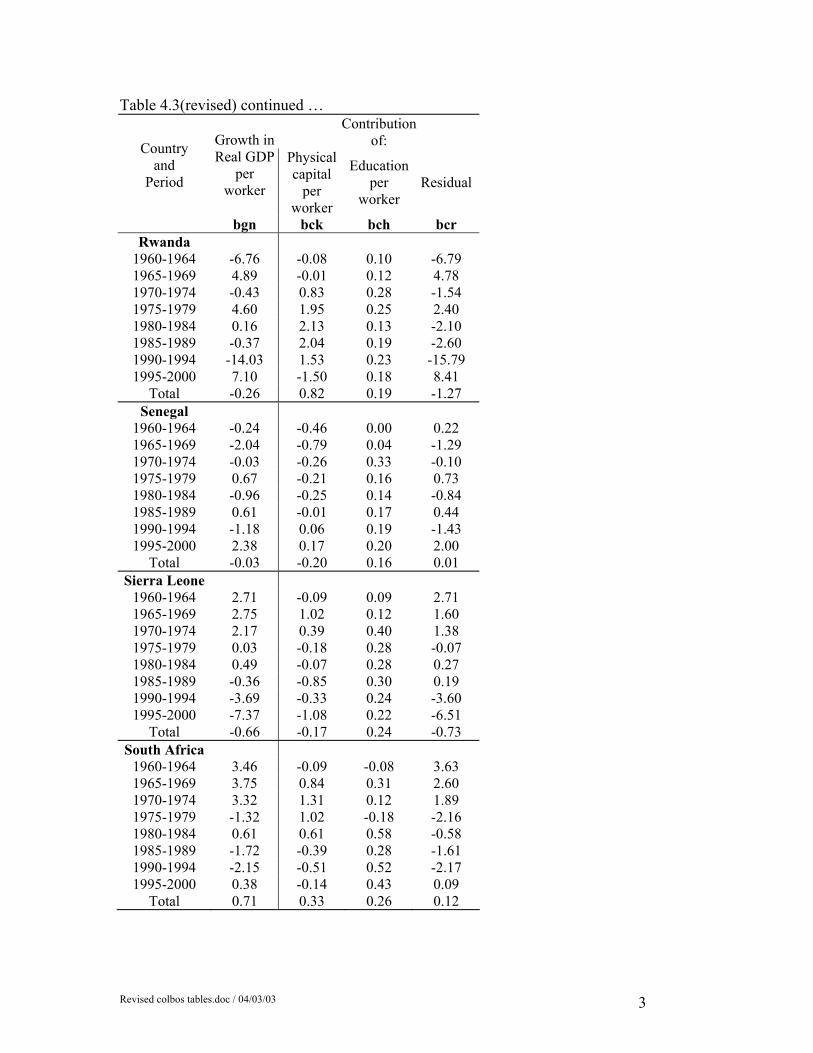
Table 4.3(revised) continued … Contribution
of: Country and
Period
Growth in Real GDP
per worker
Physical capital
per worker
Education per
worker Residual
bgn bck bch bcr Rwanda
1960-1964 -6.76 -0.08 0.10 -6.79 1965-1969 4.89 -0.01 0.12 4.78 1970-1974 -0.43 0.83 0.28 -1.54 1975-1979 4.60 1.95 0.25 2.40 1980-1984 0.16 2.13 0.13 -2.10 1985-1989 -0.37 2.04 0.19 -2.60 1990-1994 -14.03 1.53 0.23 -15.79 1995-2000 7.10 -1.50 0.18 8.41
Total -0.26 0.82 0.19 -1.27 Senegal
1960-1964 -0.24 -0.46 0.00 0.22 1965-1969 -2.04 -0.79 0.04 -1.29 1970-1974 -0.03 -0.26 0.33 -0.10 1975-1979 0.67 -0.21 0.16 0.73 1980-1984 -0.96 -0.25 0.14 -0.84 1985-1989 0.61 -0.01 0.17 0.44 1990-1994 -1.18 0.06 0.19 -1.43 1995-2000 2.38 0.17 0.20 2.00
Total -0.03 -0.20 0.16 0.01 Sierra Leone
1960-1964 2.71 -0.09 0.09 2.71 1965-1969 2.75 1.02 0.12 1.60 1970-1974 2.17 0.39 0.40 1.38 1975-1979 0.03 -0.18 0.28 -0.07 1980-1984 0.49 -0.07 0.28 0.27 1985-1989 -0.36 -0.85 0.30 0.19 1990-1994 -3.69 -0.33 0.24 -3.60 1995-2000 -7.37 -1.08 0.22 -6.51
Total -0.66 -0.17 0.24 -0.73 South Africa
1960-1964 3.46 -0.09 -0.08 3.63 1965-1969 3.75 0.84 0.31 2.60 1970-1974 3.32 1.31 0.12 1.89 1975-1979 -1.32 1.02 -0.18 -2.16 1980-1984 0.61 0.61 0.58 -0.58 1985-1989 -1.72 -0.39 0.28 -1.61 1990-1994 -2.15 -0.51 0.52 -2.17 1995-2000 0.38 -0.14 0.43 0.09
Total 0.71 0.33 0.26 0.12
Revised colbos tables.doc / 04/03/03 3
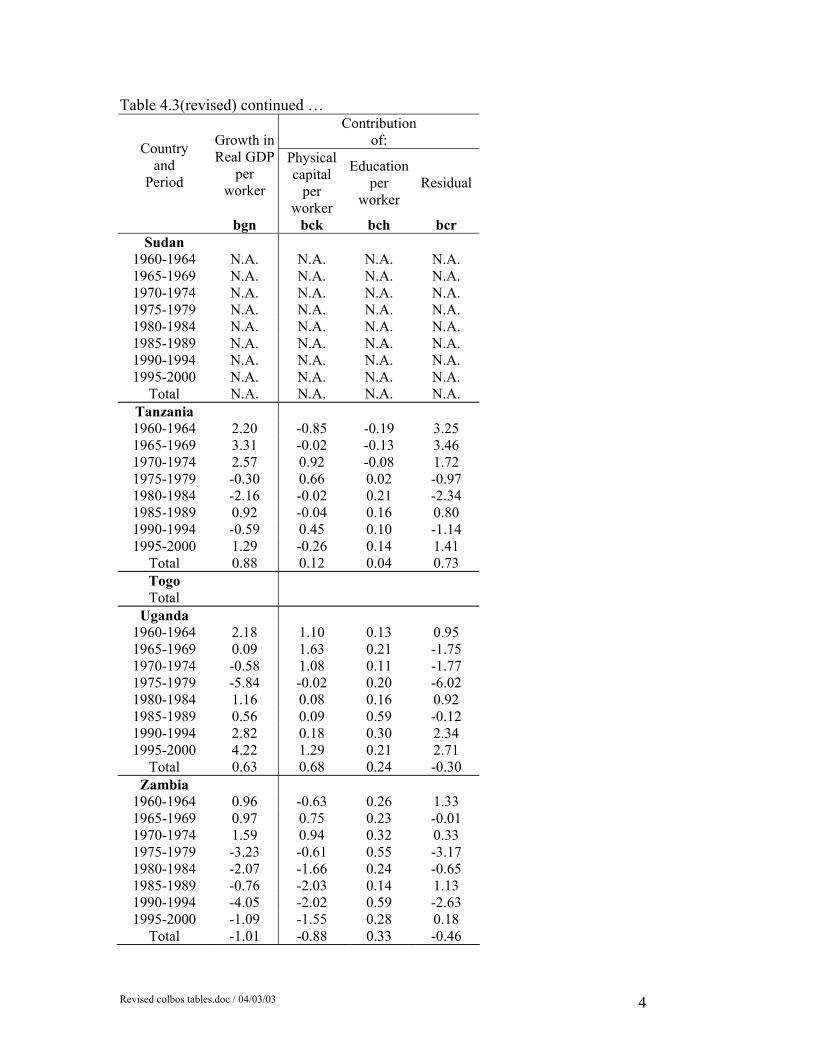
Table 4.3(revised) continued … Contribution
of: Country and
Period
Growth in Real GDP
per worker
Physical capital
per worker
Education per
worker Residual
bgn bck bch bcr Sudan
1960-1964 N.A. N.A. N.A. N.A. 1965-1969 N.A. N.A. N.A. N.A. 1970-1974 N.A. N.A. N.A. N.A. 1975-1979 N.A. N.A. N.A. N.A. 1980-1984 N.A. N.A. N.A. N.A. 1985-1989 N.A. N.A. N.A. N.A. 1990-1994 N.A. N.A. N.A. N.A. 1995-2000 N.A. N.A. N.A. N.A.
Total N.A. N.A. N.A. N.A. Tanzania 1960-1964 2.20 -0.85 -0.19 3.25 1965-1969 3.31 -0.02 -0.13 3.46 1970-1974 2.57 0.92 -0.08 1.72 1975-1979 -0.30 0.66 0.02 -0.97 1980-1984 -2.16 -0.02 0.21 -2.34 1985-1989 0.92 -0.04 0.16 0.80 1990-1994 -0.59 0.45 0.10 -1.14 1995-2000 1.29 -0.26 0.14 1.41
Total 0.88 0.12 0.04 0.73 Togo Total
Uganda 1960-1964 2.18 1.10 0.13 0.95 1965-1969 0.09 1.63 0.21 -1.75 1970-1974 -0.58 1.08 0.11 -1.77 1975-1979 -5.84 -0.02 0.20 -6.02 1980-1984 1.16 0.08 0.16 0.92 1985-1989 0.56 0.09 0.59 -0.12 1990-1994 2.82 0.18 0.30 2.34 1995-2000 4.22 1.29 0.21 2.71
Total 0.63 0.68 0.24 -0.30 Zambia
1960-1964 0.96 -0.63 0.26 1.33 1965-1969 0.97 0.75 0.23 -0.01 1970-1974 1.59 0.94 0.32 0.33 1975-1979 -3.23 -0.61 0.55 -3.17 1980-1984 -2.07 -1.66 0.24 -0.65 1985-1989 -0.76 -2.03 0.14 1.13 1990-1994 -4.05 -2.02 0.59 -2.63 1995-2000 -1.09 -1.55 0.28 0.18
Total -1.01 -0.88 0.33 -0.46
Revised colbos tables.doc / 04/03/03 4
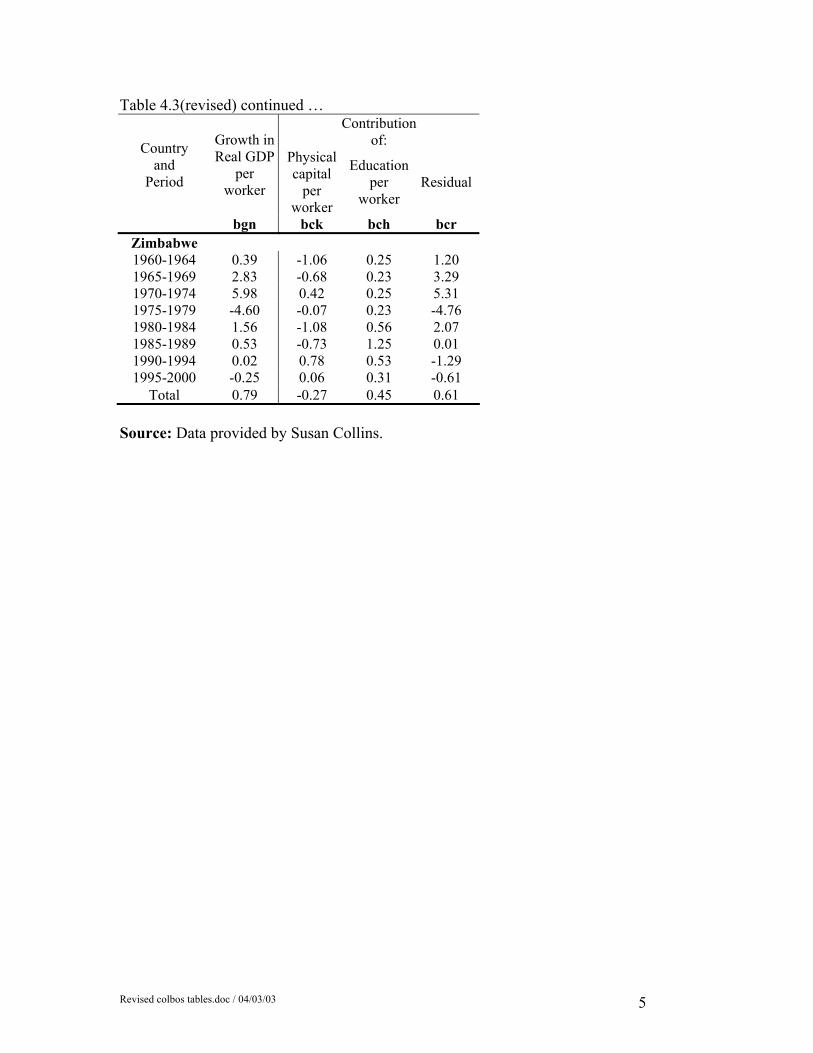
Table 4.3(revised) continued … Contribution
of: Country and
Period
Growth in Real GDP
per worker
Physical capital
per worker
Education per
worker Residual
bgn bck bch bcr Zimbabwe 1960-1964 0.39 -1.06 0.25 1.20 1965-1969 2.83 -0.68 0.23 3.29 1970-1974 5.98 0.42 0.25 5.31 1975-1979 -4.60 -0.07 0.23 -4.76 1980-1984 1.56 -1.08 0.56 2.07 1985-1989 0.53 -0.73 1.25 0.01 1990-1994 0.02 0.78 0.53 -1.29 1995-2000 -0.25 0.06 0.31 -0.61
Total 0.79 -0.27 0.45 0.61 Source: Data provided by Susan Collins.
Revised colbos tables.doc / 04/03/03 5
Revised colbos tables.doc / 04/03/03 6
References
Barro, R. and J.-W. Lee (1993), “International comparisons of educational attainment,” Journal of Monetary Economics 32(3), 363-94.
Barro, R. and J.-W. Lee (2000), “International data on educational attainment:
updates and implications,” CID Working Paper No. 42, Harvard University.
Cohen, D. and M. Soto (2001), “Growth and human capital: good data, good
results,” Technical Paper No. 179, OECD Development Centre, Paris. Collins, Susan M. and Barry P. Bosworth (1996), “Economic Growth in East
Asia: Accumulation versus Assimilation,” Brookings Papers on Economic Activity 2: 135-203.
Nehru, V. and A. Dhareshwar (1993), “A New Database on Physical Capital
Stock: Sources, Methodology and Results,” Revista de Analisisis Economico 8(1): 37- 59.
Ndulu, B. and S. O’Connell (2000), “Background information on economic
growth,” Swarthmore College. http://www.swarthmore.edu/SocSci/soconne1/aercgrth.html
O’Connell, S. and B. Ndulu (2000), “Africa’s growth experience: a focus on
sources of growth,” Swarthmore College. http://www.swarthmore.edu/SocSci/soconne1/aercgrth.html
Soto, M. (2002), “Rediscovering education in growth regressions,” Technical Paper No. 202, OECD Development Centre.