Embed Size (px)
Citation preview

1 1 Slide
Slide
© 2004 Thomson/South-Western© 2004 Thomson/South-Western
Payoff TablesPayoff Tables
The consequence resulting from a specific The consequence resulting from a specific combination of a decision alternative and a combination of a decision alternative and a state of nature is a state of nature is a payoffpayoff..
A table showing payoffs for all combinations of A table showing payoffs for all combinations of decision alternatives and states of nature is a decision alternatives and states of nature is a payoff tablepayoff table..
Payoffs can be expressed in terms of Payoffs can be expressed in terms of profitprofit, , costcost, , timetime, , distancedistance or any other appropriate or any other appropriate measure.measure.

2 2 Slide
Slide
© 2004 Thomson/South-Western© 2004 Thomson/South-Western
Decision TreesDecision Trees
A A decision treedecision tree is a chronological is a chronological representation of the decision problem.representation of the decision problem.
Each decision tree has two types of nodes; Each decision tree has two types of nodes; round nodesround nodes correspond to the states of nature correspond to the states of nature while while square nodessquare nodes correspond to the decision correspond to the decision alternatives. alternatives.
The The branchesbranches leaving each round node leaving each round node represent the different states of nature while represent the different states of nature while the branches leaving each square node the branches leaving each square node represent the different decision alternatives.represent the different decision alternatives.
At the end of each limb of a tree are the At the end of each limb of a tree are the payoffs attained from the series of branches payoffs attained from the series of branches making up that limb. making up that limb.

3 3 Slide
Slide
© 2004 Thomson/South-Western© 2004 Thomson/South-Western
Decision Making without ProbabilitiesDecision Making without Probabilities
Three commonly used criteria for decision Three commonly used criteria for decision making when probability information making when probability information regarding the likelihood of the states of regarding the likelihood of the states of nature is unavailable are: nature is unavailable are:
• the the optimisticoptimistic approach approach
• the the conservativeconservative approach approach
• the the minimax regretminimax regret approach. approach.
4 4 Slide
Slide
© 2004 Thomson/South-Western© 2004 Thomson/South-Western
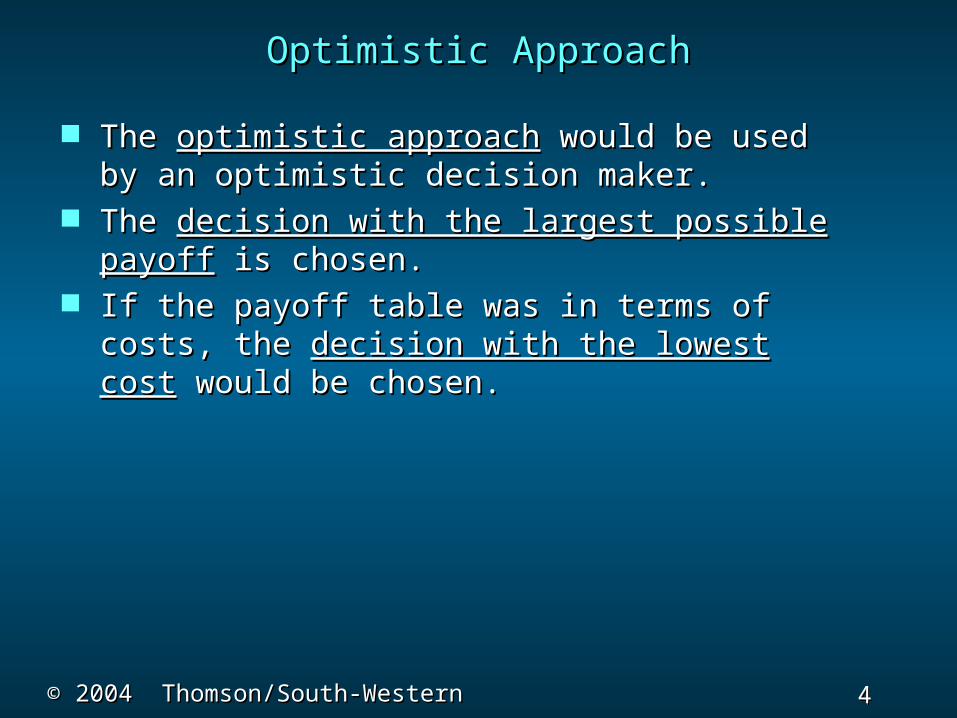
Optimistic ApproachOptimistic Approach
The The optimistic approachoptimistic approach would be used by an would be used by an optimistic decision maker.optimistic decision maker.
The The decision with the largest possible payoffdecision with the largest possible payoff is is chosen. chosen.
If the payoff table was in terms of costs, the If the payoff table was in terms of costs, the decision with the lowest costdecision with the lowest cost would be chosen. would be chosen.

5 5 Slide
Slide
© 2004 Thomson/South-Western© 2004 Thomson/South-Western
Conservative ApproachConservative Approach
The The conservative approachconservative approach would be used by a would be used by a conservative decision maker. conservative decision maker.
For each decision the minimum payoff is listed For each decision the minimum payoff is listed and then the decision corresponding to the and then the decision corresponding to the maximum of these minimum payoffs is selected. maximum of these minimum payoffs is selected. (Hence, the (Hence, the minimum possible payoff is minimum possible payoff is maximizedmaximized.).)
If the payoff was in terms of costs, the maximum If the payoff was in terms of costs, the maximum costs would be determined for each decision and costs would be determined for each decision and then the decision corresponding to the minimum then the decision corresponding to the minimum of these maximum costs is selected. (Hence, of these maximum costs is selected. (Hence, the the maximum possible cost is minimizedmaximum possible cost is minimized.).)

6 6 Slide
Slide
© 2004 Thomson/South-Western© 2004 Thomson/South-Western
Minimax Regret ApproachMinimax Regret Approach
The minimax regret approach requires the The minimax regret approach requires the construction of a construction of a regret tableregret table or an or an opportunity loss tableopportunity loss table. .
This is done by calculating for each state of This is done by calculating for each state of nature the difference between each payoff nature the difference between each payoff and the largest payoff for that state of nature. and the largest payoff for that state of nature.
Then, using this regret table, the maximum Then, using this regret table, the maximum regret for each possible decision is listed. regret for each possible decision is listed.
The decision chosen is the one corresponding The decision chosen is the one corresponding to the to the minimum of the maximum regretsminimum of the maximum regrets..

7 7 Slide
Slide
© 2004 Thomson/South-Western© 2004 Thomson/South-Western
Expected Value ApproachExpected Value Approach
Calculate the expected value for each Calculate the expected value for each decision. The decision tree on the next slide decision. The decision tree on the next slide can assist in this calculation. Here can assist in this calculation. Here dd11, , dd22, , dd3 3
represent the decision alternatives of models represent the decision alternatives of models A, B, C, and A, B, C, and ss11, , ss22, , ss3 3 represent the states of represent the states of
nature of 80, 100, and 120.nature of 80, 100, and 120.

8 8 Slide
Slide
© 2004 Thomson/South-Western© 2004 Thomson/South-Western
Decision TreeDecision Tree
1111
.2.2
.4.4
.4.4
.4.4
.2.2
.4.4
.4.4
.2.2
.4.4
dd11
dd22
dd33
ss11
ss11
ss11
ss22
ss33
ss22
ss22
ss33
ss33
PayoffsPayoffs
10,00010,000
15,00015,000
14,00014,0008,0008,000
18,00018,000
12,00012,000
6,0006,000
16,00016,000
21,00021,000
2222
3333
4444

9 9 Slide
Slide
© 2004 Thomson/South-Western© 2004 Thomson/South-Western
Expected Value for Each DecisionExpected Value for Each Decision
Choose the model with largest EV, Model Choose the model with largest EV, Model C.C.
3333
dd11
dd22
dd33
EMV = .4(10,000) + .2(15,000) + .4(14,000)EMV = .4(10,000) + .2(15,000) + .4(14,000) = $12,600= $12,600
EMV = .4(8,000) + .2(18,000) + .4(12,000)EMV = .4(8,000) + .2(18,000) + .4(12,000) = $11,600= $11,600
EMV = .4(6,000) + .2(16,000) + .4(21,000)EMV = .4(6,000) + .2(16,000) + .4(21,000) = $14,000= $14,000
Model AModel A
Model BModel B
Model CModel C
2222
1111
4444

10 10 Slide
Slide
© 2004 Thomson/South-Western© 2004 Thomson/South-Western
Expected Value of Perfect InformationExpected Value of Perfect Information
Frequently information is available which Frequently information is available which can improve the probability estimates for can improve the probability estimates for the states of nature. the states of nature.
The The expected value of perfect informationexpected value of perfect information (EVPI) is the increase in the expected profit (EVPI) is the increase in the expected profit that would result if one knew with certainty that would result if one knew with certainty which state of nature would occur. which state of nature would occur.
The EVPI provides an The EVPI provides an upper bound on the upper bound on the expected value of any sample or survey expected value of any sample or survey informationinformation. .

11 11 Slide
Slide
© 2004 Thomson/South-Western© 2004 Thomson/South-Western
Expected Value of Perfect InformationExpected Value of Perfect Information
EVPI CalculationEVPI Calculation
• Step 1:Step 1:
Determine the optimal return Determine the optimal return corresponding to each state of nature.corresponding to each state of nature.
• Step 2:Step 2:
Compute the expected value of these Compute the expected value of these optimal returns.optimal returns.
• Step 3:Step 3:
Subtract the EV of the optimal Subtract the EV of the optimal decision from the amount determined in step decision from the amount determined in step (2).(2).
12 12 Slide
Slide
© 2004 Thomson/South-Western© 2004 Thomson/South-Western
Bayes’ Theorem and Posterior Bayes’ Theorem and Posterior ProbabilitiesProbabilities
Knowledge of sample (survey) information can be Knowledge of sample (survey) information can be used to revise the probability estimates for the used to revise the probability estimates for the states of nature. states of nature.
Prior to obtaining this information, the probability Prior to obtaining this information, the probability estimates for the states of nature are called estimates for the states of nature are called prior prior probabilitiesprobabilities. .
With knowledge of With knowledge of conditional probabilitiesconditional probabilities for the for the outcomes or indicators of the sample or survey outcomes or indicators of the sample or survey information, these prior probabilities can be information, these prior probabilities can be revised by employing revised by employing Bayes' TheoremBayes' Theorem. .
The outcomes of this analysis are called The outcomes of this analysis are called posterior posterior probabilitiesprobabilities or or branch probabilitiesbranch probabilities for decision for decision trees.trees.

13 13 Slide
Slide
© 2004 Thomson/South-Western© 2004 Thomson/South-Western
Expected Value of Sample InformationExpected Value of Sample Information
The The expected value of sample informationexpected value of sample information (EVSI) is the additional expected profit (EVSI) is the additional expected profit possible through knowledge of the sample or possible through knowledge of the sample or survey information. survey information.

14 14 Slide
Slide
© 2004 Thomson/South-Western© 2004 Thomson/South-Western
Efficiency of Sample InformationEfficiency of Sample Information
Efficiency of sample informationEfficiency of sample information is the ratio of is the ratio of EVSI to EVPI. EVSI to EVPI.
As the EVPI provides an upper bound for the As the EVPI provides an upper bound for the EVSI, efficiency is always a number between 0 EVSI, efficiency is always a number between 0 and 1.and 1.