Embed Size (px)
Citation preview
SUBSIDIARY BODY ON IMPLEMENTATIONFirst meetingMontreal, Canada, 2-6 May 2016Item 9 of the provisional agenda*
REPORT OF THE INTERNATIONAL TECHNICAL EXPERT WORKSHOP ON IDENTIFYING, ACCESSING, COMPILING AND AGGREGATING DOMESTIC AND
INTERNATIONAL BIODIVERSITY-RELATED INVESTMENTS AND IMPACTS
INTRODUCTION
1. The Conference of the Parties to the Convention, at its twelfth meeting, adopted a set of targets for resource mobilization, with a view to achieving an overall substantial increase in total biodiversity-related funding for the implementation of the Strategic Plan for Biodiversity 2011–2020 from a variety of sources (decision XII/3, paragraph 1). In paragraph 24 of the same decision, the Conference of the Parties adopted a financial reporting framework, intended for use by Parties for providing baseline information and reporting on their contribution to reach the global financial targets above, and, in paragraph 25, invited all Parties as well as other Governments to report thereon by 31 December 2015.
2. In paragraph 32 (b) of decision XII/3, the Conference of the Parties requested the Executive Secretary to initiate technical work, in close cooperation with Parties as well as relevant international organizations, such as the United Nations Development Programme and the World Bank, by organizing a technical expert workshop on identifying, accessing, compiling and aggregating domestic and international biodiversity-related investments and impacts, with a view to:
(a) Presenting, sharing and reviewing experiences;
(b) Assessing experiences and methodologies applied in other sectors with a view to identifying opportunities for methodological transfer;
(c) Identifying options for convergence towards, and possible elements of, a common methodology.
3. According to paragraph 32 (c) of the decision, the report of the meeting is to be made available as an element of voluntary guidance for Parties, with a view to facilitating:
(a) Financial reporting on domestic expenditures; and
(b) The development of national finance plans (or resource mobilization strategies).
4. The workshop was organized by the Secretariat of the Convention on Biological Diversity (SCBD), in close cooperation with the United Nations Development Programme (UNDP), through its Biodiversity Finance Initiative (BIOFIN). It was hosted by the Government of Mexico, with financial support provided by the European Union as well as, through the UNDP-BIOFIN Initiative, by the Governments of Germany and Switzerland. The programme of the workshop was structured into sessions
CBD
Distr.GENERAL
UNEP/CBD/SBI/1/INF/2015 March 2016
ENGLISH ONLY
Page 2UNEP/CBD/RM/EM/2015/1/2
on methodologies for assessing international and domestic biodiversity-related investments and impacts. The session on domestic investments and impacts was further divided into methodologies for ex post assessment, such as public expenditure reviews, and ex ante assessment, such as methodologies for costing national biodiversity strategy and action plans. Each of the resulting three sections provided overview presentations of important (emerging) methodologies, developed under relevant international organizations, as well as presentations on national approaches and experiences. Break out groups provided opportunities for more in-depth exchange of information and experiences on issues that were identified to be of critical importance in plenary.
5. In the light of the mandate and objective of the workshop, the following lead questions were suggested for the production of the envisaged output of the workshop:
(a) What are the main methodologies (and associated definitions) available, including from other sectors?
(b) What is their respective scope and what are important common features and critical differences?
(c) What are the main challenges faced in using the methodologies and are some methodologies better suited to particular circumstances and, if so, to which ones?
(d) What are possible areas of convergence towards (elements of) a common methodology (and associated definitions)?
(e) What are remaining critical (data and methodological) gaps and challenges and what would need to be done to address these?
(f) Who should be responsible for, or lead, further methodological development, with what resources? What next steps?
6. As requested by the Conference of the Parties, this report provides voluntary guidance to Parties in meeting their financial reporting obligation by the end of 2015, and in developing their national resource mobilization strategies (See annex IV).
7. In order to assist the workshop in its deliberations, a collection of material, prepared with support provided by the UNDP BIOFIN initiative, was circulated before the workshop. This document included succinct summaries of pertinent methodologies and approaches, based on input from Parties as well as relevant partners, and provided elements of an analysis of these, structured as appropriate along common themes. The report will be finalized after the workshop, based on its discussions and conclusions as well as the continued interaction with participants, and its release, in a practical and easily accessible format, is planned for late summer/early fall 2015.
8. Experts nominated by the following Governments attended the meeting: Benin, Cuba, Denmark, Democratic Republic of the Congo, Germany, Guatemala, India, Kenya, Maldives, Mexico, Norway, Peru, Philippines, Republic of Moldova, South Africa, Switzerland and Uganda. A representative of the European Union, presented by video link. A number of United Nations organizations as well as relevant international and national organizations were also represented. The list of participants is provided as annex II to the present report.
UNEP/CBD/SBI/1/INF/20Page 3
ITEM 1. OPENING OF THE WORKSHOP
9. The workshop was opened at 9.a.m. on Tuesday, 5 May 2015.
10. Mr. Victor Lichtinger, national coordinator for the thirteenth meeting of the Conference of the Parties to the Convention on Biological Diversity (COP 13) welcomed participants and expressed his pleasure that the Government of Mexico was hosting the workshop. He underscored that achieving the Aichi Biodiversity Targets required substantial increases in national budgets and investments for biodiversity conservation, as well as enhanced efficiency and effectiveness of their use. The challenge for many countries was that they did not yet measure and track the funds that were spent on biodiversity and, as a result, did not possess a solid understanding of how specific national and sectorial economic and social policies directly or indirectly impacted biodiversity. In this context, Mr. Lichtinger expressed his hope that the present workshop would contribute to the success of COP 13 by building capacities for measuring the volume and nature of national biodiversity-related investments in order to assess gaps, funding needs and prioritize investments.
11. Speaking on behalf of Mr. Braulio Ferreira de Souza Dias, Executive Secretary of the Convention, Mr. Ravi Sharma, Principal Officer, thanked the Government of Mexico for graciously accepting to host the workshop, confirming its commitment to the issue of resource mobilization. Mr. Sharma expressed his appreciation to the European Union and UNDP-BIOFIN for their financial support, and highlighted the significant contribution of the BIOFIN initiative to the substantial preparations of the workshop.
12. Introducing the context of the workshop, Mr. Sharma pointed to the recent agreements on resource mobilization for the implementation of the Strategic Plan for Biodiversity, by the Conference of the Parties, at its eleventh and twelfth meetings, as major achievements under the Convention. He also referred to the ongoing United Nations discussions on Financing for Development and on means of implementation for achieving the Post-2015 Sustainable Development Goals, which may culminate in the agreement of a Roadmap at the Addis Ababa Conference on Financing for Development, to take place in July 2015. This process could unfold political momentum towards a common methodology for reporting on resource mobilization by countries.
13. Mr. Sharma briefly outlined the resource mobilization targets, to be met by the end of 2015 at international and domestic levels. Recognizing that the achievement of the resource mobilization targets required great effort, Mr. Sharma emphasized the timeliness of the workshop and its task to provide further guidance on accessing and interpreting national level data for submission of the financial reporting framework. Mr. Sharma concluded by informing participants that the CBD Secretariat would undertake capacity-building and technical support to countries with a view to further assisting them in using the voluntary guidance. It would also collaborate with other partners to organize further pertinent workshops, including on sharing of experiences in applying methodologies to assess the contribution of collection action by indigenous peoples and local communities to biodiversity conservation and resource mobilization.1
14. Speaking for the United Nations Development Programme (UNDP) and its BIOFIN initiative, Mr. Yves de Soye congratulated the Government of Mexico for its decision to host the workshop, noting the established capacity of the country in this field and its seamless fit into its preparations for the upcoming COP Presidency. Mr. de Soye stated that UNDP considered biodiversity a key element of sustainable development and, in this regard, underlined the importance of addressing the challenge of mobilizing resources for biodiversity. 1 This dialogue workshop took subsequently place in Panajachel, Guatemala, from 11 to 13 June 2015. See https://www.cbd.int/doc/?meeting=RMWS-2015-02 for more information as well as paragraphs 45-47 below and annex I.
3
UNEP/CBD/SBI/1/INF/20Page 4
15. Mr. Luis Villanueva, senior negotiator with the COP-13 preparatory team, welcomed participants and presented the context of the workshop within the larger objectives of COP-13, whose agenda would be heavily focused on biodiversity mainstreaming. He explained that, in order to elevate biodiversity within public policy agendas, Governments needed to understand the positive social and economic impacts of investing in biodiversity, such as on poverty alleviation, food security, human health and employment creation. He also emphasized the importance of achieving or enhancing the cost-effectiveness of policies through mainstreaming, for instance, by removing or redesigning government policies and incentives that had negative impacts on biodiversity.
16. Mr. Sharma subsequently invited participants to nominate a chair for the workshop. Mr. Francis Ogwal (Uganda) proposed Mr. Luis Villanueva (Mexico) which was seconded by Mr. Damodaran (India).
17. The Chair invited workshop participants to introduce themselves, highlighting their respective affiliation and expertise with regard to biodiversity-related investments and impacts, as well as their expectations for the workshop.
18. Mr. Markus Lehmann, economist with the CBD Secretariat, presented a brief overview of the global context of the workshop, its objectives and programme, highlighting the focus of each of the three days of the workshop: (day 1) international funding streams; (day 2) domestic funding streams, ex post assessments; and (day 3) funding streams, ex ante assessments. Mr. Lehmann also stated that significant time would be allocated to break out discussions to address some of the common methodological questions and themes: (a) conceptualizing/defining “biodiversity related investment”; (b) attributing coefficients to “indirect” biodiversity activities; (c) private sector, including NGOs and businesses; (d) expenditures on the subnational level; (e) biodiversity-harmful expenditures; and (f) assessing impacts in a finance context. He highlighted the importance of presenting and assessing experiences in applying pertinent methodologies, and of identifying options for convergence towards common methodologies.
ITEM 2. INTERNATIONAL BIODIVERSITY-RELATED INVESTMENTS AND IMPACTS
19. Ms. Stephanie Ockenden, from the Secretariat of the Development Assistance Committee (DAC) of the Organisation of Economic Co-operation and Development (OECD), presented an overview of the DAC Statistical system for measuring and monitoring external development finance for biodiversity. Ms. Ockenden noted the upward trend in bilateral biodiversity-related development commitments by OECD DAC members as well as the increasingly targeted development assistance towards multiple environmental objectives. She then provided an overview of the OECD Statistical System, the Rio markers and the measuring of biodiversity-related finance within the Creditor Reporting System, including the ongoing work of the Joint Task Team of the OECD Working Party on Development Finance Statistics and the ENVIRONET network, on fine-tuning the Rio Marker definitions, eligibility criteria and classifications for CBD reporting.
20. Recognizing the pressing need for comparability and harmonization of approaches, Ms. Ockenden subsequently presented the modernization of OECD DAC Development Finance Measuring Framework as well as the Total Official Support for Sustainable Development (TOSSD) measure. She concluded by identifying the areas for improvements in development finance measurements: (a) improvement of the quality of Rio marker data through fine tuning of definitions and guidance; (b) improvement of the use of Rio marker data for reporting to the CBD; and (c) improvement of the coverage through collaboration with Multilateral Development Banks and funds to present an integrated picture of bilateral and multilateral flows.
21. Reacting to the presentation by Ms. Ockenden, the workshop noted the importance of the ongoing work of the OECD Joint Task Team, and in particular the emerging work on improving the biodiversity marker. The workshop also recognized that the upcoming fourth meeting of the Joint Task Team, to be held on 20-21 May 2015, would offer an opportunity to provide input into this emerging work, without
UNEP/CBD/SBI/1/INF/20Page 5
pre-empting its conclusions. The workshop noted that its work on concepts and definitions, as well as its work on coefficients, would be of particular relevance in this regard, and requested the Secretariat to communicate the outcomes of these work streams to the meeting of the Joint Task Team.
22. Ms. Eva Maria Mayerhofer from the European Investment Bank (EIB), presented recent work of the multilateral development banks (MDB) to develop an approach for assessing biodiversity-related flows. The systematic tracking and reporting of financial flows from various sources generated the necessary information for monitoring trends and progress, and thus enabling the building of trust and accountability. It was therefore a critical component for successfully mobilizing financial resources for biodiversity conservation. Noting the absence of an internationally agreed definition for biodiversity finance, she introduced some existing tracking systems such as the OECD Rio markers, that were used by the European Union as the basis of its own methodology to track biodiversity expenditures.
23. She subsequently presented critical terms of reference for the joint MDB approach, which emerged from a process to find common approaches to biodiversity finance related to activities carried out in developing countries and emerging economies: (a) reporting would be linked to MDB financial commitments; (b) all types of resources would be eligible for reporting irrespective of origin; (c) all types of instruments deployed would be included; (d) classification is made ex-ante project implementation; (e) report on biodiversity activity would include entire projects, project components, or proportion of a specific project. The MDB approach for biodiversity, she stressed, would be purpose, context and activity-based, and would follow a conservative approach in order to avoid the mislabeling of development activities as biodiversity-relevant. Ms. Mayerhofer concluded with a brief overview of the next steps envisaged by the EIB (i.e. reaching agreement on definitions and approach) and stated that the objective for the MDBs was to jointly report 2015 figures in October 2016.
24. In the subsequent discussion, the following points were raised: (a) the importance for MDBs to adopt a joint approach with a pragmatic and holistic perspective; (b) the usefulness of the approach for the broader banking sector; (c) the commonalities between the biodiversity and climate change approaches in assessing multilateral flows. Clarifications were sought on the concept of “additionality” and how the approach addresses issues of double counting.
25. Mr. Aaron Zazueta from the Independent Evaluation Office of the Global Environmental Facility (GEF) presented, by video link, the methods, emerging findings, and challenges, of the impact evaluation of GEF and UNDP support to protect areas (PAs) and adjacent landscapes. After presenting the general framework for impact assessment, he summarized the preliminary findings of the portfolio as well as its global and case study components. He noted the distinct role of GEF, based on the following observations: (a) more funding is dedicated towards process-oriented activities; (b) longer duration of activities allows for more time for maturation and flexibility to adapt to changing conditions; and (c) the fact that activities build on existing interventions and national initiatives. He noted the major limitations and challenges of the global scope of analysis: (a) it required high level of resources and consistent data; (b) how to approach sampling bias; (c) data scarcity; (d) and multiple interests and perspectives resulting in a mismatch between evaluation responsibilities and scientific criteria. He also informed participants that the final report would be published in July 2015 and presented to the UNDP Executive Board and GEF Council in September 2015 and November 2015, respectively.
26. In the discussion, the complexity and challenges of impact assessments were highlighted, in particular due to data limitations (e.g. for the starting dates of GEF projects). Responding to questions, Mr. Zazueta noted that: (a) there was no crowding-out effect of national funding observed due to GEF funding; (b) conducting a similar kind of assessment in other countries requires information on where the intervention took place, the resulting change and the type of intervention; and (c) the impact on landscape management and sustainable use would most likely be examined in the upcoming years.
5
UNEP/CBD/SBI/1/INF/20Page 6
27. Mr. Andreas Gettkant, representing the German Gesellschaft für Internationale Zusammenarbeit (GIZ), presented the German approach towards measuring international biodiversity-related flows implemented through Official Development Assistance (ODA). Based on the OECD DAC Rio markers, the approach was based on the principle that activities must support at least one of three CBD objectives. Activities scoring Rio marker 2 were calculated as 100% (“principal objective”); (iii) mainstreaming biodiversity through the integration of biodiversity-relevant “sectoral components” into projects/programmes of other sectors were scored as Rio marker 1. For activities scoring Rio marker 1 (“significant objective”), that is, which contained biodiversity components but relate to other sectors overall, only the financial volume of the biodiversity component counted towards ODA biodiversity commitment. He provided the example of a project aiming to secure water supply, which scored Rio marker 1, and for which 25% of the overall financial volume was accounted for biodiversity-related ODA, corresponding to the financial envelope of the biodiversity component. He concluded by emphasizing the importance of the mainstreaming process, in particular of defining biodiversity sectoral components during the project planning and design stage, as well as providing associated good practices and guidance for such integration.
28. In the subsequent discussion, several participants underscored the level of sophistication of the German methodology, which could provide useful lessons for other countries. The following points were raised: (a) the importance of having measurable indicators to calculate biodiversity-related contributions; (b) the potential trade-off between precise numbers and the cost associated with the calculation of these numbers; (c) the positive implications that the exercise had on enhancing understanding among different sectors about the complexity of biodiversity and what could really be counted as a contribution to biodiversity; (d) the importance of having robust monitoring systems and long-term independent evaluations (10-15 years after project completion).
29. Ms. Gabriela Blatter from Switzerland presented the Swiss approach and experience in assessing private sector investments for biodiversity. She explained that her Government conducted a screening of corporate sustainability reports (CSR), sent out questionnaires and subsequently conducted standardized interviews. However, the CSR reports lacked quantified information while the response rate to the questionnaires was very low. The low response rate could be explained by a number of factors: (a) insufficient incentives to complete the questionnaire, e.g. stemming from regulation or market push; (b) a lack of institutional knowledge on how to measure firms’ impact on biodiversity; (c) a lack of awareness of the business case of biodiversity and ecosystem services, compounded by the relatively low political visibility of the issue; and (d) confidentiality issues. She concluded by mapping out possible avenues for further work on private sector funding and associated financial reporting, such as: focusing engagement on early movers and champions, organizing conferences with the private sector to showcase best practices, and conducting further analysis of official statistics from the Federal Office for Statistics.
30. In the discussion, participants shared their experiences and noted similar challenges encountered in assessing private sector investments for biodiversity, including the challenge of quantifying data, as the private sector tended to only report qualitative data when it came to biodiversity. Participants also pointed to initiatives that conducted similar work such as the World Business Council on Sustainable Development, IUCN business and biodiversity and the United Nations Finance Initiative, and noted the importance of involving financial institutions including banks (e.g. through green bonds).
31. The workshop subsequently decided to break into four groups, which were tasked to address a number of topics deemed to be of cross-cutting relevance not just for assessing international, but also for assessing domestic biodiversity-related investments. Each group was requested to provide particular focus on its specific assigned topic, but was given discretion to also look at the critical linkages between the four topics:
Conceptualizing/defining the term “biodiversity-related” investments (facilitator: Mr. Lyes Ferroukhi; technical support: Ms. Jamison Ervin);
UNEP/CBD/SBI/1/INF/20Page 7
Coefficients: attributing the percentage of financial resources to “indirect” biodiversity activities (<100% attributable) (facilitator: Andreas Gettkant (first session) and Ms. Gabriela Blatter (second session); technical support: Markus Lehmann);
Assessing the contributions from the private sector including NGOs and businesses (facilitator: Ms. Gabriela Blatter; technical support: Mr. David Meyers)
Assessing impacts in a finance context (facilitator: Mr. Carlos Manuel Rodriguez; technical support: Mr. Marlon Flores)
32. Summaries of the work of the break out groups, as further considered by the workshop in plenary, are provided in annex I of the present report.
ITEM 3. DOMESTIC BIODIVERSITY-RELATED INVESTMENTS AND IMPACTS: EX POST ASSESSMENTS
33. Mr. Sokol Vako from the United Nations Statistics Division (UNSD) provided an overview of the United Nations System of Environmental-Economic Accounting (SEEA), with emphasized on Environmental Protection Expenditure Accounts. Mr. Vako explained that the SEEA was the international statistical standard for measuring the relationship between the environment and the economy. It enabled the comprehensive measurement of pertinent stocks and flows, capturing both physical and monetary data, in a coherent and internally consistent manner, including its integration into the System of National Accounts (SNA). It enabled time series analysis by measuring the same concept over time. The system contained a number of accounts, such as physical flow accounts, as well as accounts for environmental activities and transaction. Mr. Vako noted that 55-60 countries had already implemented the SEEA and a further 30 were planning to do it. After presenting the conceptual framework of the SEEA, its link to the BIOFIN conceptual model, and some examples, Mr. Vako concluded by pointing to the objectives of SEEA implementation, which included becoming the measurement framework for sustainable development.
34. During subsequent discussions, participants sought several methodological clarifications. The discussion raised the following points: (a) the opportunity for CBD to use information already compiled under the SEEA framework, in particular in the context of reporting on domestic expenditures; (b) the importance of fully accounting negative externalities in national accounts; and (c) the opportunity for BIOFIN and SEEA to collaborate on policy issues and provision of basic data, in particular in developing countries. Mr. Vako stated that one of the central aims of the SEEA was to adjust GDP so that it took into account negative externalities and the depletion of natural resources, while exercising due caution because of political sensitiveness.
35. Ms. Anda Marina Georgescu from Eurostat presented, by video link, relevant Eurostat activities related to biodiversity. Ms. Georgescu began with an overview of the context of EU SEEA reporting, pointing in particular to the classification of environmental protection activities (CEPA) and of environmental goods and services and, in this context, noting the importance of terminology with regard to “principal” (direct) and “secondary” (indirect) biodiversity-related activities. She concluded with an overview of the sectors relevant for biodiversity expenditure in the context of environmental protection expenditure (based on joint Eurostat/OECD work), namely: public administration; agriculture, forestry and fishing; mining and quarrying; electricity, gas, steam and air conditioning supply; as well as water collection, treatment and supply.
36. In the discussion period, participants highlighted the presentation’s usefulness and complementarity with the previous presentation on SEEA. A question was raised on the reporting requirements for businesses on biodiversity-related indicators. Ms. Georgescu explained that reporting
7
UNEP/CBD/SBI/1/INF/20Page 8
was conducted by the statistical institute of each member state and that Eurostat was not in direct contact with the private sector.
37. Jamison Ervin, representing UNDP-BIOFIN, presented the methodology of the Biodiversity Finance Initiative for identifying and assessing domestic biodiversity-related expenditures. Ms. Ervin provided an overview on the terminology and role of biodiversity expenditure reviews in the context of sustainable development. She subsequently outlined the steps conducted in an expenditure review: (a) conduct a policy and institutional review; (b) identify key finance actors; (c) identify and tag biodiversity-related expenditures; (d) identify other related attributes of expenditures; (e) develop future expenditure baseline; (f) aggregate all data into cohesive framework; (g) analyze and review results. Ms. Ervin also addressed the key issues related to each step in the expenditure review: (a) begin with biodiversity trends and key drivers; (b) apply a coherent taxonomy for drivers, expenditures, costs; (c) include existing and potential finance actors; (d) look at both public and private finance actors; (e) choose a level of data granularity in accordance with needs and capacity available; (f) chose the appropriate data period (past and future); (g) assigning percentage of attribution; (h) consider covering also subnational data; (i) gauging effectiveness; (j) gauging harmful expenditures; (k) identifying a ‘status quo’ future baseline; (l) identifying multiple future scenarios; (m) analyzing results and their implications; and (n) reviewing alignment between expenditures and goals.
38. The following points were raised in the subsequent discussion: (a) the issue of data availability to conduct biodiversity expenditure reviews; (b) the importance of using synergies with SEEA by establishing collaboration between relevant institutions; (c) the absence of measuring opportunity cost in biodiversity investments; and (d) further capacity-building and implementation of BIOFIN in collaboration with SEEA, CBD and GEF. Participants underscored the need to also consider inclusion of harmful expenditures. Ms. Ervin stated that often the data was present in countries and that it was a matter of extracting it and making use of it. She did note that information related to the private sector was still a challenge to collect. Mr. Mark Zimsky (GEF) pointed to the GEF developed programme 10 of the GEF-6 biodiversity strategy as an entry point for receiving assistance in working towards the development and implementation of national resource mobilization strategy, including on addressing harmful incentives.
39. One participant sought clarification on the different tools used by BIOFIN and UNSD. Mr. De Soye (UNDP-BIOFIN) explained that SEEA was tracking expenditures and had established a standard adopted by more and more countries. BIOFIN, on the other hand, was assisting countries to mobilize resources and collect information and cost the NBSAPs, the resource mobilization strategy and financial mechanisms. UNDP and SEEA overlapped to the extent that BIOFIN provided information on policies, drivers and existing expenditure information related to biodiversity.
40. Mr. Appukuttan Nair Damodaran from India presented the national assessment of biodiversity financing in India. He provided an overview of the Indian annual budget and the underlying principles of assessing resource requirements, including in the environment sector. Financial requirements were analyzed according to ecosystem requirements and the allocation of resources was based on previous assessments. The assessment was based on a constrained assessment model examining core and non-core funding. Mr. Damodaran presented the resulting shares of core and peripheral annual funding on biodiversity (2010-11), the share of outlays on biodiversity relevant schemes in the aggregate budget of Government of India during the same period, and the percentage of total budgets spent by various ministries of India (other than Ministry of Environment and Forests) on biodiversity relevant schemes during the same period.
41. During the discussion period, participants sought several methodological clarifications. Mr. Damodaran underlined that one of the major challenges encountered during the exercise was the assessment of biodiversity-related funding needs and the associated funding gaps. Highlighting the importance of mainstreaming biodiversity in all sectors, Mr. Damodaran noted that one of the major
UNEP/CBD/SBI/1/INF/20Page 9
lessons learned was that there were a lot of financial resources available but they were not effectively used and mainstreamed.
42. Ms. Laure Ledoux, from the European Commission (EC), presented, by video link, recent work on tracking biodiversity-related expenses in the EU budget. She explained that the reporting of the European Union (EU) on resource mobilization for biodiversity included both international as well as domestic financing flows, and was driven by the desire to: (a) link expenses to outputs with a view to increasing policy effectiveness; (b) use financial assessments as tools for mainstreaming biodiversity in the EU budget; and (c) track international commitments. Following a brief overview of the EU policy context, such as the seventh EU Environmental Action Plan, Ms. Ledoux presented the methodology for tracking biodiversity-related flows. She explained that the approach applied reduction factors depending on categories and level of support to the three objectives of CBD: (a) 100% applied when biodiversity was the principal (primary) objective; (b) 40% applied when biodiversity was a significant, but not predominant, objective; and (c) 0% applied when expenditures did not target biodiversity objectives. Presenting examples of classifications and the 2015 draft budget with the calculated biodiversity investments, Ms. Ledoux noted the tradeoff between a highly detailed methodology and administrative burden/meaningful information, as well as the grey areas encountered in the process (e.g. related to sustainable fisheries, agriculture, forestry). Ms. Ledoux concluded the presentation with pointing to several envisaged next steps, namely: (a) the application of the new methodology to the 2016 draft EU budget; (b) applying pertinent tracking at the most detailed level practicable; (c) continue using the methodology as a tool to further advance the mainstreaming of biodiversity into the EU budget; and (d) improving ex post assessments and associated reporting.
43. Mr. Lawrie Harper-Simmonds presented the Namibian experience in conducting a biodiversity expenditure review for the 2007/08-2012/13 financial years, using the BIOFIN assessment methodology. He provided an overview of the four levels of public budget and expenditure data: (a) national level (total Government budget/expenditure); (b) ministerial level (i.e. Ministry of Environment and Tourism (MET)); (c) programmatic level (wildlife and protected area management; tourism development); and (d) the activity level (fencing of conservation area; water provision for game, wildlife). The main finding of the review was that public and donor expenditures on biodiversity-related activities had increased in real terms from approximately N$750m in 2007/08 to N$1,140m in 2012/13, with the majority of expenditure coming from the Namibia Government. Projections of real public biodiversity expenditure demonstrated a gradual decline from 2014/15 onwards, while the level of donor funding allocated to biodiversity-related activities in Namibia was also expected to decline from its 2012/13 peak as a result of Namibia’s recently acquired status as an upper-middle income country. The review also attempted to estimate expenditure by private game reserves on biodiversity-related activities in Namibia.
44. The subsequent discussion period underlined the importance of aligning Aichi Biodiversity Targets with national expenditures, as well as establishing resource gaps in order to define resource mobilization priorities and associated targets. Mr. Harper-Simmonds pointed to envisaged next steps, namely: making the link to the NBSAP and work towards an integrated framework, based on an institutional review for establishing the resource gap and the subsequent development of a resource mobilization strategy and an associated action plan.
45. Ms. Maria Schultz from the Stockholm Resilience Centre (SwedBio), and Jose Luis Echevarria Tello from Guatemala delivered a presentation on assessing the contribution of collective action of indigenous peoples and local communities to biodiversity conservation. Recalling decision XII/3 on resource mobilization, Ms. Schultz provided an overview of the conceptual and methodological framework for evaluating the contribution of collective action to biodiversity. She proceeded with an elaboration on terminologies of collective action, on the reasoning for including collective action in resource mobilization, and on different indicators that could be used for resource mobilization strategies.
9
UNEP/CBD/SBI/1/INF/20Page 10
46. Mr. Echeverria presented the impact of collective action in Guatemala, emphasizing the importance for Governments to recognize and strengthen collective management. It was in this context that the Dialogue Workshop on Assessment of Collective Action of Indigenous Peoples and Local Communities in Biodiversity Conservation and Resource Mobilization would be held in Panajachel, Guatemala from 11 to 13 June 2015. The objective of the workshop, he recalled, was to improve the understanding of the value of collective action through an examination of various methodologies and perspectives for documenting and evaluating the contribution of collective action as well as experiences and lessons learned in applying pertinent methodologies.
47. The following points were made by participants in the subsequent discussion: (a) the importance of collective action and the contribution of indigenous and local communities in the context of the financial reporting framework and resource mobilization; (b) the need to include a variety of approaches for assessing collective action; (c) the need to address methodological issues regarding terminology and indicators for collective action, including monetary or non-monetary values; and (d) the need for systematic data collection and methodologies to enhance national governments’ understanding of collective action and to facilitate the development of mechanisms to protect areas under collective management.
48. The work of the meeting was subsequently continued in three break out groups:
(a) The break out group on coefficients continued its work, facilitated by Ms. Gabriela Blatter, by further examining possible the areas of convergence and next steps in particular: (a) meaningful guidance in the short run (basic principles/criteria), and (b) medium- to long-term aims/objectives;
(b) A break out group on negative/harmful expenditures was established and, facilitated by Mr. Carlos Muñoz Piña, tasked to identify the challenges, approaches and next steps for reflecting harmful expenditures in expenditure review;
(c) A break out group on using the SEEA and identifying effective entry points in the BIOFIN work was also established.
49. Summaries of the work of the break out groups, as further considered by the workshop in plenary, are provided in annex I of the present report.
ITEM 4. PLANNED BIODIVERSITY-RELATED INVESTMENTS AND IMPACTS: EX ANTE ASSESSMENTS
50. Following the presentation by the break out groups, Mr. David Meyers from the UNDP BIOFIN initiative presented BIOFIN’s approach to costing NBSAPs. Mr. Meyers introduced the NBSAP costing steps: (a) planning; (b) identifying structure and taxonomy; (c) clarifying NBSAP activities/results; (d) gathering and refining data; (e) analysis; and (f) documentation, reports and synthesis. He pointed to key guidelines for a costable NBSAP: it should include (a) a clear management hierarchy supported by results-based indicators; (b) the management hierarchy should be connected with sectors; (c) defined sector priorities and a phased approach; (d) programmes and activities that are selected based on a cost-effectiveness approach; (e) the definition of sector ownership; and (f) a link to other ongoing government priorities. He also provided guidance on the analysis and documentation steps of the costing exercise, emphasizing the importance of comparing the costs to the quantitative results (and targets) for each activity and to review the priority actions for each strategy.
51. Ms. Armida Andres from the Philippines presented the work undertaken on costing the Philippine Biodiversity Strategy and Action Plan (PBSAP). Ms. Andres provided an overview of the PBSAP framework and the costing process: (a) preparatory work including the estimation of base-year cost of each strategy and associate actions, and the estimation of one-time and recurring costs; (b) convening of a PBSAP costing workshop; and (c) computing for medium and long-term resolution. Ms. Andres
UNEP/CBD/SBI/1/INF/20Page 11
subsequently presented the results on the cost of actions and strategies per thematic area as well as the range of costs associated to the implementation of the PBSAP. The presentation also summarized key lessons learned from the costing exercise: (a) using government accounting structures facilitated incorporation of activities into annual budgets; (b) an increase in demand for valuation information was observed; (c) costing allowed for an iterative process which also led to improvements of the PBSAP; and (d) the engagement of key sectors enabled identification of possible internal funding windows for the PBSAP and generate more support. She stated that the next steps for the Philippines would involve determining the actual financing gap, prioritizing strategies and drafting a resource mobilization plan.
52. Participants subsequently engaged in a dynamic discussion underlining the usefulness of the Philippine experience of costing its NBSAP. The following points were raised in the discussions: (a) the importance of having a national policy for PES; (b) a participatory NBSAP process which included regional and national consultations/focus groups helped make the case for biodiversity as it built a sense of ownership at regional and local levels; (c) the engagement of stakeholders should also target the academic community and organizations, such as NGOs, with large networks; and a management tracking process tool allowed for more targeted funding and results.
53. Mr. Carlos Muñoz, professor at the Mexico Autonomous Institute of Technology (ITAM), presented an analysis of the impacts of the Mexican programme for the payment of hydrological environmental services of forests. Professor Muñoz explained that the objective of the programme was to stop deforestation of forests critical for water shed- related environmental services in Mexico by paying landowners to preserve forestland and avoiding its transformation for other uses. Following an introduction into the context of deforestation in Mexico, he presented the approach and methodology towards determining how much to pay landowners and where to derive the financial sources to support the programme, and subsequently provided an overview of the approach towards measuring effectiveness by measuring the avoided deforestation effect of the programme in an ex ante and ex post model. Professor Muñoz concluded with remarks on the implications of the approach for measuring the impact of other programmes addressing deforestation.
54. The subsequent discussion raised the following points: (a) the case study was an illustrative example of mainstreaming biodiversity and mobilizing domestic resources; (b) the distinction between opportunity cost and leakage; (c) the model for measuring cost effectiveness and its potential inclusion as an additional activity of resource mobilization; (d) the importance for agencies implementing PES programmes to target actors to change their behavior rather than rewarding actors who are already doing good; and (d) the Costa Rican experience of implementing a ban on land-use change which made PES very attractive.
55. Participants subsequently agreed to continue their work in two breakout groups, on collective action (facilitated by Ms. Maria Schultz), and on cost effectiveness (facilitated by Mr. David Meyers). The salient conclusions of these groups, as further considered by the workshop in plenary, are provided in annex I to the present report.
ITEM 5. CLOSURE OF THE WORKSHOP
56. Mr. Lehmann briefly presented planned follow-up activities pursuant to the workshop, explaining that the main body of the report of the workshop would be made available by June 2015, while guidance on existing methodologies and experiences, options for convergence towards and elements of a common methodology, pursuant to paragraph 32 of decision XII/2, would be provided as an annex to the report by July 2015. Based on this annex, practical step-by-step guidance for the reporting framework was planned to be made available by September 2015.
57. Participants were invited to provide feedback on the workshop by completing an evaluation questionnaire. The results of this exercise are provided in annex III of the present report.
11
UNEP/CBD/SBI/1/INF/20Page 12
58. Mr. Rodolfo Lacy Tamayo, Undersecretary of Planning and Environmental Policy of the Ministry of Environment and Natural Resources of Mexico, delivered closing remarks. He stated that COP 13 would focus on biodiversity mainstreaming and on building multilateral agreements with a view to elevating the priority for biodiversity conservation and sustainable use within public policy agendas. Recognizing the importance of resource mobilization for biodiversity conservation, Mr. Lacy stressed that understanding the nature and volume of domestic and international investments would allow countries to assess funding needs and gaps, and target investments into biodiversity according to opportunities and priorities in relevant sectors. It was in this context that the Undersecretary announced a meeting of experts to identify challenges and opportunities for mainstreaming biodiversity in relevant sectors to take place later in 2015.
59. After the usual exchange of courtesies, the meeting was closed at 5:00 p.m. on Thursday, 7 May 2015.
UNEP/CBD/SBI/1/INF/20Page 13
Annex I
SUMMARIES OF THE WORK OF THE BREAK OUT GROUPS
Note: all break out groups reported back to plenary and the summaries provided below reflect further considerations provided at this stage.
1. Breakout group on concepts and definitions of what constitutes biodiversity-related investments
(a) It was noted that existing concepts and classification systems generally refer to the three objectives of the Convention, at least at its top level. As the ultimate focus is universally about achieving transparency of expenditures or funding streams, this could constitute an important starting point for galvanizing methodological convergence.
(b) It was also noted that systems, such as the Classification for Environmental Protection Activities (CEPA) under the System of Economic and Environmental Accounts (SEEA), typically have a hierarchical taxonomy that allows for aggregation and disaggregation, and the identification of relevant entries in the classification. While comprehensive harmonization among different approaches might not be feasible or even useful in the foreseeable future, given that they are designed for specific circumstances and conditions, a useful element of establishing convergence could be to develop a crosswalk or ‘Rosetta stone.’
(c) Such a crosswalk could also be an element towards developing a more cohesive system for assessments related to biodiversity finance, climate finance, and sustainable development finance, with a view to improving the tracking of ‘mainstreaming data.’. The issue whether and how to avoid ‘double counting’ was highlighted in this regard, with a cross-reference being made to the work of the group on coefficients (see below).
(d) The workshop highlighted the importance of building on existing reporting processes and associated datasets, both internationally (e.g., the work of the OECD on the Rio markers as well as of the United Nations Statistics Division on SEEA) and nationally (e.g. regional or national statistical offices implementing the SEEA Central Framework as an international statistical standard). Such enhanced cooperation and coordination with these partners could reduce the need to navigate complexities of different government agencies in the process of data collection, as well as issues of transfer of data ownership and associated buy in, etc.
(e) The group also noted a particular challenge in categorizing and quantifying expenditures that are harmful to biodiversity, due to the technical difficulties in identifying and quantifying harmful incentives as well as the political sensitivities surrounding this topic.2
2. Breakout group on coefficients
The group had its first session on 5 May and finalized its work in its second session on 7 May, addressing how to develop short-term guidance on using coefficients as well as what action could be taken in the longer term in order to achieve convergence of pertinent methodologies. The following points synthesize its conclusions as further considered by the workshop in plenary:
(a) It was recognized that, in the light of the broad range of coefficients applied in existing assessments, for instance in the context of aggregating international biodiversity-related financial resource flows to developing countries by using Rio biodiversity markers 1 and 2, achieving methodological convergence would require a stepwise approach. An initial step could consist in
2 A breakout group on assessing harmful biodiversity-related expenditures convened on 7 May with a view to looking into the issue in more detail.
13
UNEP/CBD/SBI/1/INF/20Page 14
establishing a global set of criteria for assigning coefficients and developing associated national guidance. The points below provide possible elements of such a set of criteria.
(b) It was highlighted that the concept of activities or expenditures ‘indirectly’ related to biodiversity objectives may be misleading in the context of implementing the Strategic Plan and its Aichi Targets. The Strategic Plan and the Aichi Targets also seek to address the underlying causes of biodiversity decline and the direct pressures on biodiversity; for instance, Aichi Target 8 addresses the reduction of pollution as one important driver of biodiversity loss. Associated activities and expenditures that may be perceived as being ‘indirectly’ relevant to top level biodiversity objectives, such as for instance the construction of wastewater treatment plants, would in fact very directly contribute to the implementation of Aichi Target 8. It is therefore important to better identify and understand the different rationales for applying specific coefficients.
(c) In the context of the System of Environmental-Economic Accounting (SEEA) and the Classification of Environmental Protection Activities (CEPA), this observation implies that, from the perspective of the Strategic Plan and the Aichi Targets, several expenditures/activities are relevant to capture that are outside of chapter 6 SEEA CEPA (biodiversity and landscape protection and its four sub-categories) – even while recognizing that chapter 6 will already bring together data from various government institutions. It is therefore important to analyse both expenditures/activities that are ‘directly’ and ‘indirectly’ related, using for instance SEEA CEPA for orientation.
(d) As a general rule, it was recognized that relevant activities should be identified and disaggregated as far as practicable, bearing in mind the trade-off faced between the associated administrative burden and cost, and the wish to collect meaningful information. In this context, the German methodology for assigning Rio biodiversity markers was frequently referenced as being the most accurate from a methodological viewpoint, but perhaps not readily applicable in other circumstances.
(e) If it is too costly to (further) disaggregate, coefficients could be applied to indicate the financial contribution to biodiversity of the specific activity or expenditure.
(f) It was also said that not all activities or expenditures should be analysed at all cost. Boundaries or cut offs to the expenditure review could be defined that are based on relevance of the expenditure, the feasibility of disaggregation, and associated cost and administrative burden.
(g) As a first step towards methodological convergence, it would be important to develop practical national guidance on assigning coefficients, building on existing systems and good practices, and to communicate this guidance with a view to establish transparency and enable replicability.
(h) As a means to assist in the development of national guidance and to enable work on eventually achieving methodological convergence, an indicative checklist could be developed consisting of a sub-set of SEEA CEPA categories that are deemed to be of particular potential relevance for biodiversity purposes, as a starting point for further analysis and disaggregation.
(i) In the medium term, a comparative analysis of existing sets of national guidance on assigning coefficients could be undertaken, and a process could be established towards achieving methodological convergence (e.g. in form of workshops).
3. Breakout group on private sector
The following points synthesize the points highlighted by the group in the plenary session:
(a) The group examined different methodologies and issues related to assessing the contribution of the private sector to biodiversity, addressing short term and longer term approaches to improve the level and quality of reporting by the private sector;
(b) The group identified the various methodologies available for reporting, such as annual reporting by corporations (e.g. Corporate Social Responsibility reports), SEEA environmental protection
UNEP/CBD/SBI/1/INF/20Page 15
expenditure reporting, questionnaires and individual interviews, extrapolation/ estimation models from partial data (e.g. expenditures by private conservation), green capital/natural capital, TEEB for business, corporate natural capital accounting, and embedding Total Official Support for Sustainable Development (TOSSD) in wider reporting;
(c) The group discussed the factors that could explain the low response rate and quality of data reported by the private sector. The group highlighted terminology and methodological issues. There is a need, for instance, to differentiate between mitigation, revenue linked expenses and biodiversity investments;
(d) The group also addressed the political issues surrounding expenditure topics such as whether or not to include offsets in private sector expenditure given that its inclusion may encourage governments to engage in more offsetting rather than undertaking other measures;
(e) While noting the short term urgency to collect data in order to meet the CBD targets and reporting deadline, the group underscored the need for long-term work;
(f) The group discussed approaches to improve the response from the private sector. For instance, enhancing engagement with statistical offices (e.g. SEEA) and clarifying questions related to terminology on what should be included or excluded. For instance, differentiating between additionality and mitigation, and clarifying the difference between compliance, following certain regulations and the business case for investing in biodiversity;
(g) Engage with ‘early movers’ from different sectors and consider the potential for global mandatory ESG reporting (based on a mandate from COP);
(h) It was also suggested to build on existing frameworks, such as the SEEA, the Global Reporting Initiative and TEEB;
(i) The group concluded that some of these suggestions would be a multi-year process and, given the urgency to report to private sector expenditures, approaches with the greatest impact in the short term should be prioritized.
4. Breakout group on assessing impacts in a finance context
The breakout group on assessing impacts in a finance context was held in Spanish and raised the following points in the plenary:
(a) The group identified weak capacity on the local level in many Latin American countries as a significant challenge to the assessment of impacts on biodiversity. These include an absence of science-based baselines to measure impacts, of national monitoring mechanisms and impact indicators. The group also noted weak institutional capacities, funds and technology within countries;
(b) There was general agreement within the group that more technical capacities, as well as human and financial resources are needed to set baselines in the monitoring systems on the ground;
(c) The lack of systematic approaches, providing reliable data with advanced indicators, renders it difficult to share information in the region. The group also referred to Latin American case studies (i.e. Cuba, Ecuador and Costa Rica) that were making progress on methodologies and monitoring units to assess impacts on biodiversity;
(d) Minimizing negative and up scaling positive impacts should be addressed by improving policy coherence through, for instance, articulation of development policies, agriculture/environment agencies and landscapes management;
(e) The group stressed the need for more engagement from political decision makers, in particular in the planning and finance agencies.
15
UNEP/CBD/SBI/1/INF/20Page 16
5. Break out group on harmful expenditures
The breakout group on harmful expenditures raised the following points in the plenary:
(a) The group stressed the importance of the issue within the overall context of the Strategic Plan and its Aichi Biodiversity Targets, making specific reference to Aichi Biodiversity Target 3 on incentive measures, including the recent work undertaken by COP-12, in form of the development of modalities for its effective implementation and the adoption of associated milestones. The classifications for harmful or negative expenditures from the OECD, the World Bank, and the World Trade Organization can serve as references.
(b) It was suggested that the first step could entail an examination of the financial cost of providing subsidies, which are usually well documented within national accounts and can be incorporated into accounting tracking tools.
(c) Noting that the assessment of subsidies’ impact on biodiversity loss and the associated economic cost is a complex task, the group identified possible approaches that could be taken, such as looking at the drivers of biodiversity loss (using BIOFIN workbooks 1a and 1b), identifying and focusing on those sectors that are most harmful to biodiversity.
(d) The group also noted that harmful expenditures often require difficult legal reforms and thus remain a sensitive domestic political issue, and, in this context, a workshop to examine approaches in greater detail, in particular through country experiences and guidance, could be very useful.
6. Breakout group on the SEEA framework
The break out group exchanged experiences and progress made in implementing the SEEA at the national level, studying in particular pertinent Mexican experiences. The following points synthesize the conclusions of the group in plenary:
(a) SEEA provides a good platform for institutionalizing work for countries that have completed the BIOFIN workbook;
(b) The advantage of the SEEA framework is that it provides a stable and regular evaluation with consistent data in the long term;
(c) Noting that the BIOFIN is a very good learning process for countries which builds national capacities, the group encouraged to find ways of linking SEEA and BIOFIN through one streamlined, institutionalized system so that the positive effects of BIOFIN at the national level are sustained over the long term.
7. Breakout group on cost effectiveness
60. The group brainstormed on definitions and possible guidance for countries. The group highlighted the following points in the plenary:
(a) With regard to terminology, the group noted differences between activities and outcomes, efficiency and effectiveness, and identified the broader aspects of cost effectiveness (e.g. opportunity cost, economic impacts);
(b) The group emphasized the need to maximize the benefits of policies at the lowest cost possible while still delivering expected outputs and minimizing opportunity cost. However, there is also a need to consider broader aspects than cost effectiveness such as distributional impacts;
(c) In terms of guidance for countries, it was suggested to follow the NBSAP process by identifying, prioritizing and categorizing the most critical areas, and getting support from key agencies to ensure that the activities get funded;
UNEP/CBD/SBI/1/INF/20Page 17
(d) Begin with the effective tools that are already in place and where we have experience (e.g. Protected Area management effectiveness, conservation programmes), noting that many economic values are not known in countries;
(e) Develop fiscal instruments to improve mechanisms to collect and distribute resources;
(f) The group noted the tradeoff between comprehensiveness and quantitative indicators in the NBSAP process, and advised to do as much costing as possible and developing an action plan with clear, quantifiable targets. NBSAPs should have sustainable financing components (multiple action plans within NBSAPs; within each action plan, activities should be prioritized based on a combination of urgency and special mapping of ecosystem services); geographic and activities-based prioritization;
(g) Experiment by applying new instruments in randomly chosen areas and not in others, and compare results. Implement pilot demonstration sites and, if effective, replicate them;
(h) Engage, from the start, with relevant ministries in the process;
(i) Conduct cost benefit analysis for the strategies where economic data are available. Where economic data is not available, assess contribution to GDP as well as tax revenue.
8. Breakout group on assessing the contribution of collective action by indigenous peoples and local communities
61. The group reviewed recent country experiences and associated lessons learned and, recognizing the upcoming dialogue workshop in Panajachel, Guatemala, as an important opportunity to deepen analysis and mutual understanding, developed a synthesis of its discussion as an input into the work of the dialogue workshop, encompassing the following points:
(a) There was a general recognition that assessing the contribution of collective action by indigenous and local communities constitutes important work: first, because such assessments can enhance the recognition of the important role of many indigenous and local communities as traditional biodiversity stewards, and second, because, in the context of the resource mobilization agenda, such assessments can highlight an important source of resources that could be further mobilized for biodiversity conservation and sustainable use;
(b) The group noted that formal biodiversity policies, if they do not duly reflect the importance of (informal) collective action by indigenous and local communities, may sometimes risk jeopardizing such actions. On the other hand, promoting and harnessing collective action can enhance the effectiveness of formal policies and reduce their cost. It is therefore important to look at the linkages between formal (monetary) resource mobilization activities and collective action so that the two are mutually supportive;
(c) On the issue of monetization of the contribution of collective action, it was noted that such monetization can be useful in some cases in order to enhance visibility and recognition. It can generate a powerful argument to enhance support, as appropriate, of collective action, for instance when based on national income expenditure surveys. In other cases, such monetization may however be considered as (culturally) inappropriate. Methodologies for assessing the contribution of collective action should therefore not prescribe the monetization of such contributions, but they could identify and describe possible approaches for undertaking such monetization when deemed useful and appropriate. It was noted that the financial reporting framework of the Convention allows for reporting on the contribution of collective action both in monetary and in non-monetary terms, and the methodology developed by the Andean Cooperation Treaty Organization (ACTO) provides guidance on undertaking both monetary and in non-monetary assessments;
17
UNEP/CBD/SBI/1/INF/20Page 18
(d) The group underlined the importance of assessments being followed by adequate policy responses. There is a need to operationalize and put in place supportive measures, bearing in mind that such support measures includes measures that enable communities to maintain their traditional lifestyles. Such measures could include strengthening community-based protected areas such as indigenous and community conserved areas (ICCAs) as reflected in the UNEP-WCMC ICCA registry (http://www.iccaregistry.org/ ), as well as giving formal recognition to traditional sacred sites, systems or reward and recognition (not necessarily monetary ones) etc.
(e) The group recognized the important contribution of ACTO, with support of Swedbio, in developing a conceptual and methodological framework for evaluating the contribution of collective action to biodiversity conservation methodology, and noted the ongoing need to further scrutinize and develop pertinent methodologies.
UNEP/CBD/SBI/1/INF/20Page 19
Annex II
INTERNATIONAL TECHNICAL EXPERT WORKSHOP ON IDENTIFYING, ACCESSING, COMPILING AND AGGREGATING DOMESTIC AND INTERNATIONAL BIODIVERSITY-
RELATED INVESTMENTS AND IMPACTS
Compilation and review of methodologies and associated experiences
Contents
1. INTRODUCTION..............................................................................................................................21
Mandate..................................................................................................................................................21
Background............................................................................................................................................21
2. EX POST ASSESSMENTS OF BIODIVERSITY-RELATED INVESTMENTS: ANALYSIS OF MAIN ISSUES. .23
Introduction............................................................................................................................................23
Defining the scope of biodiversity-related activities...........................................................................24
Introduction and general analysis....................................................................................................24
Review of approaches........................................................................................................................25
Opportunities for methodological convergence..............................................................................31
Coefficients and Activities.....................................................................................................................31
Introduction and general analysis....................................................................................................31
Review of methodologies...................................................................................................................33
Options for methodological convergence.........................................................................................36
Private Sector contributions.................................................................................................................37
Introduction........................................................................................................................................37
Review of methodologies...................................................................................................................38
Options for methodological convergence.........................................................................................39
Subnational level expenditures.............................................................................................................40
Indigenous and local communities’ contribution through collective action.....................................41
3. EX ANTE ASSESSMENT OF BIODIVERSITY-RELATED INVESTMENTS.................................................48
Introduction............................................................................................................................................48
Clarification of activities to be costed for the NBSAP........................................................................48
Calculation of biodiversity activity costs.............................................................................................49
Analysis of cost effectiveness and feedback to the NBSAP process...................................................50
Review of national experiences.............................................................................................................50
Conclusion..............................................................................................................................................51
19
UNEP/CBD/SBI/1/INF/20Page 20
4. COMPILATION OF METHODOLOGIES AND APPROACHES...................................................................51
OECD Rio marker methodology..........................................................................................................51
The Biodiversity Finance Initiative (BIOFIN)....................................................................................56
Switzerland.............................................................................................................................................56
United Kingdom.....................................................................................................................................59
France......................................................................................................................................................63
Germany.................................................................................................................................................66
Namibia...................................................................................................................................................69
India........................................................................................................................................................73
Philippines..............................................................................................................................................75
Canada....................................................................................................................................................77
Japan.......................................................................................................................................................78
Denmark.................................................................................................................................................79
EU and the European Commission......................................................................................................80
The System for Environmental-Economic Accounting 2012 (SEEA) and its Classification of Environmental Activities (CEA)...........................................................................................................82
Multi-lateral Development Bank Biodiversity Tracking....................................................................83
Experiences from other sectors.............................................................................................................84
BIBLIOGRAPHY AND REFERENCES.............................................................................................................85
APPENDIX: BIODIVERSITY ACTIVITY CATEGORIES AND CLASSIFICATIONS............................................87
The 20 Aichi Biodiversity Targets........................................................................................................87
Proposed typology of Biodiversity related EU Expenditures............................................................89
EU Biodiversity Activities.....................................................................................................................95
BMZ Sectoral Activities related to Biodiversity.................................................................................96
Private Sector Activities that might relate to BD Financing..............................................................97
SEEA classification of Environmental Activities (CEA)....................................................................97
Classification of Functions of Government (COFOG).....................................................................127
UNEP/CBD/SBI/1/INF/20Page 21
1. INTRODUCTION
MandateIn paragraphs 32 (a) and (b) of decision XII/3, on resource mobilization, the Conference of the Parties to the Convention requested the Executive Secretary to (…)
“initiate technical work, subject to the availability of resources and in close cooperation with Parties as well as relevant international organizations, such as the United Nations Development Programme and the World Bank, by organizing a technical expert workshop on identifying, accessing, compiling and aggregating domestic and international biodiversity-related investments and impacts, with a view to (i) presenting, sharing and reviewing existing national experiences; (ii) assessing experiences and methodologies applied in other sectors with a view to identifying opportunities for methodological transfer; and (iii) identifying options for convergence towards, and possible elements of, a common methodology;” and to
“make the report of the workshop referred in paragraph 32 (b) above available as an element of voluntary guidance for Parties, with a view to facilitating financial reporting on domestic expenditures and the development of national finance plans;”
BackgroundIn the same decision, the Conference of the Parties adopted a set of targets for resource mobilization, with a view to achieving an overall substantial increase in total biodiversity-related funding for the implementation of the Strategic Plan for Biodiversity 2011–2020 from a variety of sources, namely:
a) Double total biodiversity-related international financial resource flows to developing countries, in particular least developed countries and small island developing States, as well as countries with economies in transition, using average annual biodiversity funding for the years 2006-2010 as a baseline, by 2015, and at least maintain this level until 2020, in accordance with Article 20 of the Convention, to contribute to the achievement of the Convention’s three objectives, including through a country-driven prioritization of biodiversity within development plans in recipient countries;
b) Endeavour for 100 per cent, but at least 75 per cent, of Parties to have included biodiversity in their national priorities or development plans by 2015, and to have therefore made appropriate domestic financial provisions;
c) Endeavour for 100 per cent, but at least 75 per cent, of Parties provided with adequate financial resources to have reported domestic biodiversity expenditures, as well as funding needs, gaps and priorities, by 2015, in order to improve the robustness of the baseline;
d) Endeavour for 100 per cent, but at least 75 per cent, of Parties provided with adequate financial resources to have prepared national financial plans for biodiversity by 2015, and that 30 per cent of those Parties have assessed and/or evaluated the intrinsic, ecological, genetic, socioeconomic, scientific, educational, cultural, recreational and aesthetic values of biological diversity and its components;
21
UNEP/CBD/SBI/1/INF/20Page 22
e) Mobilize domestic financial resources from all sources to reduce the gap between identified needs and available resources at domestic level, for effectively implementing by 2020 Parties’ national biodiversity strategies and action plans, in accordance with Article 20;
In the same decision, Parties also adopted a financial reporting framework and invited Parties and other Governments to report thereon, by 31 December 2015, providing baseline information and reporting on their contribution to reach the global financial targets as reproduced above.
The Conference of the Parties also recalled that the national resource mobilization should include, as appropriate, the design and dissemination of a country-specific resource mobilization strategy in the framework of updated national biodiversity strategy and action plans. In this context, it noted with appreciation the work of the Biodiversity Finance Initiative of the United Nations Development Programme and invited UNDP/BIOFIN to continue and further upscale its work with interested Parties.
With the notable exception of the OECD DAC monitoring of external development finance targeting environmental objectives through its Creditor Reporting System and the Rio markers, methodologies for assessing biodiversity-related funding streams are in early stages of development. Work is already under way in a joint OECD ENVIRONET and WP-STAT Task Team to improve the Rio marker methodology, including by improving guidance for assigning markers and for assessing multilateral contributions. Work is also under way, in various stages and levels, to develop methodologies for assessing funding streams from other sources, such as domestic official outlays at various government levels, as well as funding from the private sector. This includes work at regional and national levels, both in developed and developing countries, including in the 19 – and soon 29 – core countries receiving financial and technical support from UNDP/BIOFIN (an updated BIOFIN workbook and related tools have been just released).
In the light of the above, the stock taking of existing methodologies, based on the ongoing work as described above, and their further development or improvement is important for two reasons:
First , in order to provide methodological guidance to Parties in meeting their financial reporting requirements by the end of 2015 as foreseen in the decision of the Conference of the Parties referenced above, including the reporting of domestic biodiversity expenditures as well as funding needs, gaps and priorities (which is a separate financial target). Reporting on funding needs, gaps and priorities has been identified as a challenge in particular for developing country Parties because of the existing methodological and data deficiencies.3
And second, because such methodologies, in particular on the assessment of funding needs, gaps and priorities, are critical steps in the development of effective national resource mobilization strategies or finance plans, and are identified as such in the UNDP/BIOFIN toolbox and guidance. The development and implementation of such strategies or plans is critical for the national implementation of Aichi Biodiversity Target 20 on resource mobilization and the associated financial targets, and is the ultimate objective of BIOFIN.
Document structure and objectives
Based on the deliberations of the technical expert workshop on identifying, accessing, compiling and aggregating domestic and international biodiversity-related investments and impacts, held in Mexico City from 5 to 7 May 2015, the present document, in sections 3 and 4 below, provides an initial review of methodologies, currently under development or implementation, that are relevant for completing the CBD Financial Reporting Framework and the development of national resource mobilization strategies. Section
3-? See submission from India commenting on the first draft of the revised financial reporting framework.
UNEP/CBD/SBI/1/INF/20Page 23
5 provides a compilation with full descriptions of the methodologies and approaches. Section 6 provides references, while the appendix provides relevant classifications discussed in the document.
Section 4 below provides an analysis of the main methodological issues identified in undertaking ex post assessments of biodiversity-related investments, namely:
Defining the scope of “biodiversity-related ” activities Defining coefficients for activities indirectly related to biodiversity Assessing financial contributions to biodiversity from the private sector Undertaking Subnational level assessments Assessing the contribution of collective action of indigenous and local communities
The section provides short summaries of pertinent methodologies, based on input from relevant partners, seeks to identify common features and critical differences, as well as possible areas of convergence towards (elements of) a common methodology. It also provides indicative next steps to be taken to address critical (data and methodological) gaps and challenges.
Accordingly, section 5 below provides an initial analysis of main themes in undertaken ex ante assessments, namely, costing the biodiversity-related activities foreseen in revised NBSAPs. It seeks to identify approaches for clarification of activities to be costed, the calculation of the cost of biodiversity-related actions, and an analysis of cost-effectiveness and feedback to the NBSAP process.
2. EX POST ASSESSMENTS OF BIODIVERSITY-RELATED INVESTMENTS: ANALYSIS OF MAIN ISSUES
Introduction Quantifying the flow of international and domestic biodiversity related investments is critical to understanding how to most effectively increase and leverage financial resources to meet national objectives provided in revised National Biodiversity Strategies and Action Plans (NBSAPs), based on the Strategic Plan for Biodiversity 2011-2020. Based on an earlier version of the financial reporting framework, a number of countries have already been gathering and reporting financial information to the Convention, including some of the countries that currently implementing UNDP’s Biodiversity Finance Initiative (BIOFIN)4 and, in this context, provided a wealth of methodological information and associated comments.5 This section will review existing methodologies across a range of ‘horizontal’ issues that were identified to be relevant as currently both posing methodological challenges and opportunities for methodological convergence. These main issues are:
1) Defining the scope of biodiversity-related activities; 2) Assigning coefficients: methods for attributing the percentage of financial resources to activities
that are not 100% attributable to biodiversity;3) Capturing private sector financial flows or expenditures, including non-governmental
organizations and businesses;4) Capturing and attributing regional and local government expenditures;5) Assessing indigenous and local communities’ contributions to biodiversity finance.
4 See http://www.cbd.int/financial/reporting.shtml 5 See http://www.cbd.int/doc/meetings/wgri/wgri-05/information/wgri-05-inf-05-en.doc for a compilation.
23
UNEP/CBD/SBI/1/INF/20Page 24
Defining the scope of biodiversity-related activities
Introduction and general analysisThe first step in determining biodiversity-related financial flows, both internationally and domestically, is to define the scope of biodiversity-related activities. While the Convention provides a definition of biological diversity, in its Article 2, on the use of terms, there is significant variation in which activities are included in the pertinent classifications and conceptualizations as biodiversity-related activities. For instance, divergences may be noted on whether or not a reference is included to activities that seek to implement the third objective of the Convention – the fair and equitable sharing of the benefits arising out of the utilization of genetic resources.
Another source of potential divergence may result from the fact that the financial targets adopted by the Conference of the Parties at its twelfth meeting seek to “achieve an overall substantial increase in total biodiversity-related funding for the implementation of the Strategic Plan for Biodiversity 2011–2020”.6
The Strategic Plan and its twenty Aichi Biodiversity Targets, as a broad framework, includes however actions that would not fall under narrower definitions of biodiversity-related activities.7
Existing methodologies approach this issue by defining ‘tiers’ of relevance, typically defining activities as directly relevant (“principal” or “primary purpose”), and complementing this (at least) with a second tier of indirect relevance (“significant” or secondary purpose).
At the national level, it would seem to be useful to define the appropriate scope of biodiversity-related activities in accordance with the national targets, developed based on the global Strategic Plan for Biodiversity as a flexible framework,8 as reflected in revised national biodiversity strategy and action plans.9 In this sense, flexibility in applying any classification would be needed to allow each country to focus on its own priorities. On the other hand, some standard guidance and boundaries would be an effective means of reducing variability between countries and could help facilitate the tracking of resource mobilization efforts at the global level.
Data availability is another important consideration. In the light of the capacity needed for the collection and analysis of primary data, it will be useful to explore whether pertinent data is already collected through other processes at national level, such as national statistical offices (NSO) or other national organizations that are recognized as statistical authorities. The classifications used in these exercises, while perhaps not providing a perfect mapping of all relevant biodiversity-related expenditures, may then at least provide a useful starting point for analysis.
In this regard, the workshop recognized that it is important to build on existing reporting processes and associated datasets, both internationally (e.g., the work of the OECD on the Rio markers as well as of the United Nations Statistics Division on the System of Environmental-Economic Accounting (SEEA)) and nationally (e.g., regional or national statistical offices implementing the SEEA Central Framework as an international statistical standard). Such enhanced cooperation and coordination with these partners could reduce the need to navigate complexities of different government agencies in the process of data collection, as well as issues of transfer of data ownership and associated buy in.
6 Decision XII/3, paragraph 1; emphasis added.7 For instance, Aichi Target 8 states: “By 2020, pollution, including from excess nutrients, has been brought to levels that are not detrimental to ecosystem function and biodiversity”8 Developed pursuant to decision X/2, paragraph 3 (b). See http://www.cbd.int/nbsap/targets/default.shtml for an compilation of national or regional targets in revised NBSAPs.9 Decision X/2, paragraph 3 (c).
UNEP/CBD/SBI/1/INF/20Page 25
With regard to existing data collection processes, the following international classifications seem to be of particular importance:
(a) As part of the System of Environmental-Economic Accounting (SEEA), the Classification of Environmental Activities (CEA) and its two groups covering the two types of environmental activities; namely, environmental protection activities and resource management activities. The structure of the first group—environmental protection activities—mirrors the structure of the existing Classification of Environmental Protection Activities and Expenditure (CEPA) (United Nations, 2000).
(b) Initially developed by the OECD, the Classification of the Functions of Government (COFOG) classifies government expenditure data from the System of National Accounts by the purpose for which the funds are used. The breakdown of environmental protection (COFOG 05) is again based upon the Classification of Environmental Protection Activities (CEPA).
The remainder of this section will present and review examples of how different processes – national, regional and international – have defined biodiversity-related activities.
Review of approaches
OECD Rio markers methodology
Operated by the OECD Development Assistance Committee (DAC), the Rio markers methodology allows for reporting of bilateral Official Development Assistance (ODA) and Other Official Financing (OOF) funds that contribute to the implementation of the three ‘Rio Conventions’. The Rio markers are built around a similar definition of direct and indirect actions supporting biodiversity, climate change, desertification, as well as general environmental activities. There are specific definitions for each of the Rio markers and activities can be tagged under multiple markers. This makes the summation of multiple markers inappropriate due to double counting, but it does allow a project to be tagged under multiple objectives.
Table 1: The Rio Marker Definition for Biodiversity10
BIODIVERSITY AID TARGETING THE OBJECTIVES OF THE CONVENTION ON BIOLOGICAL DIVERSITY DEFINITION An activity should be classified as biodiversity-related (score Principal or Significant) if:
It promotes at least one of the three objectives of the Convention: (a) the conservation of biodiversity, (b) the sustainable use of its components (ecosystems, species or genetic resources), or (c) the fair and equitable sharing of the benefits arising out of the utilization of genetic resources.
CRITERIA FOR ELIGIBILITY
The activity contributes to
(a) the protection or enhancement of ecosystems, species or genetic resources through in-situ or ex-situ conservation, or remedying existing environmental damage; or
(b) the integration of biodiversity and ecosystem services concerns within recipient countries’ development objectives and economic decision-making, through institution building, capacity development, strengthening the regulatory and policy framework,
10 ? See cases studies below and http://www.oecd.org/development/stats/rioconventions.htm for more information
25
UNEP/CBD/SBI/1/INF/20Page 26
or research; or
(c) the developing countries’ efforts to meet their obligations under the Convention
The activity will score “principal objective” if it directly and explicitly aims to achieve one or more of the above three criteria.
EXAMPLES OF TYPICAL ACTIVITIES 1. Typical activities take place in the sectors of: Water and sanitation Agriculture Forestry Fishing Tourism
Integration of biological diversity concerns into sectoral policy, planning and programmes; e.g.
(a) Water resources protection and rehabilitation; integrated watershed, catchment and river basin protection and management; (b) Sustainable agricultural and farming practices including substitution of damaging uses and extractions by out-of-area plantations, alternative cultivation or equivalent substances; integrated pest management strategies; soil conservation; in-situ conservation of genetic resources; alternative livelihoods; (c) Combating deforestation and land degradation while maintaining or enhancing biodiversity in the affected areas; (d) Promotion of sustainable marine, coastal and inland fishing; (e) Sustainable use of sensitive environmental areas for tourism.
2. Typical non-sector specific activities are: Environmental policy and administrative management Biosphere and biodiversity protection Environmental education/ training Environmental research
(a) Preparation of national biodiversity plans, strategies and programmes; biodiversity inventories and assessments; development of legislation and regulations to protect threatened species; development of incentives, impact assessments, and policy and legislation on equitable access to the benefits of genetic resources. (b) Establishment of protected areas, environmentally oriented zoning, land use and regional development planning. (c) Protecting endangered or vulnerable species and their habitats, e.g. by promoting traditional animal husbandry or formerly cultivated/collected plants or ex-situ conservation (e.g. seed banks, zoological gardens). (d) Capacity-building in taxonomy, biodiversity assessment and information management of biodiversity data; education, training and awareness-raising on bio-diversity. (e) Research on ecological, socioeconomic and policy issues related to biodiversity, including research on and application of knowledge of indigenous people. (f) Supporting development and use of approaches, methods and tools for assessment, valuation and sustaining of ecosystem services.
N.B. Biodiversity (CRS sector code 41030) scores, by definition, principal objective.
The OECD Rio marker definition requires the activity to promote at least one of the Convention’s three objectives: the conservation of biodiversity, sustainable use of its components (ecosystems, species or genetic resources), or fair and equitable sharing of the benefits of the utilization of genetic resources. As
UNEP/CBD/SBI/1/INF/20Page 27
well, it provides a specific distinction for the category of principal: it directly and explicitly aims to achieve one or more of three criteria (see above).
As described above, OECD countries are using the Rio markers to “tag” their international Official Development Assistance (ODA) and Other Official Financing (OOF) commitments in their financial reporting to the OECD. Almost all DAC members used this methodology in reporting their international funding streams in their preliminary financial reporting to the CBD.
Because secondary activities (Marker 1 – significant) are only partially addressing biodiversity outcomes, many countries hesitate to report the full value of these streams as part of their international financial contribution to biodiversity. The question of how to attribute these secondary activities in terms of monetary value is discussed in detail in the following section.
UNDP’s Biodiversity Finance Initiative (BIOFIN) approach to defining biodiversity-related activities
The UNDP Biodiversity Finance Initiative (BIOFIN) is supporting 29 countries in assessing their investments in biodiversity, conduct bottom-up costing of their NBSAP, and develop viable resource mobilization plans (www.biodiversityfinance.net). One key observation from the BIOFIN process is that if the expenditure reviews are to be useful as a background for the resource mobilization plan, the scope of the analysis should parallel the scope of the NBSAP. The revised NBSAP, as per decision X/2 of the Conference of the Parties to the Convention, would include national targets that are developed based on the Strategic Plan and its global Aichi Biodiversity Targets as a flexible framework. While bearing in mind that not all countries necessarily need to develop a national target for each and every global Aichi target, the Aichi targets themselves become then another potential basis for a global biodiversity activity definition.
The taxonomy that BIOFIN uses to define biodiversity-related activities therefore closely parallels the Aichi Biodiversity Targets, and includes: (a) sectoral mainstreaming (e.g., manufacturing, energy, mining, transportation, infrastructure, waste, tourism and other sectors); (b) natural resource use (e.g., forestry, agriculture, grazing, water, fisheries and management of invasive species); (c) protection (creation and management of a range of different categories of protected areas, corridors and buffer zones, ex situ methods, and trade enforcement); (d) restoration (including government private and community efforts on industrial, production, protected, corridor and buffer lands and waters); (e) access and benefits-sharing (including the range of associated activities, such as those related to prior informed consent, mutually agreed terms, benefits sharing and traditional knowledge); and (f) enhancing implementation (e.g., through communication, research, monitoring, legal and financial incentives and other means). The Aichi Biodiversity Targets are presented in the annexes.
Proposed typology of Biodiversity related EU Expenditures
In the case of the EU central budget, a specific tracking methodology for domestic financial flows was developed and will be fully implemented in the current EU budget (2014-2020). A background paper for the 2014 conference on developing a methodology for biodiversity tracking in the EU budget provided definitions and a typology of activities, and associated examples that would fall into the categories of expenditures that would with a primary biodiversity objective or a significant biodiversity objective, or that would not be biodiversity related. The typology of expenditures include the following (see annex for the complete table): (a) protected areas; (b) species conservation measures; (c) infrastructure investments; (d) conservation of genetic diversity; (e) control of invasive alien species; (f) sustainable agriculture and agri-environment measures; (g) sustainable forestry and forest environment measures; (h) sustainable
27
UNEP/CBD/SBI/1/INF/20Page 28
fisheries and marine management actions; (i) tourism and recreation; (j) pollution control; (k) climate change mitigation and adaptation; (l) access and benefit-sharing; (m) research, surveys, monitoring and data management; (n) education, training and capacity-building; and (o) development and implementation of policies, plans, and strategies.
The United Nations System Classification of Environmental Activities (CEA) and the Classification of Environmental Protection Activities (CEPA)
The United National System for Environmental-Economic Accounting 2012 – SEEA Central Framework11 was adopted as an international standard by the United Nations Statistics Division in 2012. It is a conceptual framework for understanding the interactions between the economy and the environment, and for describing stocks and changes in stocks of environmental assets such as forests, as well as non-renewable natural resources such as oil and minerals. It also contains guidance on environment activity accounts, including a Classification of Environmental Activities (CEA), which is composed of two groups. Group I, on environmental protection, mirrors the existing Classification of Environmental Protection Activities and Expenditures (CEPA), which has been an established international classification since 2000,12 while Group II covers resource management, following the Classification of Resource Use and Management Activities (CReMA). Within group I, CEA section 6 covers the protection of biodiversity and landscapes, while other sections may be considered to also contain activities that help contributing to the implementation of the Strategic Plan for Biodiversity 2011-2020.13 For instance, an additional category that is likely to deserve attention with regard to biodiversity expenditure is “The Prevention of Natural Hazards.”
6 Protection of biodiversity and landscapes
Protection of biodiversity and landscape refers to measures and activities aimed at the protection and rehabilitation of fauna and flora species, ecosystems and habitats as well as the protection and rehabilitation of natural and semi-natural landscapes. Separating “biodiversity” from “landscape” protection may not always be practical. For example, maintaining or establishing certain landscape types, biotopes and ecozones and related issues (hedgerows, lines of trees to re-establish “natural corridors”) have a clear link to biodiversity preservation.Excluded is the protection and rehabilitation of historic monuments or predominantly built-up landscapes and the control of weed for agricultural purposes, as well as the protection of forests against forests fire when this responds predominantly to economic concerns. The establishment and maintenance of green spaces along roads and recreational structures (e.g., separating golf courses and other sports facilities) are also excluded.Actions and expenditure related to urban parks and gardens would not normally be included but may in some cases be related to biodiversity: in such cases, the activities and expenditure should be included.
6.1 Protection and rehabilitation of species and habitats
Activities and measures aimed at the conservation, reintroduction or recovery of fauna and flora species, as well as the restoring, rehabilitation and reshaping of damaged habitats for the purpose of strengthening their natural functions. It includes conserving the genetic heritage, recolonizing destroyed ecosystems, placing bans on exploitation, trade, etc., of specific animal and plant species, for protection purposes. Also includes censuses, inventories, databases, creation of gene reserves or banks, improvement of linear
11 http://unstats.un.org/unsd/envaccounting/seea.asp 12 See SEEA 2012 Central Framework, p. 267.13 See SEEA 2012 Central framework, at p. 227. http://unstats.un.org/unsd/envaccounting/seeaRev/SEEA_CF_Final_en.pdf
UNEP/CBD/SBI/1/INF/20Page 29
infrastructures (e.g., underground passages or bridges for animals at highways or railways), feeding of the young, and management of special natural reserves (botany conservation areas, etc.).Activities may also include the control of fauna and flora in order to maintain natural balances, including reintroduction of predator species and control of exotic fauna and flora that pose a threat to native fauna, flora and habitats. Main activities are the management and development of protected areas, whatever the denomination they receive, i.e., areas protected from any economic exploitation or in which the latter is subject to restrictive regulations whose explicit goal is the conservation and protection of habitats. Also included are activities for the restoration of water bodies as aquatic habitats: artificial oxygenation and lime-neutralization actions. When they have a clear protection of biodiversity purpose, measures and activities related to urban parks and gardens are to be included. Purchase of land for protection of species and habitats purposes is included.
6.2 Protection of natural and semi-natural landscapes
Activities and measures aimed at the protection of natural and semi-natural landscapes so as to maintain and increase their aesthetic value and their role in biodiversity preservation.Included is the preservation of legally protected natural objects, expenditures incurred for the rehabilitation of abandoned mining and quarrying sites, re-naturalization of river banks, burying of electric lines, maintenance of landscapes that are the result of traditional agricultural practices threatened by prevailing economic conditions, etc. For biodiversity and landscape protection related to agriculture, the identification of specific State aid programmes to farmers may be the only data source available. Protection of forests against forest fires for the purpose of landscape protection is included.Excluded are measures taken to protect historic monuments, measures to increase aesthetic values for economic purposes (e.g., re-landscaping to increase the value of real estate), as well as protection of predominantly built-up landscapes.
6.3 Measurement, control, laboratories and the like
Measurement, monitoring, analysis activities that are not classified under the preceding items. In principle, inventories of fauna and flora are not covered, since they are classified under protection of species.
6.4 Other activitiesAll other activities and measures aimed at the protection of biodiversity and landscape. These include administration, training, information and education activities specific to the domain, when they can be separated from other activities related to the same domain and similar activities related to other classes.
Additional detail on SEEA is provided in the case studies section.
CEPA is also included in the Classification of the Functions of Government (COFOG). Initially developed by the OECD, this system classifies government expenditure data from the System of National Accounts by the purpose for which the funds are used. The so-called first-level COFOG splits expenditure data into ten “functional” groups or sub-sectors of expenditures (such as defence, education or environmental protection), and second-level COFOG further splits each first-level group into up to nine sub-groups.14 In the case of the environmental protection group, its sub-groups mirror CEPA and hence includes a group on protection of biodiversity and landscape. Again, some of the other COFOR
14 http://www.oecd.org/gov/48250728.pdf .
29
UNEP/CBD/SBI/1/INF/20Page 30
groups or sub-groups, even while serving other primary purposes, may also be deemed to contain activities that contribute to the implementation of the objectives of the Convention and the Strategic Plan for Biodiversity, such as the sub-groups on agriculture, forestry, as well as fishing and hunting, under the economic affairs group.
Regarding data sources and availability at regional or international level, for Europe, annual government finance statistics (GFS) data are collected by Eurostat on the basis of the European System of Accounts (ESA2010) transmission programme, using COFOG. The provision of COFOG level II data has become compulsory with the introduction of ESA2010; however, according to Eurostat, the development of COFOG level II data is not completed in many Member States and data needs to be looked at with this in consideration.15
At the international level, government finance statistics are compiled on an annual basis by the International Monetary Fund (IMF), also using COFOG.16 In the past, the CEPA items under COFOG class 05 on environmental expenditures have not been reported on separately. However, based on the 2014 update of the Government Finance Statistical Manual, the questionnaire for the Government Finance Statistical Yearbook was redesigned and will now provide an avenue to report thereon, including on item 05.4 on biodiversity and landscape protection.17
Addressing harmful expenditures
Biodiversity-harmful expenditures are those expenditures include all direct and indirect expenditures that are counter to national biodiversity goals and objectives, and/or counter to the conservation, sustainable use and/or equitable benefits sharing of biodiversity. Some examples of biodiversity-harmful expenditures include expenditures that promote the spread of invasive alien species; subsidies that promote the overuse of chemical pesticides and fertilizers; national investments and fiscal policies that support harmful practices within protected areas; or investments in infrastructure that have harmful impacts on the habitats of key species. Methodologies for expenditure reviews typically do not include an analysis of harmful expenditures, and the scope to which this can be done at a national level is still under debate and testing.
At its twelfth meeting, the Conference of the Parties to the Convention adopted milestones for the full implementation of Achi Biodiversity Target on incentive measures including incentives that are harmful to biodiversity.18 The milestones inter alia call for the finalization, by 2016, of national analytical studies that identify candidates for elimination, phase-out or reform of incentives, including subsidies, harmful for biodiversity. In this regard, a recent report from France provides a detailed example of the challenges and opportunities of evaluating harmful subsidies.19 As the milestones are silent on the specific format of these studies, they could be undertaken in conjunction with national expenditure reviews with a view to generating synergy and avoid the duplication of work.
15 http://ec.europa.eu/eurostat/statistics-explained/index.php/Government_expenditure_by_function_%E2%80%93_COFOG 16 http://www.imf.org/external/Pubs/FT/GFS/Manual/2014/gfsfinal.pdf .17 http://www.imf.org/external/pubs/ft/gfs/manual/gfs-qtca.htm .18 Decision XII/3, paragraph 21 and annex I.19 https://www.cbd.int/doc/strategic-plan/2011-2020/summary_biodiversite_traduction_en_01032012.pdf (English version).

UNEP/CBD/SBI/1/INF/20Page 31
Opportunities for methodological convergenceExisting concepts and classification systems generally refer to the three objectives of the Convention, at least at its top level. As the ultimate focus is universally about achieving transparency of expenditures or funding streams, this could constitute an important starting point for galvanizing methodological convergence.
The workshop highlighted the importance of building on existing reporting processes and associated datasets, both internationally (e.g., the work of the OECD on the Rio markers as well as of the United Nations Statistics Division on SEEA) and nationally (e.g. regional or national statistical offices implementing the SEEA Central Framework as an international statistical standard, or using COFOG for statistical analysis of government expenditures). Such enhanced cooperation and coordination with these partners could reduce the need to navigate complexities of different government agencies in the process of data collection, as well as issues of transfer of data ownership and associated buy in, etc.
These systems, such as the Classification for Environmental Protection Activities (CEPA) under the System of Economic and Environmental Accounts (SEEA), typically have a hierarchical taxonomy that allows for aggregation and disaggregation, and the identification of relevant entries in the classification. While comprehensive harmonization among different approaches might not be feasible or even useful in the foreseeable future, given that they are designed for specific circumstances and conditions, a useful element of establishing convergence could be to develop a crosswalk or ‘Rosetta stone.’
Such a crosswalk could also be an element towards developing a more cohesive system for assessments related to biodiversity finance, climate finance, and sustainable development finance, with a view to improve the tracking of ‘mainstreaming data.’ The issue whether and how to avoid ‘double counting’ was highlighted in this regard, with a cross-reference being made to the work of the issue on coefficients (see below).
In practice, and as a means to assist in the development of national guidance and to enable work on eventually achieving methodological convergence, an indicative checklist could be developed consisting, in addition to and beyond the sub-class on ‘protection of biodiversity and landscape protection’, of a sub-set of SEEA CEPA categories or COFOG classes that are deemed to be of particular potential relevance for biodiversity purposes, as a starting point for further analysis and disaggregation.
In so doing, there would be need to provide guidance on where to determine the “cut-off” point for excluding activities from the secondary biodiversity category – that is, a determination of what is truly “out of scope” is needed. Furthermore, a system for attribution (coefficients) of secondary activities would need to be established (see next section).
The twenty Aichi Biodiversity Targets would provide a useful starting point for determining whether ‘indirect’ or ‘secondary’ activities and associated expenditures are ‘in scope.’ For the national analysis, the ‘crosswalk’ above could be further fine-tuned in the light of the national targets as adopted in revised NBSAPs.
Coefficients and Activities
Introduction and general analysisThe statistical approaches mentioned above, as they applied in an accounting context, typically use the concept of ‘primary purpose’ in order to unequivocally assign activities to specific classes. Activities that are relevant for biodiversity but not as a primary purpose would then not appear under the biodiversity
31
UNEP/CBD/SBI/1/INF/20Page 32
sub-class, but under other elements of the classification. From the perspective of the Strategic Plan for Biodiversity 2011-2020, with its strong emphasis on the mainstreaming of biodiversity and its integration into national and local development and poverty reduction strategies and planning processes, such activities would be important and an increase in associated expenditures would actually showcase mainstreaming success. For financial planning and reporting purposes however, such activities are typically assigned (that is, multiplied with) a coefficient smaller than one to reflect their more limited contribution.
For instance, in the case of international funding streams, the Rio Markers use three categories:
2 – Principal objective1 – In scope, significant but secondary contribution 0 – Out of scope; absence of significant contribution
The OECD DAC does not provide guidance on what coefficient to multiply against the secondary commitments. In general, all countries apply 100% of the expenditures associated with Rio Marker 2 (principal). With regard to significant (Rio marker 1) activities, DAC members report using a range of coefficients, as summarized in chart 1 below.
Chart 1: Coefficients used by DAC members for significant Rio marker data
Source: preliminary draft stock take, summary of OECD members survey responses, prepared for the ENVIRONET-WP-STAT Task Team on OECD Rio Markers’ First Experts Meeting on Environment and Development Finance Statistics, 20-21 March 2014.
UNEP/CBD/SBI/1/INF/20Page 33
These coefficients have an important impact – for instance, with regard to international funding, it is mainly the “significant” activities that have contributed to the overall increase in biodiversity-related ODA, as shown in figure 1a below.
To review the methodologies associated with defining and assigning coefficients, the remainder of this section looks at a number of case examples.
Figure 1a: Historical biodiversity ODA tagged using Rio markers by OECD.20
Review of methodologies
France
For France’s review of biodiversity expenditures, the proposed accounting method21 was applied at least to Official Development Aid for direct and indirect commitments. For Rio Marker 2 full funding (100%) was counted, for Rio Marker 1, a table of coefficients was established (see Table 2), and for Rio Marker 0 the funding was not counted.
It is noteworthy that the table below establishes different coefficients for different types or examples of activities. This reflect that different types of activities may inherently contain differing opportunities for biodiversity mainstreaming – e.g. a forest project would provide higher opportunities for mainstreaming (i.e., by promoting sustainable forestry management) that for instance a waste treatment project.
20 http://www.oecd.org/dac/environment-development/BIODIVERSITY-RELATED%20FINANCE%20FEBRUARY%202015.pdf 21 Below is from Methode de Comptabilisation Proposée par l’AFD http://www.fondationbiodiversite.fr/images/stories/telechargement/IPBES/Methode_de_comptabilisation_www_23052014-1.pdf and see AFD Biodiversity 2013-2016 CIT.
33
UNEP/CBD/SBI/1/INF/20Page 34
Table 2: Coefficients used for France’s Biodiversity Expenditures under Official Development Aid for direct and indirect commitments.
Activity Type Examples Proportion of total financing attributable as “favourable to biodiversity”
Projects Rio Biodiversity Marker 2
Protected AreasSupport to Environmental NGOs Biodiversity Trust Funds Direct Budget Assistance for Biodiversity
100%
Projects Rio Biodiversity Marker 1
Sustainable Forest Management REDD+ Sustainable Fisheries ManagementEcological Restauration
80%
Projects Rio Biodiversity Marker 1
Agro-ecology Pastoralism and nomadic livelihoods Organic and Fair Trade Supply Chains Sustainable watershed management Water treatment Integrated water systems management
30%
Projects Rio Biodiversity Marker 1
Urban biodiversity development Responsible waste treatment Reduced impact waste Credit availability for environment (non-climate related)
5%
Communication Activities with a biodiversity component 50% Knowledge generation Studies dedicated to biodiversity 100%
Switzerland
As part of its submission of the preliminary reporting framework to the CBD, Switzerland has provided feedback for both international and domestic expenditure reporting,22 including a guidance table on the assignment of a “BD-factor” against the total expenditure of an activity in order to calculate the fraction that is attributable to biodiversity.
Table 3. The BD-factor identified by Switzerland in their 2012 CBD submission.23
ESTIMATED RELEVANCE FOR THE CBD OBJECTIVES BIODIVERSITY FACTOR
Value (0-1) %BUDGETARY ITEM SUPPORTS CBD’S OBJECTIVES TO ITS FULL EXTENT
1.00 100%
BUDGETARY ITEM SUPPORTS CBD’S OBJECTIVES SIGNIFICANTLY
0.75 75%
ABOUT HALF OF THE BUDGETARY ITEM SUPPORTS CBD’S OBJECTIVES
0.50 50%
BUDGETARY ITEM CONTRIBUTES TO CBD’S OBJECTIVES 0.25 25%
22 See http://www.cbd.int/financial/reporting.shtml 23 http://www.cbd.int/financial/doc/switzerland-funding-biodiversity-en.pdf
UNEP/CBD/SBI/1/INF/20Page 35
FOR THE SMALLER PARTA MINOR PART OF THE BUDGETARY ITEM CONTRIBUTES TO CBD’S OBJECTIVES
0.10 10%
A MARGINAL PART OF THE BUDGETARY ITEM CONTRIBUTES TO CBD’S OBJECTIVES
0.05 5%
Germany
As with other countries, Germany applied 100% of the expenditures for Rio Marker 2 activities. Marker 1 activities have to contribute to at least one of the three objectives of the CBD, and have to be included in project planning, implementation and monitoring (with one or more specific indicators). The analysis then only counts those parts of each sectoral project that were specifically directed to biodiversity (one of the three objectives). This approach differs from the standard coefficient approach in that it does not seek to place activities into categories and then assign coefficients but examines the detailed expenditures of each project to determine the amount to attribute to biodiversity.24
India
India divided up its analysis of budgets into core, non-core, and peripheral funding.
“Core”: this is direct biodiversity funding from the Ministry of Environment, Forestry and Climate Change (MoEFCC) that has “direct and immediate biodiversity impact”. This includes funding for agencies that directly and purposefully consider biodiversity within their mandates.
“Non-Core: this is budget from the MoEFCC that is non-direct. This includes activities such as “pollution, hazardous substances management, etc., which facilitate biodiversity conservation of river streams, wetlands”
“Peripheral”: this is budget for biodiversity relevant schemes of Ministries/Departments other than the MoEFCC.
Core funding is attributed at 100% of the budget (similar to Rio Marker 2 attribution) and both Non-Core and Peripheral budgets were subject to multipliers once the associated schemes were placed into multiplier categories (see Table 4). The table presents the number of schemes that were attributed to each of the Multiplier categories.
Table 4 Multiplier values and the number of Schemes attributed to each multiplier category in India.25
Multiplier 0.002 0.010 0.017 0.020 0.050 0.055 0.100 0.150 0.250 0.900% 0.2 1 1.7 2 5 5.5 10 15 25 90
Number of schemes (n=77)
1 50 1 1 10 1 7 1 1 4
What is noticeably different with this attribution table – in comparison to France and Switzerland – is that there is a preponderance of low values that are all under 10%. This allows for small amounts of very large “Peripheral” programs to be counted towards biodiversity. Given the very high number of schemes 24 An analysis of Germany’s international expenditures on biodiversity that is detailed in the report Committed to Biodiversity: Germany’s International Cooperation in Support of the Convention on Biological Diversity for Sustainable Development. Federal Ministry for Economic Cooperation and Development (BMZ) and Federal Ministry for the Environment, Nature Conservation, Building and Nuclear Safety (BMUB)25 India’s 5th National Report to the CBD
35
UNEP/CBD/SBI/1/INF/20Page 36
attributed to the 1% category (50 of 77), it appears that having a category this low (1%) was found valuable to the India team.26
EU Biodiversity Tracking
The European Commission has recommended the use of 40% coefficient for reporting of Rio Marker 1 expenditures in its budget and in Member State contributions. A recent review of biodiversity tracking in the EU budget has been released and ongoing follow-up work is continuing.27
Options for methodological convergenceIn the light of the broad range of coefficients applied in existing assessments, for instance in the context of aggregating international biodiversity-related financial resource flows to developing countries by using Rio biodiversity markers 1 and 2, achieving methodological convergence will require a stepwise approach. An initial step could consist in establishing a global set of criteria for assigning coefficients and developing associated national guidance. The points below provide possible elements of such a set of criteria.
As explained above, the concept of activities or expenditures ‘indirectly’ related to biodiversity objectives may be misleading in the context of implementing the Strategic Plan and its Aichi Targets. The Strategic Plan and the Aichi Targets also seek to address the underlying causes of biodiversity decline and the direct pressures on biodiversity; for instance, Aichi Target 8 addresses the reduction of pollution as one important driver of biodiversity loss. Associated activities and expenditures that may be perceived as being ‘indirectly’ relevant to top level biodiversity objectives, such as for instance the construction of wastewater treatment plants, would in fact very directly contribute to the implementation of Aichi Target 8. In consequence, it is important to better identify and understand the different rationales for applying specific coefficients.
In the context of the System of Environmental-Economic Accounting (SEEA) and the Classification of Environmental Protection Activities (CEPA), this observation implies that, from the perspective of the Strategic Plan and the Aichi Targets, several expenditures/activities are relevant to capture that are outside of chapter 6 SEEA CEPA (biodiversity and landscape protection and its four sub-categories) – even while recognizing that chapter 6 will already bring together data from various government institutions. It is therefore important to analyse both expenditures/activities that are ‘directly’ and ‘indirectly’ related, using for instance SEEA CEPA or COFOG for orientation.
As a general rule, relevant activities should be identified and disaggregated as far as practicable, bearing in mind the trade-off faced between the associated administrative burden and cost, and the wish to collect meaningful information. In this context, the German methodology for assigning Rio biodiversity markers was frequently referenced as being the most accurate from a methodological viewpoint, but perhaps not readily applicable in other circumstances.
If it is too costly to (further) disaggregate, coefficients could be applied to indicate the financial contribution to biodiversity of the specific activity or expenditure.
It was also said that not all activities or expenditures should be analysed at all cost. Reflecting on a similar observation on the issue of conceptualizing biodiversity-relevant activities (see section above), 26 Given the low numbers for some of the other categories, it may make sense to consolidate categories for the next revision to avoid subjectivity (for example, is it worth debating 1.7% vs 2.0%?). For example, consolidating to 1%, 5%, 10%, 25% (maybe add 50%), and 90% would only exclude 5 schemes (of 77) that could easily be placed in adjacent categories with minimal quantitative impact. 27 See the section above and the report at http://ec.europa.eu/environment/nature/biodiversity/financing_en.htm
UNEP/CBD/SBI/1/INF/20Page 37
boundaries or cut offs to the expenditure review could be defined that are based on relevance of the expenditure, the feasibility of disaggregation, and associated cost and administrative burden.
As a first step towards methodological convergence, it would be important to develop practical national guidance on assigning coefficients, building on existing systems and good practices, and to communicate this guidance through the reporting framework with a view to establish transparency and enable replicability.
In the previous section, reference was made to the development of an indicative checklist could be developed consisting of a sub-set of SEEA CEPA categories or COFOG classes that, while not seeking to achieve biodiversity objectives as its primary purpose, are deemed to be of particular potential relevance for biodiversity objectives, as a starting point for further analysis and disaggregation.
In the medium term, a comparative analysis of existing sets of national guidance on assigning coefficients could be undertaken, and a process could be established towards achieving methodological convergence (e.g. in form of workshops). This could eventually lead to developing the indicative checklist above into a more comprehensive categorization of relevant activities, together with a suggested range of attribution coefficients that can be either based on the 20 Aichi Targets or some other classification system. The UNDP BIOFIN initiative is in the process of establishing a revised biodiversity activity list and this could potentially be used for this purpose. Instead of providing fixed coefficients for each activity class, the guidance could provide a range of values for each activity that would allow a certain amount of flexibility in attribution based on the details of each activity. However, a limited range for each activity type would at least allow a certain level of comparability among countries and provide practitioners with increased ease of analysis.
Private Sector contributions
IntroductionAssessing private sector contributions to biodiversity is one of the more challenging aspects of tracking and planning biodiversity expenditures. There are a few emerging approaches by individual CBD parties as well as with the BIOFIN methodology, some of which will be outlined in this section. In general approaches can be divided into the following:
1) Annual (or periodic) reporting by corporations as required by countries under standard Systems of National Accounts (including SEEA) reporting that include biodiversity elements within “Environmental Protection Expenditures” (part of CEPA) and other classification systems.
2) Systematic periodic questionnaires designed to capture specific biodiversity (or general environmental) expenditure data – these can be conducted in collaboration with the national statistics departments and feed into the SNA / SEEA process.
3) Gathering information from published reports such as annual financial reports and Corporate Social Responsibility (Sustainability) reports. It should be noted that none of the standard CSR reporting standards (i.e. GRI, Carbon Disclosure Project – Forest Section) include biodiversity expenditure indicators but do capture valuable information and could be a source for future collaboration.
4) Extrapolation models built from partial data – this includes any form of modeling that estimates the national expenditure from part or all of the private sector based on an initial set of assumptions (empirical or theoretical).
37
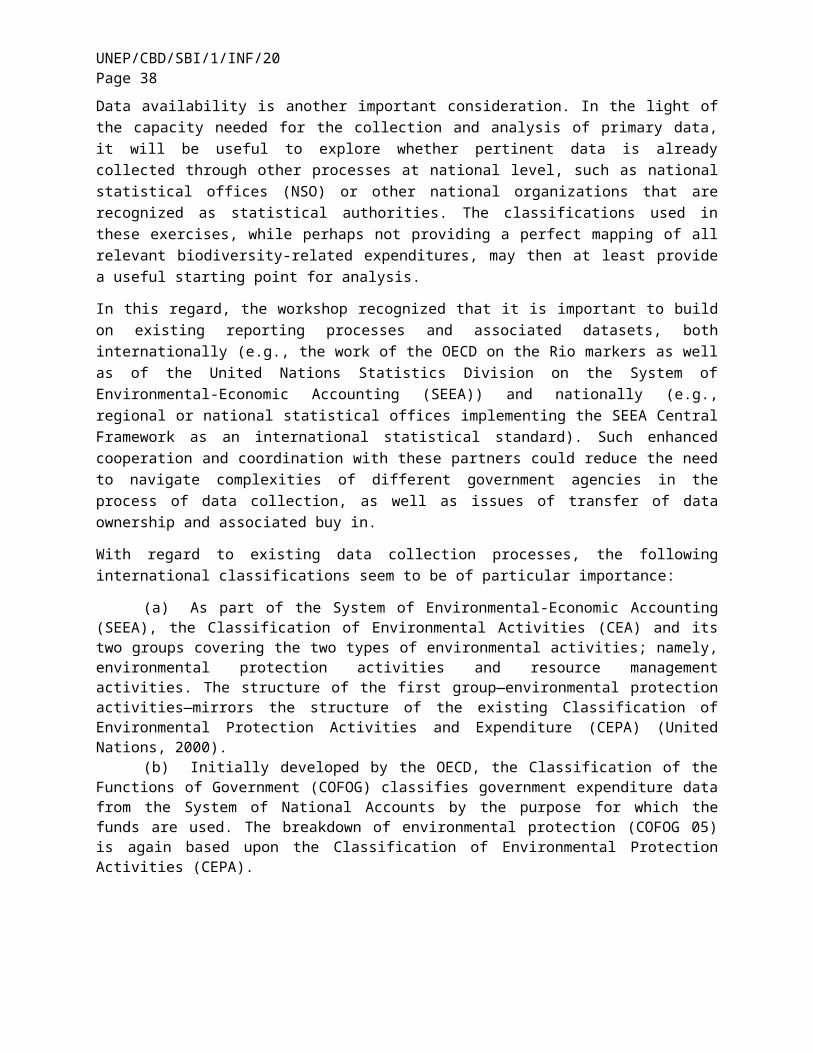
UNEP/CBD/SBI/1/INF/20Page 38
Other developments that could play a supportive role in the future for expenditure reporting include Natural Capital Accounting efforts (such as the Natural Capital Coalition in addition to SEEA), economic valuation studies such as TEEB for Countries, and the new international measure for development support – the Total Official Support for Sustainable Development (TOSSD).
Review of methodologies
Canada
Canada developed a combined methodology to count its national biodiversity investments from the private sector. They considered some successful elements to be the ability to use results from Statistics Canada data from business surveys, the inclusion of data from “user fees” (expenditure from households), the ability to generate data from some of the largest domestic NGOs, and they were able to formulate estimates for academic institutions. Some of the challenges in their approach included the fact that data were based on periodic surveys (not annual) and that there was no specific “biodiversity” category for activities.28 The report provided an “indicative estimate of the scale and scope of resources being mobilized by Canada and Canadians in support of the objectives of the CBD” for the years 2006-2010. The results are presented in the case study below (see Table 17.)
It should be noted that Canada considered user fees and licenses as an expenditure (household expenditure) but it could equally be treated as a transfer and source of revenue for the parks and government that is related to biodiversity. There is no place in the financial reporting framework where revenue of this type from biodiversity is captured. This figure could be very useful for government decision making and is likely to be integrated into the BIOFIN methodology.
Switzerland
Switzerland has made significant steps in assessing the private sector’s contribution to biodiversity expenditures but methodological work is ongoing to improve the methodology. The work is being implemented in collaboration with the Swiss Federal Office for Statistics (BFS) who carry out surveys for specific information collection with the private sector and multiple other sources.29
The BFS cites the following areas of current study: environmental protection global expenditure, corporate environmental protection expenditure, fiscal levies related to the environment, and environmental goods and services. Note that these categories follow the SEEA global standard and are not biodiversity specific but do encompass most biodiversity related activities. The main category of biodiversity expenditure tracking is under the rubric of “Environmental Protection Expenditure” as explained in the previous sections.30
United Kingdom
The United Kingdom has sought to include NGO expenditures in their CBD financial reporting. The methodology is summarized in a Background Methods Paper.31 The following paragraphs summarize these methods.
28 From presentation by Scott Wilson, Environment Canada, WGRI-5, Montreal, Canada, June 19, 201429 See for example: http://www.bfs.admin.ch/bfs/portal/fr/index/infothek/erhebungen__quellen/blank/blank/umweltkonten/02/01.html30 See for example: http://www.bfs.admin.ch/bfs/portal/fr/index/infothek/erhebungen__quellen/blank/blank/umweltkonten/02/01.html31 http://jncc.defra.gov.uk/Docs/biyp2014_E2_TechBG_final.doc
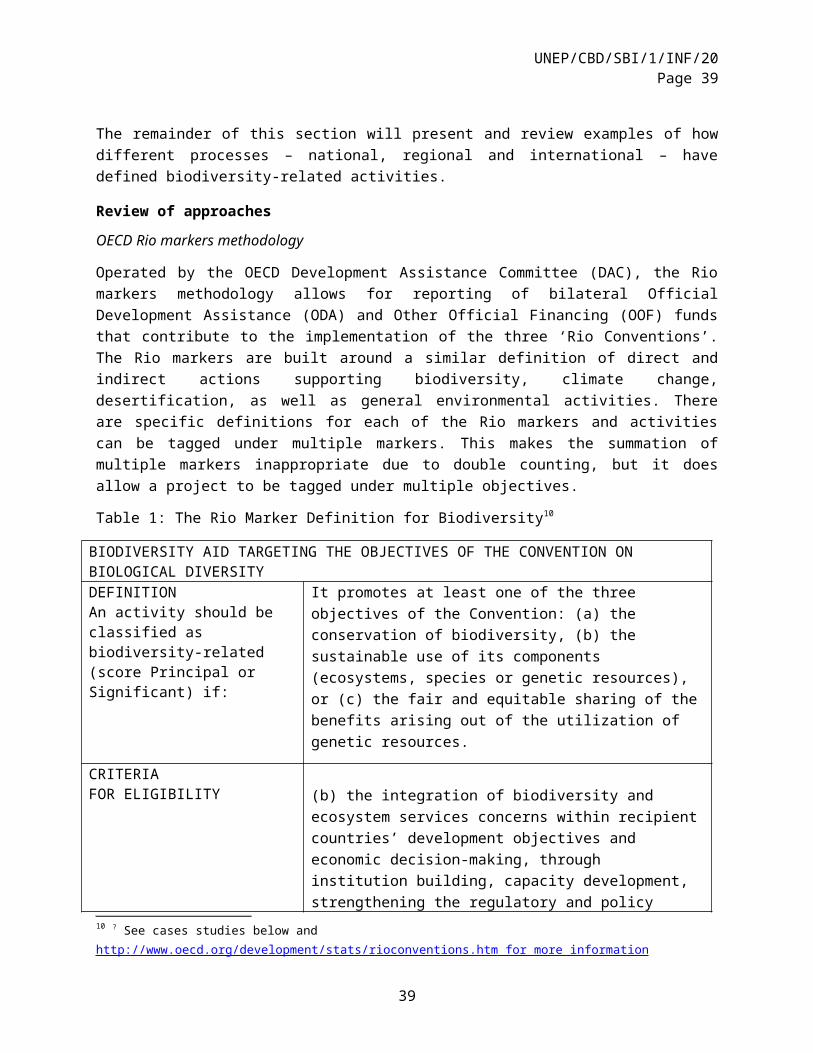
UNEP/CBD/SBI/1/INF/20Page 39
The NGO’s with a primary focus on biodiversity or nature were selected (agency approach). They were able to focus on “Link” members (an association of nature based NGOs) to establish a list of pre-selected NGOs. The sample also included 13 of the 47 Wildlife Trusts with the highest annual turnover in England and Scotland and some other NGOs (not members of Link) that have a biodiversity or nature focus. Data was collected mostly from published NGO annual accounts and financial reports (almost all of these NGOs are registered charities and publish detailed annual financial reports on the Charity Commission website) and, in some cases, data was collected directly from the NGO. Because the public sector data excluded administrative staff costs, those costs associated with administering biodiversity focused programmes were excluded. Given the pre-selection based on “agency”, the analysis was able to include all money spent on 'Charitable Activities' as used as the estimate of annual biodiversity spending.
As with most cases, the risk of double counting must be managed as some of the grants and other payments came from the government to NGOs and these were already counted in the public sector stream. Where the NGOs list specific grants received and the value of these grants in their statement of financial activities, it was possible to identify public sector grants and calculate the proportion of each NGO’s total income from the public. The initial estimate of the NGO’s expenditure on biodiversity is multiplied by the proportion of total income not from the public sector to produce the final estimate. Where published data was inadequate for detailed analysis, and the total expenditure of the NGO was very large (>1% of total) the organization was contacted directly. Data were converted to “real” figures (from nominal) using the UK Gross Domestic Product Deflator.
Japan
Japan examined private sector biodiversity funding through a combination of a survey and interviews. These include the result of a questionnaire survey about CSR spending for biodiversity (Toyokeizai CSR survey). However, answers from companies were highly variable because there was no clear classification of “biodiversity expenses” by each company. Therefore, Japan regards the data as not reliable enough for reporting. In 2015, they hope to conduct interviews with companies to better understand the breakdown of their expenditures and the methodology used for measuring those expenditures. Additionally, based on the results of the interviews, they hope to understand what are effective incentives for companies to fund biodiversity projects and to report that funding accurately. In terms of other expenditure categories (NGOs, foundations, and academia) only academia expenses titled, “Biodiversity Conservation expenses” in “The Environment Research and Technology Development Fund” were counted.
Namibia
Namibia used empirical data combined with a modeling approach to estimate the amount of investment made for biodiversity on private lands. In Namibia, there are many private landowners that manage their land as conservation areas for populations of wild animals. With data gathered from a few landowners, Namibia was able to extrapolate across the entire country based on the total area under private conservation management. For more information see the case study.
Options for methodological convergenceWhile there is a short term urgency to collect data in order to meet the CBD targets and reporting deadline, improving the reporting of private sector financial contributions is long-term work addressing for instance terminology and methodological issues. There is a need, for instance, to differentiate between mitigation, revenue linked expenses and biodiversity investments.
39
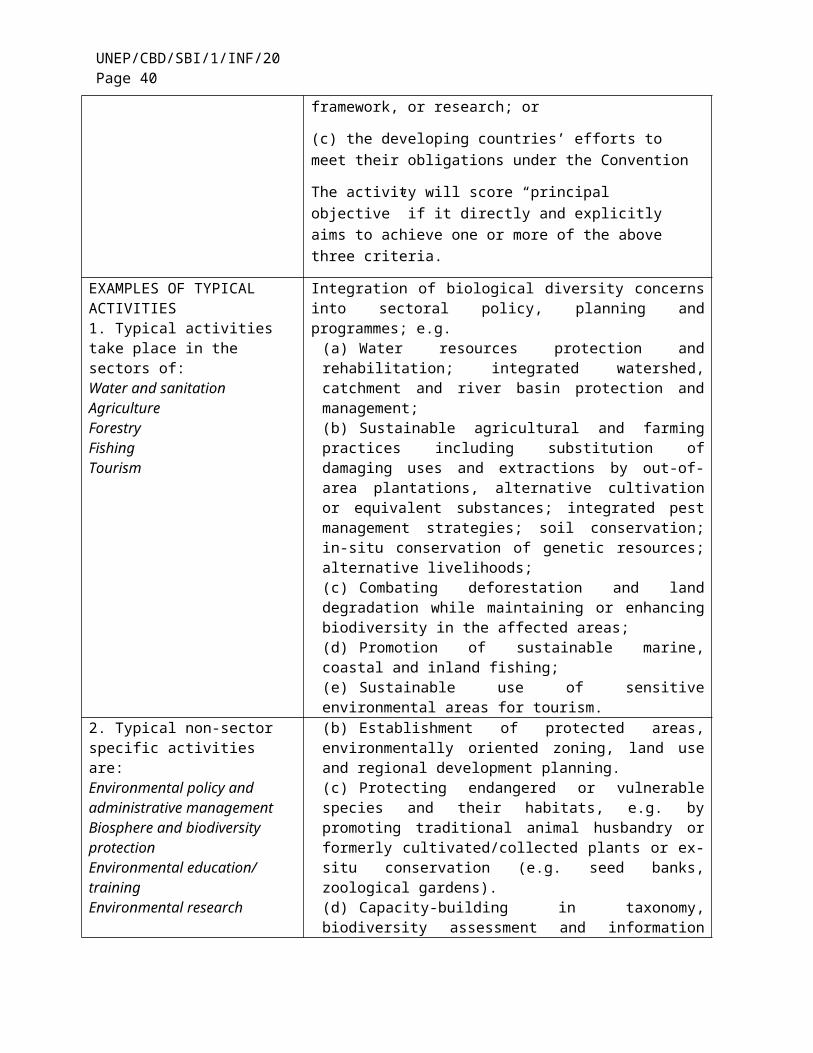
UNEP/CBD/SBI/1/INF/20Page 40
There is also a need to address the political issues surrounding expenditure topics such as whether or not to include offsets in private sector expenditure given that its inclusion may encourage governments to engage in more offsetting rather than undertaking other measures.
Among the various methodologies available for reporting, such as annual reporting by corporations (e.g. Corporate Social Responsibility reports), SEEA environmental protection expenditure reporting, questionnaires and individual interviews, extrapolation/ estimation models from partial data (e.g. expenditures by private conservation), green capital/natural capital, TEEB for business, corporate natural capital accounting, and embedding Total Official Support for Sustainable Development (TOSSD) in wider reporting, there is a need to prioritize approaches with the greatest impact in the short term, given the urgency to report on private sector expenditures.
Potentially useful approaches include enhancing engagement with statistical offices and trying to build on existing frameworks (e.g. on CEPA-related data collections from the private sector) and clarifying questions related to terminology on what should be included or excluded. For instance, differentiating between additionality and mitigation, and clarifying the difference between compliance, following certain regulations and the business case for investing in biodiversity.
It would also be useful to engage with ‘early movers’ from different sectors and consider the potential for global mandatory ESG reporting (based on a mandate from COP).
Subnational level expendituresSubnational expenditures pose challenges to effective financial quantification and reporting for a variety of reasons. The two main reasons being the diffuse nature of the data (financial planning, spending, and accounting) and the complexity of financial flows (transfers, local revenue, etc.)
The IMF governance finance statistics, referenced above, include expenditures from different levels of government, even though those expenditures are not necessarily collected and/or reported on the necessary granularity level with regard to the individual COFOG classes or sub-classes (see the France case study as an example where this is the case).
Approaches to subnational expenditure analysis are provided here from Japan, France and India. In the light of data and capacity limitations, extrapolation techniques were used in Japan and India, and might provide interesting templates for inspiration by other potential users.
Japan
Japan only counted the biodiversity activities that are “directly related” to biodiversity conservation. Double-counting was a challenge for Japan as the central government budget finances state/provisional, local/municipal budgets and academia. As such it was not possible to avoid double counting among those budgets. The main central government category for biodiversity expenditures was termed “Environmental Conservation Expenses” with data compiled by the Ministry of the Environment. For government budgets at the State/ Provincial and Local/Municipal levels, the amount was estimated by calculating the ratio of biodiversity conservation expenses to total expenses of several prefectural governments and then by multiplying that ratio to total subnational government budgets. This is an extrapolation method that allows country-wide estimations based on a sampling of cases. The results of the analysis are included in the case study.
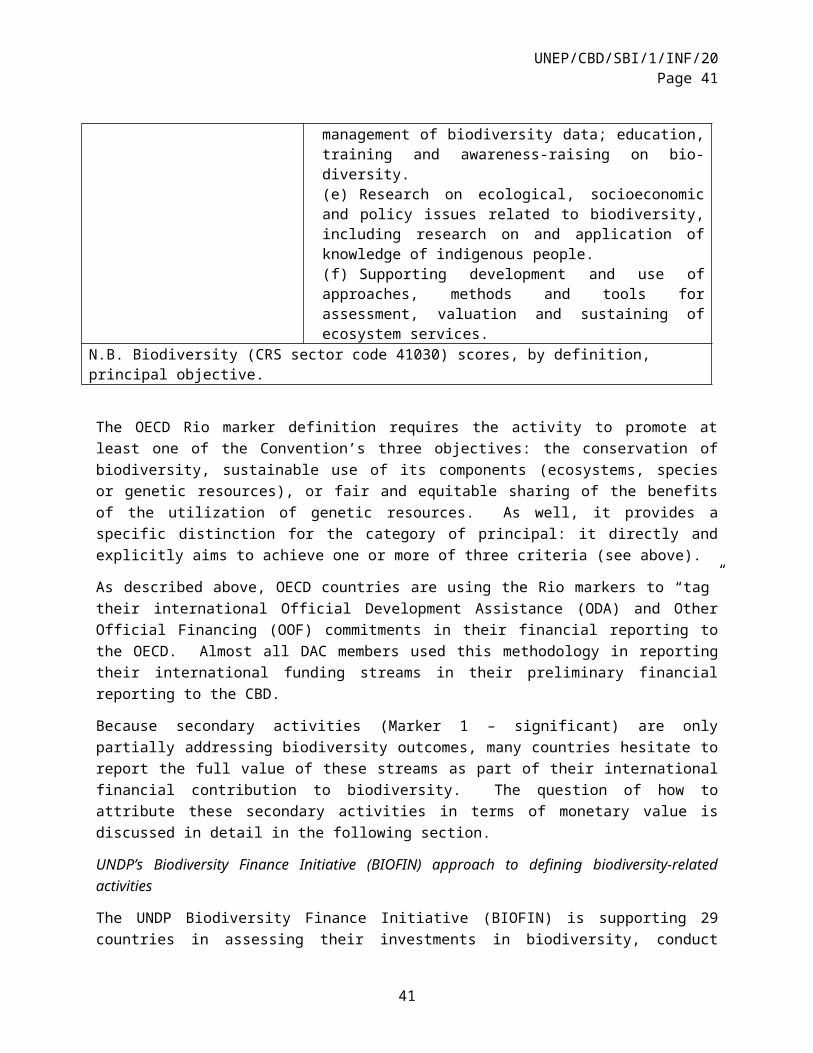
UNEP/CBD/SBI/1/INF/20Page 41
Table 5 Example of Japan’s domestic biodiversity expenditure analysis.
France
France was able to track and report on subnational expenditures at the regional and local levels based on their existing governmental accounting system. All activities are attributed to “protection of biodiversity and landscapes” and there was no attempt to differentiate among primary and secondary activities. Since the activities covered seem to fall into the Environmental Protection Expenditure category (SEEA), the analysis did not include sectoral elements such as sustainable agriculture, forestry, etc.
India
Similarly to Japan, India used an extrapolation approach for estimating state-level budgets for biodiversity. As described above and explained in the case study, India divided budgets into ‘core’, ‘non-core’ and ‘peripheral’. Core funding was allocated at 100%, non-core at 30% and peripheral based on an analysis of the schemes and a multiplier as described above. Based on a similar approach, core and non-core funding for biodiversity was derived from the budgetary allocations made by the State (provincial) Government. Peripheral funding by State Governments was also calculated using multiplier factor (10%) for the programs executed by State-based Departments of the 23 ministries identified at the national level (Department of Animal Husbandry, Fisheries, Agriculture, etc.). See the case study for more details.
Indigenous and local communities’ contribution through collective action
41
UNEP/CBD/SBI/1/INF/20Page 42
A Dialogue Workshop on Assessment of Collective Action of Indigenous Peoples and Local Communities in Biodiversity Conservation and Resource Mobilization was held in Panajachel, Guatemala on 11-13 June 2015. The paragraph below provide the main findings of this dialogue workshop as summarized in the chair’s report of this meeting.
Key outcomes the dialogue workshop on assessment of collective action of Indigenous Peoples and Local Communities
The opportunity for information and experience exchange about collective action was considered valuable by participants.
The concept of collective action was discussed as being “two or more people working cooperatively together towards a specific common goal”. It was strongly affirmed that collective actions by indigenous peoples and local communities are important in contributing to conservation and sustainable use of biodiversity framed in their own cultures and worldviews.
The Parties to the CBD have agreed that collective action shall be reported in the resource mobilization framework that is established under CBD. Participants thought however that collective action can contribute to the achievement of all the Aichi Targets, not only Target 20 on financial resource mobilization. So collective action should be addressed and visualized under all Targets as embedded in the bundle of contributions towards their achievement.
Many tangible examples of collective action were presented, from all continents, ranging from very local to large regional levels, spanning centuries in time, with different degrees of collectivity.
Key outcomes related to values, valuation and measurement of the benefits of collective action and its contribution to biological diversity are presented below.
It was stressed that multiple values need to be recognized in assessing collective action. In some cases the benefits of collective action can be reported in monetary terms, but in most cases they will need to be reported as non-monetary contributions.
It was stressed by many participants that socio-cultural values cannot be measured adequately through monetary valuation, since they are conceived within a cultural framework. This constitutes a different perspective on values through many social roles and social-biological relationships that are specific for each territory and knowledge system.
The need to revalue and protect traditional knowledge was expressed. It was stressed that traditional knowledge can provide an important contribution on equal level to scientific knowledge in decision-making and reporting processes, and that this implies that the many ways of holding and transmitting traditional knowledge need to be included and recognized on equal term in these processes. This is especially important when reporting on collective action by indigenous peoples and local communities related to their contribution to the conservation of biological diversity.
Some participants commented that it is essential for assessments to address the actual contribution of collective action to biodiversity conservation and sustainable use. Collective action can have both positive
UNEP/CBD/SBI/1/INF/20Page 43
and negative effects on biodiversity, especially as pressures increase from other societal drivers of change.
Key outcomes related to methods for measuring and aggregating data related to collective action are presented below.
Many useful examples, experiences, and methods were shared during the dialogue that show how valuation, measurement, aggregation of data and reporting of collective action is being done in specific cases or countries.
These included the Multiple Evidence Base approach, which sets out a process of knowledge mobilization that can bring together scientific and traditional knowledge systems side by side on equal terms, to co-formulate problem issues and responses. This approach is now being applied, in various “bottom-up” contexts. For example, in eco-cultural mapping activities, this approach can provide data suitable for reporting, at the same time as supporting communities’ mobilization and revival of their traditional knowledge.
The ICCA Consortium has many tools and methods suitable for capturing the contribution of collective action: participatory mapping and GIS, video and photo stories, bio-cultural community protocols, and toolkits for environmental monitoring and assessment of threats to their indigenous and community conserved areas.
Community Based Monitoring and Information Systems (CBMIS) is the bundle of methods developed by local communities based on their own monitoring needs. CBMIS are now also, on initiative from indigenous peoples and local communities, used for monitoring of the indicators for traditional knowledge under the CBD. Spatial mapping and modeling are quantitative techniques that can be scaled up to national level in ways that can support consistent reporting. In combination with Earth observation (satellite data), these methods potentially fill knowledge gaps where local data are lacking.
A project “Intensity of land use in indigenous and non-indigenous lands across the globe” is underway led by Charles Darwin University, using a map of “anthromes” (human-modified biomes), to make a global assessment of contributions of indigenous peoples and local communities to Aichi Biodiversity Targets.
Participants noted that top-down methods present particular methodological and ethical challenges in application, such as regarding free prior informed consent (PIC), and they risk failing to capture important local considerations.
There are also experiences of hybrid modes of working, where knowledge from local monitoring is collated into larger-scale information resources (aggregation). Integrated methodologies for monitoring are created in co-development processes both from and for the local and larger scales.
Key outcomes related to indicators and equivalents for reporting collective action in the financial reporting framework are presented below.
Participants discussed a great variety of potential measures that could be used as indicators. Both quantitative and qualitative measures can be used as indicators for reporting collective action in the
43
UNEP/CBD/SBI/1/INF/20Page 44
financial reporting framework.
A framework that has been suggested and recognized in Decision XII/3 is the “Conceptual and Methodological Framework for Evaluating the Contribution of Collective Action to Biodiversity Conservation” (UNEP/CBD/COP/12/INF/7) of the Bolivian Government with the support of the Amazon Cooperation Treaty Organization (ACTO). It proposes a three-module approach, linking geospatial modelling, institutional analysis and ecological assessment. See the dedicated section below for details.
It was discussed that aggregated reporting could be based on resources. When the sustainable use of biodiversity has a monetary dimension, aggregated reporting could be based on this value. This includes the assessments of the value of conservation, costs avoided through collective action, and income from areas under sustainable use and conservation. Other examples mentioned were the time invested or the numbers of people involved in collective action, and the investments and benefits from innovations made by indigenous people and local communities in the use and good management of genetic resources, such as seeds, associated with traditional knowledge.
Participants also said that aggregated reporting could be based on assessments of the effects of collective action in the natural environment, for example the extent of areas under customary sustainable use and conservation, the biodiversity elements of these areas, and status and trends of restoration projects and traditional management of forest and aquatic systems including their ecosystem services and functions. These indicators and measurement processes can be based on a wide range of tools.
They also noted that reporting could be based on metrics relating to process, such as trends in praxis on community based monitoring and information systems, and the existence and implementation of regulations or policies relating to conservation and sustainable use of biodiversity.
Participants thought that multiple values and units and “process-oriented” assessments are essential for reporting collective action – and they affirmed that experiences of such assessments are being developed and performed nationally and locally.
How assessments of collective action are made is as important as what the assessments are expected to visualize and verify in reporting.
It can be difficult to assess the relationships between the different kinds of possible measures, and it should not be assumed that a robust and universal equivalence between the monetary and non-monetary measures exists. Participants expressed that qualitative and quantitative data are complementary sources of information, and both should be used.
Participants expressed concern that simplistic reporting would fail to disaggregate the many aspects that affect costs, benefits and the diverse values of collective action to indigenous peoples and local communities, and society as whole. There is no “universal guideline” on how to address or monitor the important non-monetary issues that most participants view as essential for biodiversity conservation, including worldviews and value systems of indigenous peoples and local communities.
Indigenous peoples and local communities need to be involved in equal, transparent and useful ways in the process of developing assessment methods, as well as the processes of measuring and assessing the
UNEP/CBD/SBI/1/INF/20Page 45
values of collective action. Participants noted than in some countries, there are still gaps in the recognition of the rights of indigenous peoples and local communities.
Conceptual and Methodological Framework for Evaluating the Contribution of Collective Action to Biodiversity Conservation
This proposed methodology is:
Developed per request of the Amazon Cooperation Treaty Organization (OTCA) with the support of the Amazon Regional Programme (ARP)-GIZ, and the IUCN South (International Union for Conservation of Nature) – Resilience and Development Programme (SWEDBIO). This proposal has been developed by Eduardo S. Brondizio, Indiana University-Bloomington, and Krister P. Andersson, University of Colorado-Boulder, with contributions and monitoring of Diego Pacheco, Rector of the University of the Cordillera and Advisor of the Ministry of Foreign Affairs from Bolivia, and the Unit of Mother Earth and Water (UMTA) of the Ministry of Foreign Affairs of the Plurinational State of Bolivia.32
The complete submission of the methodology can be found at: UNEP/CBD/COP/12/INF/7 26 September 2014
The CBD review and summary of methodology can be found at: UNEP/CBD/COP/12/13/Add.5/Rev.1 30 September 201 4
The following are excerpts copied directly from the CBD summary: Report on Activities on Collective Actions and Non-Market-Based Approaches for Resource Mobilization.
32 UNEP/CBD/COP/12/13/Add.5/Rev.1 30 September 201 4
45
UNEP/CBD/SBI/1/INF/20Page 46
Figure 2: Framework for evaluation collective action
The methodology proposed here brings together advances in land change sciences that link – through geospatial analysis – the analysis of environmental change at different scales with the analysis of institutional arrangements that examine the underlying mechanisms of local individual and collective action to protect biodiversity and ecosystems. Figure 3 below illustrates how modules of the proposed methodology could feed into the national reporting system and contribute to the generation of new indicators that are directly relevant for several of the Aichi Biodiversity Targets. From this combination of modules different indicators can be generated to evaluate the relationship between collective action and biodiversity conservation, with respect to resource mobilization.
Proposed methodology for assessing collective action in socio-ecological systems
The proposed methodology will enable member countries to evaluate and quantify the contribution of local people to biodiversity conservation (see Figure 2 in the main report). These modules could also be adapted for use by local communities and user groups. It consists of three modules: (a) a geospatial modelling approach to estimate the area of terrestrial ecosystems protected by local people; (b) an institutional analysis module that complements the geospatial analysis, and (c) an ecological-assessment module that outlines field-based protocols and sampling to validate the geospatial model.
Figure 3: Analytical results linked to possible resource mobilization indicators, National Report questions and specific Aichi Biodiversity Targets
UNEP/CBD/SBI/1/INF/20Page 47
The methodological approach discusses one example of the role of collective action in biodiversity conservation and sustainable use of its components, such as forest areas conserved by local communities through collective action. Further work is needed for assessing the role of collective action in other aspects such as water and biodiversity conservation, protection of environmental functions, food security, among others.
The implementation of these modules allow for the generation of ten indicators of resource mobilization, as summarized in Table 1 below, and the methodology relates to 14 of the 20 (see Figure 3 in the main report) Targets. As mentioned previously, this document takes as an example of the forest area conserved by local people through collective action, and some proxy indicators (labor and public funding equivalents) can be developed as necessary. The remaining indicators are indirectly relevant to resource mobilization in that they can help explain why some indigenous and local communities are more successful in protecting biodiversity—indicators that can help create more effective conservation policies.
47
UNEP/CBD/SBI/1/INF/20Page 48
3. EX ANTE ASSESSMENT OF BIODIVERSITY-RELATED INVESTMENTS: COSTING THE REVISED NBSAPS
Introduction Although a significant number of countries are currently working on costing their NBSAPs, very few countries have so far submitted fully costed NBSAPs to the Convention. Budgeting is not a new topic to most actors in government, since not only do almost all organizations, agencies, ministries and companies establish annual budgets, but they also develop medium and long-term strategic plans with clear budgets.
It is important to note that every country, organization, and business has its own approach to budgeting. As such, with any budgeting initiative, the most important initial question is: “who will be deciding on the budget financing?” For the case of NBSAPs, it is usually the Ministry of Finance (or Planning, etc.) that will make initial decision on basic internal financing. Other potential financial decision makers include line ministries, ministries of planning, international donors, development banks, NGOs, etc. If the NBSAP budgeting process adheres to the national budget process, it has a much greater chance of being effectively integrated into national budgets. In fact, the use of the detailed budgeting codes of a country is one of the best practices promoted by the UNDP BIOFIN initiative.
Clarification of activities to be costed for the NBSAPUNDP’s BIOFIN initiative developed an initial taxonomy of potential biodiversity-related actions based on the Aichi Targets. This taxonomy provides a useful framework for identifying specific activities for which specific costs can be identified. Some examples of how the general taxonomy could be used as a categorization system for costable actions is shown below in Table 6.
Table 6. Examples of how UNDP’s BIOFIN taxonomy can be used as a categorization system for costable actions
Category Specific sector Indicative list of potential costable actions as part of an NBSAP
Sectoral mainstreaming
Transportation and
infrastructure
Avoid areas of key biodiversity importance in siting major infrastructureEnsure the creation of wildlife crossings to minimize impacts on migrationAvoid core areas of protected areas when designing roads and infrastructure
Waste
Improve solid waste facilities to minimize soil and water contamination
Prevent heavy metals from entering aquifers and ground water
Ensure enforcement of septic requirements for coastal resort development
Tourism
Develop a comprehensive tourism plan within national protected areas
Prevent the introduction of invasive alien species through education
Improve fish stocking practices to minimize genetic erosion
UNEP/CBD/SBI/1/INF/20Page 49
Natural resource use
Forestry
Develop land-use plans to conserve high-conservation value forests
Promote forest certification
Create a legal framework that improves the sustainable use of forest resources
Agriculture
Develop a program for attracting beneficial predators and pollinators
Promote integrated pest management and organic agriculture
Transition to drought-resistant crops
Fisheries
Promote locally-managed marine areas
Create incentives to promote sustainable fisheries practices
Develop and implement national fisheries policies and sustainable catch levels
Protection
Protected areas
Establish new protected areas
Improve the management effectiveness of existing protected areas
Create wildlife and connectivity corridors between protected areas
Ex situ and trade
Establish gene bank of key species
Monitor trade in CITES-listed species
In addition to defining activities in a specific manner, there are several other key elements required to prepare for accurate NBSAP costing. These include defining:
1) Scope and scale – for each NBSAP activity, the scope of the activity and the scale of the effort should be identified. Does the activity include the entire country or certain regions? Which regions? What are the quantified results that the activity will produce? For example, if the activity is initially designed as “Expand the PA network for ecological representativeness”, will the activity result in the Aichi Target goal of 17% coverage? Will certain PAs be expanded or will new PAs be created? Since the location of the PA relative to existing pressures will determine the cost of management, the specific location of future PAs may be important input into the costing.
2) Timing of implementation – the timing of both capital investments and recurring costs should be mapped out as part of the costing effort to better plan and finance activities.
3) Responsible actors – it is essential that the responsible actors are identified during the process of NBSAP costing. That is because various actors will have different cost basis for achieving specific results and implementing specific activities. As well, it is essential for resource mobilization goals that the implementing actors are identified during the costing process.
Calculation of biodiversity activity costsThe most common way to determine biodiversity activity costs is to develop a detailed program of activities with clear targets as described above, identify sub activities or budget line items needed to implement the activity – i.e. number of consultant days, amount of fuel, equipment, etc. and produce a
49
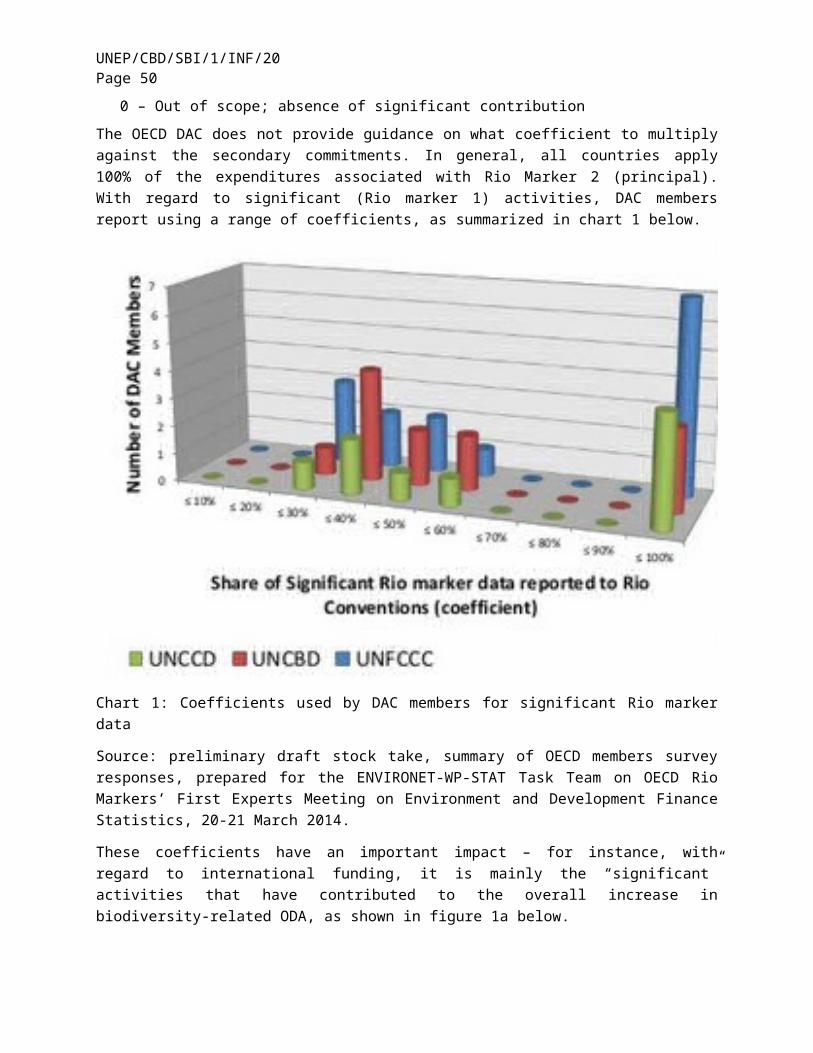
UNEP/CBD/SBI/1/INF/20Page 50
detailed budget activity by activity, input by input. The Philippines have done a comprehensive costing of their NBSAP using this method and details can be found in the case study.
One alternative approach to costing biodiversity-related activities is to build and assess a global database of standardized NBSAP activities, and, using basic models, extrapolate likely costs among countries. Because no standardized costed activity list exists, and because costing of NBSAPs is still at an early stage, this process is considered premature but may be used in the future to rapidly estimate costs.
Analysis of cost effectiveness and feedback to the NBSAP processOne aspect to consider when costing the activities within an NBSAP is cost effectiveness. While planners and policy makers might identify realistic costs associated with each action within the NBSAP, they may also want to consider the cost effectiveness of each action – whether they are getting the best value for the investment. After analyzing various costs associated with NBSAP actions, and after identifying key indicators or results related to these investments, the costing working group may recommend adjustments to the NBSAP itself, by identifying more cost-effective options.
Review of national experiencesSeveral countries have recently completed a comprehensive costing exercise for their NBSAPs. Two examples are presented here – Namibia and The Philippines.
Namibia
Namibia recently completed a detailed costing for implementing their NBSAP, embedded within their recently submitted NBSAP (see https://www.cbd.int/doc/world/na/na-nbsap-v2-en.pdf). The costing report is organized according to strategic goal within the NBSAP, strategic initiative, indicative activities, baseline status for 2013, potential indicators against which progress (and potentially return on investment) can be measured, lead agency, key partners, time frame, and cost. The costing exercise covered 130 different actions, organized into 17 categories across 5 strategic goals. The estimated cost of implementing all 130 actions is N$ 494 million over the next nine years. These figures refer only to the specific activities in the NBSAP, and not to the ministerial operational budget framing them. An informal comparison with the Namibia biodiversity expenditure review (see case study) indicates that the NBSAP costing is likely a significant underestimate of the financing needs for successful implementation.
The Philippines
As part of their participation in BIOFIN, The Philippines has recently completed a comprehensive costing report.33 The costing committee held a national costing workshop of thematic experts from the Government, private sectors, and NGOs. The committee developed specific unit costs for each of the actions within the NBSAP. The costing was conducted across 8 thematic areas – access and benefits sharing; invasive alien species; urban biodiversity; inland wetlands; forest and terrestrial areas; agrobiodiversity; caves and cave systems; and coastal and marine areas. The total cost of implementing all actions ranged from a low estimate of USD 7.5 billion to USD 8.5 billion through 2028. Of this, more than half was allocated to the prevention of habitat loss and avoidance of overexploitation of forest and terrestrial biodiversity.
33 The draft report is available at: https://dl.dropboxusercontent.com/u/86439062/PBSAP%20Costing%20Report_Workbook%202A_March%202015%20to%20share.pdf)
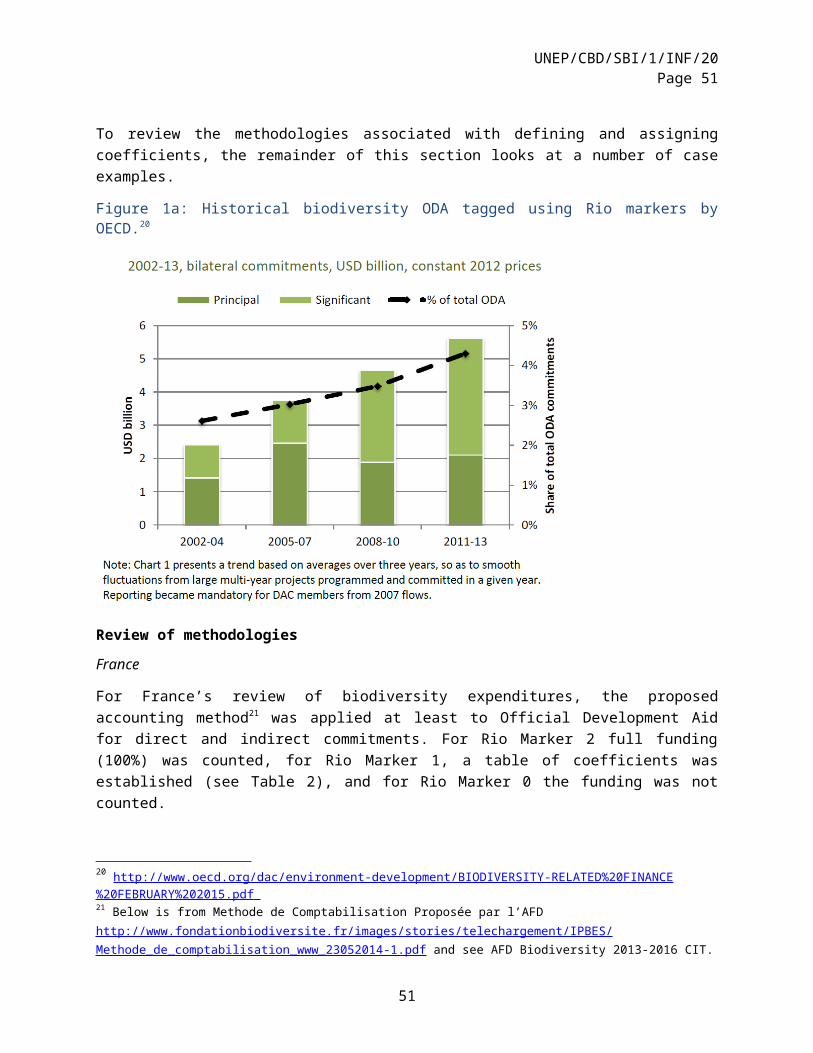
UNEP/CBD/SBI/1/INF/20Page 51
Conclusion The BIOFIN initiative contains one key component focused on developing a strong methodology for costing biodiversity activities including the NBSAP and several BIOFIN country partners are currently engaged in this process. Countries that already have results based budgeting are likely to be well positioned for accurate and effective NBSAP costing, and practitioners could utilize their current government results based budgeting structure as a starting point for preparing the NBSAP costing. The current BIOFIN methodology is available for download at www.biodiversityfinance.net , in the resources section, and will be updated over time.
4. COMPILATION OF METHODOLOGIES AND APPROACHES
OECD Rio marker methodology Recent work to improve the OECD DAC Rio markers is carried out through the Joint ENVIRONET and WP-STAT Task Team to Improve Rio Markers, Environment and Development Finance Statistics. The goal is to ensure that OECD DAC methodologies remain the reference for the international community in measuring ODA and OOF related to climate change, biodiversity, desertification and other environmental concerns.
The primary approach to assessing and tracking international biodiversity-related development finance is the OECD Rio marker methodology. Most of the countries reporting on international development finance for biodiversity to the CBD have cited data directly reported to and collected within the OECD Development Assistance Committee (DAC) Rio Marker database. The Rio Markers are a system of tagging Official Development Assistance (ODA) and Other Official Flows (OOF) commitments in the OECD DAC Creditor Reporting System database. The system is based on four markers, called the “Rio markers”, which were developed to track external development finance targeting the three main UN conventions on global environmental concerns that originated at the Rio Convention in 1992 – the Convention on Biological Diversity (CBD), the Framework Convention on Climate Change (FCCC), and the Convention to Combat Desertification (CCD). The biodiversity, climate change mitigation and desertification markers were introduced in 1998, while the climate change adaptation marker was introduced in 2010. Additionally, a fifth marker, the “environment marker”, was introduced in 1992 to track activities targeting local environmental concerns. The DAC statistical system tracks commitments and disbursements, but reporting is not complete for all disbursement data, although it can be assumed that these track relatively closely the level of commitments with different years.
This section describes the application of the Rio Markers and how they can be used to assist with reporting international financial flows for biodiversity, presents some challenges to the system and presents some areas of current research and development being undertaken by the joint ENVIRONET and WP-STAT task team.
The Rio markers are built around a definition of direct and indirect actions supporting biodiversity, climate change, desertification, and general environmental activities.
An activity may target multiple objectives and can therefore be marked against several Rio markers (e.g. the same activity can target and be marked for climate change mitigation and biodiversity, or for biodiversity and desertification).
51
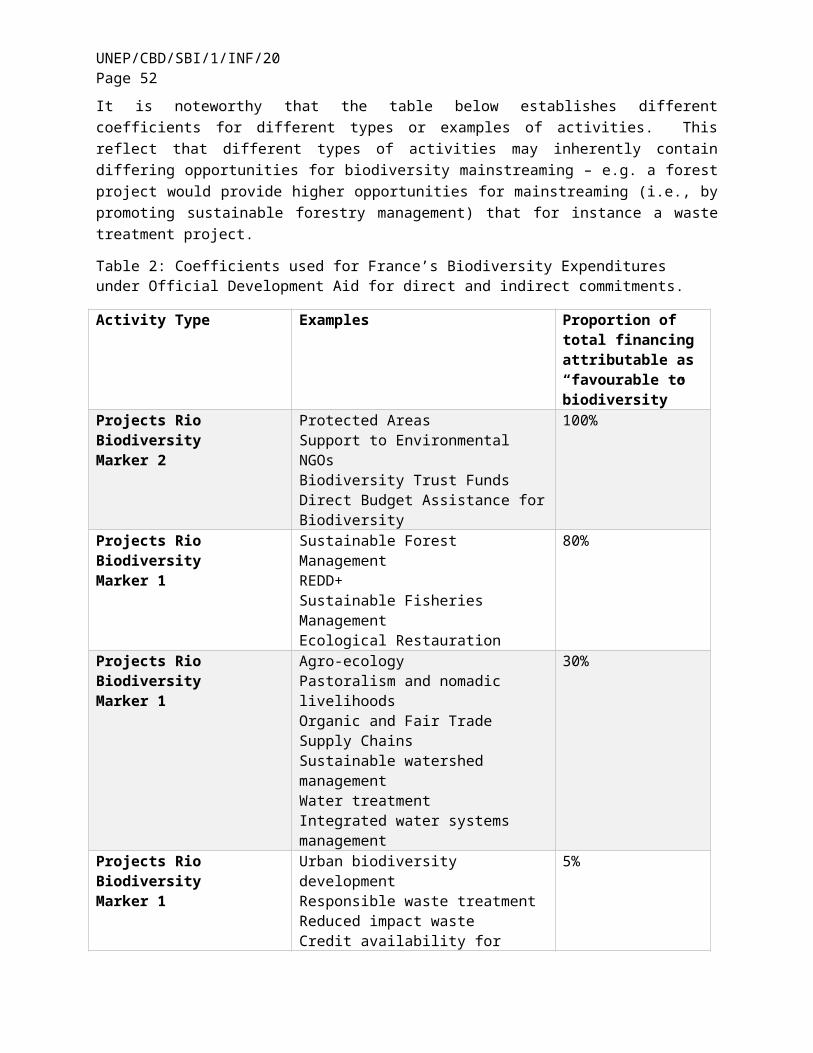
UNEP/CBD/SBI/1/INF/20Page 52
While this allows the multiple environmental policy objectives of an activity to be reflected, this needs to be taken into account when aggregating data across several markers. To avoid double or triple-counting the same activity, separately aggregate figures for biodiversity, climate change mitigation, climate change adaptation and desertification-related development finance should not be added up. Statistical presentations should either be prepared for one marker at a time (and resulting totals for each marker should not be added up) or the overlap should be “treated”.
The full definition of the Biodiversity Rio marker is provided in Table 7 below.
Table 7 The Rio marker Definition for Biodiversity
Biodiversity AID TARGETING THE OBJECTIVES OF THE CONVENTION ON BIOLOGICAL DIVERSITY DEFINITION An activity should be classified as biodiversity-related (score Principal or Significant) if:
It promotes at least one of the three objectives of the Convention: the conservation of biodiversity, sustainable use of its components (ecosystems, species or genetic resources), or fair and equitable sharing of the benefits of the utilisation of genetic resources.
CRITERIA FOR ELIGIBILITY
The activity contributes to
(a) protection or enhancing ecosystems, species or genetic resources through in-situ or ex-situ conservation, or remedying existing environmental damage; or
(b) integration of biodiversity and ecosystem services concerns within recipient countries’ development objectives and economic decision making, through institution building, capacity development, strengthening the regulatory and policy framework, or research; or
(c) developing countries’ efforts to meet their obligations under the Convention
The activity will score “principal objective” if it directly and explicitly aims to achieve one or more of the above three criteria.
EXAMPLES OF TYPICAL ACTIVITIES 1. Typical activities take place in the sectors of: Water and sanitation Agriculture Forestry Fishing Tourism
Integration of biological diversity concerns into sectoral policy, planning and programmes; e.g. (a) Water resources protection and rehabilitation; integrated watershed, catchment and river basin protection and management; (b) Sustainable agricultural and farming practices including substitution of damaging uses and extractions by out-of-area plantations, alternative cultivation or equivalent substances; integrated pest management strategies; soil conservation; in-situ conservation of genetic resources; alternative livelihoods; (c) Combating deforestation and land degradation while maintaining or enhancing biodiversity in the affected areas; (d) Promotion of sustainable marine, coastal and inland fishing; (e) Sustainable use of sensitive environmental areas for tourism.
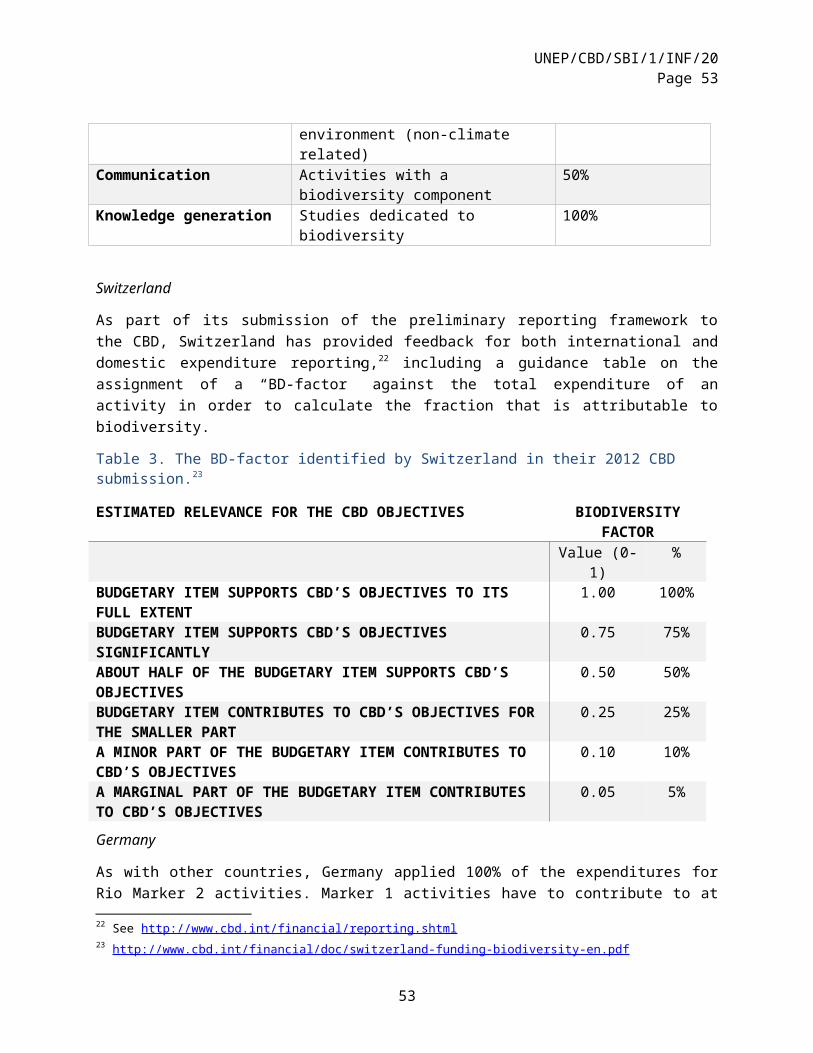
UNEP/CBD/SBI/1/INF/20Page 53
2. Typical non-sector specific activities are: Environmental policy and administrative management Biosphere and bio-diversity protection Environmental education/ training Environmental research
(a) Preparation of national bio-diversity plans, strategies and programmes; bio-diversity inventories and assessments; development of legislation and regulations to protect threatened species; development of incentives, impact assessments, and policy and legislation on equitable access to the benefits of genetic resources. (b) Establishment of protected areas, environmentally oriented zoning, land use and regional development planning. (c) Protecting endangered or vulnerable species and their habitats, e.g. by promoting traditional animal husbandry or formerly cultivated/collected plants or ex-situ conservation (e.g. seed banks, zoological gardens). (d) Capacity building in taxonomy, bio-diversity assessment and information management of biodiversity data; education, training and awareness-raising on bio-diversity. (e) Research on ecological, socioeconomic and policy issues related to bio-diversity, including research on and application of knowledge of indigenous people. (f) Supporting development and use of approaches, methods and tools for assessment, valuation and sustaining of ecosystem services.
N.B. Biodiversity (CRS sector code 41030) scores, by definition, principal objective.
More information on the OECD Rio markers can be found at: http://www.oecd.org/development/stats/rioconventions.htm or http://www.oecd.org/dac/stats/rioconventions.htm
http://www.oecd.org/dac/stats/biodiversity.htm
A training workshop was conducted in September 2014 at the OECD and the presentations are useful for accessing and understanding the data: http://www.oecd.org/dac/environment-development/training-workshop.htm
For further details on interpreting the categories in the database, one can refer to the statistical reporting directives:
o Directives (pdf) (chapters 1 to 6) o Addendum 1 (pdf) (modules A, B and C) o Addendum 2 (pdf) (modules D and E)
An up to date (through 2013) summary report can be found at the following link: http://www.oecd.org/dac/environment-development/BIODIVERSITY-RELATED%20FINANCE%20FEBRUARY%202015.pdf
The Rio Markers form an important tool for donor countries to track their commitments but can also be used by recipient countries to examine external contributions to domestic actions. The following is an example for Fiji, for the year 2006, looking at activities targeting biodiversity as a “principal” or main objective (Rio Marker 2). Data are in million USD.
53
UNEP/CBD/SBI/1/INF/20Page 54
Year 2006biodiversity 2recipientnameE Fiji
Row Labels Sum of usd_commitmentAustralia 0.346368702
REGIONAL NATURAL HERITAGE PROGRAMME 0.346368702Regional Natural Heritage Programme 0.346368702
Japan 0.134929182(blank) 0.134929182
TC AGGREGATED ACTIVITIES 0.134929182New Zealand 0.555656461
Rotahomes Project 0.393487286Rotahome Resettlement Community 0.393487286
Squatter/Informal Settlements Assistance 0.162169175Squatter/Informal Settlements Assistance 0.162169175
United States 0.087(blank) 0.087
Assessment and Enhancement of Marine Conservation Efforts on Fijis Coral Coast. NOAA Oceans Service Program. 0.076MULTINATIONAL SPECIES CONSERVATION FUND, U.S. DEPARTMENT OF INTERIOR, U.S. FISH AND WILDLIFE SERVICE. 0.011
Grand Total 1.123954345
The Rio Marker approach is an important element in that it seeks to clearly define what would be accounted for under “Biodiversity Financing” by using a standard definition that has been reviewed and refined through a strong consultative process and has been used by a very wide array of countries and organizations. One of the current limitations of the Rio Markers is that there is no guidance on how to clearly define and attribute coefficients for activities targeting biodiversity as a “significant” or secondary objective. As such there is wide variation in how those activities that are not primarily targeted towards biodiversity (i.e. tagged “Biodiversity 1”) are attributed financially.
Biodiversity-related ODA by DAC members in 2013*
USD million, bilateral commitments, current prices
Bilateral contributions in 2013
Marker-based statistics, commitments, USD million
Principal objective Significant objective Total
Australia 57.2 261.2 318.4
Austria 14.1 33.5 47.6
Belgium 22.1 147.4 169.5
Canada 1.2 54.3 55.5
Czech Republic
0.1 3.8 3.9
Denmark 0.2 249.3 249.5
EU Institutions
68.2 851.3 919.5
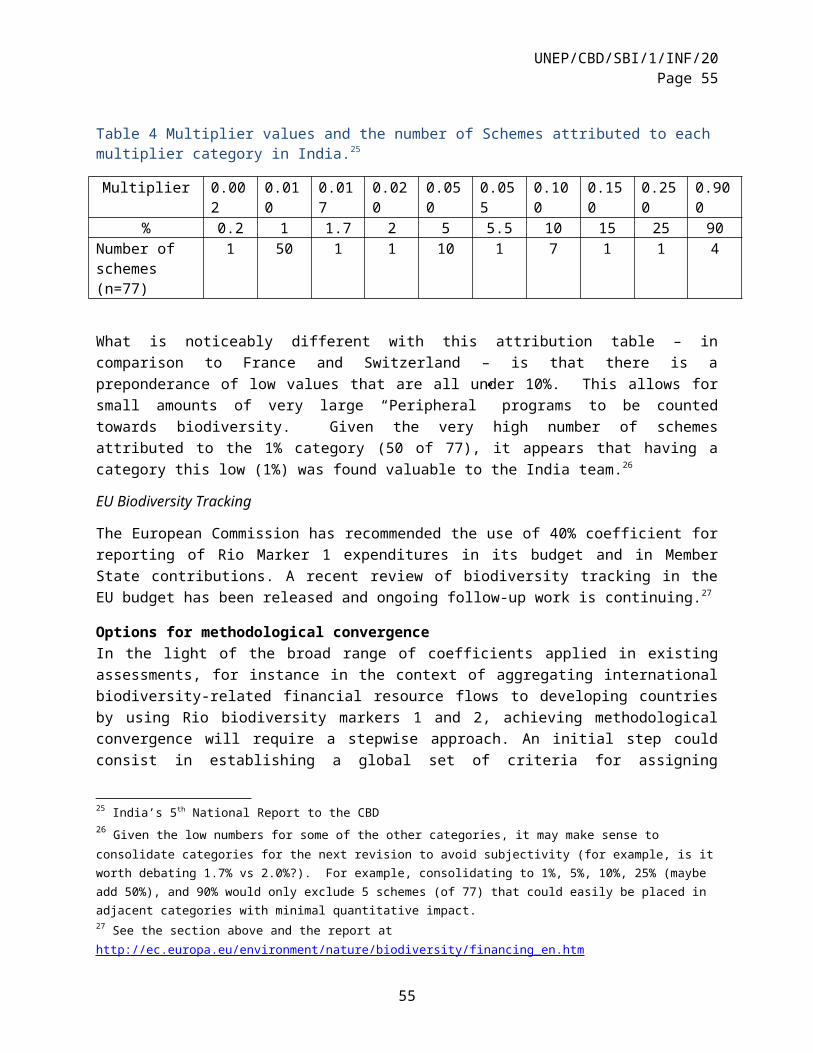
UNEP/CBD/SBI/1/INF/20Page 55
Finland 8.7 10.9 19.6
France 100.7 229.4 330.1
Germany 559.6 441.4 1001.0
Greece 0.1 0.0 0.1
Iceland 3.1 2.0 5.2
Ireland 0.1 41.7 41.9
Italy 10.8 66.6 77.4
Japan 38.1 69.9 107.9
Korea 10.1 45.4 55.5
Luxembourg
1.6 10.3 11.9
Netherlands 3.5 295.8 299.3
New Zealand
3.5 8.0 11.5
Norway 106.8 415.1 521.9
Poland 0.0 1.0 1.0
Portugal 0.1 1.2 1.3
Slovak Republic
0.0 0.5 0.5
Slovenia N/K N/K N/K
Spain 1.7 48.7 50.5
Sweden 45.1 402.3 447.4
Switzerland 70.4 87.5 157.9
United Kingdom
20.5 213.4 234.0
United States
342.7 508.8 851.5
Total 1490.6 4500.7 5991.3
*Based on data reported to the DAC CRS as of January 2015. Slovenia is not yet applying the biodiversity marker.
55
UNEP/CBD/SBI/1/INF/20Page 56
The above table for Rio Markers (OECD DAC) shows that for 2013, commitments targeting biodiversity as a “significant” objective are three times the size of commitments targeting biodiversity as a “principal” objective. As such, the quantitative treatment of “significant” commitments is seemingly a critical precondition for providing consolidated figures on international biodiversity-related finance.
The Biodiversity Finance Initiative (BIOFIN) As mentioned earlier, UNDP recently launched its “Biodiversity Finance Initiative” which has now grown to encompass 29 countries. As part of this work, UNDP developed a methodology, captured in its BIOFIN Workbook (see www.biodiversityfinance.net). The BIOFIN approach has the following elements:
Policy Review: The process begins with a policy review, focusing on key drivers of change to biodiversity (if a country has completed its 5th National Report, this information can directly contribute to the policy review chapter). The policy review looks at negative and positive sectoral practices and policy drivers (e.g., overharvesting), as well as the broader policy environment factors (e.g., law enforcement). There is a strong emphasis on understanding the root causes of change.
Institutional Review: The second step, often closely linked to the first, is an institutional review, with the focus on identifying the impacts, dependencies, costs and benefits of key actors related to both positive and negative drivers of biodiversity change. This review also looks at key roles, responsibilities and capacities in finance, related to issues such as budgeting, accessing, disbursing, reporting and spending of funds.
Expenditure review: The third step is to conduct a review of public and private expenditures on biodiversity. This process includes analyzing in detail all expenditures of the key finance actors identified in the policy and institutional reviews in order to develop a baseline of past expenditures, as well as a projection of future expenditures.
Costing of NBSAP actions: The fourth step is to identify the costs associated with implementing each of the actions within the national biodiversity strategies and action plans (NBSAPs). The focus is on an activity-based cost accounting method, whereby each action is aggregated into specific per-unit costs. This step also looks at the financial gap between the projected future expenditures and the likely costs. This is the finance gap, which is the focus of the final step.
Biodiversity Financing Planning: The final step is to develop a resource mobilization plan to fill the finance gap identified in the previous step. In this analysis, the team identifies biodiversity finance opportunities, actors, mechanisms and revenue potential, and identifies and prioritizes key actions required to fill the finance gap.
Switzerland
Switzerland has provided feedback on the Preliminary Reporting Framework for both international and domestic expenditure reporting.34 The following table shows how Switzerland applied a “BD-factor” or a coefficient (%) that they can multiply against the total expenditure of an activity to calculate the percentage that is attribute to biodiversity.
34 See http://www.cbd.int/financial/reporting.shtml
UNEP/CBD/SBI/1/INF/20Page 57
Table 8 The BD-factor identified by Switzerland in their 2012 CBD submission35
ESTIMATED RELEVANCE FOR THE CBD OBJECTIVES BIODIVERSITY FACTOR
Value (0-1) %BUDGETARY ITEM SUPPORTS CBD’S OBJECTIVES TO ITS FULL EXTENT
1.00 100%
BUDGETARY ITEM SUPPORTS CBD’S OBJECTIVES SIGNIFICANTLY
0.75 75%
ABOUT HALF OF THE BUDGETARY ITEM SUPPORTS CBD’S OBJECTIVES
0.50 50%
BUDGETARY ITEM CONTRIBUTES TO CBD’S OBJECTIVES FOR THE SMALLER PART
0.25 25%
A MINOR PART OF THE BUDGETARY ITEM CONTRIBUTES TO CBD’S OBJECTIVES
0.10 10%
A MARGINAL PART OF THE BUDGETARY ITEM CONTRIBUTES TO CBD’S OBJECTIVES
0.05 5%
Switzerland conducted surveys of both private sector companies and Swiss NGOs to assess their international contribution to Biodiversity and Ecosystem Services. It was very difficult for the private sector especially to report on international vs national spending due to complex supply chains and the international nature of modern business. The NGOs were better able to report directly and through their annual reports which were reviewed. A detailed review of the Swiss methodology is included in their submission to the Convention.36
Switzerland’s methodology of establishing a Biodiversity factor (BD-factor, coefficient) has been described above. An example of the utilization of the approach is provided in Table 8 for federal domestic biodiversity expenditures. Similar analyses were conducted for Canton and Municipalities as well as the private sector.
Table 9 Switzerland Federal Domestic Budget excluding Official Development Assistance and intramural research and development expenditures.
Code Category Total expense in Millions of CHF annual (fiscal year 2009)
BD- factor Expenses supporting the CBD targets in Millions of CHF annual (fiscal year: 2009)
311 Museums and fine arts 35.4 0.05 1.8
741 Water engineering 149.2 0.10 14.9
750 Species conservation and 103.0 .75 77.3
35 http://www.cbd.int/financial/doc/switzerland-funding-biodiversity-en.pdf 36 http://www.cbd.int/financial/oda/switzerland-additional-information-en.pdf
57
UNEP/CBD/SBI/1/INF/20Page 58
landscape protection
761 Air Pollution control and climate protection
121.1 0.10 12.1
769 Countering environmental pollution, NES*
6.7 0.25 1.7
779 Environmental protection, NES*
134.8 0.25 33.7
790 Regional development 13 0.10 1.3
813** Improvement of animal breed 442.0 0.05 22.1
814** Improvement of crop production
101.6 0.1 10.2
816 Agriculture: direct support schemes
2742.2 0.10 274.2
820 Forestry 26.6 0.10 2.7
830 Hunting and fisheries 7.5 0.25 1.9
Total expenses supporting the CBD in Millions CHF 453.7
* NES, not elsewhere specified** Includes conservation and sustainable use of genetic resources.
Of particular note is that the largest contribution to biodiversity expenditure at this Federal level comes from Agriculture: direct support schemes which although it attributed to biodiversity using the BD-factor of only 10%, contributes well over 50% to the total investment in domestic biodiversity. This example shows the importance of attribution of secondary biodiversity expenditures and also the sensitivity of coefficient choices.
Switzerland has made significant progress on assessing the private sector’s contribution to biodiversity expenditures but work is ongoing to improve the methodology. The work is being implemented in collaboration with the Swiss Federal Office for Statistics (BFS) who carry out surveys for specific information collection with the private sector and multiple other sources.37
The BFS cites the following areas of study: environmental protection global expenditure, corporate environmental protection expenditure, fiscal levies related to the environment, and environmental goods and services. The main category of biodiversity expenditure tracking is under the rubric of “Environmental Protection Expenditure” as with SEEA.38
37 See for example: http://www.bfs.admin.ch/bfs/portal/fr/index/infothek/erhebungen__quellen/blank/blank/umweltkonten/02/01.html38 See for example: http://www.bfs.admin.ch/bfs/portal/fr/index/infothek/erhebungen__quellen/blank/blank/umweltkonten/02/01.html
UNEP/CBD/SBI/1/INF/20Page 59
United Kingdom The United Kingdom has conducted a detailed assessment of their domestic and overseas spending on biodiversity and a large part of the methodology is available.39 Some detail on the methodology is provided here.
In general spending on biodiversity is disaggregated into the following categories:
spending directly on reserves and conservation measures related spending on administration and training relevant research and development; and whether the spending is direct on biodiversity, or through transfer payments to other
organizations (in order to remove double counting40 of financial flows).
In reality, expenditures rarely contain only biodiversity elements and a judgment is required. One particular example is Defra’s agri-environmental schemes where an estimate was made of the proportion of total scheme spending that is biodiversity-related. As well, many expenditure items are designed to meet multiple policy objectives. For example tree planting promotes biodiversity yet may be driven by landscaping demands. An assessment by experts of the appropriate share of any spending which can be attributed to biodiversity should account for issues such as the quality of conservation measures and the intentions of the expenditure. The UK methodology also suggests separating out expenditures that create “access” to nature – i.e. forestry roads, as compared with actual benefits to nature. Even spending on National Parks was not all considered “Biodiversity.” Of note is that the UK methodology completely focused on the SEEA (CEPA) activity category called “Environmental Protection Expenditure” (see Annexes) and generally excluded Natural Resource Management or Natural Resource Use – categories that are not as developed as Environmental Protection. However, the approach did include specific expenditures that are clearly attributed to biodiversity. For example:
“gross expenditure by the Forestry Commission has been included, for the broad objective that includes biodiversity in the annual accounts for FC in England, Wales and Scotland; each includes a diverse range of activities in addition to the biodiversity-related activities outlined below. A typical activity is the expansion of native woodland, as this is an important habitat to native animal and plant species. Other activities include SSSI management, creating linkages to isolated woodland remnants and woodland glade management for key moth and butterfly species living in the forests.”41
This example highlights the complexity and cross-disciplinary nature of the majority of expenditures on biodiversity.
With regard to spending in the UK’s overseas territories – this was included in international biodiversity expenditures and included the Overseas Territories Environmental Programme (provided by the Foreign 39 UK Biodiversity Indicators in Your Pocket 2013. Document supports E2. Expenditure on UK and international biodiversity. Technical annex –Public sector expenditure on UK and global biodiversity, Rocky Harris (Defra Environment Statistics). For further information on E2. Expenditure on UK and international biodiversity visit http://www.jncc.defra.gov.uk/page-4251 For further information on BIYP visit http://www.jncc.defra.gov.uk/page-182440 Double counting is a large issue in both international and national expenditure analysis 41 Source: http://jncc.defra.gov.uk/page-4251 accessed 18 March 2015
59
UNEP/CBD/SBI/1/INF/20Page 60
and Commonwealth Office and DfID) and spending by the Royal Botanic Gardens, Kew and the Ministry of Defence (MOD).
The management of wildlife trade and international wildlife crime is included through estimates of departmental costs involved in monitoring and controlling the trade in endangered species (CITES). Additionally, in assessing spending on international aid as part of wider initiatives a number of programmes were identified and allocated to biodiversity including the Darwin Initiative (Defra), the Flagship Species Fund (Defra), the Global Environment Facility (DfID), the Overseas Territories Environmental Programme (FCO, DfID) and the Global Opportunities Fund (FCO). When data was available, expenditures relating to biodiversity protection were separated out from general environmental spending. When not possible, estimates were made as to what percentage of the total spending could be attributed towards biodiversity protection. These estimates were generally made through contacting the responsible person in the organisations concerned. Where data were not available or information not accessible, expert judgment was used but associated limitations were pointed out: “The process by which experts arrive at their judgment may not be documented, and subsequent assessments may not be made on a consistent basis. Also, these experts may have a different view of what constitutes spending on biodiversity and hence the estimates they supply may not always be directly comparable.”42
The main results of the UK analysis for both international and domestic biodiversity expenditures are presented below in Figure 4 and Table 10.
42 Ibid
UNEP/CBD/SBI/1/INF/20Page 61
Figure 4 International Biodiversity Expenditures by the United Kingdom (Source: http://jncc.defra.gov.uk/page-4251 accessed 18 March 2015)
Table 10 E2 Public sector expenditure on UK biodiversity: 2000-1 to 2012-131
Year GDP (£M) Expenditure on BioD in UK
(£M)
Perentage spend of GDP
Expenditure on BioD Internationally
(£M)2000-1 1,332,043 268 0.020 322001-2 1,347,746 301 0.022 342002-3 1,390,179 326 0.023 352003-4 1,446,190 351 0.024 592004-5 1,486,000 399 0.027 632005-6 1,537,594 438 0.028 612006-7 1,580,565 481 0.030 612007-8 1,629,519 573 0.035 622008-9 1,578,959 588 0.037 612009-10 1,525,806 569 0.037 542010-11 1,559,649 551 0.035 552011-12 1,568,118 468 0.030 552012-13 1,568,241 471 0.030 56
1Deflated using UK GDP deflator. Source: Defra, Includes only spending provided solely for the protection and promotion of biodiversity. Expenditure generally excludes operational costs.43
43 Source: http://jncc.defra.gov.uk/page-4251 accessed 18 March 2015
61
UNEP/CBD/SBI/1/INF/20Page 62
The United Kingdom has provided a detailed report with some methodological guidance for its domestic expenditures on biodiversity. Most of the information is captured in “UK Biodiversity Indicators in Your Pocket 2013. Document supports E2. Expenditure on UK and international biodiversity. Technical annex –Public sector expenditure on UK and global biodiversity, Rocky Harris (Defra Environment Statistics)”.44 The results of the UK domestic expenditure analysis is provided in Figure 5.
Figure 5 United Kingdom domestic expenditure on biodiversity 2001-201345
The United Kingdom has sought to include NGO expenditures more completely in their CBD financial reporting. The methodology is summarized in a Background Methods Paper.46 The following paragraphs summarize these methods.
The NGO’s with a primary focus on biodiversity or nature were selected. Focusing on Link members (association of nature based NGOS) pre-selected NGOs. The sample also included 13 of the 47 Wildlife Trusts with the highest annual turnover in England and Scotland and some other NGOs (not members of Link) that have a biodiversity / nature focus. Data was collected mostly from published NGO annual accounts and financial reports. [Almost all of these NGOs are registered charities publish detailed annual financial reports are published on the Charity Commission website. In some cases data was collected directly from the NGO. Because the public sector data excluded administrative staff costs, those costs associated with administrating biodiversity focused programs were excluded. Given the pre-selection, the
44 For further information on E2. Expenditure on UK and international biodiversity visit http://www.jncc.defra.gov.uk/page-4251 For further information on BIYP visit http://www.jncc.defra.gov.uk/page-1824 45 http://jncc.defra.gov.uk/page-4251 visited March 18th 2015 46 http://jncc.defra.gov.uk/Docs/biyp2014_E2_TechBG_final.doc
UNEP/CBD/SBI/1/INF/20Page 63
analysis was able to include all money spent on 'Charitable Activities' as used as the estimate of annual biodiversity spending.
As with most cases, the risk of double counting must be managed as some of the grants and other payments are coming from the government to NGOs and these are already counted in the public sector stream. Where the NGOs list specific grants received and the value of these grants in their statement of financial activities, it was possible to identify public sector grants and calculate the proportion of each NGO’s total income from the public. Then initial estimate of the NGO’s expenditure on biodiversity is multiplied by the proportion of total income not from the public sector to produce the final estimate. Where published data was inadequate for detailed analysis, and the total expenditure of the NGO was very large (>1% of total) the organization was contacted directly. Data were converted to “real” figures (from nominal) using the UK Gross Domestic Product Deflator.
FranceFrance has submitted a complete report on international and national biodiversity expenditures to the CBD but considers the report to be a work in progress as the country is still seeking to refine a range of areas that require additional study and analysis. Much of the information provided by France to the CBD was from a series of reports cited in the submission47.
France’s report to the CBD for international biodiversity flows is provided in Figure 6.
47 Commissariat général au développement durable – Service de l’observation et des statistiques. http://www.statistiques.developpement-durable.gouv.fr/fileadmin/documents/Produits_editoriaux/Publications/References/2013/compte-environnement/references-economie-environnement-en-2011-edition-2013-2.pdf See also Centre d'Echange français pour la Convention sur la diversité biologique : Portail de la biodiversité en France pour la Convention sur la diversité biologique, http://biodiv.mnhn.fr/fr/
63
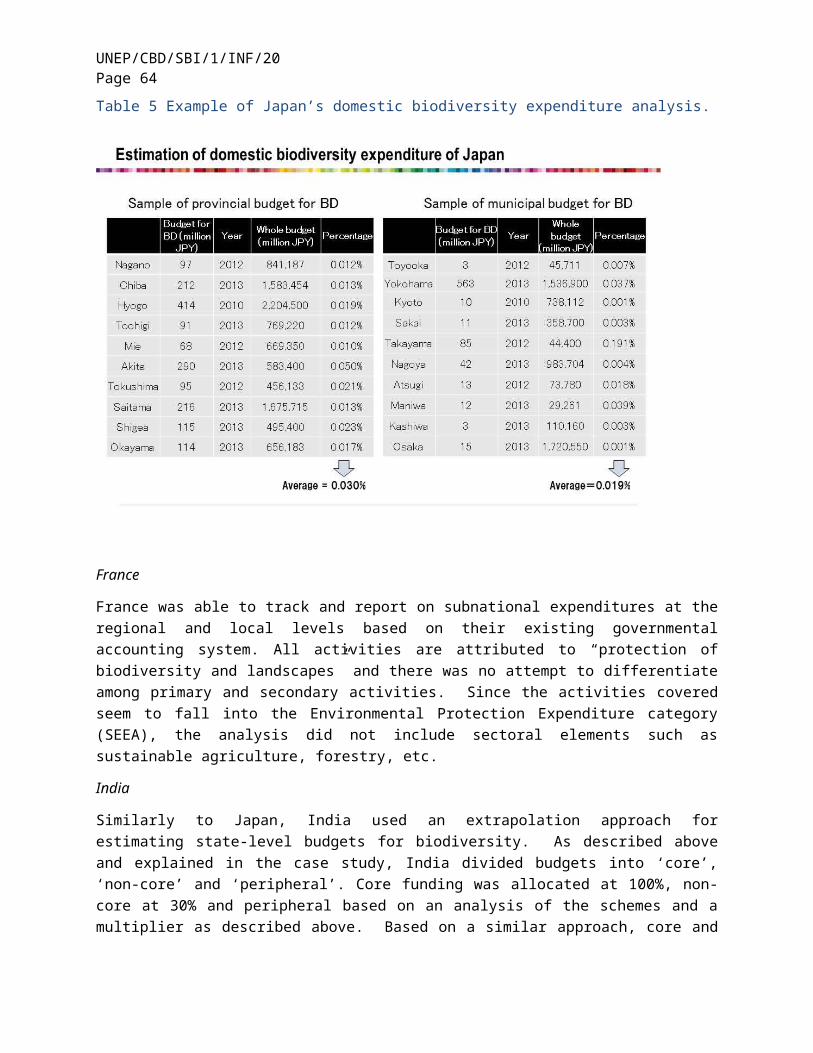
UNEP/CBD/SBI/1/INF/20Page 64
Figure 6 Graphical representation of France’s CBD submission (see http://www.cbd.int/financial/reporting.shtml).
France also has developed an approach to systematically gather financial expenditure data on French Official Development Aid that could be useful for the larger discussion of both international and national expenditure reviews.
The proposed accounting method48 applies to direct and indirect commitments.
2 - Principal objective - full funding (100%) is counted1 - Significant but secondary contribution – see table below. 0 - Absence of significant contribution – funding not counted.
Table 11: Coefficients used for France’s Biodiversity Expenditures under Official Development Aid for direct and indirect commitments
Activity Type Examples Proportion of total financing attributable as “favourable to biodiversity”
Projects Rio Biodiversity Marker 2
Protected AreasSupport to Environmental NGOs Biodiversity Trust Funds Direct Budget Assistance for Biodiversity
100%
Projects Rio Biodiversity Marker 1
Sustainable Forest Management REDD+ Sustainable Fisheries ManagementEcological Restauration
80%
Projects Rio Biodiversity Marker 1
Agro-ecology Pastoralism and nomadic livelihoods Organic and Fair Trade Supply Chains Sustainable watershed management Water treatment Integrated water systems management
30%
Projects Rio Biodiversity Marker 1
Urban biodiversity development Responsible waste treatment Reduced impact waste Credit availability for environment (non-climate related)
5%
Communication Activities with a biodiversity component 50% Knowledge generation Studies dedicated to biodiversity 100%
France assessed both directly and indirectly biodiversity related expenditures. The total average expenditure from 2007 through 2011 was 1828 million euros per year. Data were generated from various environmental accounts.49 It was not possible to distinguish among the activities were direct or indirectly
48 Below is from Methode de Comptabilisation Proposée par l’AFD http://www.fondationbiodiversite.fr/images/stories/telechargement/IPBES/Methode_de_comptabilisation_www_23052014-1.pdf and see AFD Biodiversity 2013-2016 CIT.49 Sources : Ministère de l’écologie, du développement durable et de l’énergie – CGDD – Service d’observation et des statistiques, 2013, L’économie de l’environnement en 2011. Rapport de la Commission des comptes et de l’économie de
UNEP/CBD/SBI/1/INF/20Page 65
related to biodiversity. All activities are attributed to “protection of biodiversity and landscapes”, « protection de la biodiversité et des paysages » and include administrative management costs. Regional (provincial budgets) group the Regional expenses, Departments, and Water Authorities. Private sector expenses are businesses expenses. The category “other” groups household expenses which are in general contributions to various NGOs and associations.
The results of the analysis are presented in Table 12.
Table 12 Baseline Domestic Biodiversity Expenditures from France (in millions €)50
Million € 2007 2008 2009 2010 2011
2.1.1 Gov. budgets - Central 206 263 296 317 333
2.1.2 Gov. budgets - State/Provincial 399 422 454 470 524
2.1.3 Gov. budgets - Local/ Municipal 459 499 542 607 732
2.2 Private/ Market 390 362 355 377 405
2.3 Other (NGOs, foundation, and academia)
119 139 148 155 166
Total 1573 1685 1795 1926 2160
l’environnement .pp. 71-78 see http://www.statistiques.developpement-durable.gouv.fr/fileadmin/documents/Produits_editoriaux/Publications/References/2013/compte-environnement/references-economie-environnement-en-2011-edition-2013-2.pdf 50 From CBD submission: http://www.cbd.int/financial/oda/france-preliminary-reporting-framework-2014-en.xlsx
65
UNEP/CBD/SBI/1/INF/20Page 66
Figure 7 Chart of France’s baseline biodiversity expenditures showing subnational breakdown (Source: France’s CBD submission).
Germany
Germany conducted an analysis of its international expenditures on biodiversity that is detailed in the report: Committed to Biodiversity: Germany’s International Cooperation in Support of the Convention on Biological Diversity for Sustainable Development. Federal Ministry for Economic Cooperation and Development (BMZ) and Federal Ministry for the Environment, Nature Conservation, Building and Nuclear Safety (BMUB). 201451 The following methodology description is copied verbatim from the report and supporting documentation provided by BMZ.
In order to assess and qualify its commitments to biodiversity, BMZ follows the established system of OECD-DAC Creditor Reporting System (CRS) codes and the Rio Markers, which aim at monitoring ODA flows towards the objectives of the Rio Conventions. The Rio Marker for biodiversity is also used to quantify ODA allocations for biodiversity. For measuring the corresponding financial ODA contribution to biodiversity conservation, each project and programme is assessed in terms of its support to achieving at least one of the three objectives of the Convention on Biological Diversity (CBD) (1) conservation, 2) sustainable use of biodiversity, and 3) the fair and equitable sharing of benefits). Only those projects with the main focus and the principal objective on the support of the implementation of the CBD can be assigned the biodiversity Rio Marker 2. As for the accounting of funding volume, activities scoring Rio Marker 2 for biodiversity are calculated as 100% contribution towards the German ODA commitment for biological diversity.
To further mainstream and integrate biodiversity conservation into other sectors and focal areas of development cooperation according to the CBD Strategic Plan (2011-2020), since 2012 so called Biodiversity “sectoral components” are integrated into projects and programmes with other principal objectives such as water and sustainable land management, agriculture and food security, energy, education or governance. These biodiversity “sectoral components” have to contribute to at least one of the three objectives of the CBD, and have to be represented in project planning, implementation and monitoring being captured by one or more specific indicators. The whole project or programme is then 51 http://www.bmub.bund.de/en/service/publications/downloads/details/artikel/committed-to-biodiversity/
UNEP/CBD/SBI/1/INF/20Page 67
considered to have biodiversity conservation as a significant objective and can therefore be assigned the biodiversity Rio Marker 1.
When it comes to reporting for biodiversity purposes, only the volume of the specific biodiversity “sectoral component” of the project or programme (marked biodiversity Rio Marker 1) will be counted as a contribution towards biodiversity conservation. The remaining amount of the other project or programme components is not reported as a contribution to biodiversity conservation. This methodology ensures that only that part of a project or programme which clearly supports one of the objectives of the CBD is measured and reported. Given different options and scopes for “sectoral components” in different sectors, the percentage of a specific biodiversity “sectoral component” of the overall project or programme will naturally vary from project to project.
A simplified and abstract example for the calculation of a project with a sectoral component which would be assigned Rio Marker Biodiv – 1:
A project for securing the water supply in a partner country has a German contribution of €4 million. Its principal objective is the improvement of the water supply in the country or a specific region. The overall project impact is measured with four indicators. For improving the water quality in the region, it is crucial to restore and sustainably manage a watershed. Measures such as natural reforestation, the collection of data on relevant ecosystems related to the water supply and the development of approaches for payments for environmental services (PES) contribute strongly to the improvement of biodiversity and are therefore considered a biodiversity “sectoral component”. For this “sectoral component” an amount of €1 million is foreseen. The improvement of biodiversity is measured with one of the four project or programme indicators. As this indicator contributes directly to one of the CBD objectives it is accounted 100 % as a contribution towards biodiversity. The other three indicators are not contributing directly and explicitly to biodiversity and are accounted 0 %. Thus, out of the overall funding volume of €4 million, only €1 million are accounted as a contribution to biodiversity.
Overview of Germany’s Biodiversity reporting
Rio Marker Biodiv – 2
The entire financial volume (100%) of the project or programme is accounted as a contribution to biodiversity.
Rio Marker Biodiv – 1
(since 2011)
A project accounts only with a certain amount of the overall financial volume as contribution to biodiversity. The specific amount depends on the positive impact on biodiversity that can be monitored through at least one specific indicator which aims at directly and explicitly fulfilling one or more of the three objectives of the CBD. If an indicator meets these criteria the funding proportion of the “sectoral component” contributing to this indicator is fully accounted. The remaining volume of the project or programme is not accounted as a contribution towards biodiversity.
In order to facilitate the integration of biodiversity aspects into other sectors which are crucial for the conservation and sustainable use of biological diversity, BMZ is in the process of developing a series of technical guides (“interface papers”) which illustrate realistic potentials for biodiversity mainstreaming into other sectors (such as agriculture, water, energy, etc.). This will also provide guidance for counterparts, project developers and country officers when it comes to the design of new activities and
67
UNEP/CBD/SBI/1/INF/20Page 68
components. The point of departure for such guidance forms again the established and recognized definition of the Rio Marker for biodiversity and the corresponding criteria for eligibility. The following illustrates examples for typical biodiversity-relevant components in other sectoral programmes:
Sector Biodiversity sectoral component
Agriculture - Support of agrobiodiversity in the context of sustainable land management
- Support of organic farming with focus on conservation of biodiversity
Water management - Protection and rehabilitation of water basins and integrated management of watersheds, discharging areas and river basins and preservation of water-related ecosystems
- Use of ecological systems at the coastlines to prevent flooding as result of climate change (rehabilitation of mangrove systems)
Sustainable economic development - Assessment and conservation of ecosystem services
- Development of incentive mechanisms for the conservation of biodiversity in the context of financial system development
- Implementation of biodiversity-related measures in tourism management
- Developing and applying methods and instruments to analyse, valorise, and preserve ecosystem services
Education - Integration of biodiversity and environment components in curricula
Policy Advise - Policy advisory to implement the CBD objectives / the CBD Strategic Plan (2011-2020) within the context of environmental policy projects (e.g. as contribution to the implementation of the Nagoya Protocol on Access & Benefit Sharing)
The results of Germany’s assessment of international biodiversity expenditures is provided in Table 13.
Table 13 Germany’s International Biodiversity Finance in € Million (2006–2013)
2006 2007 2008 2009 2010 2011 2012 2013
BMZ ODA
BILATERAL
65 115 159 183 225 350* 406* 388
BMZ ODA
MULTILATERAL
10 10 10 13 37 22 25 42
BMUB IKI** 50 54 38 127* 104* 122*
UNEP/CBD/SBI/1/INF/20Page 69
TOTAL 75 125 219 250 300 499 533 552
*includes funding from a special fund sourced from emissions trading (Energy and Climate Fund, EKF);** includes ODA and EUR 19.3 million non-ODA funding (see www.international-climate-initiative.com)
Figure 8 Summary Graph of Germany’s International Biodiversity Investments 2006 - 201352
Namibia Namibia conducted a review of biodiversity expenditure over the financial years 2007/08 to 2012/13 as part of a wider study that also projected biodiversity expenditure in Namibia forwards under a business as usual scenario to 2020/21. The primary reference for this study was BIOFIN Workbook 1c.
A review of Namibian Government (GRN) expenditure estimated that real (2013 prices) GRN biodiversity expenditure increased from N$533m in 2007/08 to N$791m in 2011/12, before decreasing to N$710m in 2012/13 (see Figure 1). Over this period, the Ministries of Environment and Tourism (MET); 52 Source: Page 8 Committed to Biodiversity: Germany’s International Cooperation in Support of the Convention on Biological Diversity for Sustainable Development. Federal Ministry for Economic Cooperation and Development (BMZ) and Federal Ministry for the Environment, Nature Conservation, Building and Nuclear Safety (BMUB). 2014
69
UNEP/CBD/SBI/1/INF/20Page 70
Agriculture, Water and Forestry (MAWF); and Fisheries and Marine Resources (MFMR) are estimated to have accounted for more than 90% of GRN biodiversity expenditure.
Figure 9 Real GRN Biodiversity Expenditure, 2007/08 – 2012/13
To put GRN biodiversity expenditure into context, it was compared to both total GRN expenditure and GDP. This revealed that since 2010/11, GRN biodiversity expenditure as a percentage of both total GRN expenditure and GDP had fallen (see Figure 2). In the case of its comparison to total GRN expenditure, this was a reduction of almost 0.7 percentage points from 2.4% to 1.7%.
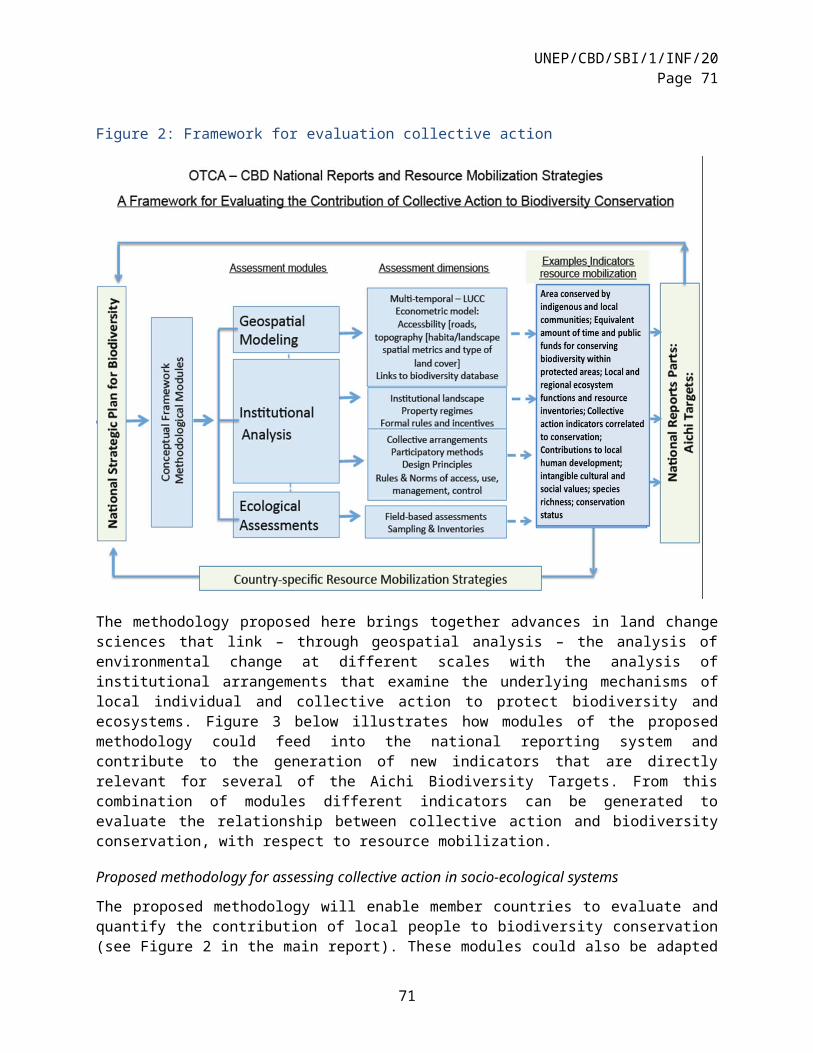
UNEP/CBD/SBI/1/INF/20Page 71
Figure 10 GRN Biodiversity Expenditure as a percentage of total GRN expenditure and GDP, 2007/08 – 2012/13
Non-GRN biodiversity expenditure in Namibia arises largely through donors. Real non-GRN biodiversity expenditure is estimated to have increased from approximately N$210m in 2007/08 to more than N$430m in 2012/13 (see Figure 3). More than 80% of that increase occurred after 2010/11, which in turn was driven by the United States Agency for International Development (USAID) funded MCA (Millenium Challenge Account) project. In the absence of the MCA project, non-GRN biodiversity expenditure would have likely fallen after 2010/11. The MCA project ended in 2014/15.
71
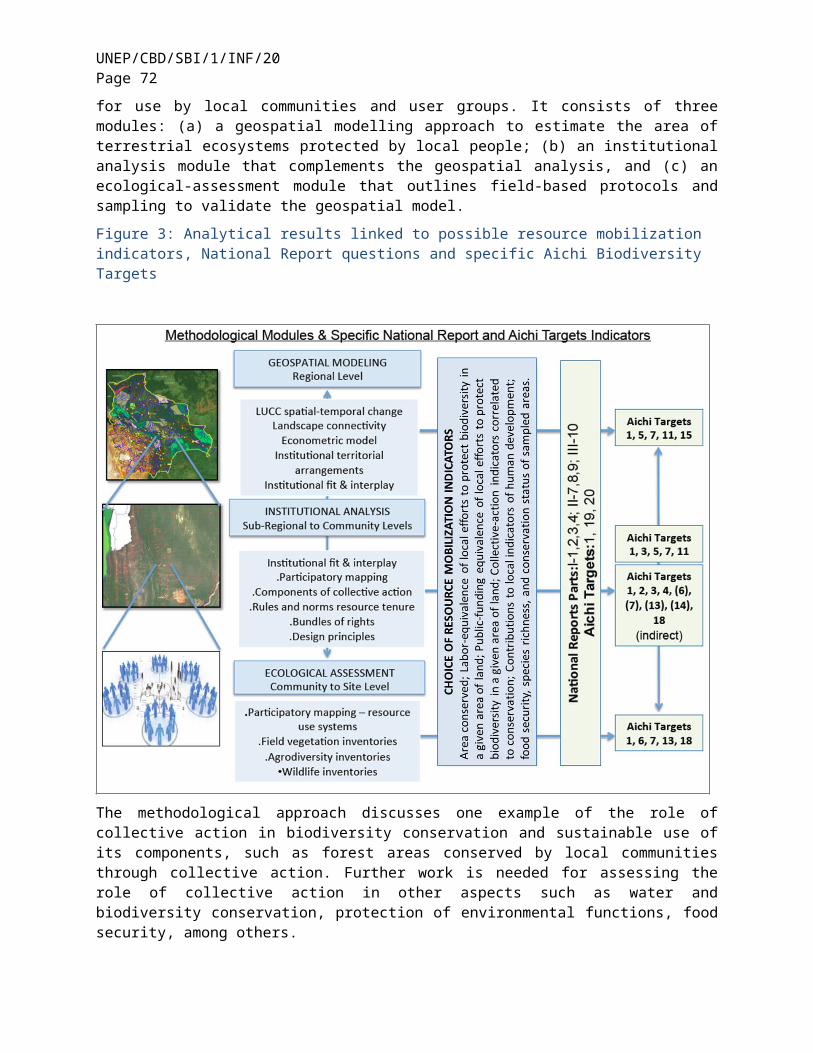
UNEP/CBD/SBI/1/INF/20Page 72
Figure 11 Real Non-GRN Biodiversity Expenditure, 2007/08 – 2012/13
Total biodiversity expenditure in Namibia was therefore estimated to have risen from N$740m in 2007/08 to N$1,140m in 2012/13 (see Figure 4). More than 30% of this increase occurred after 2010/11, which was primarily as a result of the MCA project and which accounted for more than 20% of total biodiversity expenditure in Namibia 2012/13 alone. GRN biodiversity expenditure accounted for between 62% (2012/13) and 75% (2010/11) of total biodiversity expenditure in Namibia.
Figure 12 Real Total Biodiversity Expenditure, 2007/08 – 2012/13
Biodiversity expenditure was also disaggregated by the 5 strategies identified in the BIOFIN workbook (see figure 5). Protection strategies accounted for a minimum of 45% (2010/11) of biodiversity
UNEP/CBD/SBI/1/INF/20Page 73
expenditure across the period, rising to as much as 61% in 2012/13. Expenditure on mainstreaming ranged from between 2.5% (2009/10) to 6% (2008/09).
Figure 13 Real Total Biodiversity Expenditure by Strategy, 2007/08 – 2012/13
India India conducted a comprehensive review of its domestic budget with regard to biodiversity. This review is described in India’s recent NBSAP update – the NBAP 2014 Addendum to the NBAP 2008.53 India began by determining which ministries and actors are contributing to biodiversity. The study team identified 77 financing programs (“schemes”) from 23 ministries (of 52 ministries) for their contribution to NBAP targets based on the budget year 2013-2014 in addition to the work undertaken by the Ministry of Environment, Forests, and Climate Change (MoEFCC). They divided their analysis into three types of budget categories:
“Core”: this is direct biodiversity funding from the Ministry of Environment, Forestry and Climate Change (MoEFCC) that has “direct and immediate biodiversity impact”. This includes funding for agencies that directly and purposefully consider biodiversity within their mandates.
“Non-Core: this is budget from the MoEFCC that is non-direct. This includes activities such as “pollution, hazardous substances management, etc., which facilitate biodiversity conservation of river streams, wetlands”
“Peripheral”: this is budget for biodiversity relevant schemes of Ministries/Departments other than the MoEFCC.
53 https://www.cbd.int/nbsap/about/latest/default.shtml
73
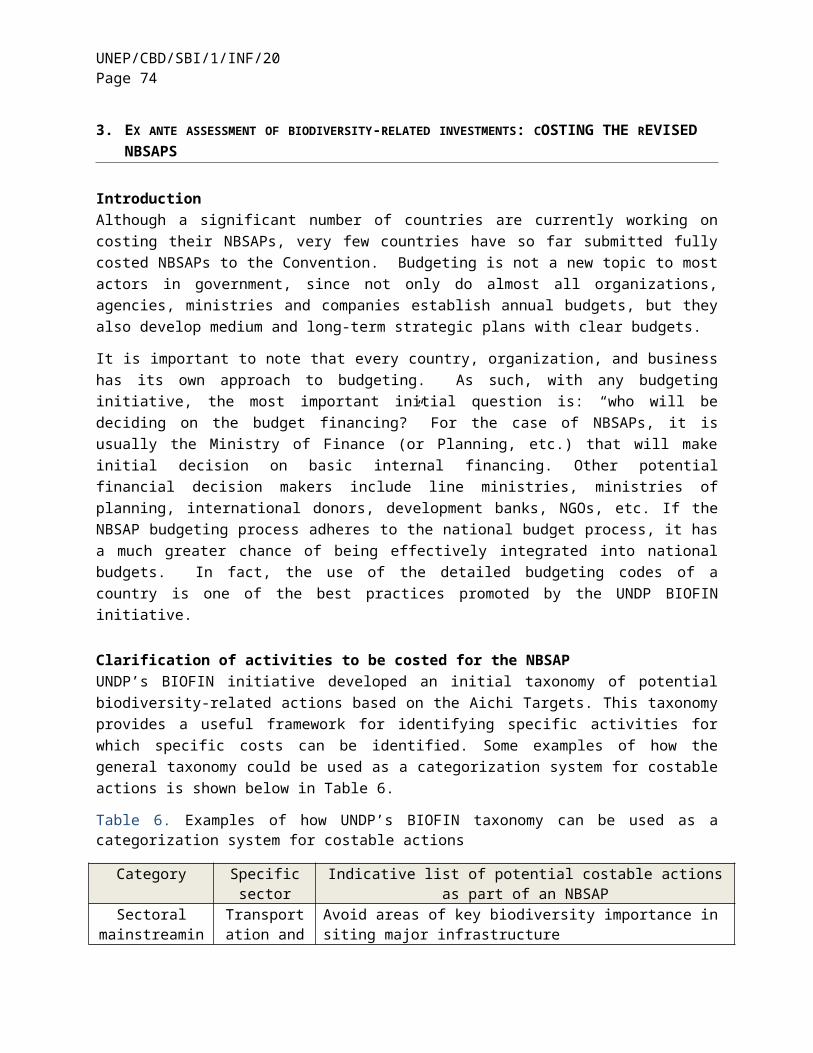
UNEP/CBD/SBI/1/INF/20Page 74
Core funding is attributed at 100% of the budget (similar to Rio Marker 2 attribution) and both Non-Core and Peripheral budgets were subject to the multiplier once the associated schemes were placed into multiplier categories (see Table 14).
Table 14 Multiplier values and the number of Schemes attributed to each multiplier category in India.54
Multiplier 0.002 0.010 0.017 0.020 0.050 0.055 0.100 0.150 0.250 0.900
% 0.2 1 1.7 2 5 5.5 10 15 25 90
Number of schemes (n=77)
1 50 1 1 10 1 7 1 1 4
What is noticeably different with this attribution table is that there is a preponderance of low values (0.2%, 1%, 1.7%, 2%, 5%, 5.5%) that are all under 10%. This allows for small amounts of very large “peripheral” programs to be counted towards biodiversity – 50 out of 77 schemes were attributed to the 1% category.
Table 15 India’s Domestic Budgeting for Biodiversity for the Fiscal Year2013-201455
Nature of funding Amount in Crores In million USD
Core 1564.34 251.99
Non-core 259.8 41.85
Core + non-core 1824.14 293.84
States 5025.57 809.53
Peripheral (23 Ministries/Departments, 77 schemes) 2354.74 379.31
Total 9204.45 1482.68
For the analysis of State funding, India used only “Core” funding information as data for Non-core and Peripheral information was not complete for all states. India used an extrapolation approach for estimating State level budgets for biodiversity. As noted above, India divided budgets into ‘core’, ‘non-core’ and ‘peripheral’. Core funding was allocated at 100%, non-core at 30% and peripheral based on an analysis of the schemes and a multiplier as described above. Based on a similar approach, core and non-core funding for biodiversity was derived from the budgetary allocations made by the State (provincial) Government. Peripheral funding by State Governments was also calculated using multiplier factor (10%) for the programs executed by State-based Departments of the 23 ministries identified at the national level (Department of Animal Husbandry, Fisheries, Agriculture, etc.).
The following tables are from India’s submission to the Convention.
54 India’s 5th National Report to the CBD55 India’s 5th National Report: http://www.cbd.int/doc/world/in/in-nr-05-en.pdf
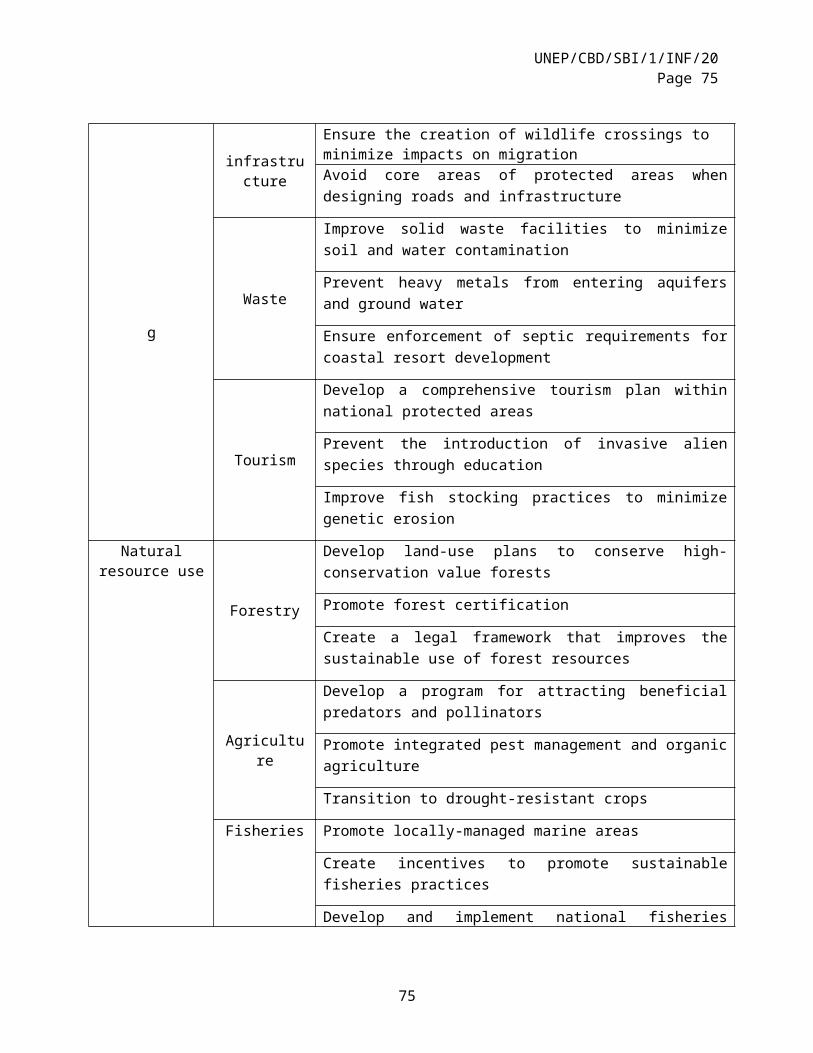
UNEP/CBD/SBI/1/INF/20Page 75
Philippines
The Philippines is one of the countries working through the BIOFIN process and has completed their NBSAP costing. A brief description of some of the results and lessons learned is provided in the main body of this report. Some key observations include:
1) The importance of following government accounting codes2) Identifying and engaging with key stakeholders and sources of knowledge3) An iterative process with the NBSAP revision allows effective feedback on clarifying NBSAP
activities and evaluating cost effectiveness4) A progressive process that moves from desktop modeling and cost estimates through a
consultative process with incremental improvements on everything from unit cost estimates, quantitative targets, cost effectiveness, consultation, specialist validation, results presentation.
5) Tying the timing of the NBSAP and its costing to national development plans – leading the team to extend the time frame of the NBSAP until 2028.
75
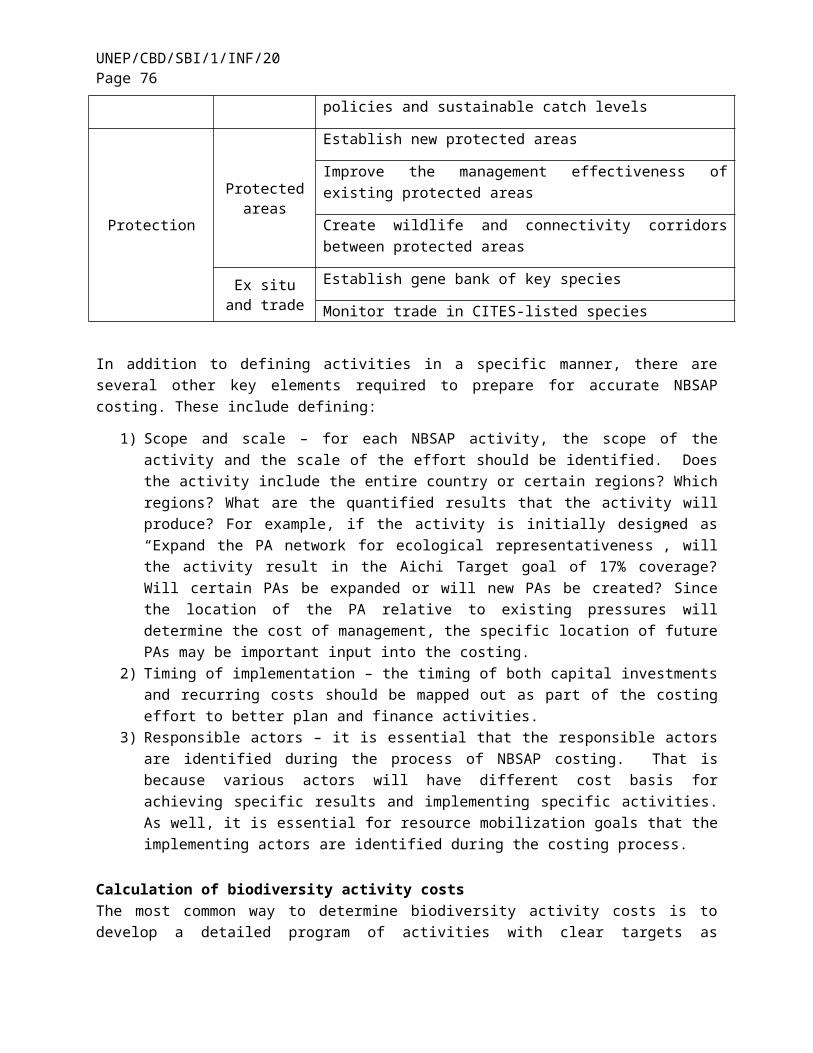
UNEP/CBD/SBI/1/INF/20Page 76
Some initial results of the study are provided in the following preliminary graphs.
Table 16 Preliminary NBSAP Costing data from the Philippines (2015-2028)
Thematic Area LOW HIGH
PERCENTAGE
PhP USD PhP USD
ABS 1,437,360
,154 31,941
,337 1,822,595,2
04 40,502
,116 0.4%
IAS 3,430,242
,055 76,227
,601 4,190,651,0
67 93,125
,579 1.0%
Urban Biodiversity 2,779,459
,958 61,765
,777 3,726,644,4
38 82,814
,321 0.8%
Inland Wetlands 67,099,361
,104 1,491,096
,913 77,745,127,9
07 1,727,669
,509 19.9%
Forest/ Terrestrial 185,338,276
,089 4,118,628
,358 214,078,338,7
89 4,757,296
,418 55.0%
Agrobiodiverstiy 10,879,902
,182 241,775
,604 13,091,891,5
32 290,930
,923 3.2%
Caves & Cave Systems
5,368,174,648
119,292,770
7,626,725,164
169,482,781 1.6%
Coastal & Marine 60,609,771
,298 1,346,883
,807 69,890,187,0
89 1,553,115
,269 18.0%
Total 336,942,547
,489 7,487,612
,166 392,172,161,1
90 8,714,936
,915 100%
UNEP/CBD/SBI/1/INF/20Page 77
Figure 14 Breakdown of Philippines NBSAP Costing on Thematic Areas (2015-2028)
CanadaCanada developed its own methodology to try to count its national biodiversity investments. With regard to the private sector, they considered some successful elements to be the ability to use results from Statistics Canada data from business surveys, the inclusion of data from “user fees”, the ability to generate date from some of the largest domestic NGOs, and they were able to formulate estimates for academic institutions. Some of the challenges included the fact that data are based on periodic surveys (not annual) and that there was no specific “biodiversity” category.56 The report provided an “indicative estimate of the scale and scope of resources being mobilized by Canada and Canadians in support of the objectives of the CBD” for the years 2006-2010. The results are presented in Table 17.
Table 17 Summary of Canadian Investments in Biodiversity for the baseline years57
Fiscal Year (millions of CAN$, current prices)
2006-2007
2007-2008
2008-2009
2009-2010
2010-2011
Official Development Assistance 53.35 66.7 73.8 85.06 136.93
Government of Canada 45.61 42.72 46.94 62.46 95
International Financial Institutions and 7.74 23.98 26.85 22.59 41.94
56 From presentation by Scott Wilson, Environment Canada, WGRI-5, Montreal, Canada, June 19, 201457 http://www.cbd.int/financial/doc/canada-resources-mobilization-en.pdf
77
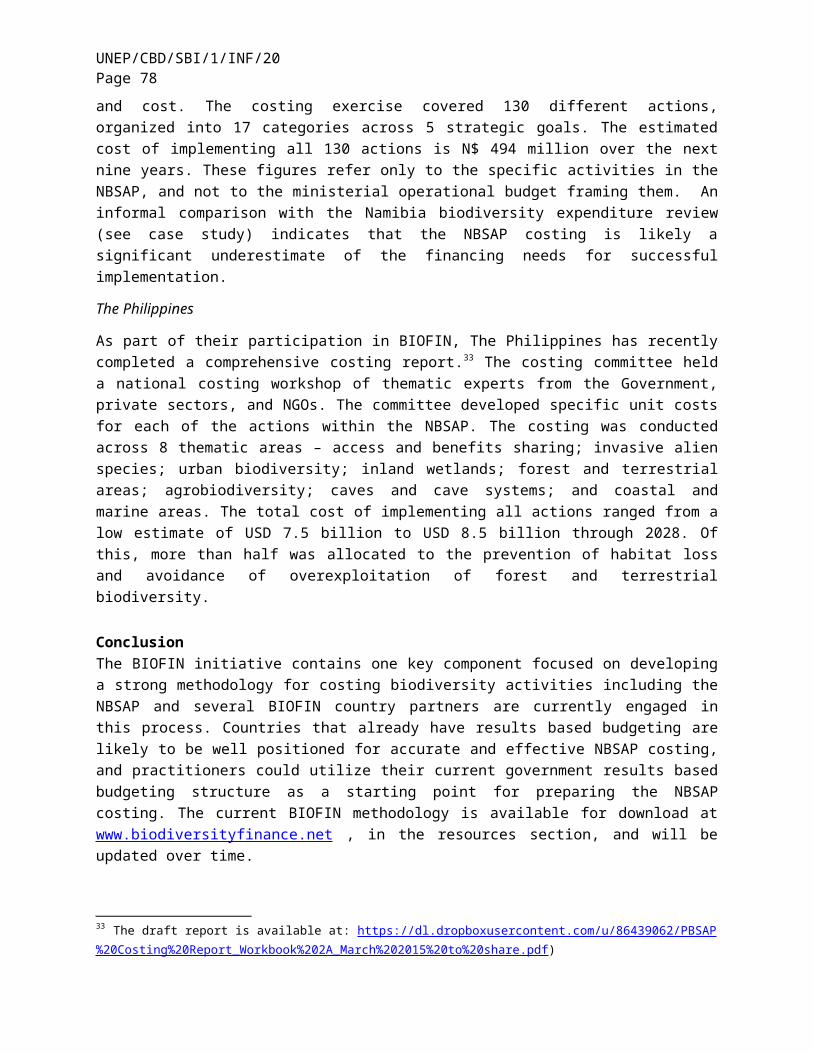
UNEP/CBD/SBI/1/INF/20Page 78
UN
Domestic public budgets at all levels 6,986.65 7,823.76 7,951.53 7,959.74 8,184.20
Federal 2,149.67 2,447.47 2,442.05 2,036.29 2,220.74
Provincial 2,315.98 2,696.85 2,595.88 2,808.11 2,651.81
Local 2,521.00 2,679.45 2,913.60 3,115.35 3,311.65
Private Sector 1,012.94 914.1 810.23 736.5 677.88
Business expenditure 437.75 339.95 242.15 182.71 135.89
User fees (parks fees, licenses) 575.19 574.15 568.08 553.79 541.99
NGOs, foundation and academia 402.22 405.23 563.02 548.83 480.45
Non-governmental organizations and foundations
275.85 270.79 417.85 405 338.96
Academia 126.37 134.44 145.18 143.82 141.5
TOTAL 8,455.16 9,209.79 9,398.58 9,330.13 9,479.47
Japan
Japan only counted the biodiversity activities that are “Directly Related” to biodiversity conservation. Double-counting was a challenge for Japan as the central government budget finances state/provisional, local/municipal budgets and academia. As such it was not possible to avoid double counting among those budgets. The main central government category for biodiversity expenditures was termed “Environmental Conservation Expenses” and the data are compiled by the Ministry of the Environment. For government budgets at the State/ Provincial & Local/Municipal levels, the amount was estimated by calculating the ratio of biodiversity conservation expenses to total expenses of several prefectural governments and then multiplying that ratio to total subnational government budgets. This is an extrapolation method that allows country-wide estimations based on a sampling of cases.
With regard to the private sector, there are result of a questionnaire survey about CSR spending for BD (Toyokeizai CSR survey). However answers from companies are very different because there is no clear classification of the biodiversity expenses by each company. Therefore, Japan regards the data as not reliable enough for reporting. In terms of other expenditure categories (NGOs, foundation, and academia) only academia expenses titled, “Biodiversity Conservation expenses” in “The Environment Research and Technology Development Fund” were counted.
Table 18 Summary of Japan’s Domestic “Directly Related” Biodiversity Expenditures58.
All "Directly Related"
Million JPY 2006 2007 2008 2009 2010 2011 2012
58 Japan’s CBD submission 2014 for Financial Reporting http://www.cbd.int/financial/oda/japan-preliminary-reporting-framework-2014-en.xls
UNEP/CBD/SBI/1/INF/20Page 79
Gov. budgets – Central 317,416 285,056 279,602 261,233 144,156 144,732 139,285
Gov. budgets - State/Provincial 9,899
Gov. budgets - Local/ Municipal 16,643
Other (NGOs, foundation, and academia)
509 663 716 993 943 1,343 954
Total Direct Biodiversity Expenditure
317,925 285,719 280,318 262,226 145,099 146,075 166,781
DenmarkDenmark’s domestic biodiversity expenditure analysis is primarily an agency-based analysis with the use of additional hypotheses for certain calculations. Estimates are based on expenditures (as opposed to budgets) mostly based on the central administrative system (SKS) and governmental accounts. Other data are from Statistics Denmark. The agencies included are the Nature Agency, the Environmental Protection Agency, Ministry of Defense and Ministry for Food, Agriculture and Fisheries and the Ministry of higher education and science. As well, government activities supported under the European Rural Development Program are included.
An additional administrative cost was added to project costs (8.5 %) to account for administrative expenses not captured in project costs. A hypothesis was also established for “policy development” which assumed at the central level 25 % of administrative staff participates in development of new policies. Some activities take place at the municipal level – mostly indirect effects on biodiversity – sustainable forest management, promotion of recreational activities, etc. Greenland costs and expenditures were not included in the reporting and only a few NGO’s and Foundations reported on their expenditures on biodiversity.
For the reporting period 2011 and 2012 the results were based on actual expenditures and included both direct and indirect benefits on biodiversity. Research on biodiversity was included and explains an increase in the amount provided for biodiversity at the state level. As well, Greenland provided some numbers for their national contributions.
The “other” category included NGO’s and Foundations. To acquire data, an inquiry was made to the each of the largest NGOs and private foundations regarding their expenditures on biodiversity both nationally and internationally. Because funding of national NGOs can come from public funds (DANIDA), NGO’s were asked to identify the sources of funding to avoid double counting. The NGO’s and foundations were asked account for direct and indirect benefits and to group expenditures into categories including: A) Biodiversity protection, B) Policy development and administration, C) Sustainable use and management and D) Sustainable production and consumption or similar categories depending on the activities of the organisations. It is important to note that a very limited number of NGOs and foundations were requested to provide data for 2006-2010. In 2011 and 2012 a total of 5 large foundations and 2 NGO’s provided data – thus explaining the higher figures for those years.
The summary of the results for Denmark are provided in Table 21.
USD 2006 2007 2008 2009 2010 2011 2012
79
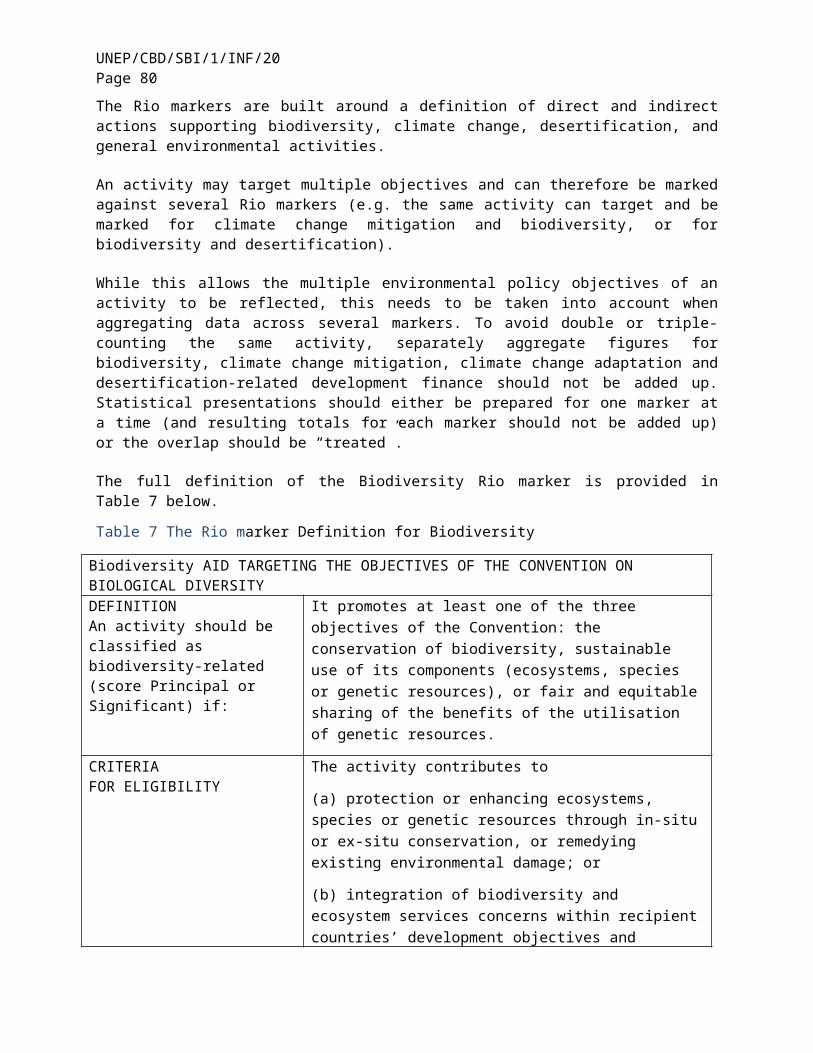
UNEP/CBD/SBI/1/INF/20Page 80
2.1.1 Gov. budgets - Central
161,211,985 180,266,009 245,647,463 220,242,098 157,102,294 245,647,463 306,919,226
2.1.2 Gov. budgets - State/Provincial
49,876,709
2.1.3 Gov. budgets - Local/ Municipal
15,504,745 33,624,748 43,338,564 49,876,709 51,931,555 55,854,442 63,513,413
2.3 Other (NGOs, foundation, and academia)
1,307,629 1,681,237 1,307,629 934,020 3,922,887 44,646,193 37,360,831
Total 227,901,068 215,571,994 290,293,656 271,052,827 212,956,736 346,148,098 407,793,470
Table 19 Summary of Denmark’s domestic biodiversity expenditures59
EU and the European Commission (from Submission to the CBD April 2014)60
International flows of financial resources
The EU Member States and the European Commission have their own individual methodology for accounting resources. The methodology differs across Member States. This makes it difficult to compile and compare data across the EU. Details are provided on the methodology at EU and Member State level for the sake of transparency and to account for possible differences. There are in particular differences in the way funding linked to Rio marker 1 projects for OECD DAC countries is treated (often this is referred to as indirect flows). Most Member States account for these projects/flows only partially, either by:
- using a common reduction rate (equal or close to 40 %)
- using different rates according to sectoral categorization;
- identifying on a case by case basis the sectoral component of the project which contributes to the conservation and sustainable use of biodiversity significantly, and accounting for this component at a 100 % rate.
However, some Member States still account for indirect flows which contribute significantly to biodiversity objectives in full. In addition, some EU Member States are not OECD DAC members, and therefore do not use the Rio marker methodology.
59 Denmark CBD submission: http://www.cbd.int/financial/oda/denmark-preliminary-reporting-framework-2014-en.xlsx 60 http://www.cbd.int/financial/oda/european-commission-additional%20information.pdf
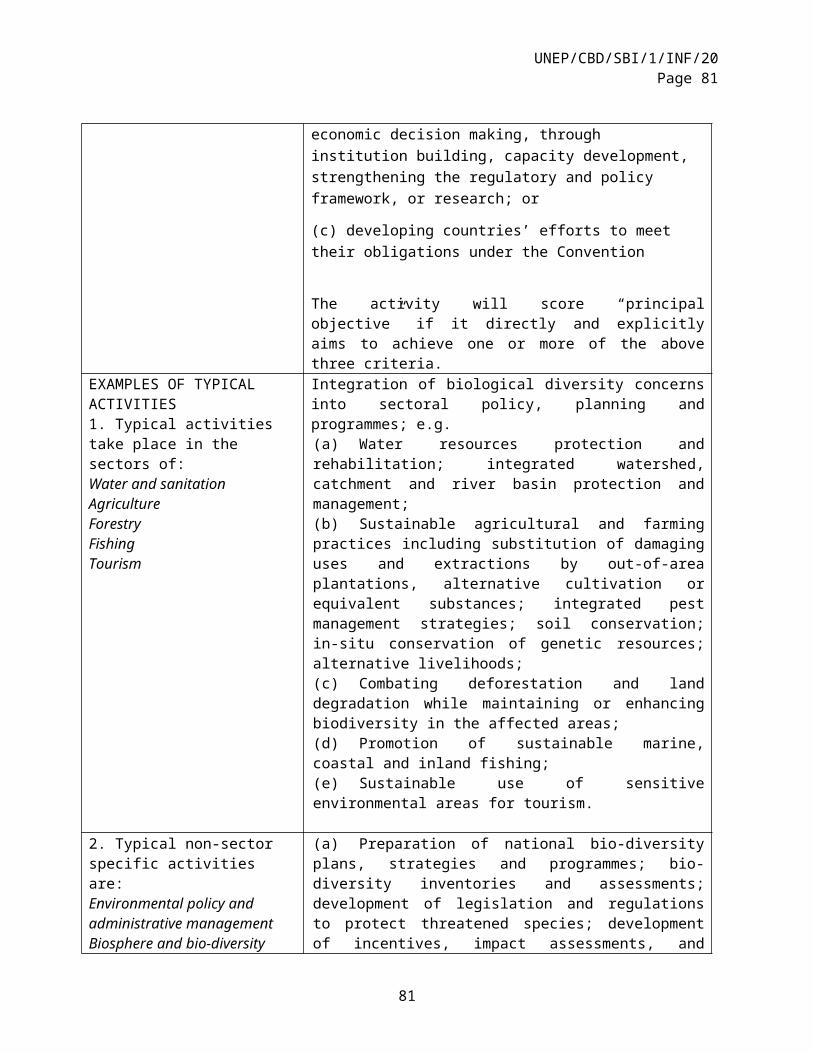
UNEP/CBD/SBI/1/INF/20Page 81
Overall, at the current stage of reporting, the difference in approaches does not allow for full comparability or for aggregation of contributions from Member States in a meaningful way. However, the European Commission and EU Member States are active in exchanging best practices and discussions on the best way forward and on methodologies are ongoing, to improve the reporting of progress towards the achievement of the Hyderabad global commitment, to which the EU and Member States resolved to contribute, together and for which it does not imply any specific burden-sharing agreement between Member States and/or the EU.
There are a number of initiatives in EU Member States and at EU level, including capacity building and training of relevant officials, to improve monitoring and reporting international biodiversity-related flows, for example to improve the use of Rio markers. There are also several efforts to engage the private sector, although there is not sufficient progress at this stage to translate this into quantitative data, and reported flows focus on ODA. In that context, the EU welcomes the ongoing initiatives in OECD DAC which should help make progress both in improving the use of Rio markers and on measuring private flows.
Progress compared to the 2006-2010 baseline is positive in the EU budget and in many EU Member States. For example in Italy, financial resource flows to developing countries has increased by 60% and Germany has more than doubled its contributions to biodiversity compared to the 2006-2010 baseline; and France has also made an important increase. It is worth highlighting that several Member States had already made important efforts during the baseline period. The Hyderabad commitments have been translated into formal national strategies in many Member States, such as for example in France, with the adoption by the French Development Agency (Agence Française de Développement) of its crosscutting framework of action on biodiversity.
Mainstreaming biodiversity in development sectors is an effective way to increase financial resource flows to developing countries. This is reflected in the relative increase of indirect flows in the EU budget and in many EU Member States.
Information on the availability of financial resources in each country.
In the EU, Regulation (EU) 691/2011 on European environmental economic accounts (SEEA) provides essential statistics to underpin environmental protection. The latest extension in 2013 includes Environmental Protection Expenditure Accounts, within which expenditure is allocated to environmental domains according to CEPA 2000 classification (Classification of Environmental Protection Activities and Expenditure). This connects to initiatives at national, EU, and international level (in particular the work of the UN Statistical division).
The Regulation also requires the collection of information on the private sector and other flows, and this information is therefore reported by many EU countries. In some cases, information on contribution from households is also provided (e.g. France). In some Member States, information on contributions at regional and local level, or contributions from NGOs are not available and figures are therefore underestimated.
The categories do not allow an easy distinction between direct and indirect flows and Member States therefore report on these categories in different ways, with several Member States only reporting on the total as a result of this constraint while others (such as Germany) are only reporting direct flows.
81
UNEP/CBD/SBI/1/INF/20Page 82
Many countries made efforts to collect data beyond formal statistics, for example on contributions from research and education (e.g. submission from Finland, Denmark and Poland). These sometimes represent substantial flows. However, distinguishing between direct or indirect flows was not always possible.
In the case of the EU central budget, a specific tracking methodology for domestic financial flows was developed. Although this will only be fully implemented in the current EU budget (2014-2020), applying the methodology ex post to the 2007-2013 budget has produced some first estimates.
Again, there are some positive trends in several EU Member States (e.g. Finland, France, Germany and Poland) as in most Member States and the EU budget, the very significant contribution from agriculture policy, in particular through agri-environment measures, is worth highlighting, as well as, to a lesser extent, from the fisheries sector. This is linked to the past EU reforms in these sectors.
Additional Notes on EU Financial Reporting
There is a long history of joint OECD/ESTAT collection of data on environmental expenditure (biodiversity included) and revenues.
For EU countries, guidance is provided by the EU Environmental Protection Expenditure Accounts Guidance61 as well as Eurostat Environmental expenditure statistics: General Government and Specialized Producers data collection handbook62 as well as with the SEEA documents. Additional guidance can be found in the industry data collection handbook and the latest Joint Questionnaire Eurostat/OECD on environmental protection expenditure and revenues. Additionally, methodologies regarding biodiversity support can be found in the latest methodological developments for environmental subsidies. All these manuals are compatible with SEEA.
The European Union has been exploring means of improving its tracking of its biodiversity expenditures. Part of this effort has been the engagement of the Institute for European Environmental Policy (IEEP) and consulting firm ICF International (with specialist Matt Rayment) to prepare a background document for a conference entitled “Workshop on developing a methodology for biodiversity tracking in the EU budget” held in Brussels on 30 September 2014. The workshop reviewed a range of issues with regard to budget tracking in the EU budget. Some of the key issues presented and discussed included the % attribution (coefficients) for secondary biodiversity activities (currently set at 40% for the EU, a figure that was considered too general for detailed assessments), the treatment of biodiversity harmful investments (considered as a separate issue) and other details. The background paper can be found at http://ec.europa.eu/environment/nature/biodiversity/financing_en.htm.
The background paper included some existing definitions of activities that would fall into the categories of direct biodiversity and indirect biodiversity and the background document produced a table with potential examples (see Annex).
The System for Environmental-Economic Accounting 2012 (SEEA) and its Classification of Environmental Activities (CEA)
The United National System for Environmental-Economic Accounting 2012 – SEEA Central Framework was adopted as an international standard by the United Nations Statistics Division in 2012. It is a conceptual framework for understanding the interactions between the economy and the environment, and 61 http://www.cbd.int/financial/finreporting/eu-epeaguide.pdf EU 200262 Environmental expenditure statistics: General Government and Specialised Producers data collection handbook. ISSN 1977-0375, 2007 edition, EUROSTAT © European Communities, 2007 http://ec.europa.eu/eurostat/documents/3888793/5840631/KS-RA-07-012-EN.PDF/b3a162ac-8cdc-4897-85f7-b10312752ecf?version=1.0
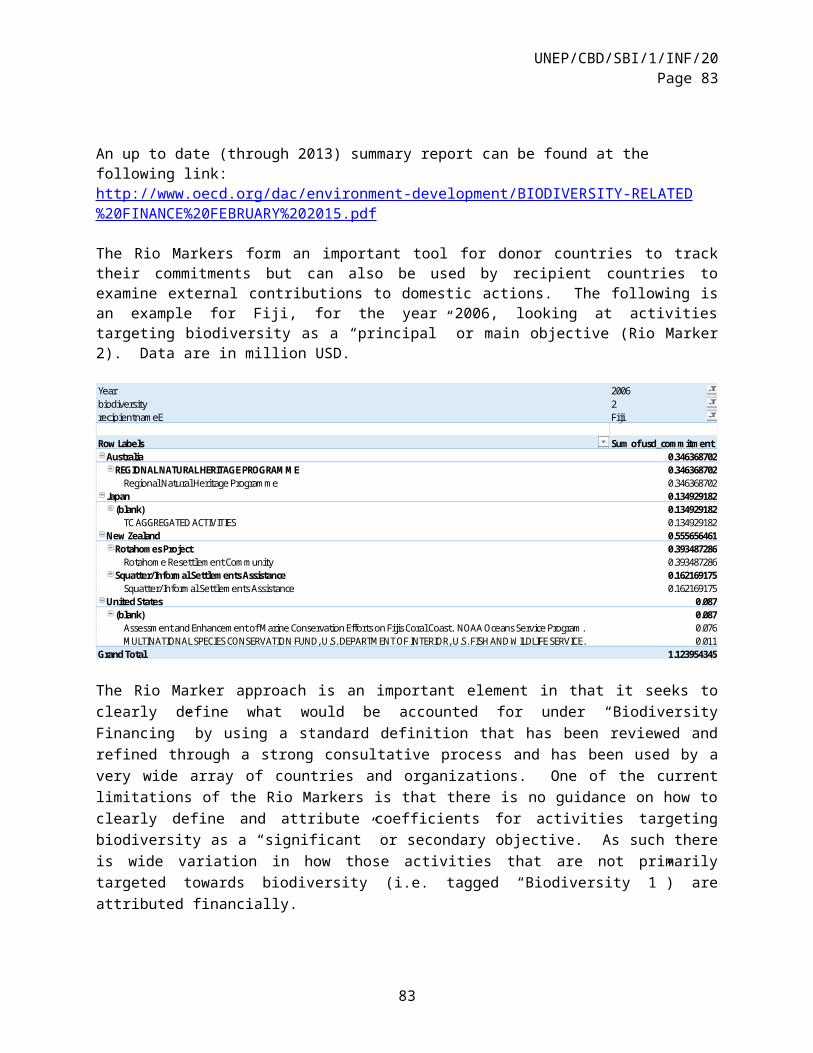
UNEP/CBD/SBI/1/INF/20Page 83
for describing stocks and changes in stocks of environmental assets such as forests, as well as non-renewable natural resources such as oil and minerals. It is the result of many years of collaborative work by many partner organizations seeking to better integrate environmental issues into the existing System of National Accounts (SNA). The SNA is part of the global standards for government reporting on economic activities in their countries – producing such common indices as Gross Domestic Product (GDP).
Many countries globally follow SEEA for financial and economic reporting. It contains guidance on environment activity accounts, including a Classification of Environmental Activities (CEA), which is composed of two groups. Group I, on environmental protection, mirrors the existing Classification of Environmental Protection Activities and Expenditures (CEPA), which has been an established international classification since 2000, while Group II covers resource management, following the Classification of Resource Use and Management Activities (CReMA). Within group I, CEA section 6 covers the protection of biodiversity and landscapes, while other sections may be considered to also contain activities that help contributing to the implementation of the Strategic Plan for Biodiversity.
The detailed description of the CEA and its two groups are provided in the Appendix. This Appendix also includes a review of activity lists for biodiversity actions that have been proposed for measuring expenditures in the EU. An additional category that deserves attention with regard to biodiversity expenditure is “The Prevention of Natural Hazards.”
Multi-lateral Development Bank Biodiversity Tracking
The European Investment Bank (EIB) is collaborating in a joint Multilateral Development Bank (MDB) working group, with the Inter-American Development Bank (IDB), Asian Development Bank (ADB), European Bank for Reconstruction and Development (EBRD), African Development Bank (AfDB), International Finance Corporation (IFC) and World Bank, in developing a methodology to track and report biodiversity finance flows.. The joint methodology is also expected to build trust and accountability with regard to biodiversity finance commitments and monitor trends and progress in biodiversity-related investments so as to ensure the mobilization, effective and productive use of limited financial resources for biodiversity ecosystems.
Given that biodiversity is a cross-cutting issue, the biodiversity financing tracking methodology will most likely rely heavily on the process and the experience gained in the field of climate adaptation finance tracking. This means that the MDB approach for biodiversity will be process based. The principles for this process are presently being defined however the following general aspects have been agreed so far:
All types of resources will be eligible for reporting irrespective of origin. However, all external resources will be clearly separated from own resources so as to avoid double counting;
Reporting will be linked to MDB financial commitments at time of Board approval and/or signature of the contractual documents;
All types of finance instruments deployed will be included (debt, equity, technical assistance, grants, etc.);
83
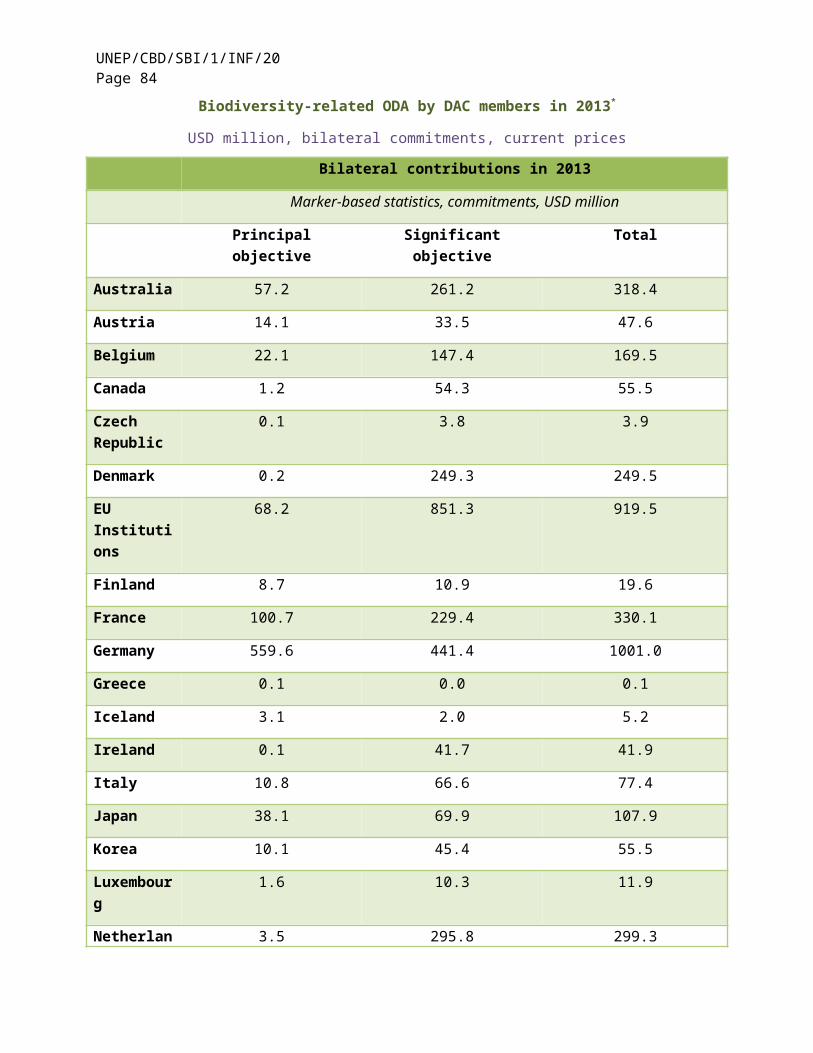
UNEP/CBD/SBI/1/INF/20Page 84
An activity can be a project, a project component, or a proportion of a project. This means that the joint approach will aim to report on biodiversity activities disaggregated from non-biodiversity activities through a reasonable level of data granularity.
Prior to the development of the detailed methodology, discussions with other partners such as the OECD, the International Development Finance Club (IDFCs) and the EU around the concept of biodiversity, an understanding of definitions of the different approaches and principles for biodiversity finance tracking need to take place.
The methodology to be developed will take into account the general principles listed above, the defined biodiversity criteria and definitions, propose a finance reporting process and provide examples of sector-specific biodiversity-related activities. The MDBs hope to then test the methodology and refine it with a view to be released at the thirteenth meeting of the Conference of the Parties to the Convention on Biological Diversity (CBD COP 13), to be held from 4 to 17 December 2016 in Mexico.
Experiences from other sectors
There are many examples of expenditure reviews from other sectors, including the fields of health, education and climate finance. This section describes progress in each of these fields.
Health expenditure reviews
The World Health Organization has long promoted the development of national health accounts. They propose a methodological framework that records three types of health care expenditures: classifications of the functions of health care, health care provision, and financing schemes, to answer these three questions: a) what kinds of health care goods and services are consumed; b) which health care providers deliver these goods and services; and c) which financing scheme pays for these goods and services? The result of this analysis can be used by governments, NGOs, private companies, insurance providers and others to understand the overall provision of health care in a country. A good resource for health expenditure reviews is WHO (2003) Guide to Producing National Health Accounts (available at http://www.who.int/nha/docs/English_PG.pdf; and World Bank (2009), Preparing Public Expenditure Reviews for Human Development, available at http://siteresources.worldbank.org/EXTPERGUIDE/Resources/PER-complete.pdf.
Another recent innovation is the OneHealth Tool, the result of a partnership between UNFPA, UNICEF, UNDP, UNAIDS, UNWOMEN, WHO and the World Bank. This is a software tool designed to strengthen health system analysis and costing and to enable policy makers to develop financing scenarios at the national level. The OneHealth Tool focuses not on a single disease, but rather the overall capacity of national health systems, providing a single framework for planning, costing, impact analysis, budgeting and financing of strategies for all major diseases and health system elements. For more information about the OneHealth Tool, see http://www.internationalhealthpartnership.net/en/tools/one-health-tool/.
Climate public expenditure and institutional reviews
In 2011, UNDP with UNEP support launched a program to conduct climate public expenditure and institutional reviews in 11 countries. A climate public expenditure and institutional review examines the linkages between the spheres of national climate change policy; the institutional structures through which
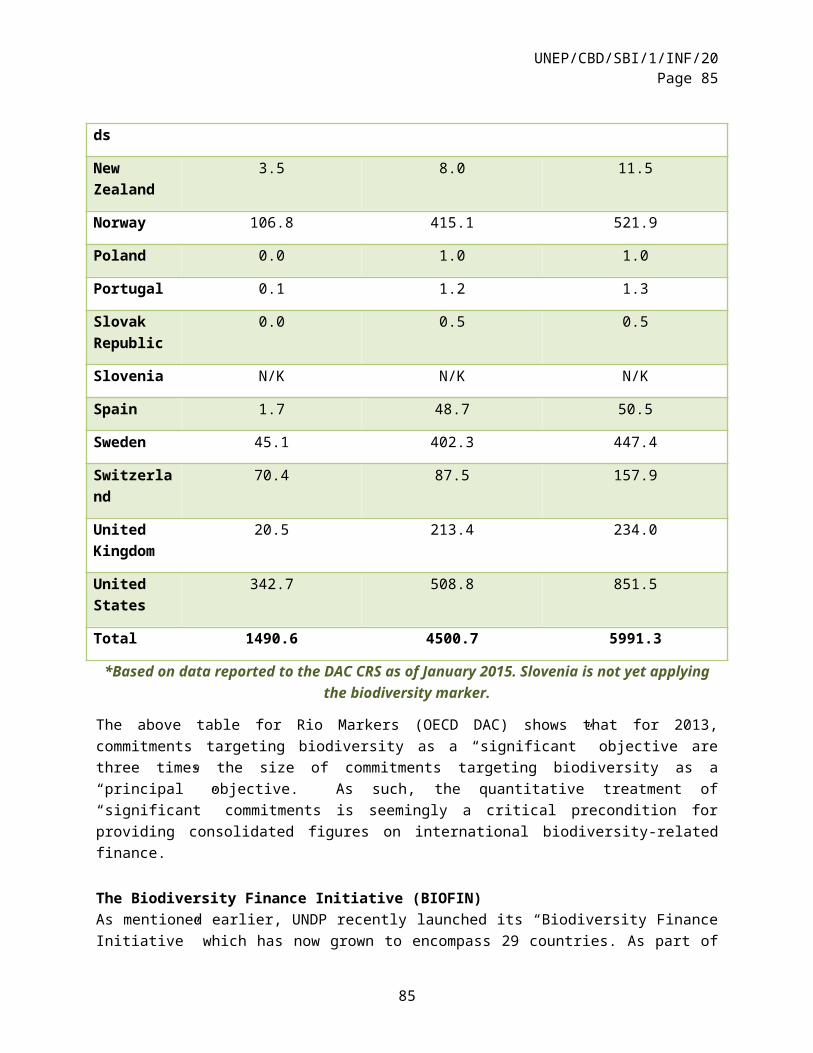
UNEP/CBD/SBI/1/INF/20Page 85
policy is channeled; and the resource allocation processes whereby public funding is made available for the implementation of relevant projects, programmes and policies. The methodology begins with a policy and institutional analysis, focusing on national climate-related policies (e.g., level of engagement within UNFCCC, monitoring and evaluation for climate change actions), and moves on to an institutional analysis (e.g., an analysis of roles and responsibilities, levels of national engagement and government capacities). This is followed by an expenditure review that defines the total volume of ‘climate-relevant expenditure’. Finally, a set of recommendations is usually made related to climate expenditures.
For more details about this methodology, see http://www.cbd.int/financial/climatechange/g-cpeirmethodology-undp.pdf and for summaries of 10 countries, see http://www.aideffectiveness.org/CPEIR.
Education expenditure reviews
Another field that has ample experience in expenditure reviews is education. The World Bank has long advocated that countries conduct an education expenditure review. Typically, such a review looks at such issues as access, efficiency and quality of education; equity issues; trends in spending over time, budget execution and operational efficiency, and specific policy recommendations for improving expenditures. A good example of an education expenditure review in the Philippines is available at: http://documents.worldbank.org/curated/en/2012/01/16764589/philippines-basic-education-public-expenditure-review.
BIBLIOGRAPHY AND REFERENCES
Submissions on the CBD preliminary reporting framework as well as earlier financial reporting is available under http://www.cbd.int/financial/reporting.shtml
EU Draft Regulation on Environmental Accounts Reporting -http://eur-lex.europa.eu/legal-content/EN/TXT/?qid=1416221752426&uri=CELEX:02011R0691-20140616
Background on the EU tracking of Environmental Protection Expenditure: http://ec.europa.eu/eurostat/statistics-explained/index.php/Environmental_protection_expenditure
Burundi. Citation : Ministère de l’Eau, de l’Environnement, de l’Aménagement du Territoire et de l’Urbanisme (2013) – Plan Stratégique d’Investissement et de Mobilisation des Ressources Financières dans le domaine de Biodiversité au Burundi 2013-2020. Bujumbura, 70p.
Transforming Biodiversity Finance: The Biodiversity Finance (BIOFIN) Workbook for assessing and mobilizing resources to achieve the Aichi Biodiversity Targets and to implement National Biodiversity Strategies and Action Plans. Appendices I and J.http://www.cbd.int/doc/meetings/fin/rmws-2014-04/other/rmws-2014-04-workbook-biofin-en.pdf
Aid targeting the objectives of the Convention on Biological Diversity. OECD Guidance on Rio markers:http://www.oecd.org/dac/stats/46782010.pdf
The Multilateral Environmental Agreements and the Rio Markers. Information note prepared by EuropeAid E6 Unit – "Natural Resources", September 2010http://capacity4dev.ec.europa.eu/system/files/file/15/01/2014_-_1445/eu_the_multilateral_environmental_agreeementsand_the_rio_markers_en.pdf
85

UNEP/CBD/SBI/1/INF/20Page 86
EU Biodiversity Budget Tracking
http://www.cbd.int/financial/finreporting/eu-epeaguide.pdf
http://ec.europa.eu/eurostat/help/new-eurostat-website
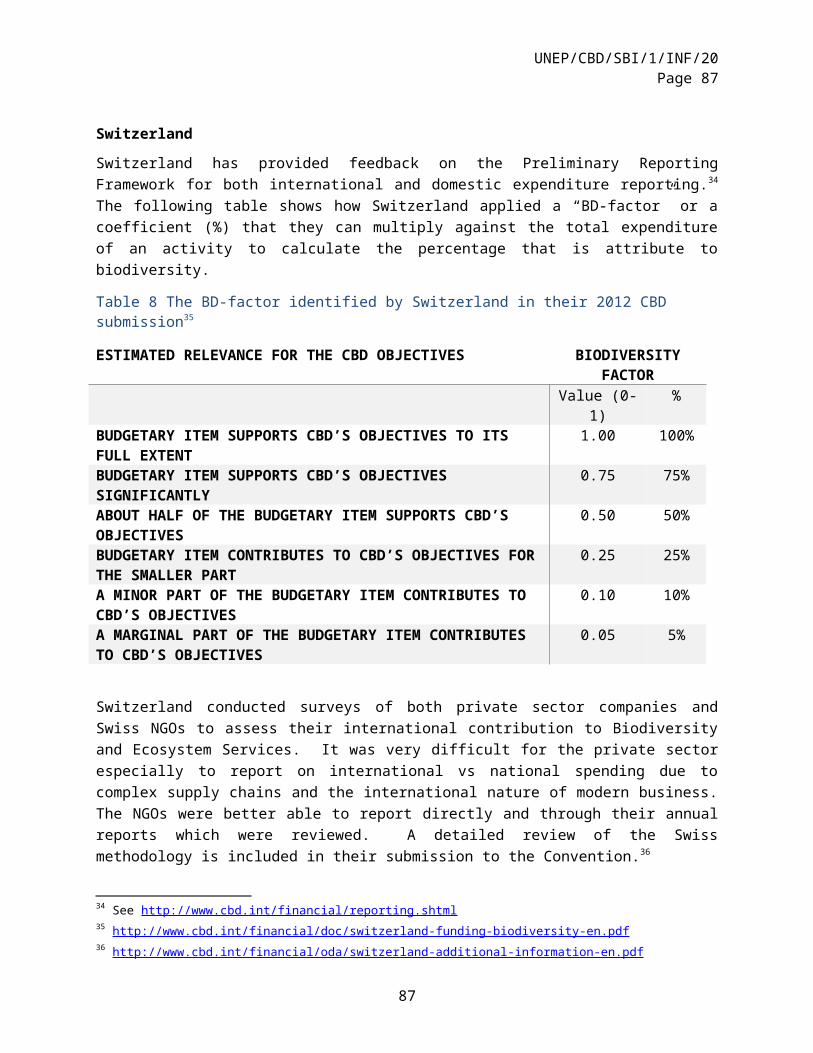
UNEP/CBD/SBI/1/INF/20Page 87
APPENDIX: BIODIVERSITY ACTIVITY CATEGORIES AND CLASSIFICATIONS
Categorization of Biodiversity Activities
The 20 Aichi Biodiversity Targets
Strategic Goal A: Address the underlying causes of biodiversity loss by mainstreaming biodiversity across government and society
Target 1: By 2020, at the latest, people are aware of the values of biodiversity and the steps they can take to conserve and use it sustainably.
Target 2: By 2020, at the latest, biodiversity values have been integrated into national and local development and poverty reduction strategies and planning processes and are being › incorporated into national accounting, as appropriate, and reporting systems.
Target 3: By 2020, at the latest, incentives, including subsidies, harmful to biodiversity are eliminated, phased out or reformed in order to minimize or avoid negative impacts, and positive incentives for the conservation and sustainable use of biodiversity are developed and applied, consistent and in harmony with the Convention and other relevant international obligations, taking into account national socio economic conditions.
Target 4: By 2020, at the latest, Governments, business and › stakeholders at all levels have taken steps to achieve or have implemented plans for sustainable production and consumption and have kept the impacts of use of natural resources well within safe ecological limits.
Strategic Goal B: Reduce the direct pressures on biodiversity and promote sustainable use
Target 5: By 2020, the rate of loss of all natural habitats, including forests, is at least halved and where feasible brought close to zero, and degradation and fragmentation is significantly reduced.
Target 6: By 2020 all fish and invertebrate stocks and aquatic plants are managed and harvested sustainably, legally and applying ecosystem based approaches, so that overfishing is avoided, recovery plans and measures are in place for all depleted species, fisheries have no significant adverse impacts on threatened species and vulnerable ecosystems and the impacts of fisheries on stocks, species and ecosystems are within safe ecological limits.
Target 7: By 2020 areas under agriculture, aquaculture and forestry are managed sustainably, ensuring conservation of biodiversity.
Target 8: By 2020, pollution, including from excess nutrients, has been brought to levels that are not detrimental to ecosystem function and biodiversity.
87
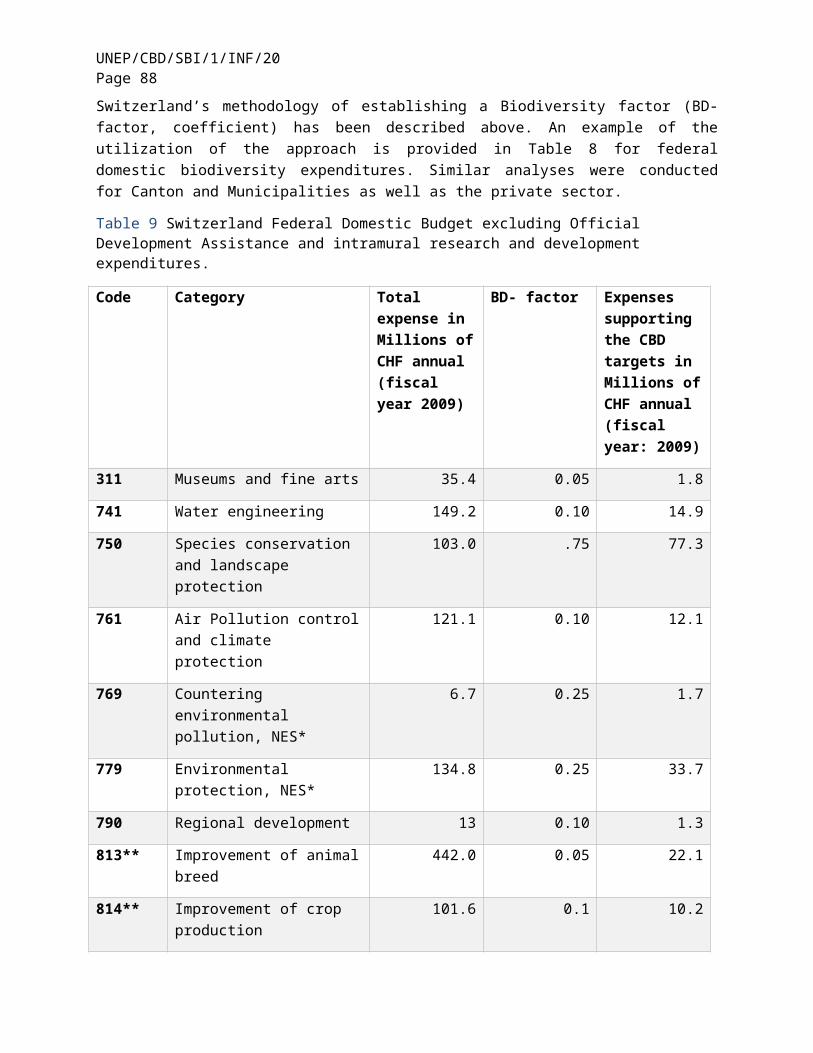
UNEP/CBD/SBI/1/INF/20Page 88
Target 9: By 2020, invasive alien species and pathways are identified and prioritized, priority species are controlled or eradicated, and measures are in place to manage pathways to prevent their introduction and establishment.
Target 10: By 2015, the multiple anthropogenic pressures on coral reefs, and other vulnerable ecosystems impacted by climate change or ocean acidification are minimized, so as to maintain their integrity and functioning.
Strategic Goal C: Improve the status of biodiversity by safeguarding ecosystems, species and genetic diversity
Target 11: By 2020, at least 17 per cent of terrestrial and inland water, and 10 per cent of coastal and marine areas, especially areas of particular importance for biodiversity and ecosystems are conserved through effectively and equitably managed, ecologically representative and well connected systems of protected areas and other effective area-based conservation measures, and integrated into the wider landscape and seascapes.
Target 12: By 2020 the extinction of known threatened species has been prevented and their conservation status, particularly of those most in decline, has been improved and sustained.
Target 13: By 2020, the genetic diversity of cultivated plants and farmed and domesticated animals and of wild relatives, including other socio-economically as well as culturally valuable species, is maintained, and strategies have been developed and implemented for minimizing genetic erosion and safeguarding their genetic diversity.
Strategic Goal D: Enhance the benefits to all from biodiversity and ecosystem services.
Target 14: By 2020, ecosystems that provide essential services, including services related to water, and contribute to health, livelihoods and well-being, are restored and safeguarded, taking into account the needs of women, indigenous and local com- munities, and the poor and vulnerable.
Target 15: By 2020, ecosystem resilience and the contribution of biodiversity to carbon stocks has been enhanced, through conservation and restoration, including restoration of at least 15 per cent of degraded ecosystems, thereby contributing to climate change mitigation and adaptation and to combating desertification.
Target 16: By 2015, the Nagoya Protocol on Access to Genetic Resources and the Fair and Equitable Sharing of Benefits Arising from their Utilization is in force and operational, consistent with national legislation.
Strategic Goal E: Enhance implementation through participatory planning, knowledge management and capacity building
Target 17: By 2015 each Party has developed, adopted as a policy instrument, and has commenced implementing an effective, participatory and updated national biodiversity strategy and action plan.
Target 18: By 2020, the traditional knowledge, innovations and practices of indigenous and local communities relevant for the conservation and sustainable use of biodiversity, and their customary use of biological resources, are respected, subject to national legislation and relevant
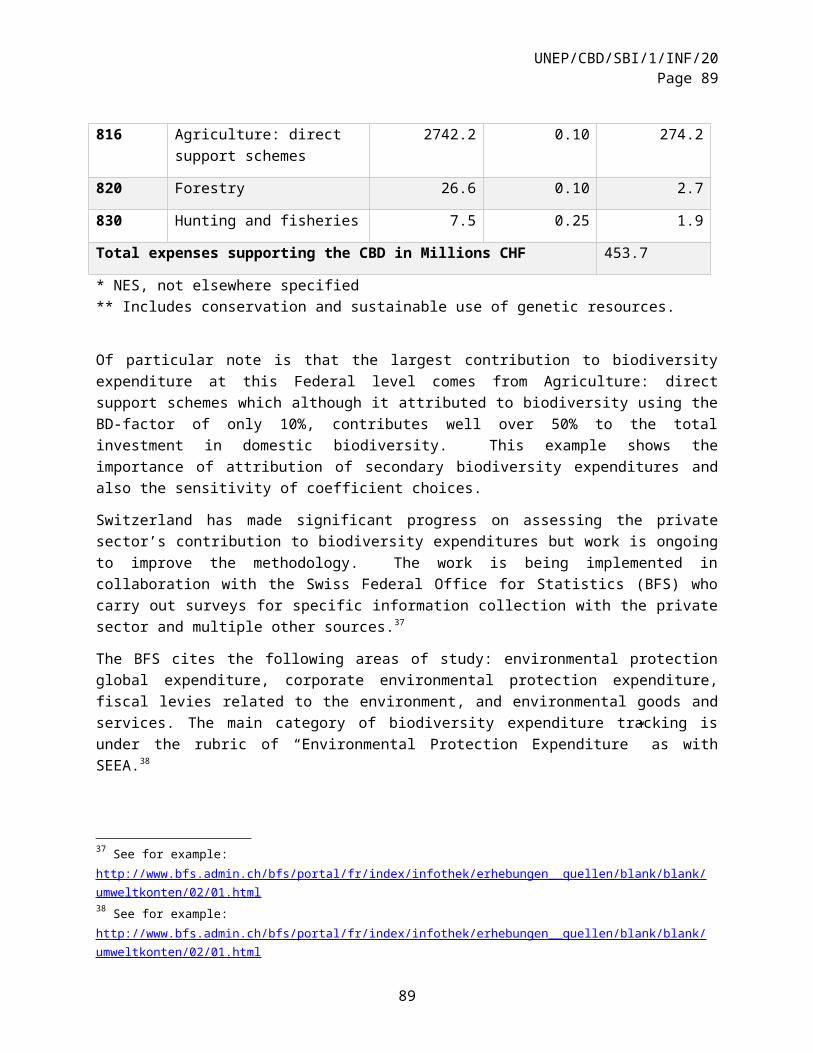
UNEP/CBD/SBI/1/INF/20Page 89
international obligations, and fully integrated and reflected in the implementation of the Convention with the full and effective participation of indigenous and local communities, at all relevant levels.
Target 19: By 2020, knowledge, the science base and technologies relating to biodiversity, its values, functioning, status and trends, and the consequences of its loss, are improved, widely shared and transferred, and applied.
Target 20: By 2020, at the latest, the mobilization of financial resources for effectively implementing the Strategic Plan 2011- 2020 from all sources and in accordance with the consolidated and agreed process in the Strategy for Resource Mobilization should increase substantially from the current levels. This target will be subject to changes contingent to resources needs assessments to be developed and reported by Parties.
Proposed typology of Biodiversity related EU ExpendituresFrom Common guidance on definition and criteria for biodiversity expenditure in the EU budget, Background document for EU level workshop (30 Sep 2014, Brussels), Study on Tracking Biodiversity Expenditure in the EU Budget - project number: ENV.B.2/ETU/2013/0061r, IEEP collaboration with ICF – page 10-13.
Table 2: Proposed typology of biodiversity related EU expenditures by the study team Type of expenditure
Examples of expenditure with a primary biodiversity objective (100% marker)
Examples of expenditure with a significant biodiversity objective (40% marker)
Examples of expenditure which are not biodiversity related (0% marker)
Protected areas All actions to identify, implement and manage protected areas designated primarily on biodiversity criteria, including: - Natura 2000; and - national protected areas
Actions which support protected areas alongside other objectives not related to biodiversity.
Actions relating to sites which do not provide biodiversity benefits, e.g.: - built environment designations.
Species conservation measures - All species conservation measures (in situ and ex situ) which focus primarily on the conservation and sustainable use of the species; - development and enforcement of policies, plans and strategies designed primarily to further species protection and sustainable use.
Activities with a significant species conservation objective among other objectives, e.g.: - species research with objectives to further commercial exploitation, where species conservation is a secondary objective.
Species focused actions with a purely commercial or recreational focus, e.g.: - commercial agriculture and aquaculture, hunting, commercial R&D on use of species.
89
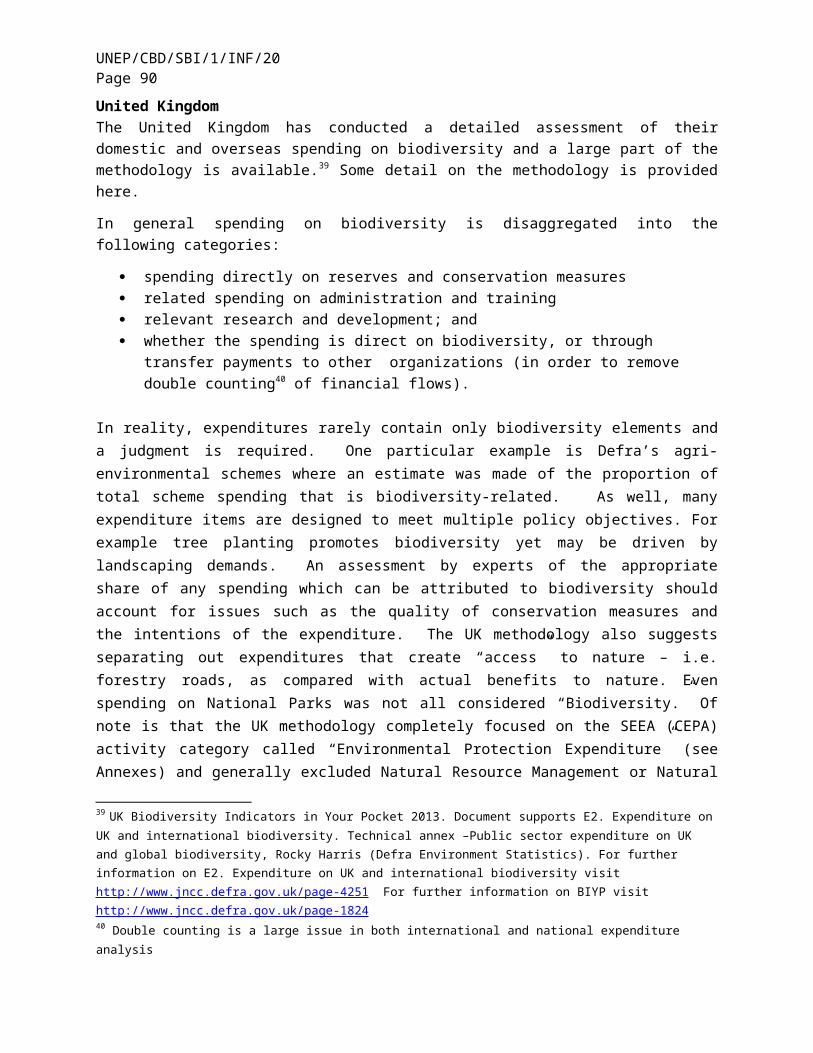
UNEP/CBD/SBI/1/INF/20Page 90
Infrastructure investments Green infrastructure: Development, restoration, protection and management of green infrastructure with a primary objective of conservation and management of biodiversity and related ecosystems, e.g.: - habitat restoration, re-creation and management, - creation of ecological networks, - related research, education, advisory and monitoring activities
Green infrastructure combined with grey infrastructure: Expenditures which include some green infrastructure elements, where biodiversity is a significant objective alongside other benefits and services, e.g.: - urban drainage and water purification schemes which include some green infrastructure elements; - recreation investments for which biodiversity and ecosystems form a significant element alongside other measures.
Grey infrastructure: Infrastructure investments with no objective relating to biodiversity. This may include expenditures that target specific ecosystem services which are not dependent on the diversity or natural functioning of ecosystems. e.g.: - plantation of single species non-native trees; - hedges for landscaping, screening, prevention of erosion; - grey infrastructure projects (e.g. constructed drainage or flood defence schemes).
Conservation of genetic diversity In situ and ex-situ conservation actions primarily concerned with maintaining genetic diversity (e.g. - management of collections and seed-banks; - research into genetic diversity.
Research, surveys and collections with objectives to further commercial exploitation of genetic resources, where conservation is a secondary objective.
R&D activities with a purely commercial focus.
Control of invasive alien species (IAS)
Actions to control IAS, where the primary motivation is to conserve biodiversity, e.g.: - habitat restoration, protection of other species or ecosystem structure and functions.
Actions to control IAS where biodiversity is a significant but not the primary objective, e.g.: - control of species which cause agricultural damage as well as impacting on other species and habitats.
General actions which may help to control IAS but for which control of IAS is not one of the main objectives (e.g. general border controls)
Sustainable agriculture and agri-environment measures
Agricultural management practices focusing on species and habitats and related ecosystem services, e.g.: - conservation schemes for
Agricultural management activities which target biodiversity and related ecosystem services as well as other objectives, e.g.:
Agricultural management activities without a significant biodiversity objective, e.g.: - physical investments where the
UNEP/CBD/SBI/1/INF/20Page 91
farmland birds, mammals, pollinators or plants; - species rich grassland maintenance or restoration measures; - management for ecosystem services such as soil and water quality with the maintenance or improvement of aquatic or soil biodiversity as a primary objective
- management of agricultural land that benefits biodiversity and related ecosystem services alongside other objectives, such as tourism, reducing greenhouse gas emissions, climate adaptation etc; - integrated pest management designed to achieve biodiversity and agronomic objectives, etc.
objective is to improve the economic performance of farms or to facilitate restructuring and modernisation; - measures to reduce greenhouse gas emissions from agriculture
Sustainable forestry and forest environment measures
Forest management practices focusing on species and habitats, e.g.: - conservation schemes for woodland species; - restoration of native woodland habitats.
Forest management activities which target biodiversity and related ecosystem services as well as other objectives, e.g.: - planting, restoration and management of woodlands for a combination of biodiversity, timber, recreational and water protection benefits, where biodiversity and related ecosystem services are not the sole or primary objective.
Forestry activities with no biodiversity objective, e.g.: - creation or management of non-native plantation woodlands.
Sustainable fisheries and marine management actions
Fisheries and marine management actions primarily focusing on conservation, e.g.: - implementation and enforcement of no take zones, marine protected areas, conservation plans; - related research, surveys, monitoring, training and education.
Fisheries actions designed to meet biodiversity and related ecosystem services as well as other objectives, e.g.: - monitoring, training, research and consultation activities for which biodiversity is a significant objective but not the main focus
- Marine planning, management and monitoring measures for which conservation and sustainable use of
Fisheries actions without a biodiversity objective, e.g.: - training and investments designed to enhance productivity; - retraining; - expenditures designed to enhance socio-economic welfare of fishing communities
Marine management actions without a significant biodiversity objective, e.g.:
91
UNEP/CBD/SBI/1/INF/20Page 92
biodiversity is a significant objective. - actions focused on marine
renewables, ports, shipping, etc.
Tourism and recreation Tourism and recreation initiatives that have biodiversity action as a primary objective, e.g.: - awareness raising; - visitor-payback schemes.
Sustainable, nature-based tourism activities that have both biodiversity and socio-economic objectives, e.g.: - visitor centres that seek to boost tourism as well as raise awareness
Tourism schemes with purely commercial or economic objectives
Pollution control Pollution control expenditures which are specifically focused on restoring the condition of a particular site or habitat, e.g.: - measures targeted at a Natura 2000 site.
Pollution control measures which are designed to meet biodiversity and other objectives, e.g.: - water pollution control measures where restoration of habitats is a significant, but not the main objective.
Pollution control measures designed to enhance human health, sanitation and general environmental quality, without a specific biodiversity objective (including air and water pollution control, waste management and soil decontamination)
Climate change mitigation and adaptation
Actions specifically focused on the adaptation of species and habitats to climate change, e.g.: - Ecosystem based adaptation to climate change where the primary objective is to restore, maintain and enhance biodiversity and related ecosystems; - research, action planning, adaptive management; - mitigation actions where conservation of ecosystems and biodiversity is the primary focus (e.g. REDD+)
Climate change mitigation and adaptation expenditures where biodiversity is a significant objective but not the main focus, e.g.: - Adaptation to climate change which involves ecosystem based adaptation as a significant, but not the primary objective; - research which addresses biodiversity alongside other effects of climate change; - mitigation actions which have biodiversity co-benefits as a secondary objective (e.g. including forest conservation/ creation alongside other measures)
General measures designed to contribute to climate change mitigation and adaptation, without a specific biodiversity objective, e.g.: - investment in renewables; - cleaner technologies; - infrastructure-based adaptation to climate change with no relevance for biodiversity including defence walls, dykes, training for civil servants, civil protection services; - general climate research.
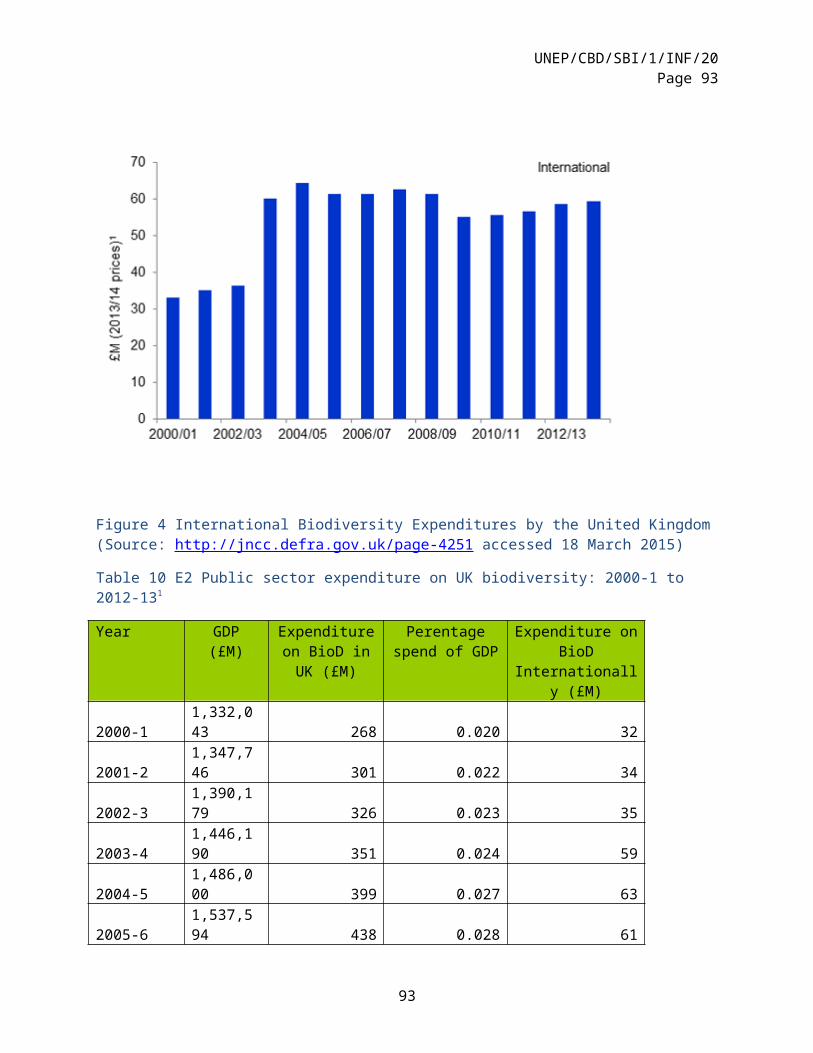
UNEP/CBD/SBI/1/INF/20Page 93
Access and Benefits Sharing Development, implementation and administration of policy and legislation on access to and sharing of the benefits of genetic resources (where this aims to deliver biodiversity benefits).
Policy and administrative measures, e.g.: - relating to intellectual property, borders and customs for which ABS is a significant objective but not the primary objective.
General expenditures which may help to administer ABS policies but for which this is not one of the main objectives, e.g.: - administration of customs and border controls, intellectual property rights.
Research, surveys, monitoring and data management
Research, surveys, monitoring and data management specifically focused on ecosystems, species and/or genetic diversity
Research into sustainable agriculture/ land management that includes biodiversity as well as impacts on pollution and resource use
General agri-environment, forest management, fisheries, climate or environmental research without a significant and explicit biodiversity related objective
Education, training and capacity building
Education, awareness raising, training and capacity building measures focusing specifically and primarily on conservation and sustainable use of biodiversity
Education, awareness raising, training and capacity building measures with a significant biodiversity objective, e.g.: - environmental training for farmers and fishermen which includes biodiversity and other environmental issues; - environmental education and awareness raising programmes with a significant biodiversity component.
General environmental education, awareness raising, training and capacity building measures without a significant and specific biodiversity objective
Development and implementation of policies, plans and strategies
Development, implementation and enforcement of all plans and strategies for which biodiversity is a primary objective, e.g.: - national biodiversity strategies and action plans, species recovery plans, - Specific measures designed to integrate biodiversity into other
Development, implementation and enforcement of plans and strategies for which biodiversity is a significant but not the primary objective, e.g.: - plans for sustainable agriculture or water management.
Planning and policy measures in related fields which may influence biodiversity but for which biodiversity is not one of the main objectives, e.g.: - a wide range of climate, environment, agricultural, land use and spatial planning policies, strategies and plans.
93
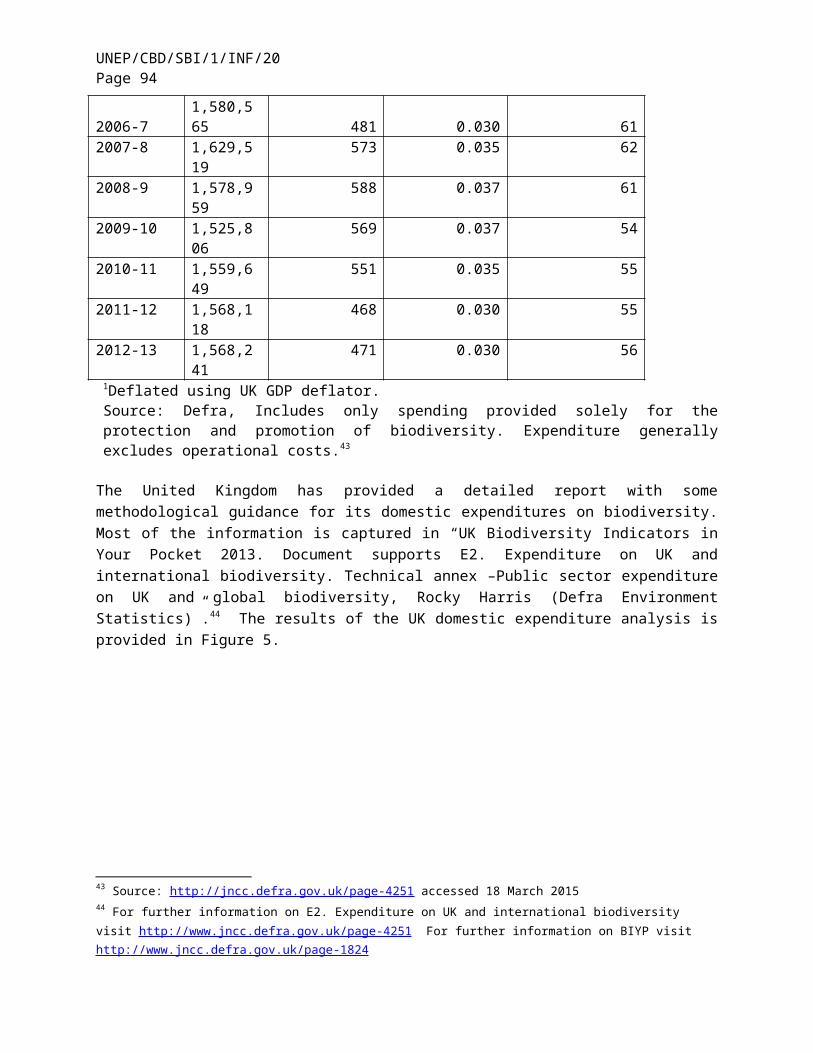
UNEP/CBD/SBI/1/INF/20Page 94
policies, plans and strategies (e.g. for water, agriculture, forestry, fisheries, tourism, development, spatial planning).
Source: ICF / IEEP analysis
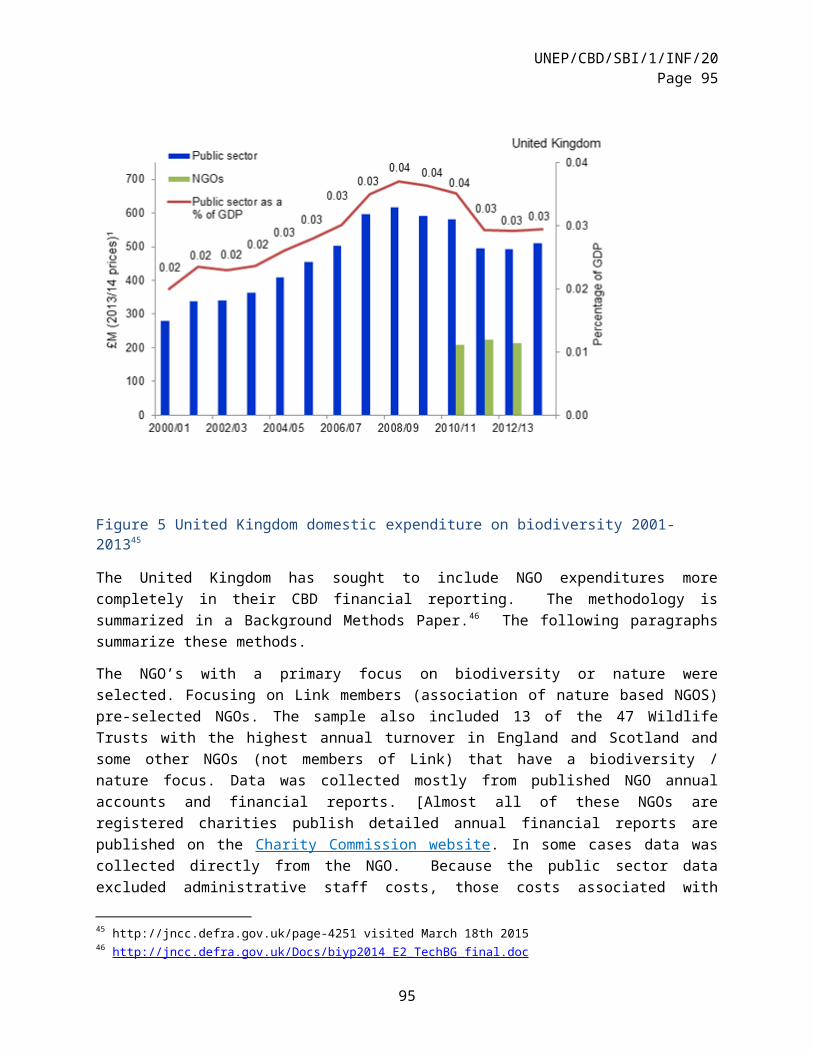
EU Biodiversity Activities Table 8 Methodology for the Classification of activities of bilateral ODA as implemented by the EC (original document, cited in UNEP/CBD/WGRI/5/INF/5 9 June 2014, and Switzerland submission)
Protected areas, protection of ecosystems and species
- Support for the creation and management of protected areas- Preservation of endangered species, reintroductions- Anti-poaching activities, fight against illegal trade of endangered species- Development of legislative framework for the protection of species and sites- Support for sustainable development activities in the buffer zones of protected areas- Research activities in protected areas management - Fight against invasive species - Establishment and operation of the structure of ex-situ conservation (zoos, botanical gardens and
conservatories, seed banks, gene banks, …) - Research activities for ex-situ conservation
Water and Sanitation
- Protection of water resources, improvement of water quality (when beneficial effects on fauna & flora expected)
- Fight against water pollution (rivers in particular) - Integrated management and protection of watersheds- Integrated management of wetlands
Agriculture
- Activities to reduce land use change and expansion of agriculture at the expense of natural areas- Promotion of environmentally-friendly agricultural practices (including agro-forestry, organic
farming) - Promotion of practices limiting chemical inputs (fertilizers, pesticides), IPM : integrated pest
management- Activities on soil conservation, fight against erosion
Forests
- Preservation of forests- Sustainable forest management (in part community forestry) - Fight against illegal logging, against deforestation for agriculture or livestock - Rehabilitation of areas affected by desertification- Forestry and agroforestry with high biodiversity value (promotion of natural forest / multi-species
plantations)- Institutional support awareness
Training, research and reaching in taxonomy, biodiversity, ecology, etc.
Awareness and public information
Fishing, hunting, gathering
- Promotion of sustainable fisheries (marine, coastal or lakes,/ rivers)
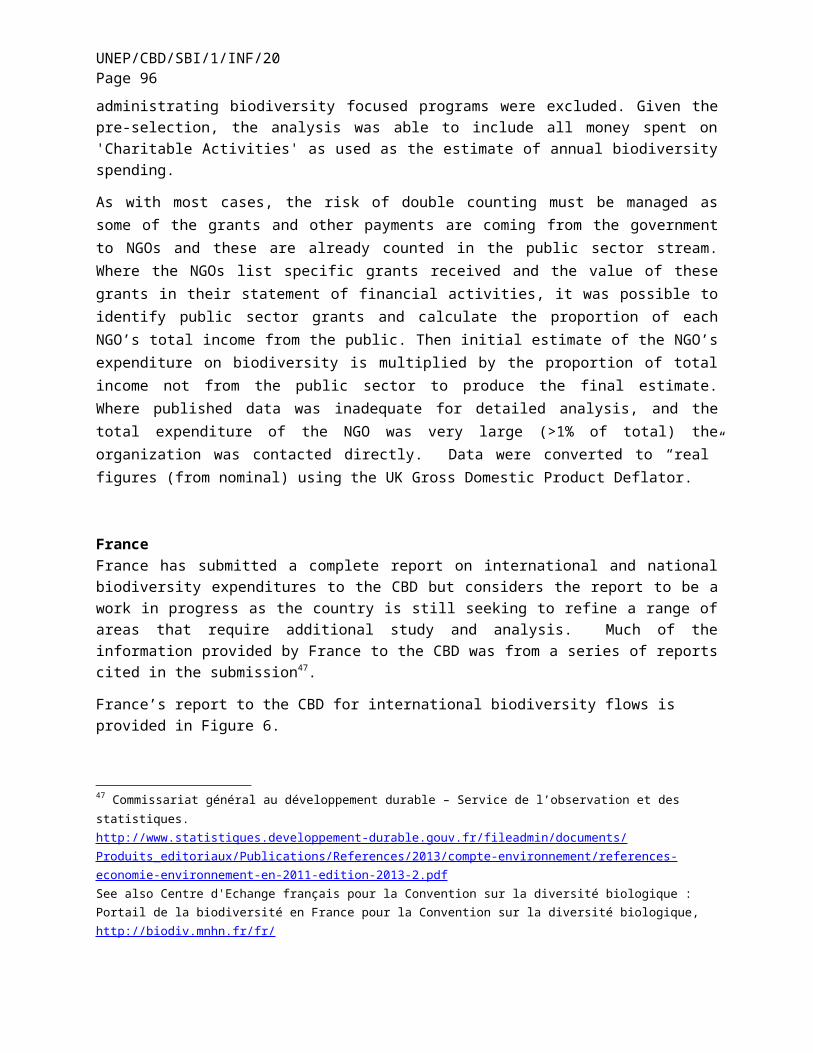
UNEP/CBD/SBI/1/INF/20Page 96
- Fight against overfishing, illegal fishing, destructive fishing practices- Inventories and research on the status of stocks, fishing capacity- Preservation of nursery areas, including mangroves- Preservation of coral reef - Promotion of sustainable hunting practices, Anti-poaching- Promotion of sustainable harvesting (include. Non timber forest products- Development of the legislative framework for the activities of fishing, hunting, gathering, - Institutional support, awareness
Business and Economy
- Fight against trade in endangered species, including awareness (of the authorities, consumers), training of personnel (customs, etc.)
- Fight against illegal trade in animal products / plants (bush meat, ivory, orchids, etc.) - Sustainable ecotourism, vision tourism, tourism - Valuing biodiversity- Research on economic valuation of biodiversity- Establishment of mechanisms for equitable access & benefit sharing (ABS) of genetic resources - Capacity building and awareness
Institutional Support / Obligations under the convention
- Preparation of inventories of biodiversity- Preparation and implementation of national plans and strategies for biodiversity conservation- Development of innovative, long term, financing mechanisms (trust funds, ecological taxes….) - Capacity Building- Development of tools for decision support (databases, information systems)
BMZ Sectoral Activities related to Biodiversity63 Sector Biodiversity sectoral component
Agriculture - Support of agrobiodiversity in the context of sustainable land management
- Support of organic farming with focus on conservation of biodiversity
Water management - Protection and rehabilitation of water basins and integrated management of watersheds, discharging areas and river basins and preservation of water-related ecosystems
- Use of ecological systems at the coastlines to prevent flooding as result of climate change (rehabilitation of mangrove systems)
Sustainable economic development - Assessment and conservation of ecosystem services
- Development of incentive mechanisms for the conservation of biodiversity in the context of financial system development
63 See http://www.bmub.bund.de/en/service/publications/downloads/details/artikel/committed-to-biodiversity/
UNEP/CBD/SBI/1/INF/20Page 97
- Implementation of biodiversity-related measures in tourism management
- Developing and applying methods and instruments to analyse, valorise, and preserve ecosystem services
Education - Integration of biodiversity and environment components in curricula
Policy Advise - Policy advisory to implement the CBD objectives / the CBD Strategic Plan (2011-2020) within the context of environmental policy projects (e.g. as contribution to the implementation of the Nagoya Protocol on Access & Benefit Sharing)
Private Sector Activities that might relate to BD Financing (from the internal Swiss report 2014)
“direct expenditures into site restoration or ecosystem and species conservation measures with a link to business activities or company properties,
direct sponsoring activities for projects in research, conservation or education,
direct investments into partnerships with NGOs with regard to BES or (multi-stakeholder) fora on land and natural resource management
investments into corporate environmental management such as emissions reduction, waste management, water consumption etc. or product development and stewardship, which also have a proportional effect on BES
investments into new financial mechanisms such as Payments for Ecosystem Services (PES)
In addition, environmental fees and compliance provisions can be linked to biodiversity and ecosystem services to a certain extent. Many sectors have additional specific measures and activities, e.g. investments into different types of complex cooperation with partners to develop certifiable environmentally friendly products. In most sectors, activities with an assumed regard to biodiversity are entangled with others, so that their contributions with regard to biodiversity per se can – according to the feedback of companies and the information provided in publicly accessible data bases and reports – be hardly assessed in detail.”
SEEA classification of Environmental Activities (CEA)
I. Environmental Protection
1 Protection of ambient air and climate1.1 Prevention of pollution through in-process modifications1.1.1 For the protection of ambient air1.1.2 For the protection of climate and ozone layer
97
UNEP/CBD/SBI/1/INF/20Page 98
1.2 Treatment of exhaust gases and ventilation air1.2.1 For the protection of ambient air1.2.2 For the protection of climate and ozone layer1.3 Measurement, control, laboratories and the like1.4 Other activities
2 Wastewater management2.1 Prevention of pollution through in-process modifications2.2 Sewerage networks2.3 Wastewater treatment2.4 Treatment of cooling water2.5 Measurement, control, laboratories and the like2.6 Other wastewater management activities
3 Waste management3.1 Prevention of pollution through in-process modifications3.2 Collection and transport3.3 Treatment and disposal of hazardous waste3.3.1 Thermal treatment3.3.2 Landfill3.3.3 Other treatment and disposal3.4 Treatment and disposal of non-hazardous waste3.4.1 Incineration3.4.2 Landfill3.4.3 Other treatment and disposal3.5 Measurement, control, laboratories and the like3.6 Other waste management activities
4 Protection and remediation of soil, groundwater and surface water4.1 Prevention of pollutant infiltration4.2 Cleaning up of soil and water bodies4.3 Protection of soil from erosion and other physical degradation4.4 Prevention and remediation of soil salinity4.5 Measurement, control, laboratories and the like4.6 Other activities
5 Noise and vibration abatement (excluding workplace protection)5.1 Preventive in-process modifications at the source5.1.1 Road and rail traffic5.1.2 Air traffic5.1.3 Industrial and other noise5.2 Construction of anti noise/vibration facilities5.2.1 Road and rail traffic5.2.2 Air traffic5.2.3 Industrial and other noise5.3 Measurement, control, laboratories and the like5.4 Other activities
6 Protection of biodiversity and landscapes 6.1 Protection and rehabilitation of species and habitats6.2 Protection of natural and semi-natural landscapes
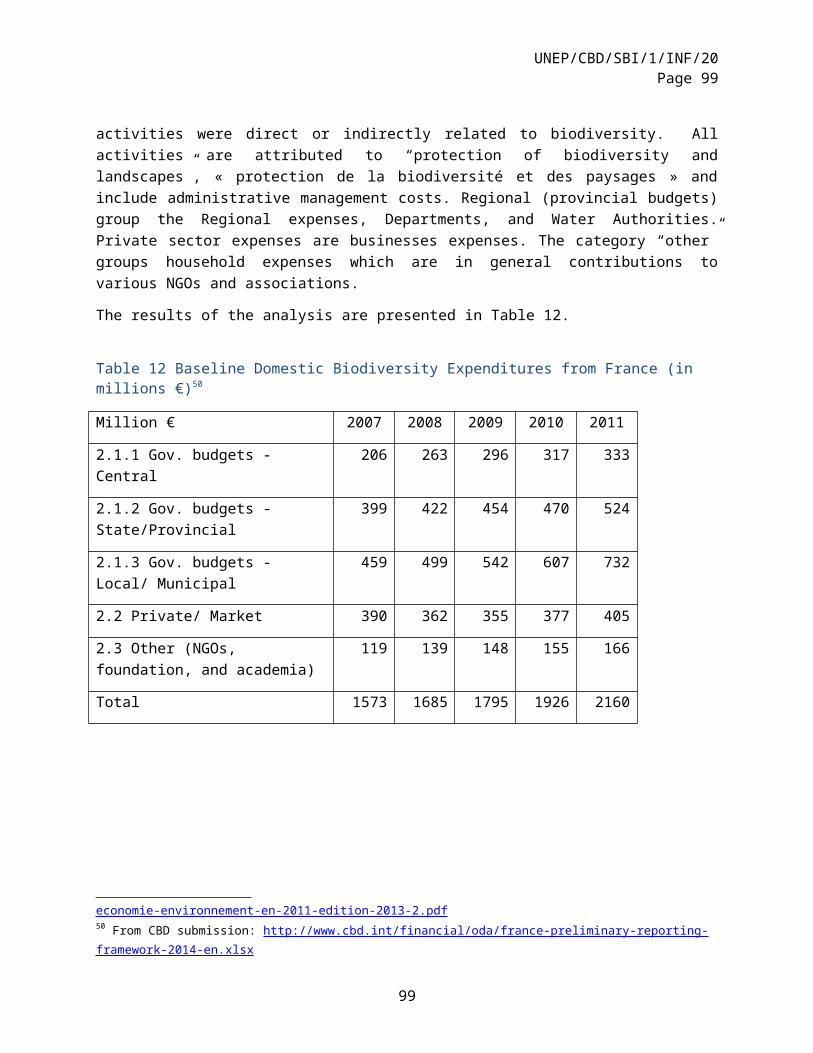
UNEP/CBD/SBI/1/INF/20Page 99
6.3 Measurement, control, laboratories and the like6.4 Other activities
7 Protection against radiation (excluding external safety)7.1 Protection of ambient media7.2 Transport and treatment of high-level radioactive waste7.3 Measurement, control, laboratories and the like7.4 Other activities
8 Research and development for environmental protection8.1 Protection of ambient air and climate8.1.1 Protection of ambient air8.1.2 Protection of atmosphere and climate8.2 Protection of water8.3 Waste8.4 Protection of soil and groundwater8.5 Abatement of noise and vibration8.6 Protection of species and habitats8.7 Protection against radiation8.8 Other research on the environment
9 Other environmental protection activities9.1 General environmental administration and management9.1.1 General administration, regulation and the like9.1.2 Environmental management9.2 Education, training and information9.3 Activities leading to indivisible expenditure9.4 Activities not elsewhere classified
II. Natural Resource Management (RM) (interim)
10 Management of mineral and energy resources10.1 Reduction of the intake of mineral and energy resources10.2 Reduction of mineral use through the reduction of scraps and the production and consumption of recycled materials and products and reduction of heat and energy losses and energy savings10.3 Measurement, control, laboratories and the like related to mineral and energy resources10.4 Other activities for the management of mineral and energy resources
11 Management of timber resources11.1 Reduction of the intake of timber resources11.2 Reduction of the consumption of forest (wood and non wood)-related products11.3 Reforestation and afforestation11.4 Forest fires11.5 Measurement, control, laboratories and the like related to natural timber resources11.6 Other activities for the management of timber resources
12 Management of aquatic resources12.1 Reduction of the intake of aquatic resources12.2 Replenishment of aquatic resources stocks12.3 Measurement, control, laboratories and the like related to aquatic resources
99
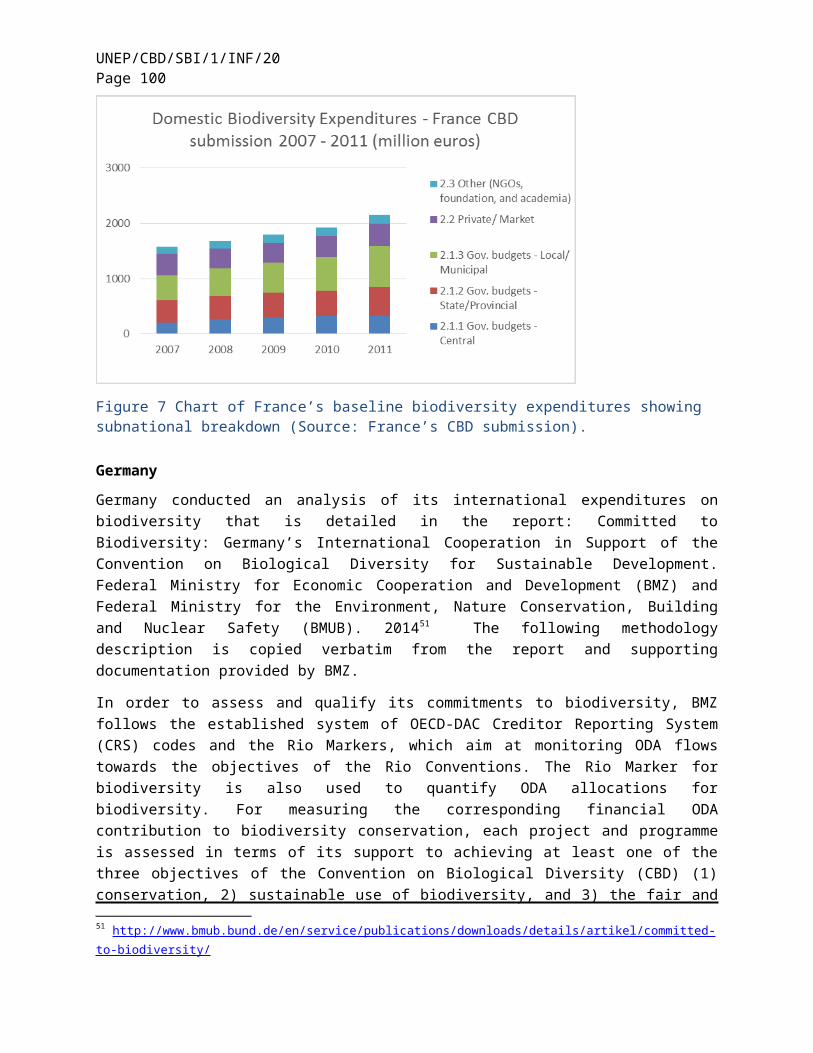
UNEP/CBD/SBI/1/INF/20Page 100
12.4 Other activities for the management of aquatic resources
13 Management of other biological resources (excluding timber and aquatic resources)13.1 Reduction of the intake of biological resources (excluding timber and aquatic resources)13.2 Replenishment of biological resources stocks (excluding timber and aquatic resources)13.3 Measurement, control, laboratories and the like related to biological resources stocks (excluding timber and aquatic resources)13.4 Other activities for the management of biological resources (excluding timber and aquatic resources)
14 Management of water resources14.1 Reduction of the intake of water resources14.2 Reduction of water losses and leaks, water reuse and savings14.3 Replenishment of water resources14.4 Measurement, control, laboratories and the like related to water resources14.5 Other activities for the management of water resources
15 Research and development activities for resource management15.1 Mineral and energy resources15.2 Timber resources15.3 Aquatic resources15.4 Other biological resources15.5 Water resources15.6 Other R&D activities for natural resource management
16 Other resource management activities16.1 General administration of natural resources16.1.1 General administration, regulation and the like16.1.2 Environmental management16.2 Education, training and information16.3 Activities leading to indivisible expenditure16.4 Activities not elsewhere classified
III. Natural Resource Use (RU) 17 Use of water resources17.1 Exploitation of water resources including water supply and distribution17.2 Exploration and development of water resources18 Use of natural forest resources18.1 Exploitation of natural forest areas (as a resource and not as a habitat)18.2 Exploration of natural forest areas19 Use of wild flora and fauna19.1 Exploitations of wild flora and fauna stocks19.2. Exploration and research of new reserves20 Use of fossil energy20.1 Exploitation of the stocks of non-renewable energy sources20.2 Exploration and discovery of new fossil energy reserves21 Use of minerals21.1 Exploitation of mineral stocks21.2 Exploration and discovery of new mineral stocks
IV. Minimization of Natural Hazards
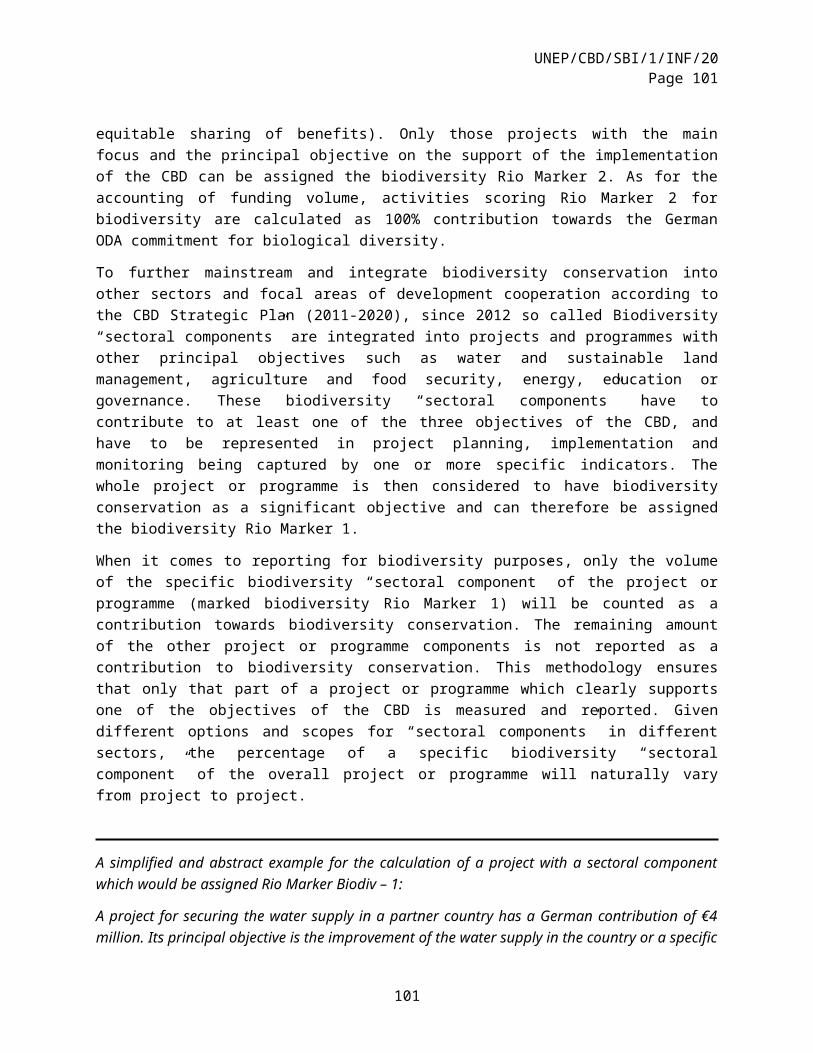
UNEP/CBD/SBI/1/INF/20Page 101
Activities associated with the minimization of the impact of natural hazards on the economy and society.
From SEEA Central Framework 201264 Appendix and other Sources (cited)
A. Classification of Environmental Activities (CEA)
I. Environmental protectionEnvironmental protection activities are those activities whose primary purpose is the prevention, reduction and elimination of pollution as well as any other degradation of the environment. This includes measures taken in order to restore the environment after it has been degraded due to the pressures from human activities. To be included under environmental protection, actions and activities must satisfy the primary-purpose criterion, i.e., that environmental protection is their primary objective. Actions and activities that have a favourable impact on the environment but which serve other goals do not come under environmental protection. Hence, excluded from the field of environmental protection are activities that, while beneficial to the environment, primarily satisfy technical needs or the internal requirements for hygiene or security of an enterprise or other institution.Activities like the saving of energy or raw materials are generally excluded from environmental protection and included instead under resource management (see below). However, such activities are considered environmental protection activities to the extent that they mainly aim at environmental protection.
1 Protection of ambient air and climateProtection of ambient air and climate comprises measures and activities aimed at the reduction of emissions into the ambient air or ambient concentrations of air pollutants as well as measures and activities aimed at the control of emissions of greenhouse gases and gases that adversely affect the stratospheric ozone layer.Excluded are measures undertaken for cost-saving reasons (e.g., energy saving).
1.1 Prevention of pollution through in-process modificationsActivities and measures aimed at the elimination or reduction of the generation of air pollutants through in-process modifications related to:• Cleaner and more efficient production processes and other technologies (cleaner technologies),• The consumption or use of “cleaner” (adapted) products.
Cleaner technologiesPrevention activities consist of replacing an existing production process by a new process designed to reduce the generation of air pollutants during production, storage or transportation, e.g., fuel combustion improvement, recovery of solvents, prevention of spills and leaks through improving airtightness of equipment, reservoirs and vehicles.
Use of cleaner productsPrevention activities consist of modifying facilities so as to provide for the substitution of raw materials, energy, catalysts and other inputs by non- (or less) polluting products, or of treating raw materials prior to their use in order to make them less polluting, e.g., desulfurization of fuel. Expenditure under this position also include the extra cost of the use of cleaner products (low sulphur fuels, unleaded gasoline, clean vehicles, etc.).
1.1.1 For the protection of ambient air
64 http://unstats.un.org/unsd/envaccounting/White_cover.pdf
101
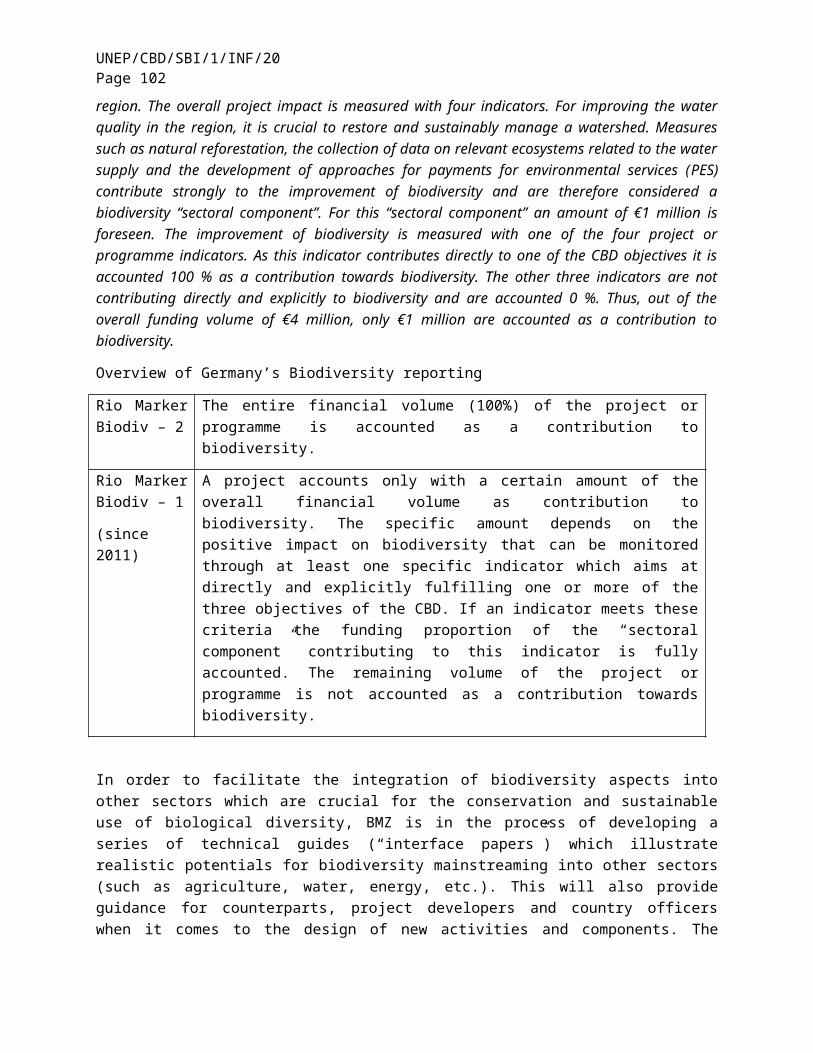
UNEP/CBD/SBI/1/INF/20Page 102
1.1.2 For the protection of climate and ozone layer
1.2 Treatment of exhaust gases and ventilation airActivities involving the installation, maintenance and operation of end-of-pipe equipment for the removal and reduction of emissions of particulate matter or other air-polluting substances either from the combustion of fuels or from processes: filters, dedusting equipment, catalytic converters, post-combustion and other techniques. Also included are activities aimed at increasing the dispersion of gases so as to reduce concentrations of air pollutants.Exhaust gases are emissions into the air, usually through exhaust pipes, stacks or chimneys, due to the combustion of fossil fuels. Ventilation air are exhausts of air conditioning systems of industrial establishments.
1.2.1 For the protection of ambient air
1.2.2 For the protection of climate and ozone layer
1.3 Measurement, control, laboratories and the likeActivities aimed at monitoring the concentrations of pollutants in exhaust gases, the quality of air, etc. Included are measurement services of exhaust gases from vehicles and heating systems and the monitoring related to ozone layer, greenhouse gases and climate change. Weather stations are excluded.
1.4 Other activitiesAll other activities and measures aimed at the protection of ambient air and climate. These include regulation, administration, management, training, information and education activities specific to CEPA 1, when they can be separated from other activities related to the same class and from similar activities related to other environmental protection classes.
2 Wastewater managementWastewater management comprises activities and measures aimed at the prevention of pollution of surface water through the reduction of the release of wastewater into inland surface water and seawater. It includes the collection and treatment of wastewater, including monitoring and regulation activities. Septic tanks are also included.Excluded are actions and activities aimed at the protection of groundwater from pollutant infiltration and the cleaning up of water bodies after pollution (see CEPA 4).Wastewater is defined as water that is of no further immediate value for the purpose for which it was used or in the pursuit of which it was produced, because of quality, quantity or time of its occurrence.
2.1 Prevention of pollution through in-process modificationsActivities and measures aimed at reducing the generation of surface water pollutants and wastewater through in-process modifications related to:• Cleaner and more efficient production processes and other technologies (cleaner technologies)• The consumption or use of “cleaner” (adapted) products
Cleaner technologiesPrevention activities consist of replacing an existing production process by a new process designed to bring about a reduction of water pollutants or wastewater generated during production. These include separation of networks, treatment and reuse of water used in the production process, etc.
Use of cleaner products
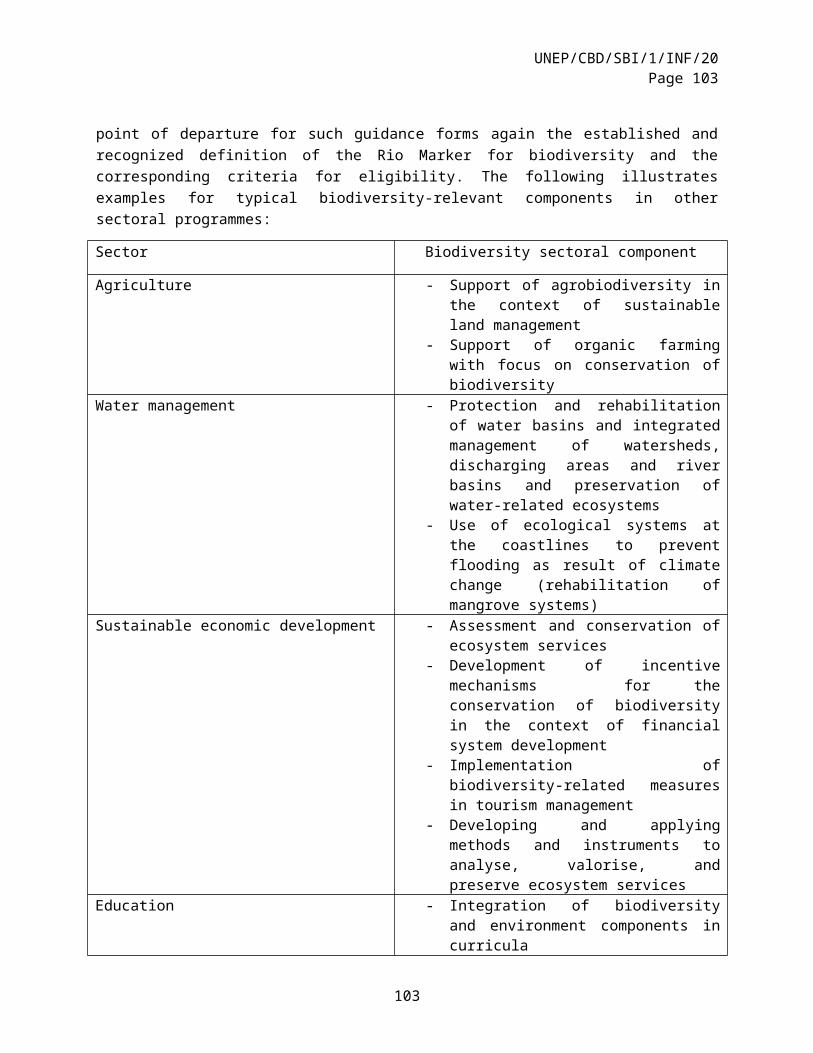
UNEP/CBD/SBI/1/INF/20Page 103
Prevention activities consist of modifying an existing production process so as to provide for the substitution of raw materials, catalysts and other inputs by non- (or less) water polluting products.
2.2 Sewerage networksActivities aimed at the operation of sewerage networks, i.e., the collection and transport of wastewater from one or several users, as well as rainwater, by means of sewerage networks, collectors, tanks and other means of transport (sewage vehicles, etc.), including maintenance and repair.Sewerage networks are the systems of collectors, pipelines, conduits and pumps designed to evacuate any wastewater (rainwater, domestic and other wastewater) from the points of generation to either a sewage treatment plant or to a point where wastewater is discharged into surface water.
2.3 Wastewater treatmentWastewater treatment designates any process for rendering wastewater fit to meet applicable environmental standards or other quality norms. Three broad types of treatment (mechanical, biological and advanced) are specified below. Alternative definitions of types of treatment may be used, e.g., based on removal rates for biological oxygen demand (BOD).
Mechanical treatment of wastewater designates processes of a physical and mechanical nature that result in decanted effluent and separate sludge. Mechanical processes are also used in combination and/or in conjunction with biological and advanced unit operations. Mechanical treatment is understood to include at least such processes as sedimentation, flotation, etc. The activity is aimed at separating materials in suspension by the use of screens (large solids) or through sedimentation eventually assisted by chemicals or flotation (elimination of sand, oil, part of the sludge, etc.). Equipment includes screens for large solids, biological plants, equipment for filtration, flocculation, sedimentation; separation of oils and hydrocarbons; separation using inertia or gravity, including hydraulic and centrifugal cyclones, diaphragm floats, etc.
Biological treatment of wastewater designates processes that employ aerobic or anaerobic microorganisms and result in decanted effluent and separate sludge containing microbial mass together with pollutants. Biological treatment processes are also used in combination and/or in conjunction with mechanical and advanced unit operations. This activity is designed to eliminate pollution from oxidizable materials through the use of bacteria: activated sludge technique or anaerobic treatment for specific concentrated wastewater. Biodegradable materials are treated with the addition of bacteria-enriched sludge in open or closed tanks.
Treatment of wastewater by advanced technologies designates processes capable of reducing specific constituents in wastewater not normally achieved by other treatment options. Covers all unit operations that are not considered to be mechanical or biological. Includes, for example, chemical coagulation, flocculation and precipitation; break-point chlorinating; stripping; mixed media filtration; micro-screening; selective ion exchange; activated carbon absorption; reverse osmosis; ultrafiltration; electro-flotation. Advanced treatment processes may be used in combination and/or in conjunction with mechanical and biological unit operations. This activity is aimed at eliminating oxidizable non-biodegradable matter at a higher level, as well as metals, nitrate, phosphorus, etc., by using powerful biological or physical and chemical action. Special equipment is required for each depollution.
Septic tanks are settling tanks through which wastewater is flowing and the suspended matter is decanted as sludge. Organic matters (in the water and in the sludge) are partly decomposed by anaerobic bacteria and other microorganisms. Maintenance services of septic tanks (emptying, etc.) and other products for septic tanks (biological activators, etc.) are included.
103
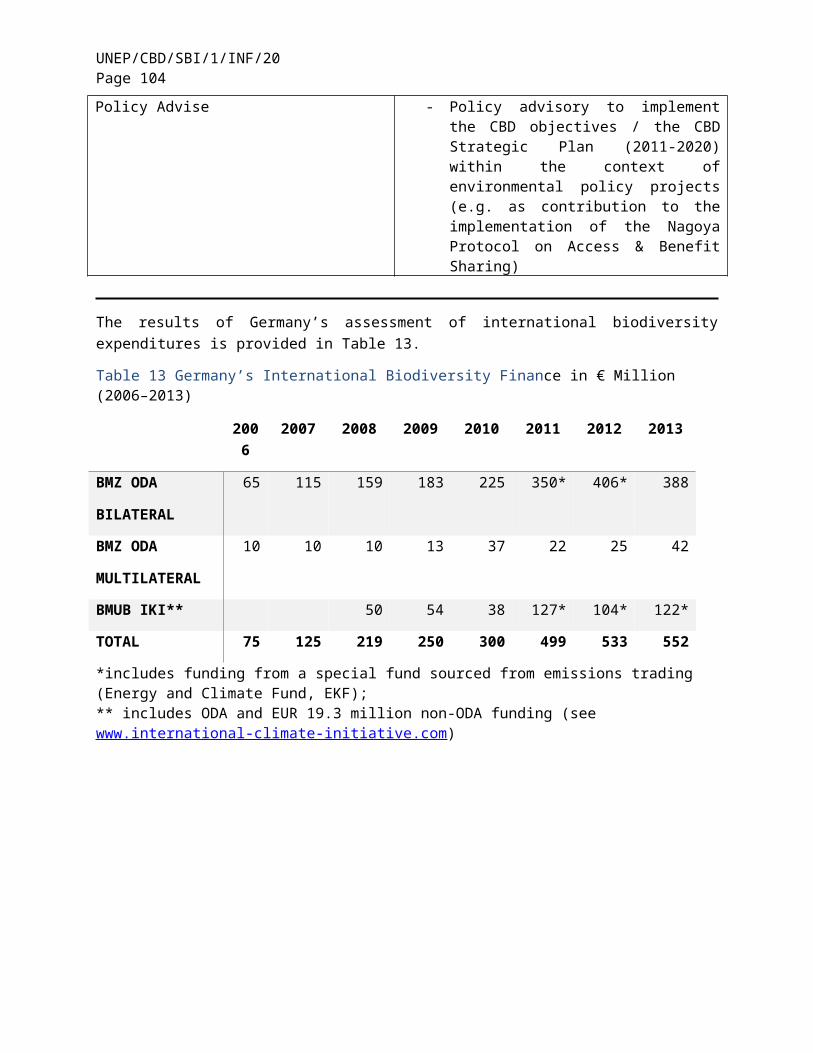
UNEP/CBD/SBI/1/INF/20Page 104
2.4 Treatment of cooling waterTreatment of cooling water designates processes that are used to treat cooling water to meet applicable environmental standards before releasing it into the environment. Cooling water is used to remove heat. 65
Means, methods and facilities used may be: air cooling (extra cost compared with water cooling), cooling towers (to the extent they are required to reduce pollution, as distinct from technical needs), cooling circuits for processing water from worksites and for condensing released vapour, equipment for enhancing the dispersion of cooling water on release, closed cooling circuits (extra cost), and circuits for use of cooling water for heating purposes (extra cost).
2.5 Measurement, control, laboratories and the likeActivities aimed at monitoring and controlling the concentration of pollutants in wastewater and the quality of inland surface water and marine water at the place wastewater is discharged (analysis and measurement of pollutants, etc.).
2.6 Other wastewater management activitiesAll other activities and measures aimed at wastewater management. Includes regulation, administration, management, training, information and education activities specific to CEPA 2, when they can be separated from other activities related to the same class and similar activities related to other environmental protection classes.
3 Waste managementWaste management refers to activities and measures aimed at the prevention of the generation of waste and the reduction of its harmful effect on the environment. Includes the collection and treatment of waste, including monitoring and regulation activities. It also includes recycling and composting, the collection and treatment of low-level radioactive waste, street cleaning and the collection of public litter.
Waste are materials that are not prime products (that is, products made for the market) for which the generator has no further use for own purposes of production, transformation or consumption, and which he wants to dispose of. Wastes may be generated during the extraction of raw materials, during the processing of raw materials to intermediate and final products, during the consumption of final products, and during any other human activity. Residuals recycled or reused at the place of generation are excluded. Also excluded are waste materials that are directly discharged into ambient water or air.
Hazardous waste is waste that owing to its toxic, infectious, radioactive, flammable or other character defined by the legislator, poses a substantial actual or potential hazard to human health or living organisms. For the purposes of this definition, “hazardous waste” comprises for each country all those materials and products that are considered to be hazardous in accordance with that country’s practices. Low-level radioactive waste is included, whereas other radioactive waste is excluded (see CEPA 7).
Low-level radioactive waste is waste that, because of its low radionuclide content, does not require shielding during normal handling and transportation.
Treatment and disposal of wasteTreatment of waste refers to any process designed to change the physical, chemical or biological character or composition of any waste in order to neutralize it, render it non-hazardous, safer for transport,
65 See Classification of Environmental Protection Activities and Expenditure (United Nations, 2000). Available from http://ec.europa.eu/eurostat/ramon/nomenclatures/index.cfm?TargetUrl=DSP_NOM_DTL_VIEW&StrNom=CEPA_2000&StrLanguageCode=EN&IntPcKey=&IntKey=2999213&StrLayoutCode=HIERARCHIC&IntCurrentPage=1
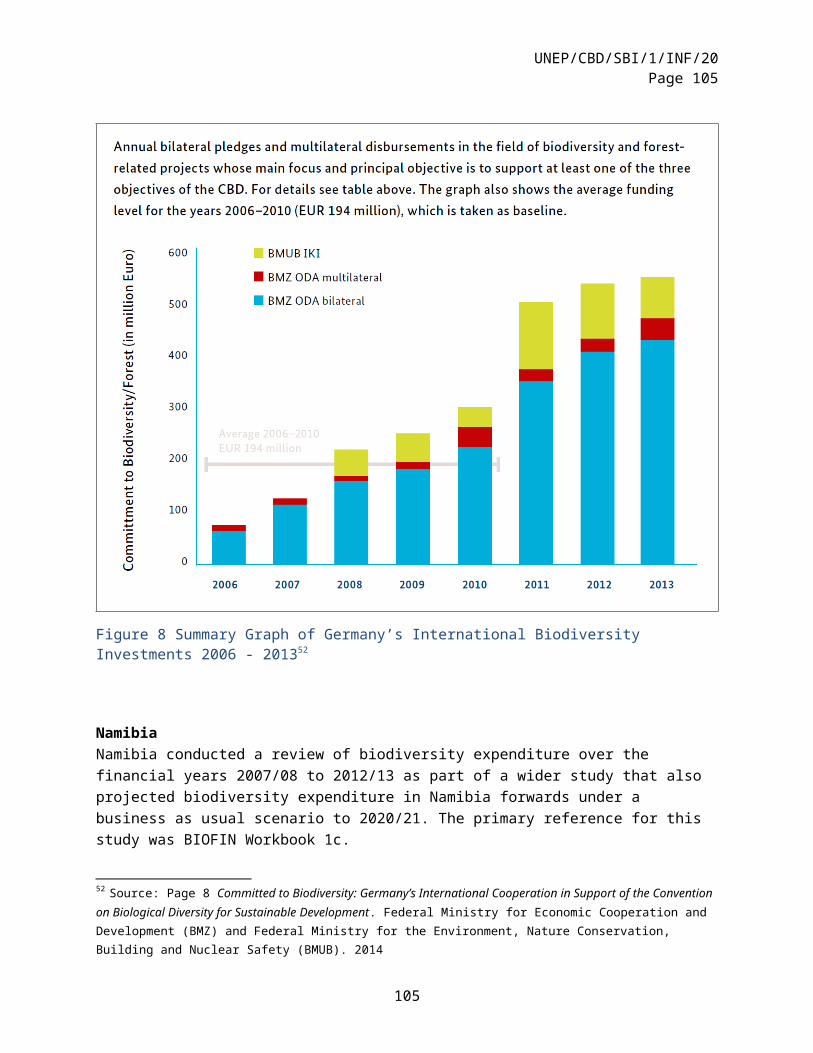
UNEP/CBD/SBI/1/INF/20Page 105
amenable for recovery or storage, or to reduce it in volume. A particular waste may undergo more than one treatment process. Composting and recycling activities for the purpose of environmental protection are included. Often composting is a waste treatment method and the resulting compost provided free of charge or at a very low price. The manufacture of compost classified in division 24 of the International Standard Industrial Classification of All Economic Activities (ISIC)/Statistical Classification of Economic Activities in the European Community (NACE) (Manufacture of fertilizers and nitrogen compounds) is excluded. Division 37 of ISIC/NACE defines recycling as the processing of waste, scraps whether or not used, into a form feasible to be transformed in new raw materials. Typical is that, in terms of commodities, both input and output consist of waste and scrap, the input being sorted or unsorted but always unfit for further direct use in an industrial process whereas the output is made fit for further processing and is to be considered then as an intermediate good. A process is required, either mechanical or chemical.66 The main purpose of activities classified in division 37 of ISIC/NACE is the manufacture of secondary raw materials but there may be important secondary waste management activities. Compost and secondary raw materials (as well as products made of secondary raw materials) are not considered environmental protection products. Their use is excluded.
Disposal of waste is the final deposition of waste on the ground or underground in controlled or uncontrolled fashion, in accordance with the sanitary, environmental or security requirements.
3.1 Prevention of pollution through in-process modificationsActivities and measures aimed at eliminating or reducing the generation of solid waste through in-process modifications related to:• Cleaner and more efficient production processes and other technologies (cleaner technologies)• The consumption or use of “cleaner” (adapted) products• Cleaner technologiesPrevention activities consist of replacing an existing production process by a new process designed to reduce the toxicity or volume of waste produced during the production process, including by separation and reprocessing.
Use of cleaner productsProtection activities consist of modifying or adapting the production process or facilities so as to provide for the substitution of raw materials, catalysts and other intermediate inputs by new, “adapted” inputs, the use of which produces less waste or less hazardous waste.
3.2 Collection and transportCollection and transport of waste is defined as the collection of waste, either by municipal services or similar institutions or by public or private corporations, and their transport to the place of treatment or disposal. This includes the separate collection and transport of waste fractions so as to facilitate recycling and the collection and transport of hazardous waste. Street cleaning is included for the part referring to public litter and collection of garbage from the streets. Excluded are winter services.
3.3 Treatment and disposal of hazardous wasteTreatment of hazardous waste comprises the processes of physical/chemical treatment, thermal treatment, biological treatment, conditioning of wastes, and any other relevant treatment method. Disposal of hazardous waste comprises landfill, containment, underground disposal, dumping at sea, and any other relevant disposal method.
66 Ibid
105
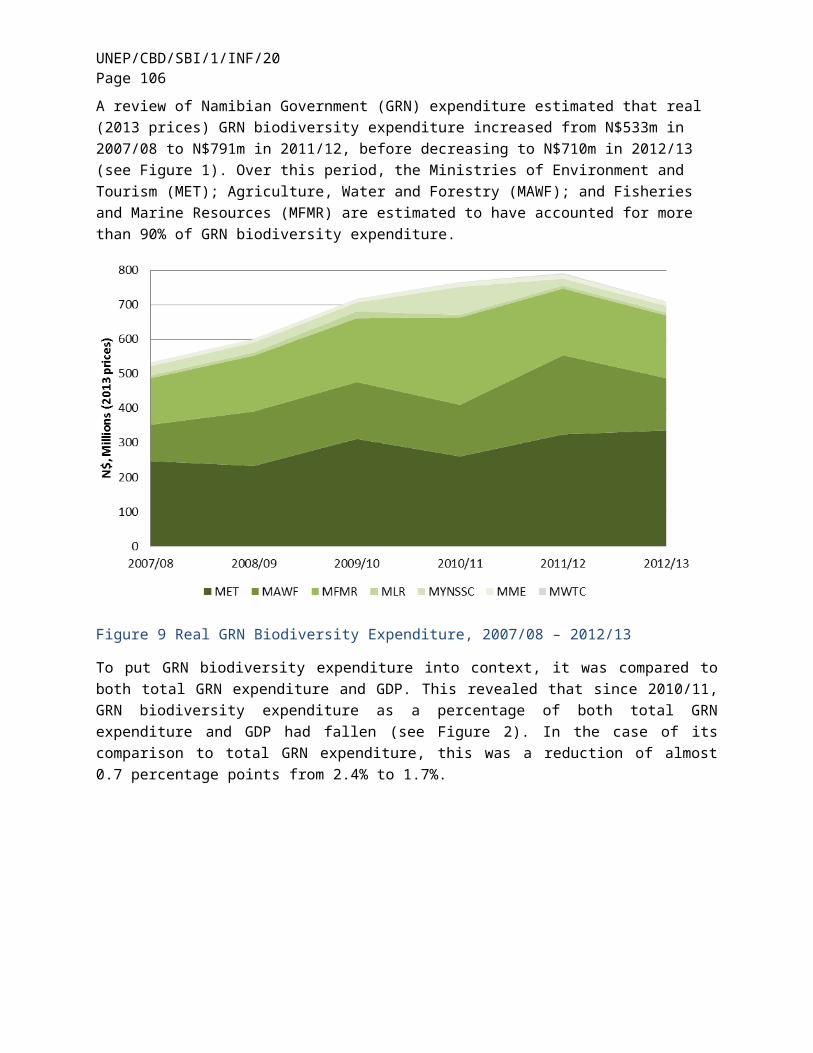
UNEP/CBD/SBI/1/INF/20Page 106
Thermal treatment of hazardous waste refers to any process for the high-temperature oxidation of gaseous, liquid or solid hazardous wastes, converting them into gases and incombustible solid residues. The flue gases are released into the atmosphere (with or without recovery of heat and with or without cleaning) and any slag or ash produced is deposited in the landfill. The main technologies used in the incineration of hazardous waste are the rotary kiln, liquid injection, incinerator grates, multiple-chamber incinerators, and fluidized bed incinerators. Residues from hazardous waste incineration may themselves be regarded as hazardous waste. The resulting thermal energy may or may not be used for the production of steam, hot water or electric energy.
Landfill is an activity concerning final disposal of hazardous waste in or on land in a controlled way, which meets specific geologic and technical criteria.
Other treatment and disposal of hazardous waste may consist of chemical and physical treatment, containment and underground disposal.
Chemical treatment methods are used both to effect the complete breakdown of hazardous waste into non-toxic gases and, more usually, to modify the chemical properties of the waste, e.g., to reduce water solubility or to neutralize acidity or alkalinity.
Physical treatment of hazardous waste: includes various methods of phase separation and solidification whereby the hazardous waste is fixed in an inert, impervious matrix. Phase separation encompasses the widely used techniques of lagooning, sludge drying in beds, and prolonged storage in tanks, air flotation and various filtration and centrifugation techniques, adsorption/desorption, and vacuum, extractive and azeotropic distillation. Solidification or fixation processes, which convert the waste into an insoluble, rock-hard material, are generally used as pretreatment prior to landfill disposal. These techniques employ blending of the waste with various reactants or organic polymerization reactions or the mixing of the waste with organic binders.Containment is the retention of hazardous material in such a way as to ensure that it is effectively prevented from dispersing into the environment, or is released only at an acceptable level. Containment may occur in specially built containment spaces. Underground disposal includes temporary storage or final disposal of hazardous wastes underground that meets specific geologic and technical criteria.
3.3.1 Thermal treatment
3.3.2 Landfill
3.3.3 Other treatment and disposal
3.4 Treatment and disposal of non-hazardous wasteTreatment of non-hazardous waste comprises the processes of physical/chemical treatment, incineration of waste, biological treatment, and any other treatment method (composting, recycling, etc.).
Incineration is the thermal treatment of waste during which chemically fixed energy of combusted matters is transformed into thermal energy. Combustible compounds are transformed into combustion gases leaving the system as flue gases. Incombustible inorganic matters remain in the form of slag and fly ash.
Disposal of non-hazardous waste comprises landfill, dumping at sea, and any other disposal method.
3.4.1 Incineration
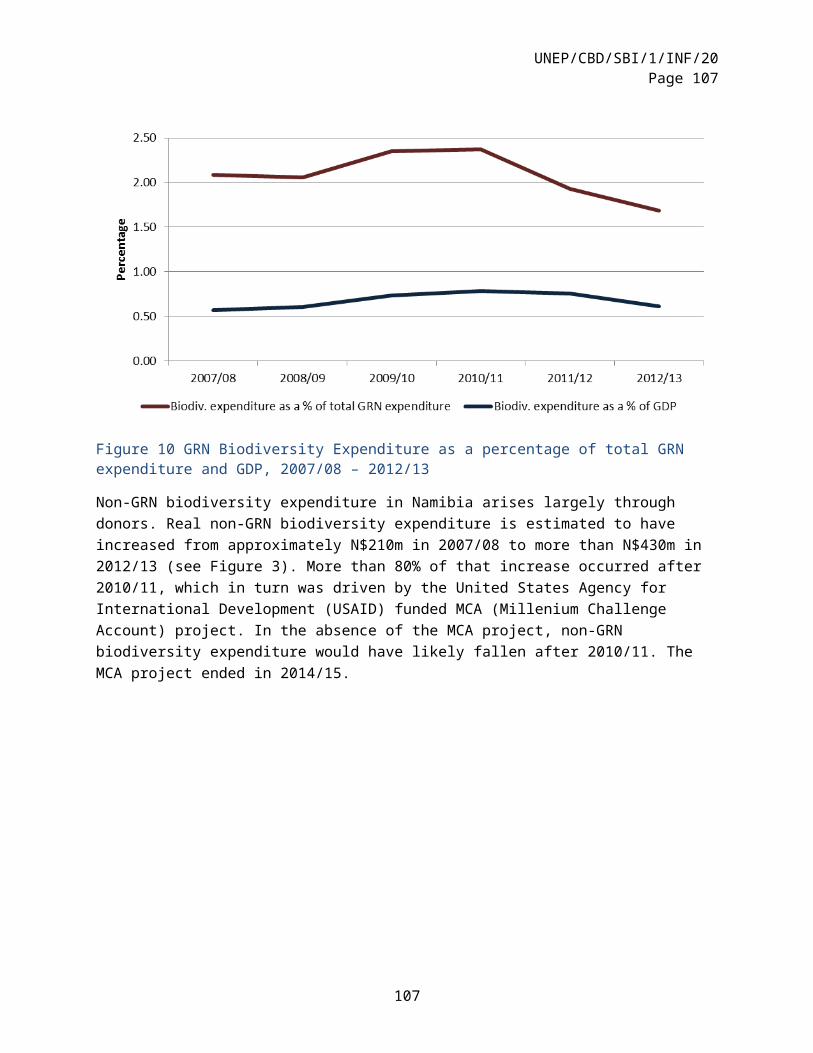
UNEP/CBD/SBI/1/INF/20Page 107
3.4.2 Landfill
3.4.3 Other treatment and disposal
3.5 Measurement, control, laboratories and the like
Activities and measures aimed at controlling and measuring the generation and storage of waste, their toxicity, etc.
3.6 Other waste management activitiesAll other activities and measures aimed at waste management. These include administration, management, training, information and education activities specific to the class, when they can be separated from other activities related to the same class and from similar activities related to other environmental protection classes.
4 Protection and remediation of soil, groundwater and surface waterProtection and remediation of soil, groundwater and surface water refers to measures and activities aimed at the prevention of pollutant infiltration, cleaning up of soils and water bodies and the protection of soil from erosion and other physical degradation as well as from salinization. Monitoring and control of soil and groundwater pollution are included. Excluded are wastewater management activities (see CEPA 2), as well as activities aimed at the protection of biodiversity and landscape (see CEPA 6).
4.1 Prevention of pollutant infiltrationActivities and measures aimed at the reduction or elimination of polluting substances that may be applied to soil or that percolate into groundwater or into run-off to surface water. Included are activities related to sealing of soils of industrial plants, installation of catchment for pollutant run-offs and leaks, strengthening of storage facilities and transportation of pollutant products.
4.2 Cleaning up of soil and water bodiesProcesses to reduce the quantity of polluting materials in soil and water bodies either in situ or in appropriate installations. This includes soil decontamination at former industrial sites, landfills and other black spots, dredging of pollutants from water bodies (rivers, lakes, estuaries, etc.) and the decontamination and cleaning up of surface water following accidental pollution, e.g., through collection of pollutants or through application of chemicals, as well as the cleaning up of oil spills on land, inland surface waters and seas—including coastal areas. Excludes the liming of lakes and artificial oxygenation of water bodies (see CEPA 6).Excludes civil protection services.Activities may consist of: measures for separating, containing and recovering deposits, extraction of buried casks and containers, decanting and restorage, installation of off-gas and liquid effluent drainage networks, soil washing by means of degasification, pumping of pollutants, removal and treatment of polluted soil, biotechnological methods capable of intervening without affecting the site (use of enzymes, bacteria, etc.), physical chemistry techniques such as pervaporation and extraction using supercritical fluids, injection of neutral gases or bases to stifle internal fermentation, etc.
4.3 Protection of soil from erosion and other physical degradationActivities and measures aimed at the protection of soil from erosion and other physical degradation (compacting, encrusting, etc.). They may consist of programmes intended to restore the protective vegetal cover of soils, construction of anti-erosion walls, etc. Measures may also include subsidizing agricultural and grazing practices less harmful for soils and water bodies.
107
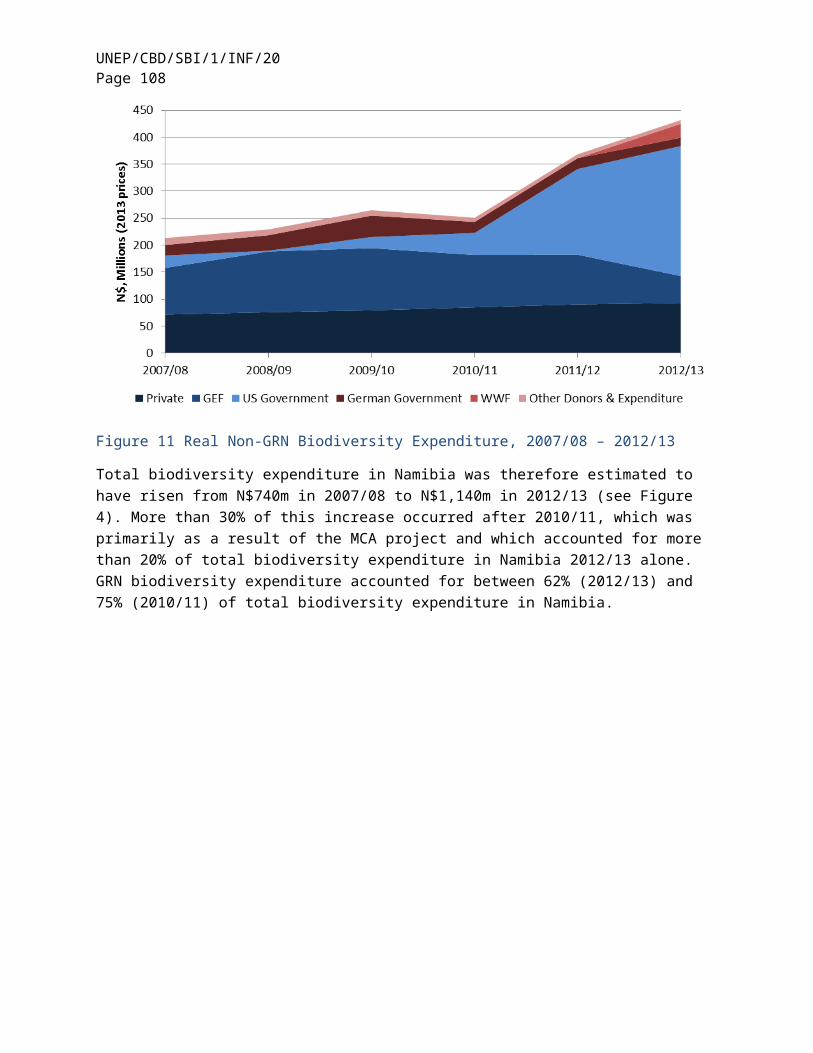
UNEP/CBD/SBI/1/INF/20Page 108
Excluded are activities carried out for economic reasons (e.g., agricultural production or protection of settlements against natural hazards such as landslides).
4.4 Prevention and remediation of soil salinityActivities and measures aimed at the prevention and remediation of soil salinity. Concrete actions will depend on climatic, geologic and other country-specific factors. Included are actions to increase groundwater tables, e.g., through increased freshwater infiltration to avoid infiltration of seawater into groundwater bodies, lowering of groundwater tables (when groundwater contains high levels of salts) through long-term revegetation programmes, changes in irrigation practices, etc.Excluded are measures that respond to economic concerns (agricultural production, reclamation of land from the sea, etc.).
4.5 Measurement, control, laboratories and the likeAll activities and measures aimed at controlling and measuring the quality and pollution of soils, groundwater and surface water, measuring the extent of soil erosion and salinization, etc. Includes the operation of monitoring systems, inventories of “black spots”, maps and databases of groundwater and surface water quality, of soil pollution, erosion and salinity, etc.
4.6 Other activitiesAll other activities and measures aimed at the protection and remediation of soil, groundwater and surface water. These include administration, management, training, information and education activities specific to the class, when they can be separated from other activities related to the same class and from similar activities related to other environmental protection classes.
5 Noise and vibration abatement (excluding workplace protection)Noise and vibration abatement refers to measures and activities aimed at the control, reduction and abatement of industrial and transport noise and vibration. Activities for the abatement of neighbourhood noise (soundproofing of dancing halls, etc.) as well as activities for the abatement of noise in places frequented by the public (swimming pools, etc.), in schools, etc., are included.Excluded is the abatement of noise and vibration for purposes of protection at the workplace.
5.1 Preventive in-process modifications at the sourceActivities and measures aimed at the reduction of noise and vibration from industrial equipment, vehicle motors, aircraft and ships engines, exhaust systems and brakes, or noise level due to tyre/road or wheel/rail surface contact. Includes the adaptation of equipment, vehicles (buses, trucks, or train and power units in the case of rail transport, aircraft and ships) in order to make them less noisy: soundproofing of hoods, brakes, exhaust systems, etc.Includes also plant modifications, specially conceived foundations to absorb vibrations, extra cost for regrouping of buildings and/or of facilities in the interest of noise abatement, special facilities in building construction or reconstruction, equipment and machines conceived or constructed for low noise or vibrations, low noise level flares and burners, etc.Other preventive activities consist of noise abatement through the modification of surfaces. As noise emissions from motors, engines, exhaust systems and brakes are lowered, those from other sources become more important and, in particular, noise that originates from the contact between tyres and road surfaces. Activities consist of replacing concrete with silent asphalt, multilayered surfaces, etc.
5.1.1 Road and rail traffic
5.1.2 Air traffic
5.1.3 Industrial and other noise
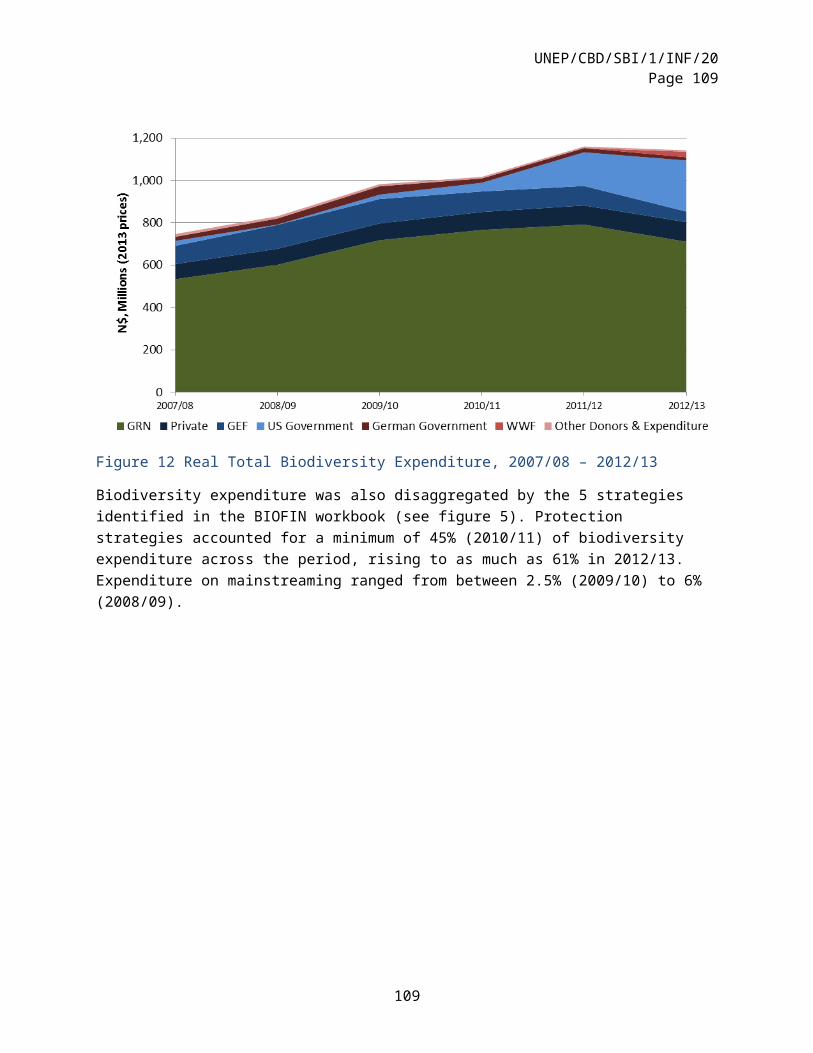
UNEP/CBD/SBI/1/INF/20Page 109
5.2 Construction of anti noise/vibration facilitiesActivities and measures aimed at the installation and management of anti-noise facilities.These may be screens, embankments or hedges. They may consist of covering sections of urban motorways or railroads. As concerns industrial and vicinity noise, they also consist of add-on facilities, covering and soundproofing of machines and piping, fuel regulation systems and sound absorption, noise screens, barriers, soundproofing of buildings, noise-protective windows, etc., in order to limit noise perception.
5.2.1 Road and rail traffic
5.2.2 Air traffic
5.2.3 Industrial and other noise
5.3 Measurement, control, laboratories and the likeActivities and measures aimed at controlling the level of noise and vibration: installation and operation of stationary measurement and monitoring sites or mobile equipment in urban areas, observation networks, etc.
5.4 Other activitiesAll other activities and measures aimed at noise and vibration abatement, including administration, management, training, information and education activities specific to the class, when they can be separated from other activities related to the same class and from similar activities related to other classes. This also includes, when separable, traffic management with noise abatement aspects (for example, lowering of speed limits, improvement of traffic flows), introduction of time and geographical restrictions for noisy vehicles, traffic detours at a distance from residential areas, creation of pedestrian areas, creation of constructionfree buffer zones, restructuring of modal split (improvement of public transportation, use of bicycles). This covers a potentially large set of administrative measures which raise serious identification problems given their incorporation in integrated programmes of traffic control and urban planning and the difficulty of separating that part of measures and expenditure that, in these programmes, concern noise and vibration abatement from expenditure related to air pollution control, improvement of the living environment or traffic security.In addition to regulation, other measures may consist of: financial incentives for the production and use of low-noise vehicles, labelling or information programmes for consumers so as to encourage the use of low-noise vehicles and the adoption of quiet driving behaviour.
6 Protection of biodiversity and landscapes Protection of biodiversity and landscape refers to measures and activities aimed at the protection and rehabilitation of fauna and flora species, ecosystems and habitats as well as the protection and rehabilitation of natural and semi-natural landscapes. Separating “biodiversity” from “landscape” protection may not always be practical. For example, maintaining or establishing certain landscape types, biotopes and ecozones and related issues (hedgerows, lines of trees to re-establish “natural corridors”) have a clear link to biodiversity preservation.Excluded is the protection and rehabilitation of historic monuments or predominantly built-up landscapes and the control of weed for agricultural purposes, as well as the protection of forests against forests fire when this responds predominantly to economic concerns. The establishment and maintenance of green spaces along roads and recreational structures (e.g., separating golf courses and other sports facilities) are also excluded.
109
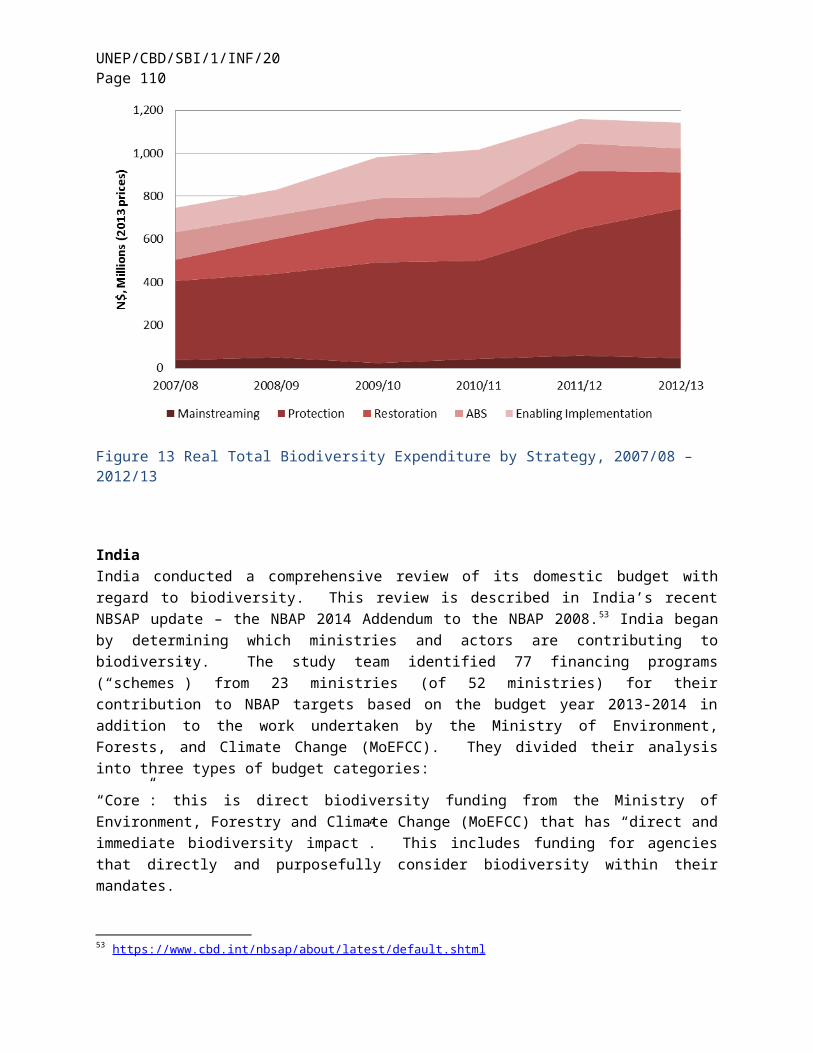
UNEP/CBD/SBI/1/INF/20Page 110
Actions and expenditure related to urban parks and gardens would not normally be included but may in some cases be related to biodiversity: in such cases, the activities and expenditure should be included.
6.1 Protection and rehabilitation of species and habitatsActivities and measures aimed at the conservation, reintroduction or recovery of fauna and flora species, as well as the restoring, rehabilitation and reshaping of damaged habitats for the purpose of strengthening their natural functions. Includes conserving the genetic heritage, recolonizing destroyed ecosystems, placing bans on exploitation, trade, etc., of specific animal and plant species, for protection purposes. Also includes censuses, inventories, databases, creation of gene reserves or banks, improvement of linear infrastructures (e.g., underground passages or bridges for animals at highways or railways), feeding of the young, and management of special natural reserves (botany conservation areas, etc.).Activities may also include the control of fauna and flora in order to maintain natural balances, including reintroduction of predator species and control of exotic fauna and flora that pose a threat to native fauna, flora and habitats. Main activities are the management and development of protected areas, whatever the denomination they receive, i.e., areas protected from any economic exploitation or in which the latter is subject to restrictive regulations whose explicit goal is the conservation and protection of habitats. Also included are activities for the restoration of water bodies as aquatic habitats: artificial oxygenation and lime-neutralization actions. When they have a clear protection of biodiversity purpose, measures and activities related to urban parks and gardens are to be included. Purchase of land for protection of species and habitats purposes is included.
6.2 Protection of natural and semi-natural landscapesActivities and measures aimed at the protection of natural and semi-natural landscapes so as to maintain and increase their aesthetic value and their role in biodiversity preservation.Included is the preservation of legally protected natural objects, expenditures incurred for the rehabilitation of abandoned mining and quarrying sites, renaturalization of river banks, burying of electric lines, maintenance of landscapes that are the result of traditional agricultural practices threatened by prevailing economic conditions, etc. For biodiversity and landscape protection related to agriculture, the identification of specific State aid programmes to farmers may be the only data source available. Protection of forests against forest fires for the purpose of landscape protection is included.Excluded are measures taken to protect historic monuments, measures to increase aesthetic values for economic purposes (e.g., relandscaping to increase the value of real estate), as well as protection of predominantly built-up landscapes.
6.3 Measurement, control, laboratories and the likeMeasurement, monitoring, analysis activities that are not classified under the preceding items. In principle, inventories of fauna and flora are not covered, since they are classified under protection of species.
6.4 Other activitiesAll other activities and measures aimed at the protection of biodiversity and landscape. These include administration, training, information and education activities specific to the domain, when they can be separated from other activities related to the same domain and similar activities related to other classes.
7 Protection against radiation (excluding external safety)Protection against radiation refers to activities and measures aimed at the reduction or elimination of the negative consequences of radiation emitted from any source. Included is the handling, transportation and treatment of high-level radioactive waste, i.e., waste that, because of its high radionuclide content, requires shielding during normal handling and transportation.
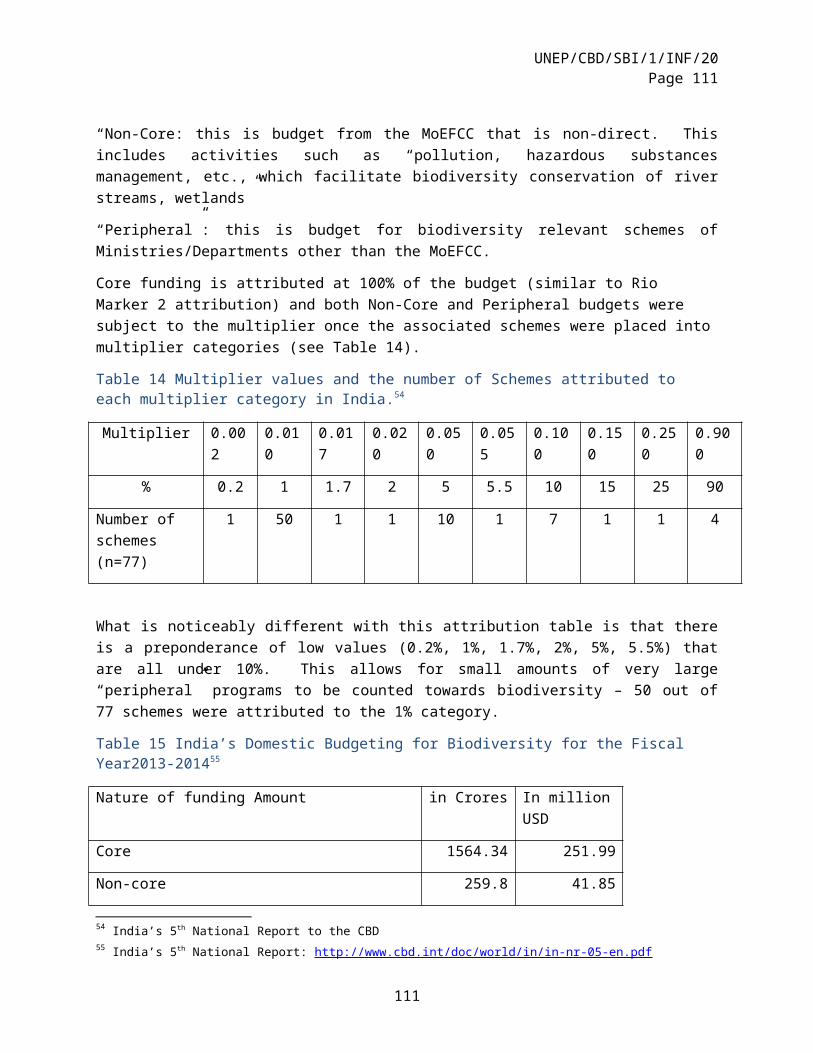
UNEP/CBD/SBI/1/INF/20Page 111
Excluded are activities and measures related to the prevention of technological hazards(e.g., external safety of nuclear power plants), as well as protection measures taken at workplaces.Also excluded are activities related to collection and treatment of low-level radioactive waste (see CEPA 3).
Definition of radioactive wasteAny material that contains or is contaminated with radionuclides at concentrations or radioactivity levels greater than the “exempt quantities” established by the competent authorities, and for which no use is foreseen. Radioactive wastes are produced at nuclear power plants and at associated nuclear fuel cycle facilities as well as through other uses of radioactive material, for example, the use of radionuclides in hospitals and research establishments. Other important wastes are those from mining and milling of uranium and from the reprocessing of spent fuel.
7.1 Protection of ambient mediaProtection of ambient media groups together activities and measures undertaken in order to protect ambient media from radiation. It may consist of protecting measures such as screening, creation of buffer zones, etc.
7.2 Transport and treatment of high-level radioactive wasteAny process designed for the transport, conditioning, containment or underground disposal of high-level radioactive waste.Collection and transport of high-level radioactive waste consists of the collection of high-level radioactive waste, generally by specialized firms, and their transport to the place of treatment, conditioning storage and disposal.Conditioning of high-level radioactive waste consists of activities that transform highlevel radioactive waste into a proper and fit condition for transport and/or storage and/or disposal. Conditioning may occur as part of ISIC/NACE 23 (processing of nuclear fuels) activities.67
Containment of high-level radioactive waste designates the retention of radioactive waste in such a way as to ensure that it is effectively prevented from dispersing into the environment, or is released only at an acceptable level. Containment may occur in specially built containment spaces.Underground disposal of high-level radioactive waste is the temporary storage or final disposal of high-level radioactive waste in underground sites that meet specific geologic and technical criteria.
7.3 Measurement, control, laboratories and the likeActivities aimed at measuring, controlling and monitoring ambient radioactivity and radioactivity due to high-level radioactive waste by means of specific equipment, instruments and installations.
7.4 Other activitiesAll other activities and measures aimed at the protection of ambient media against radiation and transport and treatment of high-level radioactive waste. These include administration, training, information and education activities specific to the domain, when they can be separated from other activities related to the same class and similar activities related to other environmental protection classes.
8 Research and development for environmental protectionResearch and development (R&D) comprises creative work undertaken on a systematic basis in order to increase the stock of knowledge and the use of this knowledge to devise new applications (see the Frascati Manual (OECD, 2002) in the field of environmental protection. The class regroups all R&D
67 Ibid.
111
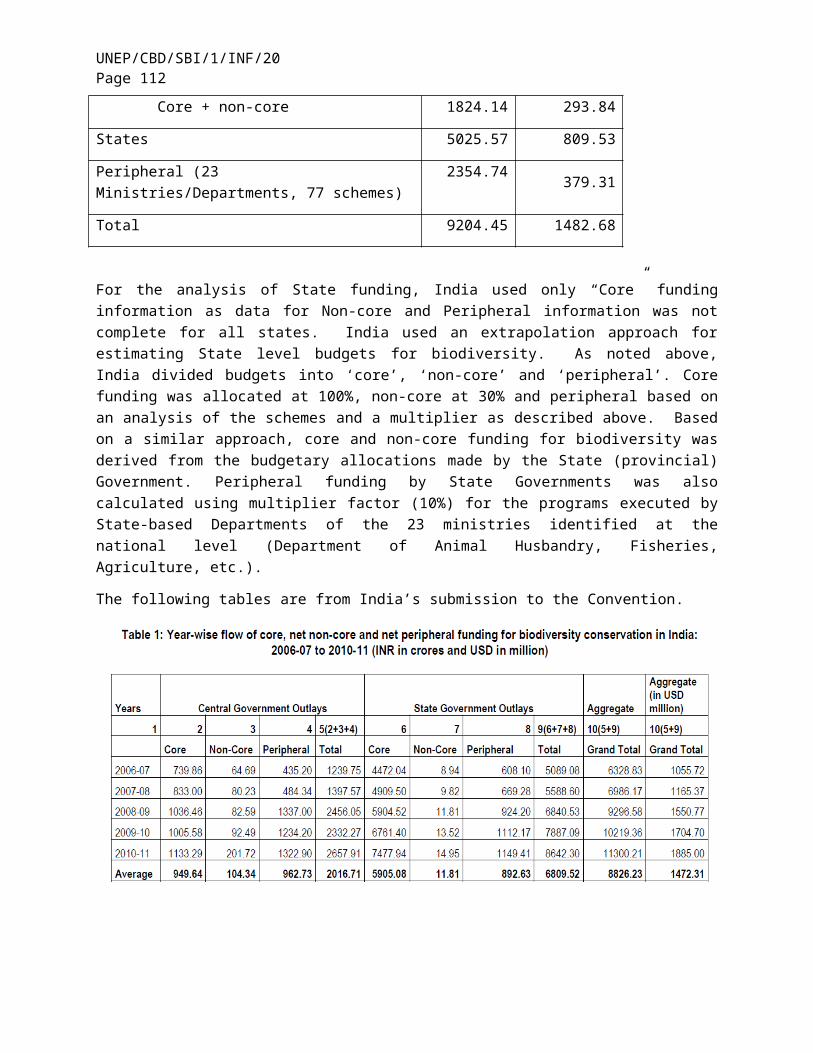
UNEP/CBD/SBI/1/INF/20Page 112
activities and expenditure oriented towards environmental protection: identification and analysis of sources of pollution and mechanisms of dispersion of pollutants in the environment, as well as their effects on human beings, the species and the biosphere. This heading covers R&D for the prevention and elimination of all forms of pollution, as well as R&D oriented towards equipment and instruments of pollution measurement and analysis. When separable, all R&D activities, even when referring to a specific class, have to be classified under this position.Environmental R&D is further classified in accordance with the 1993 Nomenclature for the Analysis and Comparison of Scientific Programmes and Budgets (NABS) (Eurostat, 1994).Excluded are R&D activities related to the management of natural resources.
8.1 Protection of ambient air and climate
8.1.1 Protection of ambient air
8.1.2 Protection of atmosphere and climate
8.2 Protection of water
8.3 Waste
8.4 Protection of soil and groundwater
8.5 Abatement of noise and vibration
8.6 Protection of species and habitats
8.7 Protection against radiation
8.8 Other research on the environment
9 Other environmental protection activitiesOther environmental protection activities refers to all environmental protection activities that take the form of general environmental administration and management activities or training or teaching activities specifically oriented towards environmental protection that encompass public information, when they are not classified elsewhere in CEPA. It also includes activities leading to indivisible expenditure, as well as activities not elsewhere classified.
9.1 General environmental administration and managementGeneral administration of the environment designates any identifiable activity that is directed towards the general support of decisions taken in the context of environmental protection activities, whether by governmental or by non-governmental units.
General administration of the environment, regulation and the likeAny identifiable activity within general government and NPISH units that is directed towards the regulation, administration of the environment and the support of decisions taken in the context of environmental protection activities. When possible, such activities should be allocated to other classes. If this is impossible, they should be included under this position of the classification.
Environmental managementAny identifiable activities of corporations that are directed towards the general support of decisions taken in the context of environmental protection activities. These include the preparation of declarations or
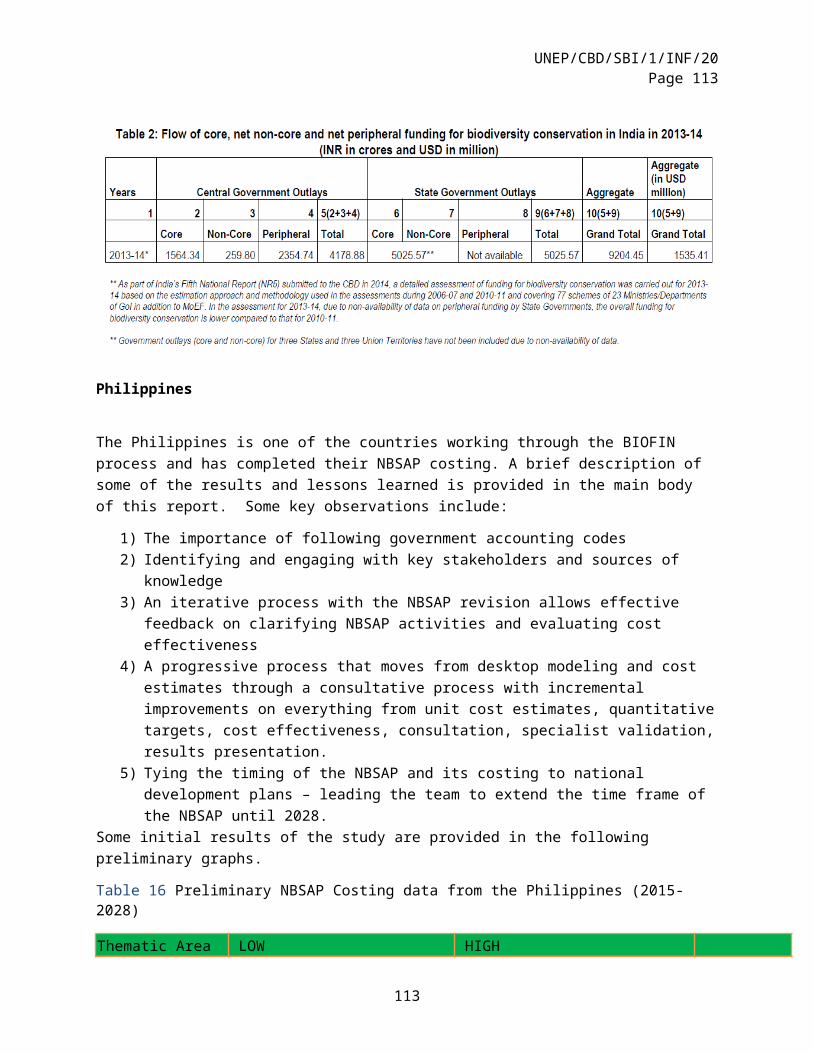
UNEP/CBD/SBI/1/INF/20Page 113
requests for permission, internal environmental management, and environmental certification processes (ISO 14000; and Eco-Management and Audit Scheme (EMAS) (European Union (EU)), as well as the recourse to environmental consultancy services. Activities of units specialized in environmental consultancy, supervision and analysis are included. When possible, such activities should be allocated to other CEPA classes.
9.1.1 General administration, regulation and the like
9.1.2 Environmental management
9.2 Education, training and informationActivities that aim at providing general environmental education or training and disseminating environmental information. Included are high school programmes, university degree programmes or special courses specifically aimed at training for environmental protection. Activities such as the production of environmental reports and environmental communication are also included.
9.3 Activities leading to indivisible expenditureEnvironmental protection activities that lead to indivisible expenditure, i.e., that cannot be allocated to any other CEPA class. International financial aid may be a case in point, as it may be difficult for the donor countries to allocate international aid to individual classes. If international aid is important in volume and/or of specific political interest, a separate twodigit heading under CEPA 9 could be adequate for national purposes.
9.4 Activities not elsewhere classifiedThis position groups together all these environmental protection activities that cannot be classified under other positions of the classification.
II. Resource management (RM) (interim)Resource management includes all actions and activities that are aimed at preserving and maintaining the stock of natural resources and hence safeguarding against depletion.This includes actions and activities aimed at reducing the withdrawals of natural resources (recovery, reuse, recycling, substitution of natural resources) as well as restoring natural resource stocks (increases/recharges of natural resource stocks).To be included under resource management, actions and activities or parts thereof must satisfy the primary-purpose criterion, i.e., that resource management is their primary objective. Those activities whose primary purpose is environmental protection are therefore excluded.
10 Management of mineral and energy resourcesIncludes the activities and actions aiming at minimizing the intake of mineral and energy resources through in-process modifications, the recovery, reuse, recycling, savings and use of substitute mineral resources, the production of energy from renewable sources and any other kind of measure. Activities and actions concerning measurement, control, laboratories and the like are also included, as well as education, training and information and administration and regulation activities.
10.1 Reduction of the intake of mineral and energy resourcesReduction of the intake through in-process modifications related to the reduction of the input of non-renewable energy sources for the production process. This includes all the kinds of replacement or adjustment of production processes whose aim is to reduce the input of energy resources needed for producing a certain output.
113
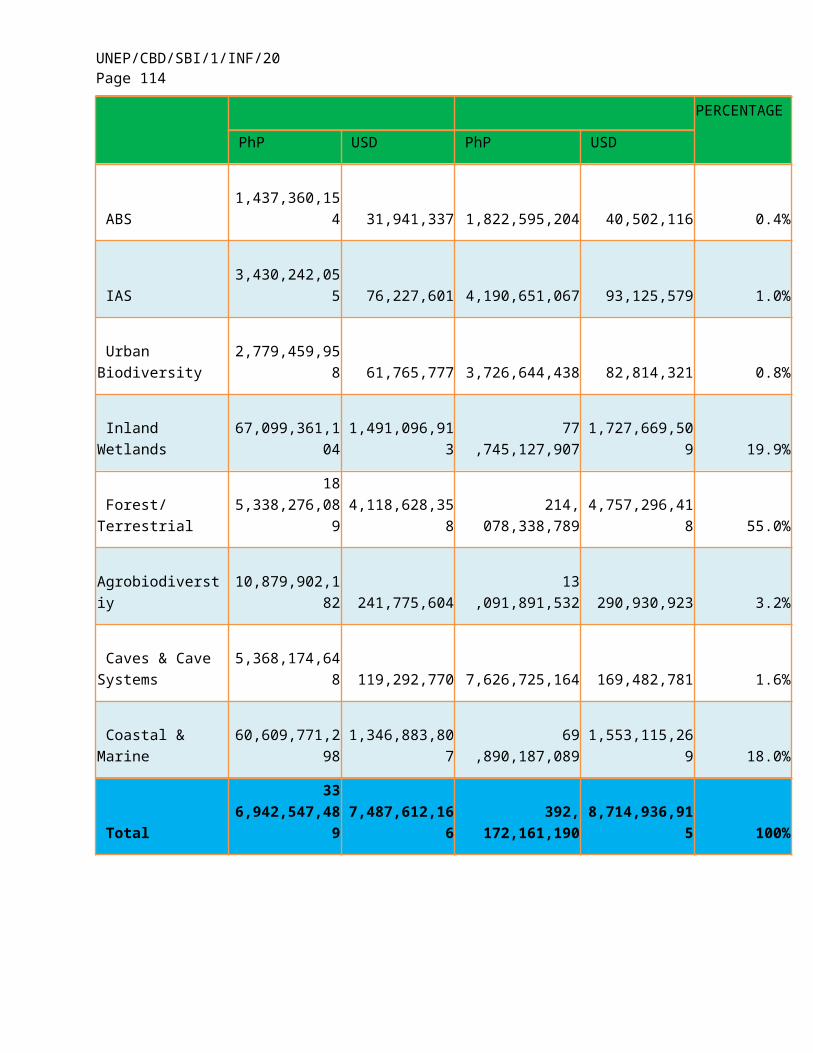
UNEP/CBD/SBI/1/INF/20Page 114
This category includes the production of energy from renewable sources when it has the primary purpose of reducing the exploitation of non-renewable energy sources (the production of energy from renewable sources mainly aimed at reducing air pollution is excluded → CEA 1.1). All kinds of renewables are included according to the International Energy Agency definition of renewables, i.e., hydropower, solar, wind, tidal, biogas, geothermal and biomass sources. The production of energy from the combustion of any kind of waste is included, except where the incineration of waste is carried out for the main purpose of waste treatment and disposal → CEA 3.3 or 3.4.Reduction of the intake through in-process modifications related to the reduction of the raw material input for the production process or the consumption or use of resource efficient products.
10.2 Reduction of mineral use through the reduction of scraps and the production and consumption of recycled materials and products and reduction of heat and energy losses and energy savingsReduction of the use of non-renewable energy sources through the minimization of heat and energy losses and through energy savings (energy savings mainly aimed at reducing air pollution is excluded → CEA 1.1).Production and use of secondary raw materials or final products obtained from recovered and recycled materials and waste. This includes, for example: processing of waste and scrap into a form that is readily transformed into new raw materials, production of recycled goods (recycling activities insofar as they constitute waste collection, transport, treatment or disposal activities are excluded → CEA 3.2, 3.3 and 3.4).
10.3 Measurement, control, laboratories and the like related to mineral and energy resourcesActivities aimed at measuring, controlling and monitoring the use and the consistency of fossil energy stocks as well as the production of energy from renewable sources. These include, for example: assessment and reassessment of existing reserves; and assessment of the importance of the production of energy from renewable sources for total energy production. Activities aimed at measuring, controlling and monitoring the use and the consistency of mineral stocks. These include, for example: inventories and assessment of mineral stocks.
10.4 Other activities for the management of mineral and energy resourcesAll other activities and measures aimed at the management of mineral and energy resources. These include regulation, administration, education, training and information activities specific to the class when they can be separated from other activities related to the same class and from similar activities related to other classes of the RM group, including, for example: release of licences for mining and quarrying activities; activities of general government units or part thereof that administer and regulate the exploitation of mineral resources or are responsible for material savings and recycling policies. Excluded are public or private bodies that manage, exploit and explore mineral resources.
11 Management of timber resourcesIncludes the activities and actions aiming at minimizing the intake of natural timber resources through in-process modifications as well as recovery, reuse, recycling, savings and the use of substitutes of forest products. Replenishment activities like reforestation and afforestation are included when they concern natural forests. Activities and actions concerning measurement, control, laboratories and the like are also included, as well as education, training and information and administration and regulation activities. Exploitation and exploration activities of natural timber resources are excluded.
11.1 Reduction of the intake of timber resourcesReduction of the intake through in-process modifications related to the reduction of the input of timber resources for the production process. This includes all the kinds of replacement or adjustment of production processes aimed at reducing the input of forest-related products (wood and non-wood) needed
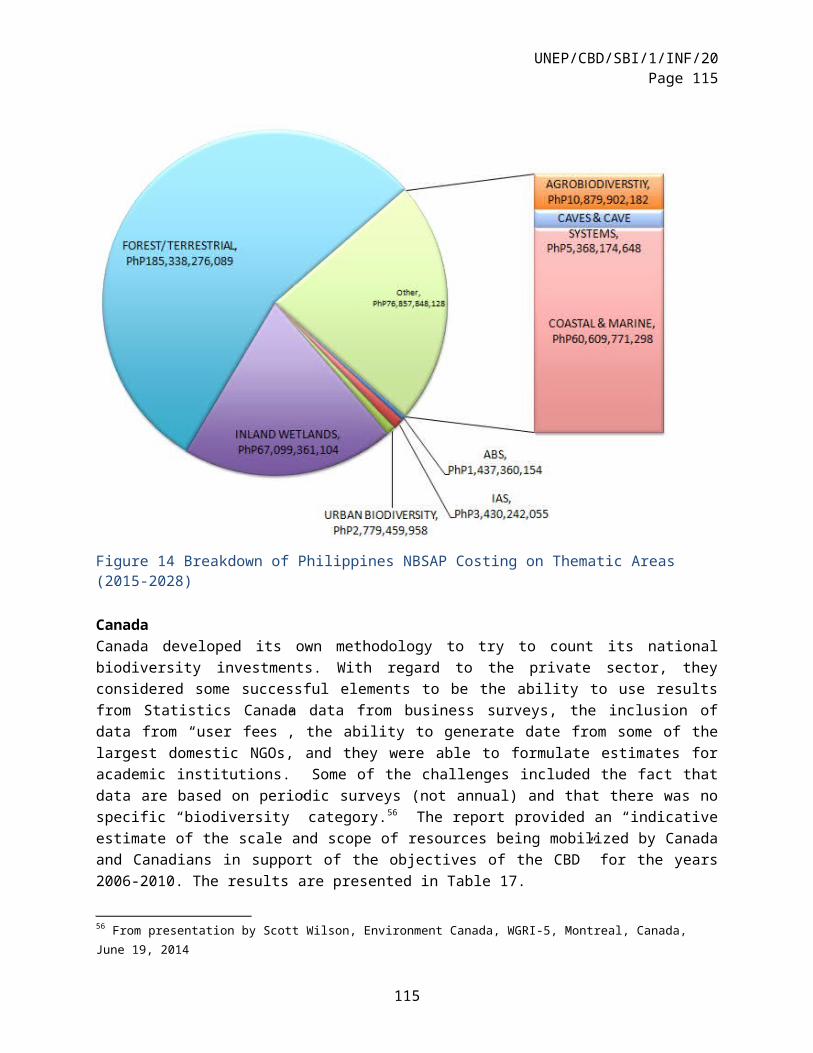
UNEP/CBD/SBI/1/INF/20Page 115
for producing a certain output. The substitution of forest products with other material and substances is included.
11.2 Reduction of the consumption of forest (wood and non wood)-related productsRecycling, reuse or savings of forest products and by-products (wood, paper, etc.).
11.3 Reforestation and afforestationReplenishment of existing natural forest areas or development of new forest areas.Excluded are activities aimed at restoring or rehabilitating damaged habitats or ecosystems (→ CEA 6.1)
11.4 Forest firesPrevention and control of natural forest fires (concerning forest areas relevant mainly as economic resource and not as habitats → CEA 6.2). This includes, for example: development of fireballs, and mobilization of firefighting means or measures aimed at the prevention of fires in forest areas.
11.5 Measurement, control, laboratories and the like related to natural timber resourcesActivities aimed at measuring, controlling and monitoring the use and consistency of timber resource stocks. They include, for example, inventories and assessments of timber resources. Measurement, controlling and monitoring activities related to the protection of biodiversity and landscape are excluded, like, e.g., inventories of flora and fauna species living in natural forest areas → CEA 6.1 and census of natural forest protected areas→ CEA 6.2.
11.6 Other activities for the management of timber resourcesAll other activities and measures aimed at the management of natural timber resources, including regulation, administration, education, training and information activities specific to the class when they can be separated from other activities related to the same class and from similar activities related to other classes of the RM group. This includes, for example: the release of logging licences; and activities of general government units or part thereof that administer and regulate the use of natural forest resources or are responsible for forest management policies.
12 Management of aquatic resourcesIncludes the activities and actions aiming at minimizing the intake of wild fish and other aquatic resources through in-process modifications as well as the use of alternative resources and any other kind of measure. Replenishment activities like repopulation of wild fish stocks are included when they aim at maintaining/increasing the consistency of stocks (not their biodiversity → CEA 6). Activities and actions concerning measurement, control, laboratories and the like are also included, as well as education, training and information and administration and regulation activities.The class includes all the activities and actions having the purpose of managing, maintaining and increasing the stock of aquatic resources. The protection of biodiversity of aquatic resources is excluded (→ CEA 6).
12.1 Reduction of the intake of aquatic resourcesReduction of the intake through in-process modifications. This includes all the kinds of replacement or adjustment of production processes aimed at reducing the input of wild fish resources needed for producing a certain output. It includes, for example, vessel buy-back programmes for the introduction of more efficient fishing fleets and equipments.The use of alternative resources is included, i.e., the use of renewable resources or the substitution of natural inputs with alternative inputs.
12.2 Replenishment of aquatic resources stocks
115
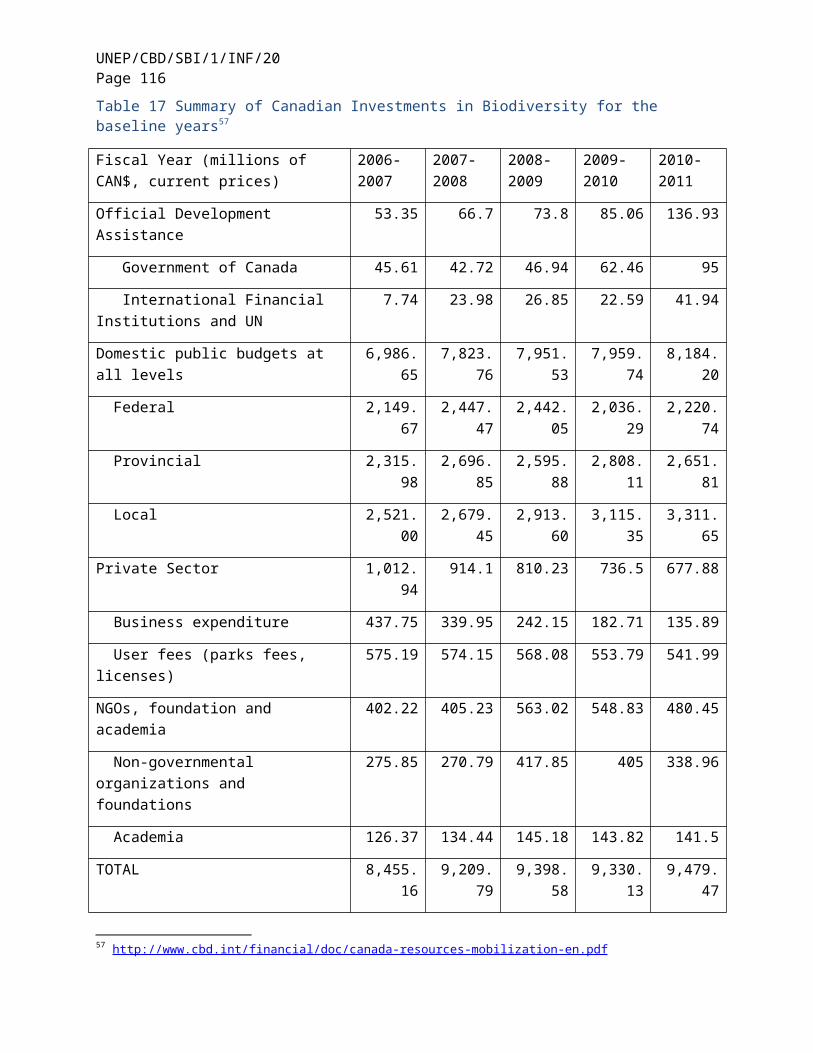
UNEP/CBD/SBI/1/INF/20Page 116
Increase of the number of individuals of aquatic resources stocks. This includes, for example, breeding for the replenishment of stocks for fishing (for restocking purposes and not for protection of biodiversity → CEA 6.1).
12.3 Measurement, control, laboratories and the like related to aquatic resourcesActivities aimed at measuring, controlling and monitoring the use and the consistency of aquatic resources, including, for example: inventories and assessment of aquatic resource stocks; control on the observance of licences, quotas, and temporary or permanent fishing bans. Measurement, controlling and monitoring activities related to the protection of biodiversity and landscape are excluded, like, e.g., inventories of threatened species → CEA 6.1.
12.4 Other activities for the management of aquatic resourcesAll other activities and measures aimed at the management of aquatic resources. This includes regulation, administration, education, training and information activities specific to the class when they can be separated from other activities related to the same class and from similar activities related to other classes of the RM group. Included, for example, are: release of fishing licences, enforcement and administration of quotas, enforcement and regulation of temporary or permanent fishing bans; and general government units or part thereof that administer and regulate the exploitation of wild fish resources or are responsible for wild fish management policies.
13 Management of other biological resources (excluding timber and aquatic resources)Includes the activities and actions aiming at minimizing the intake of biological resources other than timber and aquatic resources through in-process modifications as well as the use of alternative resources and any other kind of measure. Replenishment activities like repopulation of wild flora and fauna stocks are included when aimed at maintaining/ increasing the consistency of stocks (not the biodiversity → CEA 6). Activities and actions concerning measurement, control, laboratories and the like are also included, as well as education, training and information and administration and regulation activities.Other biological resources are stocks and reserves of non-cultivated animals and plants (excluding timber and aquatic resources). The class includes all the activities and actions with the purpose of managing, maintaining and increasing the stock of the resources. Activities aimed at the protection of biodiversity of wild flora and fauna are excluded (→ CEA 6).
13.1 Reduction of the intake of biological resources (excluding timber and aquatic resources)Reduction of the intake through in-process modifications. This includes all the kinds of replacement or adjustment of production processes aiming at reducing the input of wild flora and fauna resources needed for producing a certain output.The use of alternative resources is included, i.e., the substitution of natural inputs with alternative inputs.
13.2 Replenishment of biological resources stocks (excluding timber and aquatic resources)Increase of the number of individuals of other biological resources stocks. This includes, for example, breeding for the replenishment of stocks for hunting (for restocking purposes and not for protection of biodiversity → CEA 6.1).
13.3 Measurement, control, laboratories and the like related to biological resources stocks (excluding timber and aquatic resources)Activities aimed at measuring, controlling and monitoring the use and the consistency of wild flora and fauna stocks. These include, for example: inventories and assessment of wild fauna stocks; control on the observance of licences, quotas and temporary or permanent hunting bans. Measurement, controlling and monitoring activities related to the protection of biodiversity and landscape are excluded, like, e.g., inventories of threatened species → CEA 6.1.
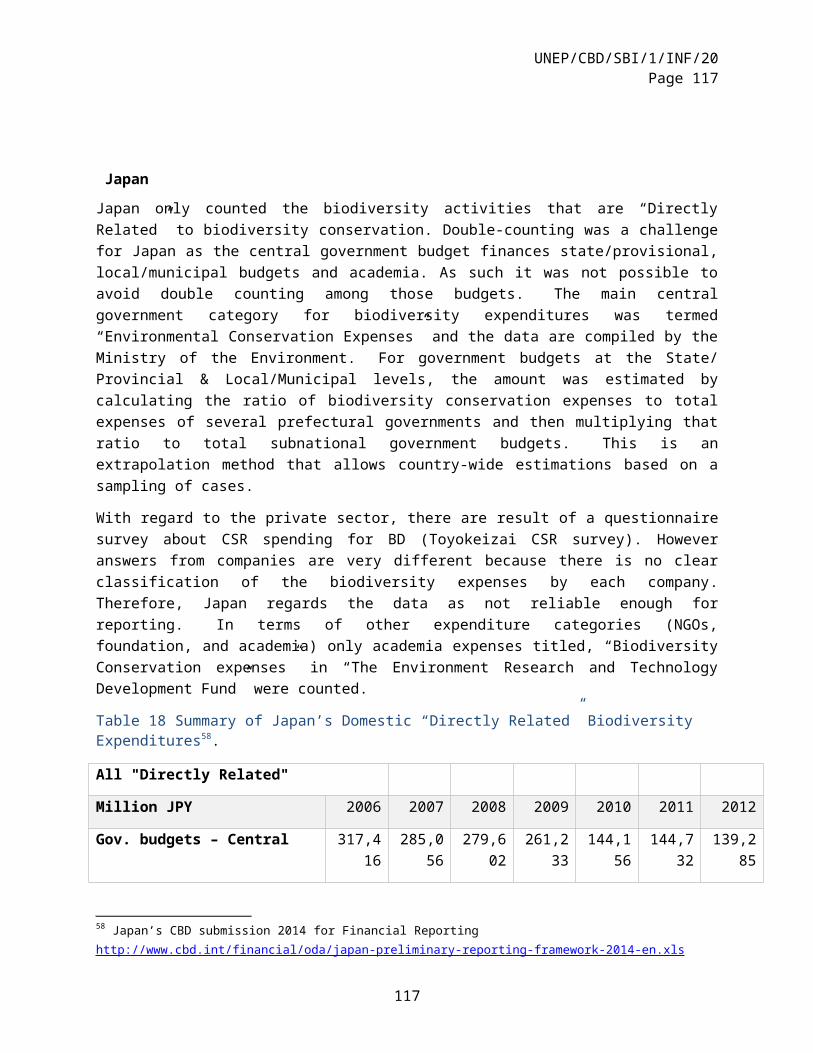
UNEP/CBD/SBI/1/INF/20Page 117
13.4 Other activities for the management of biological resources (excluding timber and aquatic resources)All other activities and measures aimed at the management of other biological resources. These include regulation, administration, education, training and information activities specific to the class when they can be separated from other activities related to the same class and from similar activities related to other classes of the RM group. They include, for example: release of hunting licences, enforcement and administration of quotas, and enforcement and regulation of temporary or permanent fishing/hunting bans; and general government units or part thereof that administer and regulate the exploitation of wild flora and fauna resources or are responsible for wild flora and fauna management policies.
14 Management of water resourcesIncludes the activities and actions aimed at minimizing the intake of water resources through in-process modifications as well as reuse, recycling, savings and the use of substitutes of freshwater resources. Activities aiming at the replenishment of water stocks are included.Activities and actions concerning measurement, control, laboratories and the like are also included, as well as education, training and information and administration and regulation activities. Exploitation, exploration and distribution activities are excluded.
14.1 Reduction of the intake of water resourcesReduction of the intake through in-process modifications related to the reduction of the water input for the production process. This includes all the kinds of replacement or adjustment of production processes aiming at reducing the water input needed for producing a certain output. Desalinization of seawater is included.
14.2 Reduction of water losses and leaks, water reuse and savingsReduction of water use through the reduction of water losses and leaks, the installation of facilities for water reuse and savings, etc.
14.3 Replenishment of water resourcesIncrease of water available in water stocks. The following activities are included: recharge of groundwater bodies to increase/restore water stocks (not to improve water quality or fight salinity → CEA 4.4); land improvement, development of vegetal cover in order to increase water infiltration and recharge phreatic water bodies (not for the protection of soil against erosion → CEA 4.3).
14.4 Measurement, control, laboratories and the like related to water resourcesActivities aimed at measuring, controlling and monitoring the use and the level of water stocks. The following activities are excluded: measurement, monitor and control of the concentration of pollutants in wastewater and the quality of the inland water and marine water at the place wastewater is discharged → CEA 2.5; measurement, monitor and control of the quality of surface water and groundwater → CEA 4.5.
14.5 Other activities for the management of water resourcesAll other activities and measures aimed at the management of water resources. These include regulation, administration, education, training and information activities specific to the class when they can be separated from other activities related to the same class and from similar activities related to other classes of the RM group. They include, for example: information campaigns to encourage water savings; release of licences for water abstraction; and general government units or parts thereof that administer and regulate the use of water resources or are responsible for water saving policies.
15 Research and development activities for resource managementCreative work undertaken on a systematic basis in order to increase the stock of knowledge and the use of this knowledge to devise new applications in the field of natural resource management and savings.
117
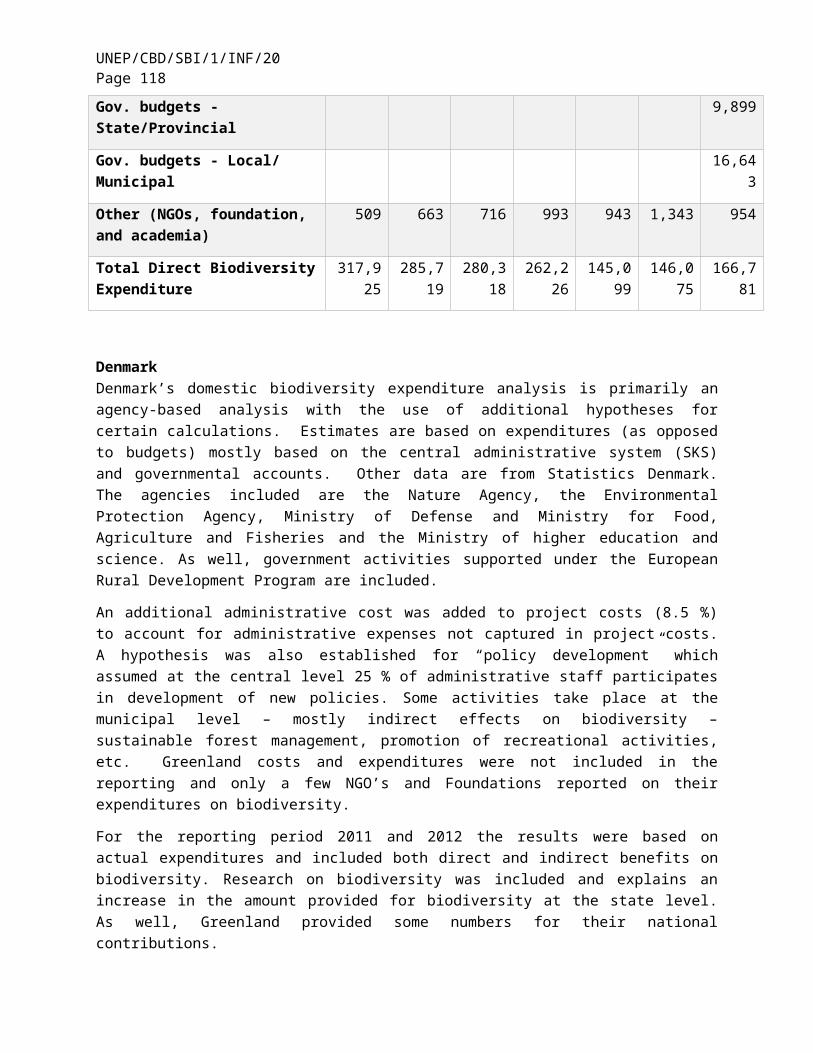
UNEP/CBD/SBI/1/INF/20Page 118
Excluded are R&D activities related to environmental protection → CEA 8.
15.1 Mineral and energy resourcesR&D activities exclusively related to energy sources (non-renewable and renewable) and minerals.
15.2 Timber resourcesR&D activities exclusively related to natural timber resources.
15.3 Aquatic resourcesR&D activities exclusively related to aquatic resources.
15.4 Other biological resources
R&D activities exclusively related to other biological resources (excluding timber and aquatic resources).
15.5 Water resourcesR&D activities exclusively related to water resources.
15.6 Other R&D activities for natural resource managementOther R&D activities concerning other natural resources (not specified).
16 Other resource management activities
16.1 General administration of natural resourcesAny identifiable activity that is directed towards the general support of decisions taken in the context of natural resource management whether by governmental or by nongovernmental units.
16.1.1 General administration, regulation and the likeAny identifiable activity within general government and NPISH units that is directed towards regulation, administration of the environment and the support of decisions taken in the context of natural resource management activities. When possible, such activities should be allocated to CEA classes 10-14 (within the “other activities for the management of” category).If this is impossible, they should be included under this position of the classification.If the general administration activities concern both environmental protection and management of natural resources, they should be broken down between this position and the corresponding CEA category of the EP group (→ CEA 9.1.1). If this is impossible, they should be classified in this position or, alternatively, in the one of the EP group according to the “main purpose” criterion; if this is impossible as well, they should be classified within the corresponding category of the EP group (→ CEA 9.1.1)
16.1.2 Environmental managementAny identifiable activity of corporations that is directed towards the general support of decisions taken in the context of natural resource management activities. This includes the preparation of declarations or requests for permission, internal environmental management, and environmental certification processes (ISO 14000; EMAS), as well as the recourse to environmental consultancy services. Activities of units specialized in environmental consultancy, supervision and analysis are included. When possible, such activities should be allocated to CEA classes 10-14 (within the “other activities for the management of” category). If this is impossible, they should be included under this position of the classification.If the general administration activities concern both environmental protection and management of natural resources, they should be broken down between this position and the corresponding category of the EP group (→ CEA 9.1.2). If this is impossible, they should be classified in this position or, alternatively, in
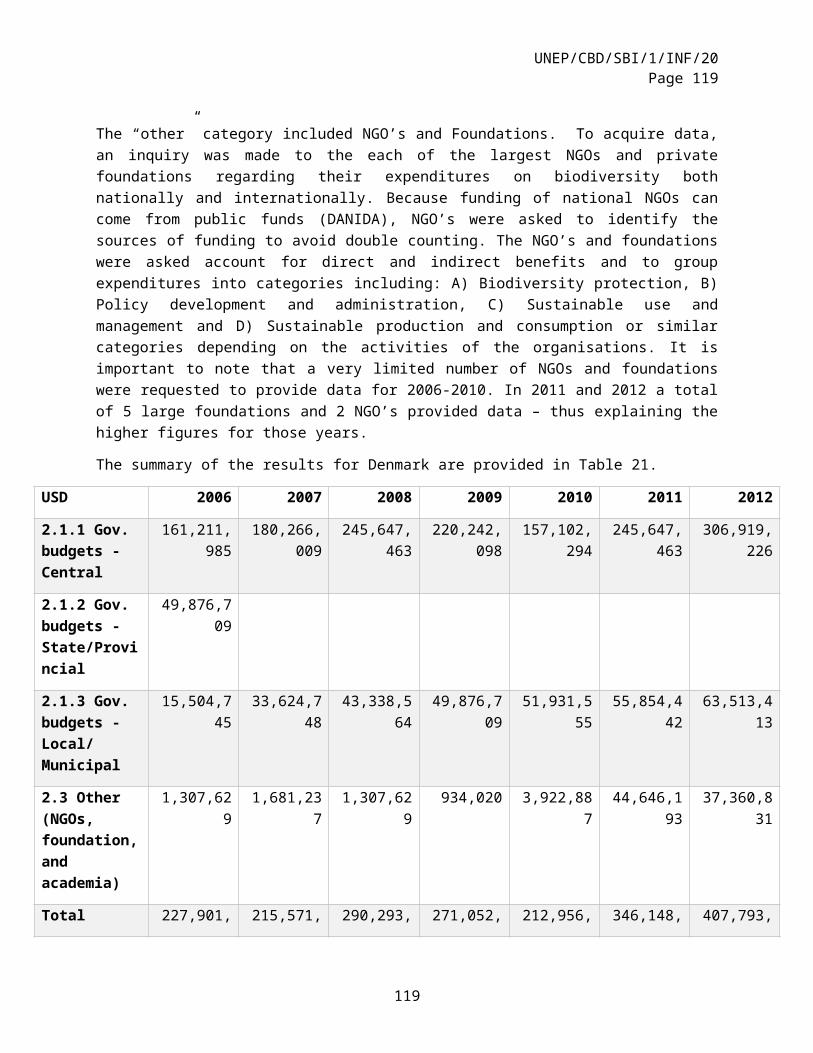
UNEP/CBD/SBI/1/INF/20Page 119
the one of the EP group according to the “main purpose” criterion; if this is impossible as well, they should be classified within the corresponding category of the EP group (→ CEA 9.1.2).
16.2 Education, training and informationActivities that aim at providing general environmental education or training and disseminating information on natural resource management. Included are high school programmes, university degree programmes or special courses specifically aimed at training for natural resource management. Activities such as the production of environmental reports and environmental communication are also included. When possible, such activities should be allocated to CEA classes 10-14 (within the “other activities for the management of” category).If this is impossible, they should be included under this position of the classification.If the general education, training and information activities concern both environmental protection and management of natural resources, they should be broken down between this position and the corresponding category of the EP group (→ CEA 9.2). If this is impossible, they should be classified in this position or, alternatively, in the one of the EP group according to the “main purpose” criterion; if this is impossible as well, they should be classified within the corresponding category of the EP group (→ CEA 9.2).
16.3 Activities leading to indivisible expenditureNatural resource management activities that lead to indivisible expenditure, i.e., that cannot be allocated to any other class of the RM group.
16.4 Activities not elsewhere classifiedThis class comprises all resource management activities that cannot be classified under other classes of the RM group.
III. Natural Resource Use (RU)Explanatory notes Code Description Explanatory notes/Examples68
17 Use of water resources All the activities and actions aiming at the abstraction of water resources, including exploration and development of new reserves. Water supply and distribution is included. Activities and actions aimed at protecting water bodies against pollution are excluded and included in the EP group (→ CEA 2 and CEA 4). Activities and actions aiming at preserving the stocks of water resources against depletion phenomena are excluded and included in the RM group (→ CEA 10).
17.1 Exploitation of water resources including water supply and distribution Exploitation, management and maintenance of water resources. Distribution of water. It includes for example water abstraction, conduction and distribution (waterworks), including water use for irrigation; lakes and reservoirs regulation; etc. The management and maintenance activities carried out by the public or private authorities in charge of the direct management and exploitation of water stocks are included, while the administration and regulation activities carried out by the General Government are excluded and included in the RM group → CEA 10.5.
17.2 Exploration and development of water resources Exploration for new stocks. Development of new stocks (e.g. creation of new reservoirs).
68 ESA/STAT/AC.234/29 16 May 2011 Classification of Environmental Activities (CEA) Information Paper, UNSD http://unstats.un.org/unsd/class/intercop/expertgroup/2011/AC234-29.PDF
119
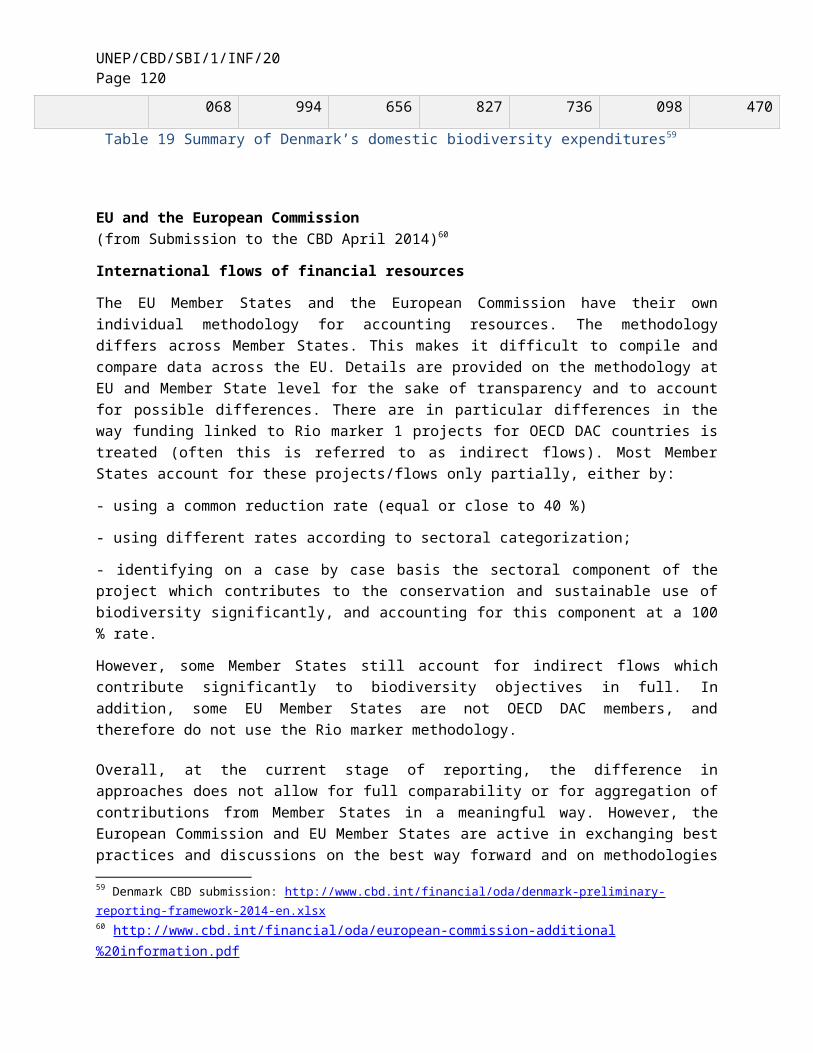
UNEP/CBD/SBI/1/INF/20Page 120
18 Use of natural forest resources All the activities and actions aiming at the harvesting of natural forests, including exploration for the use of forest areas previously not exploitable. Activities and actions aimed at protecting forest landscape and biodiversity are excluded and included in EP group (→ CEA 6). Activities and actions aiming at preserving the stocks of natural forests against depletion phenomena are excluded and included in the RM group (→ CEA 11). Natural forests are virgin forests and, in general, non-cultivated forests. All the activities and actions related to cultivated forests are excluded.
18.1 Exploitation of natural forest areas (as a resource and not as a habitat) Exploitation, management and maintenance of natural forest areas. The management and maintenance activities carried out by the public or private authorities in charge of the direct management and exploitation of natural forest are included, while the administration and regulation activities carried out by the General Government are excluded and included in the RM group → CEA 11.6. Examples: management and maintenance of non-cultivated forest areas available for felling and logging activities (except for reforestation and afforestation activities → CEA 11.3); monitoring and control activities carried out by forest rangers on forest areas as economic resources (not to protect forest habitats or the biodiversity of flora and fauna species living in forest areas → CEA 6.1 or 6.2).
18.2 Exploration of natural forest areas Exploration for the use of forest areas previously not exploitable.
19 Use of wild flora and fauna All the activities and actions with the purpose of using the stock of wild flora and fauna. The protection of biodiversity of wild flora and fauna is excluded (→ CEA 6) as well as the management of the stocks of wild flora and fauna (→ CEA 12). Wild flora and fauna are stocks and reserves of non-cultivated animals and plants.
19.1 Exploitation of wild flora and fauna stocks Exploitation, management and maintenance of wild flora and fauna stocks. The management and maintenance activities carried out by the public or private authorities in charge of the direct management and exploitation of wild flora and fauna stocks are included, while the administration and regulation activities carried out by the General Government are excluded and included in the RM group → CEA 12.4. Examples: management of fish and game reserves.
19.2 Exploration and research of new reserves Exploration and research activities for identifying/localizing reserves of wild flora and fauna previously unknown or not exploitable/exploited.
20 Use of fossil energy All activities and actions aiming at the management and exploitation of fossil energy stocks as well as exploration and discovery of new reserves. Distribution of electricity is excluded. Activities and actions aiming at preserving the stocks of fossil energy against depletion phenomena are excluded and included in the RM group (→ CEA 13).
20.1 Exploitation of the stocks of non-renewable energy sources Exploitation, management and maintenance of the stocks of non-renewable energy sources. The management and maintenance activities carried out by the public or private authorities in charge of the direct management, exploitation and exploration of energy reserves are included, while the administration and regulation activities carried out by the General Government are excluded and included in the RM group → CEA 13.4.
UNEP/CBD/SBI/1/INF/20Page 121
20.2 Exploration and discovery of new fossil energy reserves Exploration and discovery of new reserves.
21 Use of minerals All activities and actions aiming at the management and exploitation of mineral resources as well as exploration and discovery of new reserves. Activities and actions aiming at preserving the stocks of mineral against depletion phenomena are excluded and included in the RM group (→ CEA 14).
21.1 Exploitation of mineral stocks Exploitation, management and maintenance of the stocks of mineral resources; management of quarrying sites (activities for the rehabilitation of abandoned mining and quarrying sites are excluded → CEA 6.2). The management and maintenance activities carried out by the public or private authorities in charge of the direct management, exploitation and exploration of mineral stocks are included, while the administration and regulation activities carried out by the General Government are excluded and included in the RM group → CEA 14.4.
21.2 Exploration and discovery of new mineral reserves Exploration and discovery of new reserves.
IV. Minimization of Natural HazardsActivities associated with the minimization of the impact of natural hazards on the economy and society.69
Research, observation and measurement networks, surveillance and administration of hazard warning systems, provisions for fighting the effects natural hazards and for the evacuation of the population, the building of structures to prevent hazards. In some cases the primary purpose of these activities may be environmental protection and they should be recorded as part of environmental protection activities.
The Classification of Resource Use and Management Activities and expenditure – CReMA
Note significant overlap and different numbering system
10 Use and management of water resourcesAll the activities and actions aiming at minimising the intake of water resources through in-process modifications as well as reuse, recycling, savings and the use of substitutes of fresh water resources.Restoration activities aiming at the replenishment of water stocks are included as well exploitation, exploration and distribution activities. All the activities and actions concerning measurement, control, laboratories and the like are also included as well as education, training and information and administration and regulation activities.
10.1 Reduction of the intake Reduction of the intake through in-process modifications related to the reduction of the water input for the production process. It includes all the kinds of replacement or adjustment of production processes aiming at reducing the water input needed for producing a certain output. Desalinisation of sea water is included.
10.2 Reduction of water losses and leaks, water reuse and savingsReduction of water use through the reduction of water losses and leaks, the installation of facilities for water reuse and savings, etc.
69 Statistics Finland http://unstats.un.org/unsd/envaccounting/londongroup/meeting19/LG19_18_4.pdf
121
UNEP/CBD/SBI/1/INF/20Page 122
10.3 Replenishment of water stocksIncrease of water available in water stocks. The following activities are included: recharge of groundwater bodies to increase/restore water stocks (not to improve water quality or fight salinity ® CEPA 4.4); land improvement, development of vegetal cover in order to increase water infiltration and recharge phreatic water bodies (not for the protection of soil against erosion ® CEPA 4.3)
10.4 Direct management of water stocksExploitation, management and maintenance of water resources and exploration for new stocks. Distribution of water. It includes for example water abstraction, conduction and distribution (waterworks), including water use for irrigation; lakes and reservoirs regulation; etc.The management and maintenance activities carried out by the public or private authorities in charge of the direct management and exploitation of water stocks are included, while the administration and regulation activities carried out by the General Government are excluded ® CREMA 10.6
10.5 Measurement, control, laboratories and the likeActivities aimed at measuring, controlling and monitoring the use and the level of water stocks. The following activities are excluded: measurement, monitor and control of the concentration of pollutants in wastewater and the quality of the inland water and marine water at the place wastewater is discharged ® CEPA 2.5; measurement, monitor and control of the quality of surface and ground water ® CEPA 4.5
10.6 Other activities All other activities and measures aimed at the use and management of water resources. It includes regulation, administration, education, training and information activities specific to the class when they can be separated from other activities related to the same class and from similar activities related other classes. It includes for example: information campaigns to encourage water savings; release of licences for water abstraction; General Government units or part thereof which administrate and regulate the use of water resources or are responsible for water saving policies. It excludes public or private bodies which carry out e.g. water abstraction, conduction and distribution activities ® CREMA 10.4
11 Use and management of natural forest resourcesAll the activities and actions aiming at minimising the intake of natural forest resources through in-process modifications as well as recovery, reuse, recycling, savings and the use of substitutes of forest products. Restoration activities like reforestation and afforestation are included when concern natural forest as well as the management and exploitation activities of natural forest areas. All the activities and actions concerning measurement, control, laboratories and the like are also included as well as education, training and information and administration and regulation activities.
Natural forests are virgin forests and, in general, non-cultivated forests.
All the activities and actions related to cultivated forests are excluded.
11.1 Reduction of the intake Reduction of the intake through in-process modifications related to the reduction of the input of forest resources for the production process. It includes all the kinds of replacement or adjustment of production processes aiming at reducing the input of forest (wood and non wood)- related products needed for producing a certain output. The substitution of forest products with other material and substances is included.
11.2 Reduction of the consumption of forest (wood and non wood)-related products Recycling, reuse or savings of forest products and by-products (wood, paper, etc.).
UNEP/CBD/SBI/1/INF/20Page 123
11.3 Reforestation and afforestationReplenishment of existing natural wooded areas or development of new wooded areas.
11.4 Forest fires Prevention and control of natural forest fires (concerning forest areas relevant mainly as economic resource and not as habitats ® CEPA 6.2). It includes for example: development of fireballs, mobilisation of fire fighting means or measures aimed at the prevention of fires in forest areas.
11.5 Direct management of forest areas (as a resource and not as a habitat)Exploitation, management and maintenance of natural forest areas and exploration for the use of forest areas previously not exploitable. The management and maintenance activities carried out by the public or private authorities in charge of the direct management and exploitation of natural forest are included, while the administration and regulation activities carried out by the General Government are excluded ® CREMA 11.7.Examples: management and maintenance of non-cultivated forest areas available for felling and logging activities (except for reforestation and afforestation activities ® CREMA 11.3); monitoring and control activities carried out by forest rangers on forest areas as economic resources (not to protect forest habitats or the biodiversity of flora and fauna species living in forest areas ® CEPA 6.1 or 6.2)
11.6 Measurement, control, laboratories and the like
Activities aimed at measuring, controlling and monitoring the use and the consistency of forest resource stocks. It includes for example inventories and assessments of forest resources. Measurement, controlling and monitoring activities related to the protection of biodiversity and landscape are excluded like e.g. inventories of flora and fauna species living in natural forest areas ® CEPA 6.1 and census of natural forest protected areas ® CEPA 6.2.
11.7 Other activities All other activities and measures aimed at the use and management of natural forest resources. It includes regulation, administration, education, training and information activities specific to the class when they can be separated from other activities related to the same class and from similar activities related other classes. It includes for example: the release of logging licences; General Government units or part thereof which administrate and regulate the use of natural forest resources or are responsible for forest management policies. It excludes public or private bodies which carry out the direct management of forest areas ® CREMA 11.5.
12 Use and management of wild flora and faunaAll the activities and actions aiming at minimising the intake of wild flora and fauna resources through in-process modifications as well as the use of alternative resources and any other kind of measure.Restoration activities like repopulation of wild flora and fauna stocks are included when aiming at maintaining/increasing the consistency of stocks (not the biodiversity ® CEPA 6). Management and exploitation activities are also included. All the activities and actions concerning measurement, control, laboratories and the like are also included as well as education, training and information and administration and regulation activities.Wild flora and fauna are stocks and reserves of non-cultivated animals and plants. The class includes all the activities and actions with the purpose of managing, maintaining and increasing the stock of wild flora and fauna. The protection of biodiversity of wild flora and fauna is excluded (® CEPA 6).
12.1 Reduction of the intake Reduction of the intake through in-process modifications. It includes all the kinds of replacement or adjustment of production processes aiming at reducing the input of wild flora and fauna resources needed for producing a certain output. It includes for example vessel buy-back
123
UNEP/CBD/SBI/1/INF/20Page 124
programmes for the introduction of more efficient fishing fleets and equipments.The use of alternative resources is included.
12.2 Replenishment of wild flora and fauna stocksIncrease of the number of individuals of wild flora and fauna stocks. It includes for example breeding for the replenishment of stocks for fishing or hunting (for restocking purposes and not for protection of biodiversity ® CEPA 6.1)
12.3 Direct management of wild flora and fauna stocksExploitation, management and maintenance of wild flora and fauna stocks. The management and maintenance activities carried out by the public or private authorities in charge of the direct management and exploitation of wild flora and fauna stocks are included, while the administration and regulation activities carried out by the General Government are excluded ® CREMA 12.5.Examples: management of fish and game reserves.
12.4 Measurement, control, laboratories and the likeActivities aimed at measuring, controlling and monitoring the use and the consistency of wild flora and fauna stocks. It includes for example: inventories and assessment of wild fauna stocks; control on the observance of licences, quotas, temporary or permanent fishing/hunting bans. Measurement, controlling and monitoring activities related to the protection of biodiversity and landscape are excluded like e.g. inventories of flora and fauna threatened species ® CEPA 6.1
12.5 Other activities All other activities and measures aimed at the use and management of wild flora and fauna resources. It includes regulation, administration, education, training and information activities specific to the class when they can be separated from other activities related to the same class and from similar activities related other classes. It includes for example: release of fishing and hunting licences, enforcement and administration of quotas, enforcement and regulation of temporary or permanent fishing/hunting bans; General Government units or part thereof which administrate and regulate the exploitation of wild flora and fauna resources or are responsible for wild flora and fauna management policies. It excludes public or private bodies which carry out the direct management of wild flora and fauna reserves ® CREMA
13 Use and management of fossil energy All the activities and actions aiming at minimising the intake of fossil energy resources through in-process modifications as well as savings, the production of energy from renewable sources and any other kind of measure. Management and exploitation of fossil energy stocks as well as exploration and discovery of new reserves are included. All the activities and actions concerning measurement, control, laboratories and the like are also included as well as education, training and information and administration and regulation activities.
13.1 Reduction of the intake Reduction of the intake through in-process modifications related to the reduction of the input of non-renewable energy sources for the production process. It includes all the kinds of replacement or adjustment of production processes aiming at reducing the input of energy resources needed for producing a certain output.This category includes all the activities and actions aiming at the reduction of non-renewable energy sources exploitation through the production of energy from renewable sources (which is then excluded from CEPA 1), including, according to the International Energy Agency definition of renewables, hydropower, solar, wind, tidal, biogas, geothermal or biomass sources as well as the production of energy from the combustion of any kind of waste (the incineration of waste carried out for the main purpose of waste treatment and disposal is excluded ® CEPA 3.3 or 3.4)
UNEP/CBD/SBI/1/INF/20Page 125
13.2 Reduction of heat and energy losses, and energy savingsReduction of the use of non-renewable energy sources through the minimisation of heat and energy losses and through energy savings (energy savings is then excluded from CEPA 1)
13.3 Direct management of the stocks of nonrenewable energy sourcesExploitation, management and maintenance of the stocks of nonrenewable energy sources including exploration and discovery of new reserves. The management and maintenance activities carried out by the public or private authorities in charge of the direct management, exploitation and exploration of energy reserves are included, while the administration and regulation activities carried out by the General Government are excluded ® CREMA 13.5.Distribution of electricity is excluded.
13.4 Measurement, control, laboratories and the likeActivities aimed at measuring, controlling and monitoring the use and the consistency of fossil energy stocks as well as the production of energy from renewable sources. It includes for example: assessment and reassessment of existing reserves; assessment of the importance of the production of energy from renewable sources on total energy production.
13.5 Other activities All other activities and measures aimed at the use and management of energy resources. It includes regulation, administration, education, training and information activities specific to the class when they can be separated from other activities related to the same class and from similar activities related other classes. It includes for example: release of licences for energy sources abstraction; General Government units or part thereof which administrate and regulate the exploitation of energy resources or are responsible for energy savings policies. It excludes public or private bodies which manage, exploit and explore energy reserves ® CREMA 13.3.
14 Use and management of mineralsAll the activities and actions aiming at minimising the intake of mineral resources through in-process modifications as well as recovery, reuse, recycling, savings and the use of substitutes mineral resources.Management and exploitation of mineral resources as well as exploration and discovery of new reserves are included. All the activities and actions concerning measurement, control, laboratories and the like are also included as well as education, training and information and administration and regulation activities.
14.1 Reduction of the intake Reduction of the intake through in-process modifications related to the reduction of the raw material input for the production process or the consumption or use of resource-efficient products.
14.2 Reduction of minerals use through the reduction of scraps and the production and consumption of recycled materials and products Production and use of secondary raw materials or final products obtained from recovered and recycled materials and waste. It includes for example: processing of waste and scrap into a form which is readily transformed into new raw materials, production of recycled goods (recycling activities insofar as they constitute waste collection, transport, treatment or disposal activities are excluded ® CEPA 3.2, 3.3 and 3.4)
14.3 Direct management of mineral stocksExploitation, management and maintenance of the stocks of mineral resources including research and exploration activities; management of quarrying sites (activities for the rehabilitation of abandoned mining and quarrying sites are excluded ® CEPA 6.2). The management and maintenance activities
125
UNEP/CBD/SBI/1/INF/20Page 126
carried out by the public or private authorities in charge of the direct management, exploitation and exploration of mineral stocks are included, while the administration and regulation activities carried out by the General Government are excluded ®CREMA 14.5.
14.4 Measurement, control, laboratories and the likeActivities aimed at measuring, controlling and monitoring the use and the consistency of mineral stocks. It includes for example: inventories and assessment of mineral stocks.
14.5 Other activities All other activities and measures aimed at the use and management of mineral resources. It includes regulation, administration, education, training and information activities specific to the class when they can be separated from other activities related to the same class and from similar activities related other classes. It includes for example: release of licences for mining and quarrying activities; General Government units or part thereof which administrate and regulate the exploitation of mineral resources or are responsible for material savings and recycling policies. It excludes public or private bodies which manage, exploit and explore mineral reserves ® CREMA 14.3.
15 Research and development activities for natural resource use and managementCreative work undertaken on a systematic basis in order to increase the stock of knowledge and the use of this knowledge to devise new applications in the field of natural resource management and savings.Excluded are R&D activities related to environmental protection ® CEPA 8
15.1 Water resources R&D activities exclusively related to water resources
15.2 Natural forest resources R&D activities exclusively related to natural forest resources
15.3 Wild flora and fauna R&D activities exclusively related to wild flora and fauna resources
15.4 Fossil energy R&D activities exclusively related to energy sources (non-renewable and renewable)
15.5 Minerals R&D activities exclusively related to minerals
15.6 Other R&D activities for natural resource use and managementOther R&D activities concerning other natural resources (not specified)16. Other natural resource use and management activities
16.1 General administration of natural resourcesAny identifiable activity that is directed at the general support of decisions taken in the context of natural resource use and management whether by governmental or by non-governmental units.
16.1.1 General administration, regulation and the likeAny identifiable activity within general government and NPISH units that is directed towards the regulation, administration of the environment and the support of decisions taken in the context of natural resource use and management activities. When possible such activities should be allocated to other CREMA classes (within the “other activities” category). If this is impossible, they should be included under this position of the classification.If the general administration activities concern both environmental protection and use and management of natural resources, they should be broken down between this position and the corresponding CEPA category (® CEPA 9.1.1). If this is impossible, they should be classified in this position or alternatively in the CEPA one according to the “main purpose” criterion; if this is impossible as well, they should be classified within the corresponding CEPA category (® CEPA 9.1.1)
UNEP/CBD/SBI/1/INF/20Page 127
16.1.2 Environmental managementAny identifiable activity of corporations that is directed at the general support of decisions taken in the context of natural resource use and management activities. It includes the preparation of declarations or requests for permission, internal environmental management, environmental certification processes (ISO 14000, EMAS), as well as the recourse to environmental consultancy services. Activities of unitsspecialised in environmental consultancy, supervision and analysis are included. When possible such activities should be allocated to other CREMA classes (within the “other activities” category). If this is impossible, they should be included under this position of the classification.If the general administration activities concern both environmental protection and use and management of natural resources, they should be broken down between this position and the corresponding CEPA category (® CEPA 9.1.2). If this is impossible, they should be classified in this position or alternatively in the CEPA one according to the “main purpose” criterion; if this is impossible as well, they should be classified within the corresponding CEPA category (® CEPA 9.1.2)
16.2 Education, training and informationActivities that aim at providing general environmental education or training and disseminating information on natural resource use and management. Included are high school programs, university degrees or special courses specifically aimed at training for natural resource use and management. Activities such as the production of environmental reports, environmental communication, etc. are also included. When possible such activities should be allocated to otherCREMA classes (within the “other activities” category). If this is impossible, they should be included under this position of the classification.If the general education, training and information activities concern both environmental protection and use and management of natural resources, they should be broken down between this position and the corresponding CEPA category (® CEPA 9.2). If this is impossible, they should be classified in this position or alternatively in the CEPA one according to the “main purpose” criterion; if this is impossible as well, they should be classified within the corresponding CEPA category (® CEPA 9.2)
16.3 Activities leading to indivisible expenditureNatural resource use and management activities that lead to indivisible expenditure, i.e. which cannot be allocated to any other CREMA class
16.4 Activities not elsewhere classifiedThis position groups together all the natural resource use and management activities that cannot be classified under other positions of the classification
Classification of Functions of Government (COFOG)
The top level classification below is taken from the IMF Government Finance Statistics Manual 2014. A more extensive description of the agriculture, forestry, fishing, and hunting sub-class is also provided, in order to illustrate the potential relevance of classes beyond the environmental protection class (which is mirroring CEPA).
(http://www.imf.org/external/Pubs/FT/GFS/Manual/2014/gfsfinal.pdf )
127
UNEP/CBD/SBI/1/INF/20Page 128
Excerpt:
7042 AGRICULTURE, FORESTRY, FISHING,AND HUNTING
UNEP/CBD/SBI/1/INF/20Page 129
70421 Agriculture (CS)• Administration of agricultural affairs and services; conservation, reclamation, or expansion of arable land; agrarian reform and land settlement; supervision and regulation of the agricultural industry • Construction or operation of flood control, irrigation, and drainage systems, including grants,loans, or subsidies for such works• Operation or support of programs or schemes to stabilize or improve farm prices and farmincomes; operation or support of extension services or veterinary services to farmers, pestcontrol services, crop inspection services, and crop grading services• Production and dissemination of general information, technical documentation, and statisticson agricultural affairs and services• Compensation, grants, loans, or subsidies to farmers in connection with agricultural activities,including payments for restricting or encouraging output of a particular crop or forallowing land to remain noncultivated.Excludes: multipurpose development projects (70474).
70422 Forestry (CS)• Administration of forestry affairs and services; conservation, extension, and rationalized exploitation of forest reserves; supervision and regulation of forest operations and issuance oftree-felling licenses• Operation or support of reforestation work, pest and disease control, forest fi refighting and fireprevention services, and extension services to forest operators• Production and dissemination of general information, technical documentation, and statisticson forestry affairs and services• Grants, loans, or subsidies to support commercial forest activities.Includes: forest crops in addition to timber.
70423 Fishing and hunting (CS)This class covers both commercial fishing and hunting, and fishing and hunting for sport. The fishing and hunting affairs and services listed here refer to activities that take place outside natural parks and reserves.
• Administration of fishing and hunting affairs and services; protection, propagation, and rationalized exploitation of fish and wildlife stocks;
Supervision and regulation of freshwater fishing, coastal fishing, ocean fishing, fish farming, wildlife hunting, and issuance of fishing and hunting licenses• Operation or support of fish hatcheries, extension services, stocking or culling activities, etc.• Production and dissemination of general information, technical documentation, and statisticson fishing and hunting affairs and services• Grants, loans, or subsidies to support commercial fishing and hunting activities, including theconstruction or operation of fish hatcheries.Excludes: control of off shore and ocean fishing(70310); administration, operation, or support of naturalparks and reserves (70540).
-----
129
UNEP/CBD/SBI/1/INF/20Page 130
Annex III
List of Participants
GOVERNMENT-NOMINATED EXPERTSMr. Mensah
Bienvenu Celestin Bossou
Independent expert, resource mobilization
Executive Director, CeSaReN (NGO)
Benin [email protected]; [email protected]
Ms. Gloria de las Mercedes Gomez Pais
Officer Environment Department, Ministry of Science, Technology and Environment
Cuba [email protected]
Ms. Mette Gervin Damsgaard
Head of Section Biodiversity and Species, Nature Agency, Ministry of Environment
Denmark [email protected]
Mr. Hans Andre Lohayo Djamba
Designed National Authority, Country Director and Contact Person
Green Climate Fund National Coordination, Ministry of Sustainable Development
Democratic Republic of the Congo
Ms. Laure Ledoux
(by video link)
Policy Officer for Biodiversity
Directorate-General Environment, European Commission
European Commission
Mr. Andreas Gettkant
Director Deutsche Gesellschaft für Internationale Zusammenarbeit (GIZ) GmbH
Germany [email protected]
Mr. Jose Luis Echeverria Tello
Director, Biodiversity Protected Areas National Council
Guatemala [email protected];
Mr. Appukuttan Nair Damodaran
Professor. Faculty of Economics and Social Sciences
Indian Institute of Management
India [email protected]
Ms. Sarah Kerandi Kemunto
Deputy Chief Finance Officer
Ministry of Environment, Water, Natural Resources
Kenya [email protected]
Mr. Midhath Abdul Rasheed
Environmental Analyst Ministry of Environment and
Maldives [email protected]
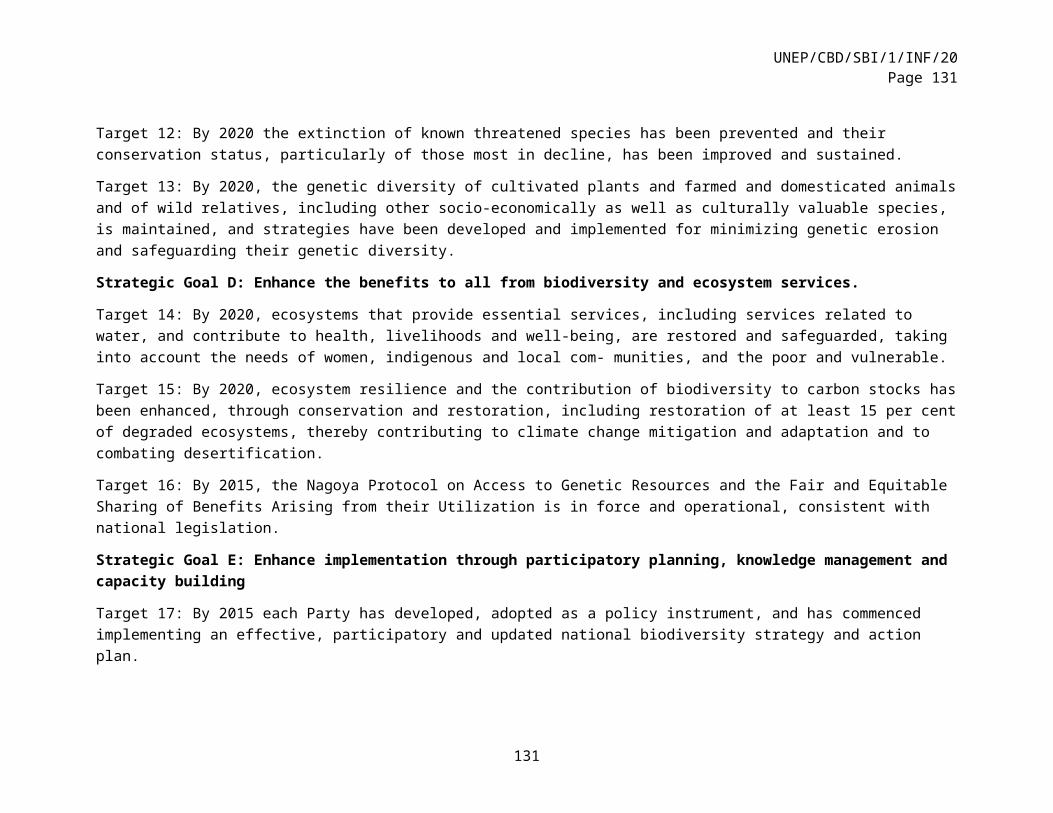
UNEP/CBD/SBI/1/INF/20Page 131
Energy
Ms. Mariana Bellot Rojas
General Director for Institutional Development and Outreach
National Commission for Protected Areas (CONAP)
Mexico [email protected] ; [email protected]
Ms. Tone Solhaug Senior Adviser Department for Biodiversity, Outdoor Recreation and Cultural Heritage, Ministry of Climate and Environment
Norway [email protected]
Mr. Luis Antonio Sanchez Perales
Professor, Financial Planning and Designing, Environment Management
ESAN University Peru [email protected]
Ms. Armida Andres Chief, Biodiversity Policy and Knowledge Management Division
Department of Environment and Natural Resources
Philippines [email protected];
Ms. Ala Rotaru Head, Natural Resources and Biodiversity
Division Ministry of Environment
Republic of Moldova
Ms. Tracey Lyn Cumming
BIOFIN Project Leader Department of Environmental Affairs
South Africa [email protected];
Ms. Gabriela Blatter Senior Policy Adviser, Environment Finance
Federal Office for the Environment, International Affairs Division
Switzerland [email protected]
Mr. Sabino Francis Ogwal
Natural Resources Management Specialist
Biodiversity & Rangelands
Uganda [email protected]
INTERNATIONAL ORGANIZATIONSMr. Carlos Manuel
RodriguezSenior Policy Adviser
Vice President / Center for Environment and Peace
Conservation International
Ms. Eva Mayerhofer
Lead Environment and Biodiversity Specialist
Environment
Climate and Social Office/ Projects Directorate
131
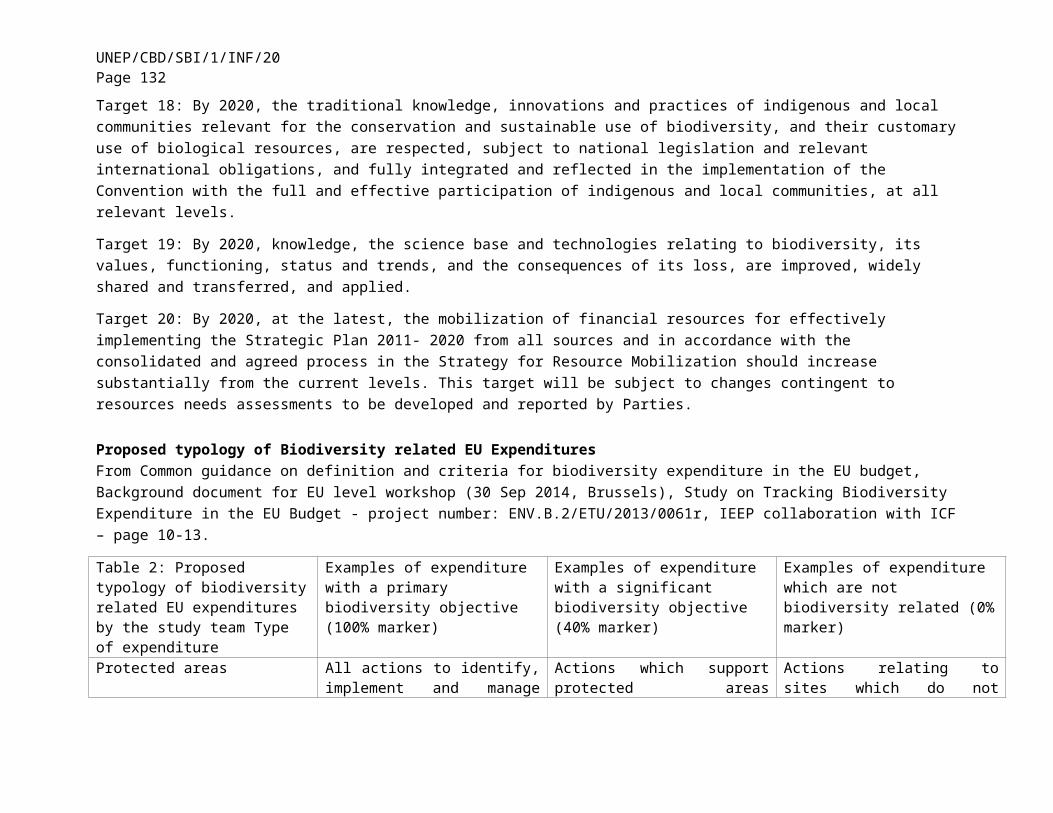
UNEP/CBD/SBI/1/INF/20Page 132
European Investment Bank
Ms. Anda Marina Georgescu
(by video link)
Project Manager European Commission - Eurostat
Mr. Mark Zimsky Senior Biodiversity Specialist
Natural Resources Division
Global Environment Facility (GEF)
Mr. Aaron Zazueta
(by video link)
Chief Evaluation Officer, Independent Evaluation Office
Global Environment Facility (GEF)
Ms. Stephanie Ockenden
Policy AnalystGreen Growth, Climate Change and EnvironmentGlobal Partnerships and Policies Division
Development Co-operation Directorate
Organization for Economic Cooperation and Development (OECD)
Ms. Maria Schultz Director The Resilience and Development Programme (SwedBio) Stockholm Resilience Centre,Stockholm University
Ms. Adriana Gonçalves Moreira
Senior Environmental Specialist & Global Biodiversity Focal Point, Environment & Natural Resources Global Practice
World Bank [email protected]
Ms. Marcela Aguirre Ecological Economy Specialist, Ecuador
United Nations Development Programme (UNDP)
Mr. Yves de Soye Manager, Biodiversity Finance Initiative (BIOFIN)Regional Technical Advisor, Ecosystems &
United Nations Development Programme (UNDP)
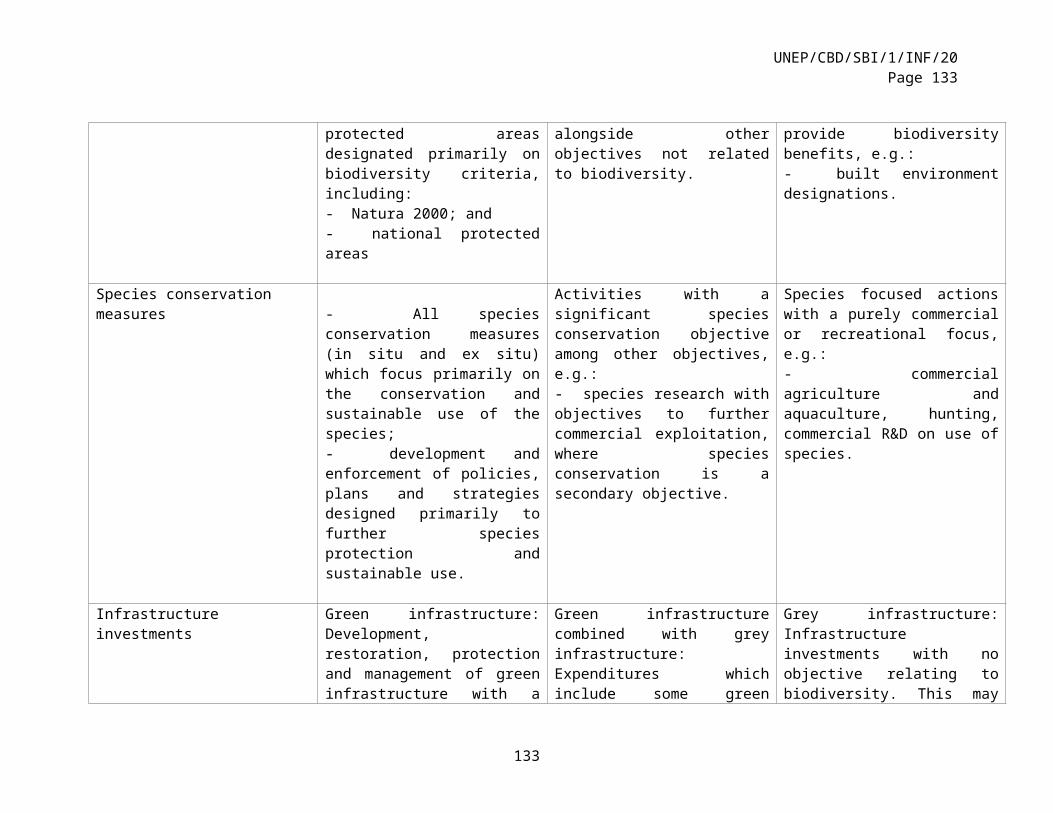
UNEP/CBD/SBI/1/INF/20Page 133
BiodiversityBureau for Policy and Programme Support
Ms. Jamison Ervin UNDP/GEF Global Project Manager on Early Action Grants for Protected Areas
United Nations Development Programme (UNDP)
Mr. Lyes Ferroukhi Regional Technical Adviser: Biodiversity, Ecosystems, Ecosystem Based Adaptation Bureau for Policy and Programme Support
United Nations Development Programme (UNDP)
Mr. Marlon Flores Senior Technical Advisor,Biodiversity Finance Initiative (BIOFIN) & Ecosystems Valuation
United Nations Development Programme (UNDP)
Mr. Lawrie Harper-Simmonds
Economist, Ministry of Environment and Tourism
United Nations Development Programme (UNDP)
[email protected]; [email protected];
Mr. David Meyers Sr. Technical Advisor United Nations Development Programme (UNDP)
Mr. Gonzalo Pizarro Regional Policy Adviser on Poverty, MDGs and Human Development
United Nations Development Programme (UNDP)
Ms. Zoila Celene Enríquez Mollinedo de Ruiz
Economist, Regional Policy Adviser on Poverty, MDGs and Human Development Regional Service Center for Latin America and the Caribbean
United Nations Development Programme (UNDP)
Mr. Sokol Vako Associate Statistician, Environmental-Economic Accounts Section, Economic Statistics Branch
United Nations Statistics Division (UNSD)
HOST GOVERNMENT EXPERTS Ms. Andrea Cruz
AngonCoordinator of Biodiversity Strategies
National Commission for Knowledge and
Mexico [email protected]
133
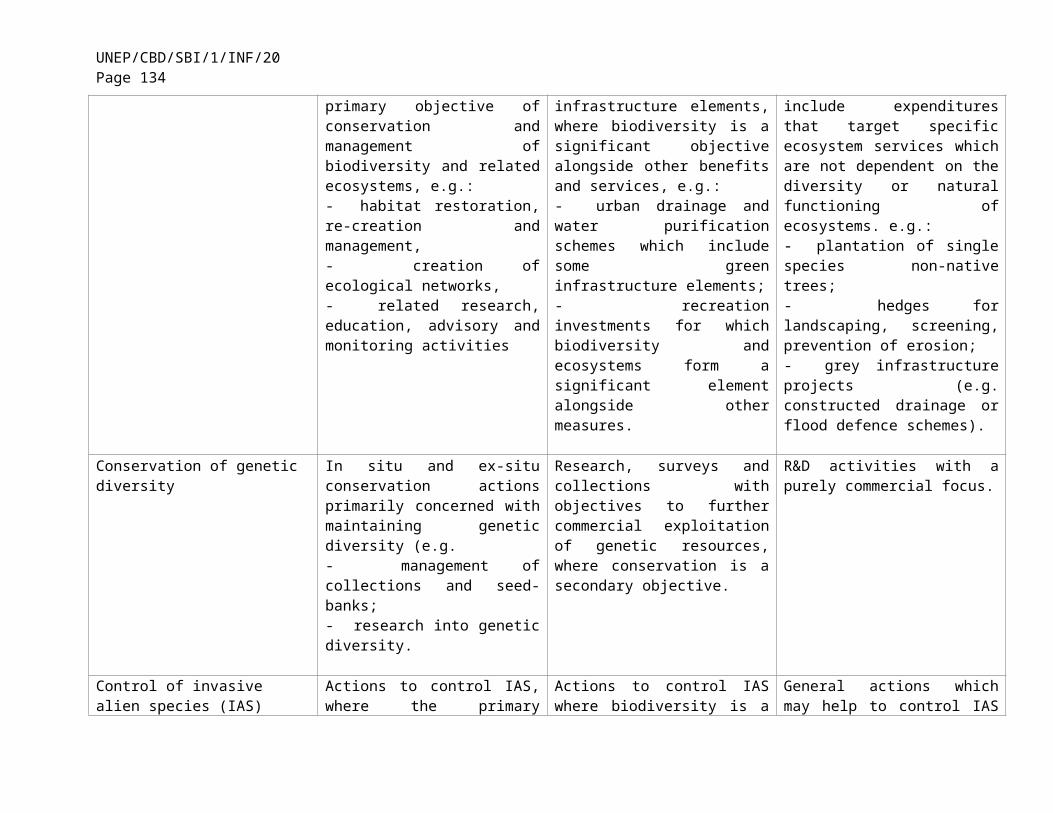
UNEP/CBD/SBI/1/INF/20Page 134
and International Cooperation
Use of Biodiversity (CONABIO)
Mr. Hesiquio Benitez Diaz
General Director of International Cooperation and Implementation
National Commission for Knowledge and Use of Biodiversity (CONABIO)
Mexico [email protected]; [email protected]
Ms. Fernanda Montero
Financing Advisor National Commission of Protected Natural Areas (CONANP)
Mexico [email protected]
Mr. Alonso Martinez Caballero
Deputy Director of International Affairs
National Commission of Protected Natural Areas (CONANP)
Mexico [email protected]
Mr. Luz Maria Murillo Jimenez
Administrative Assistant of the Conservation Programme of Protected Areas
National Commission of Protected Natural Areas (CONANP)
Mexico [email protected]
Mr. Marco Linne Representative National Institute for Fisheries (INAPESCA)
Dr. Carlos Muñoz Piña
Professor Mexico Autonomous Institute of Technology (Instituto Tecnológico Autónomo de México)
[email protected]; [email protected]
Ms. Gabriela Moreno
Secretariat of Agriculture, Livestock, Rural Development, Fisheries and Food (SAGARPA)
Mr. Rodolfo Lacy Tamayo
Undersecretary Secretariat of Environment and Natural Resources (SEMARNAT)
Mexico
Ms. Ida Alejandra Guzman Olguin
Director of Green Agenda
Secretariat of Environment and Natural Resources (SEMARNAT)
Mexico [email protected]
Mr. Ricardo Cano Renteria
Deputy Director of Green Agenda
Secretariat of Environment and Natural Resources
Mexico [email protected]
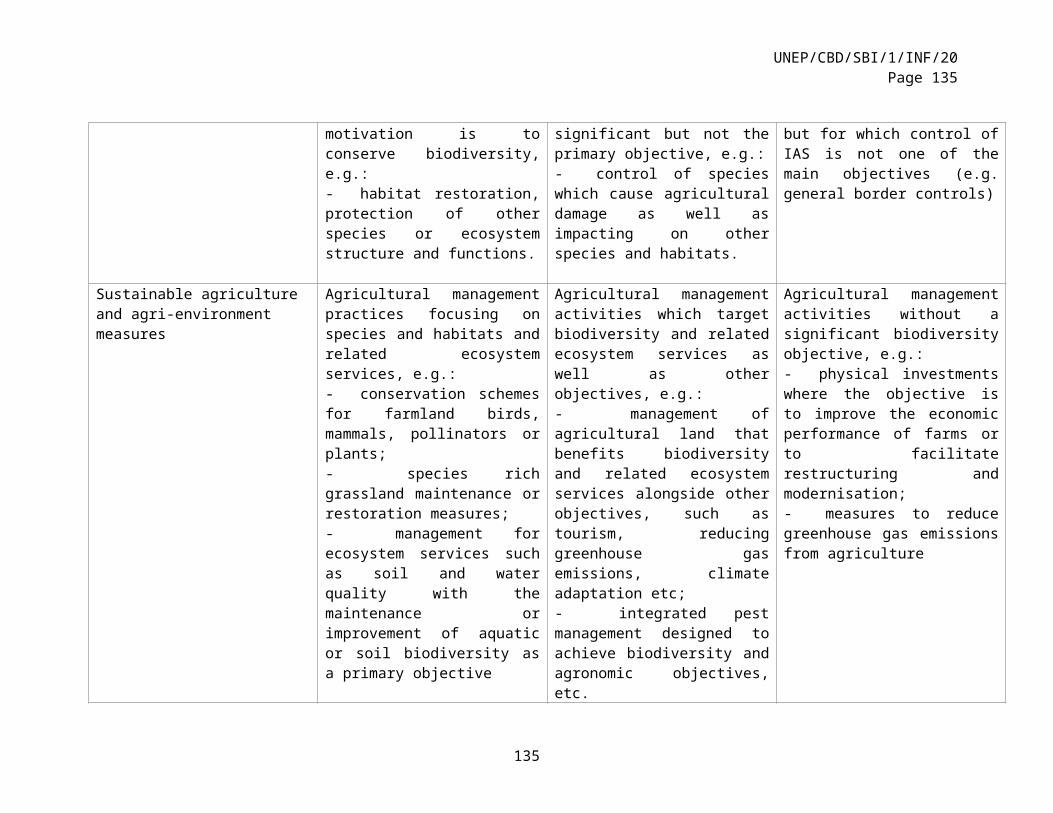
UNEP/CBD/SBI/1/INF/20Page 135
(SEMARNAT)
Ms. Paola Ivanova Diaz Allen
Intern, Deputy General Direction of Multilateral Environmental Agreements
Secretariat of Environment and Natural Resources (SEMARNAT)
Mexico [email protected]
Ms. Mireille Linares Valencia
Deputy Director of the Deputy General Direction of Multilateral Environmental Agreements
Secretariat of Environment and Natural Resources (SEMARNAT)
Mexico [email protected]
Mr. Oscar Cartes Representative of the Secretariat of Finance and Public Credit
Secretariat of Finance and Public Credit (SHCP)
Mr. Omar Ayala Representative of the General Direction of Global Issues
Secretariat of Foreign Affairs (SRE)
Mr. Edgar Gonzalez Director of Sustainable Development Programmes
United Nations Development Programme (UNDP)
COP 13 ORGANIZING TEAMMr. Victor
LichtingerCOP 13 Organizing Team
Mexico [email protected]
Mr. Luis A. Villaneuva
Senior Negotiator COP 13 Organizing Team
Mexico [email protected]
Ms. Diana Ponce Nava
COP 13 Organizing Team
Mexico diana.poncenava@cop13 cbd.org
Ms. Emilia Blancarte Jaber
COP 13 Organizing Team
Mexico [email protected]
Ms. Monica Alvarez Malvido
COP 13 Organizing Team
Mexico [email protected]
CBD SECRETARIATMr. Ravi Sharma Principal Officer CBD Secretariat [email protected]
Mr. Markus Lehmann
Economist CBD Secretariat [email protected]
Ms. Lydia Zemke Staff Assistant CBD Secretariat [email protected]
135
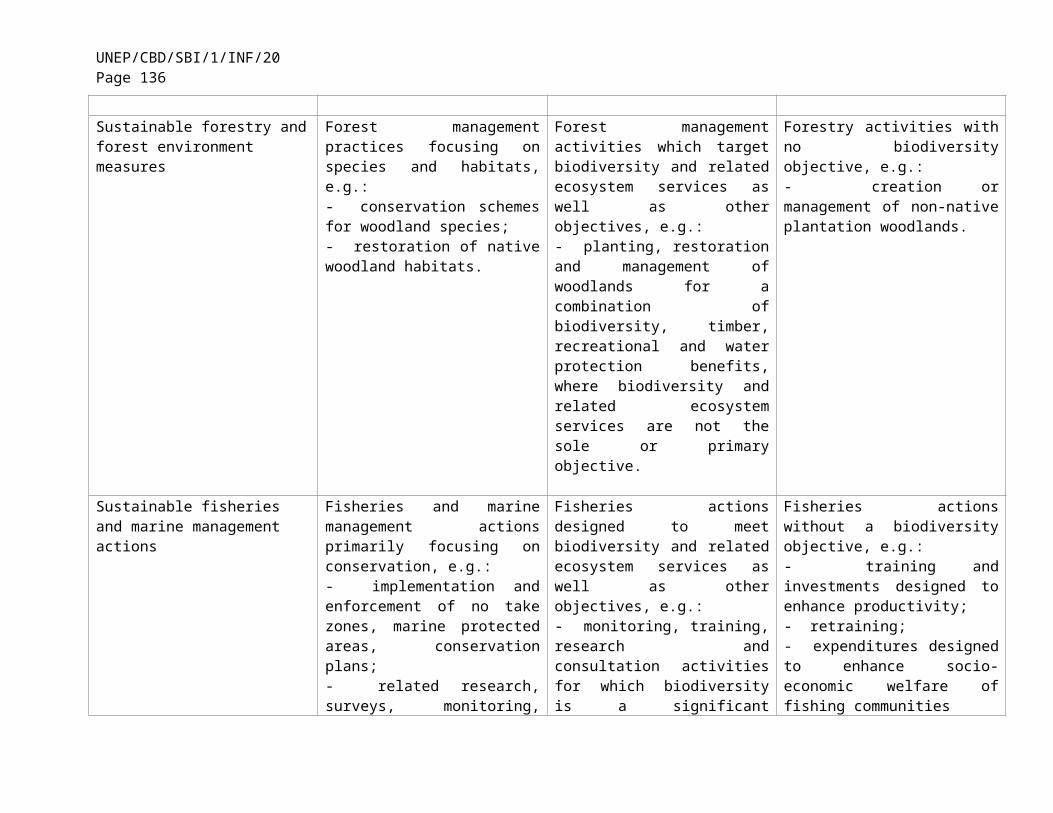
UNEP/CBD/SBI/1/INF/20Page 136
Annex IV
Workshop evaluation
17 workshop evaluation questionnaires were completed;
77% of respondents rated the usefulness of the workshop as high (48%) or very high (29%);
Participants appreciated the opportunity to exchange experiences in developing and applying methodologies for biodiversity finance, in particular country case examples
Many participants mentioned that more should have been allocated for discussions and interactions.
The majority of participants were satisfied with the overall logistical organization of the workshop (88%) and the venue and its facilities (88%).
The survey indicated that participants had gained knowledge on:
Ways and means to further improving biodiversity finance methodologies;
Defining biodiversity related expenditures;
Assigning coefficients to biodiversity related expenditures;
Costing NBSAPs;
BIOFIN methodology; and
Collective action in the reporting framework.
Suggestions for improvements include:
More time for discussions and interactions;
Clearer instructions for break out groups to ensure discussions contribute to specific outcomes of the workshop;
Less topics and invite more experts;
Improve logistics for participants presenting virtually;
Invite more government representatives for greater insight into national case studies; and
Less presentations; more focused and targeted presentations.
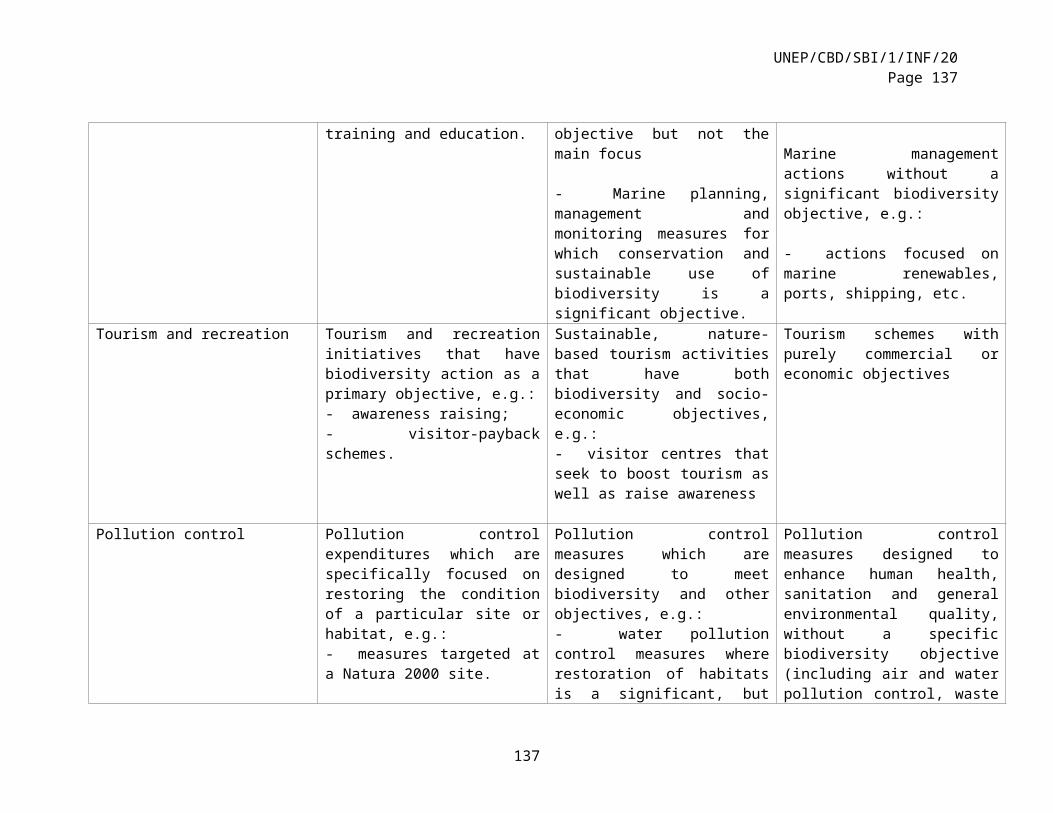
UNEP/CBD/SBI/1/INF/20Page 137
137
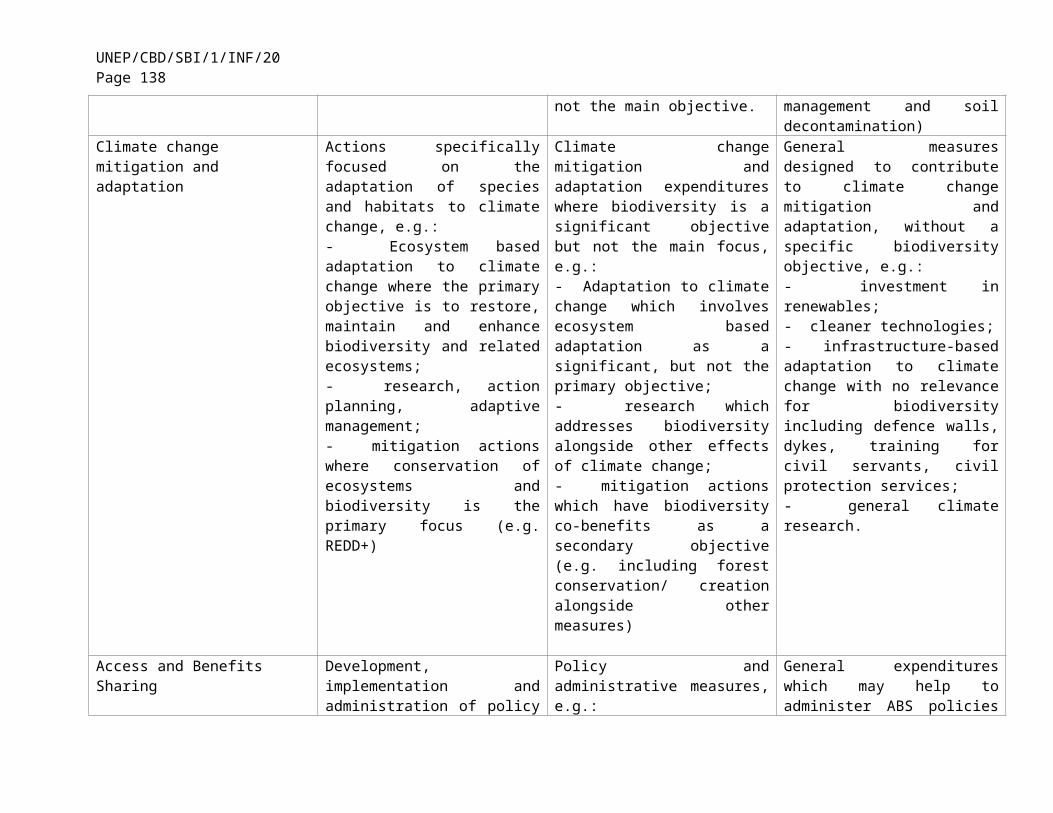
UNEP/CBD/SBI/1/INF/20Page 138
Workshop Survey Results
Questions
1
Very low
2
Low
3
Average
4
High
5
Very high
Comments
How do you rate the overall usefulness of the workshop?
23%
47%
29%
Yes. It’s an eye opener; challenge for those countries not fully complied with BIOFIN.
I think it was useful, but more discussion time would have been more rewarding.
In your opinion, was enough time allowed for discussion and interaction?
6%
18%
23%
23%
29%
More exchange would have been good.
Each participant was given opportunity to participate.
More interactive work could have been helpful.
No, I think there were too many presentations and very little time for discussions.
I would suggest less presentations and more time for discussions on relevant issues
Did you consider the daily time schedule to be appropriate?
12%
6%
18%
35%
29%
Good thought working late reduced time of social interaction.
I would allocate much less time for presentations.
Please rate your satisfaction on the overall logistical organization of the workshop?
6%
6%47%
41%
Communication was good and on time. However, participants connecting flight should have been paid for days lost while connecting.
Please rate your satisfaction on the venue and its facilities?
12%
29%
59%
Too cold first day.
Being at CBD enabled easy access though language barrier was the biggest challenge,
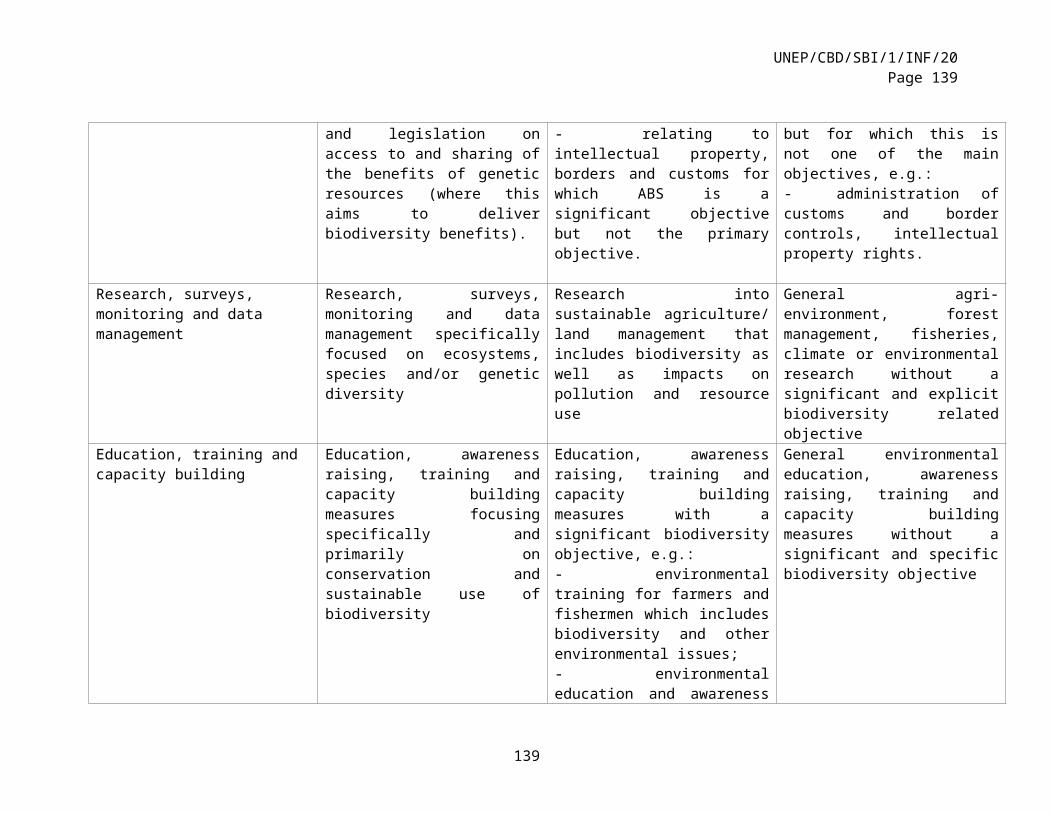
UNEP/CBD/SBI/1/INF/20Page 139
Please describe one main thing that you have experienced or learned here in the workshop that will be particularly helpful in your work.
Collective action in the reporting framework.
For greater understanding of formal reporting requirements, how BIOFIN can support this.
The biodiversity expenditure review approach of BIOFIN.
Too many topics and participants with too many different backgrounds. This made difficult to read consensus.
Revising of NBSAPs need to be fast-tracked to enhance implementation of BIOFIN framework.
Exchange of views on further improving biodiversity finance methodologies was helpful; really appreciated the country case studies.
Clarified the discussions on costing.
It is difficult to sit at a table with people with such different backgrounds and agree on topics.
It is very helpful in my work, because I need to implement the NBSAP and NP and organize some meetings on NBSAP implementation in our country.
Great set of presentations and discussions which provide useful inputs into future work of my organization’s approaches on coefficients.
All presentations were very interesting and helpful. The BIOFIN initiative will be particularly helpful in our work.
Shared experiences and methodologies relevant to the subject of the meeting. Defined biodiversity relevant expenditures, assigning coefficients, costing NBSAPs.
Definition of biodiversity-related investments, Rio markers.
Is there anything that we could have done differently to enhance the usefulness of the workshop?
Professional and structured facilitation; fewer presentations, more focused and targeted presentations; time limit on presentations; skype presentations were awful.
Less topics, more specialists.
Skype conferences suffered from bad acoustic quality.
All presentations should have been emailed a day before to enable all participants being at same pace with presenters. However, some presentations were carried out too hurried.
Leave more space for interaction, more guided break out groups with clear request for output.
I think they should have been more clear instructions and outputs for the groups to discuss. Limit the amount of presentations (some of them were already reflected in the working document).
139
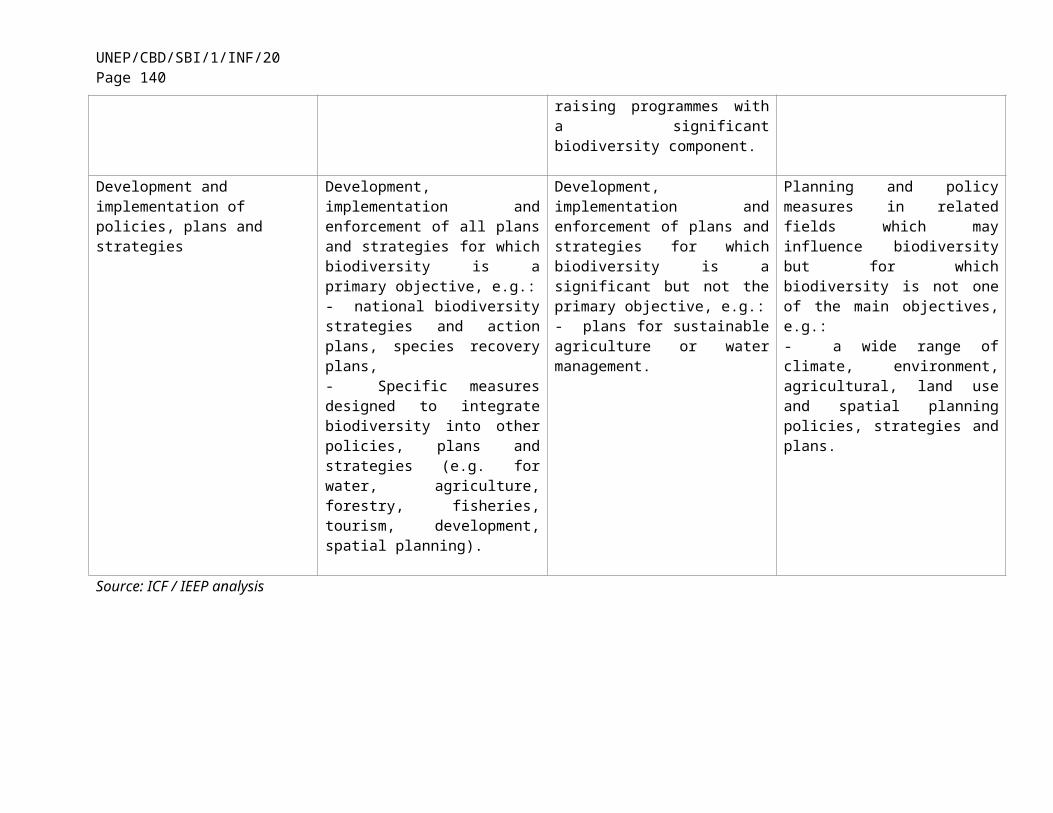
UNEP/CBD/SBI/1/INF/20Page 140
More discussion time and debate.
Break out group discussions could have been more focused with specific discussion questions related to outcomes needed for the workshop.
Reduce number of matters or give more time to discuss them.
More countries involved e.g. additional participants from ASEAN countries to bring in additional presentations.
__________