Embed Size (px)
Citation preview

/…
In order to minimize the environmental impacts of the Secretariat’s processes, and to contribute to the Secretary-General’s initiative for a C-Neutral UN, this document is printed in limited numbers. Delegates are kindly requested to bring their copies to meetings and not to request additional copies.
CBD
Distr. GENERAL UNEP/CBD/AHTEG-SP-Ind/1/INF/2 20 May 2011 ORIGINAL: ENGLISH
AD HOC TECHNICAL EXPERT GROUP MEETING ON INDICATORS FOR THE STRATEGIC PLAN FOR BIODIVERSITY 2011-2020
High Wycombe, United Kingdom, 20-24 June 2011
NATIONAL INDICATORS, MONITORING AND REPORTING FOR GLOBAL BIODIVERSITY TARGETS
Information note by the Executive Secretary
1. The Executive Secretary is pleased to circulate herewith, for the information of participants in the meeting of the Ad Hoc Technical Expert Group on Indicators for the Strategic Plan for Biodiversity 2011-2020, an information document entitled “National indicators, monitoring and reporting for global biodiversity targets” submitted by the Department of the Environment, Food and Rural Affairs of the United Kingdom of Great Britain and Northern Ireland.
2. The document is being circulated in the form and language in which it was provided to the Secretariat.

NATIONAL INDICATORS, MONITORING AND REPORTING FOR THE STRATEGIC PLAN FOR BIODIVERSITY 20112020
A REVIEW OF EXPERIENCE AND RECOMMENDATIONS IN SUPPORT OF THE CBD AD HOC TECHNICAL EXPERT
GROUP (AHTEG) ON INDICATORS FOR THE STRATEGIC PLAN 20112020
Prepared by Philip Bubb, Anna Chenery, Peter Herkenrath, Val Kapos, Abisha Mapendembe, Damon Stanwell‐Smith, Matt Walpole
A Report by UNEP‐WCMC with IUCN and ECNC for the UK Department for Environment Food and Rural Affairs (Defra).
Project “National indicators, monitoring and reporting for CBD targets”. Project code CR 0495

CONTENTS
Executive Summary ................................................................................................................................... 2
1. Introduction ......................................................................................................................................... 8
2. Policy Background ................................................................................................................................ 9
3. Scientific Background ......................................................................................................................... 11
4. Methods ............................................................................................................................................. 14
1. Results ................................................................................................................................................ 18
National and regional experience in the development and use of indicators for biodiversity .......... 18
How many countries are producing national indicators relevant for implementing the CBD? ..... 18
How are national indicators relevant to the CBD produced? ......................................................... 19
Which national indicators are being produced, in relation to the CBD 2010 Target and the Aichi
Biodiversity Targets? ...................................................................................................................... 23
How often are national indicators for biodiversity produced? ...................................................... 33
Why are national indicators produced? ......................................................................................... 34
Why and how are regional biodiversity indicators produced? ....................................................... 38
6. Constraints in developing biodiversity targets and indicators, and associated monitoring and
reporting systems ................................................................................................................................... 46
7. Options to support Parties in developing targets and indicators, and associated monitoring and
reporting, for implementation of the 2011‐2020 Strategic Plan ............................................................ 53
8. Strengthening the linkages between global, regional and national indicator development and
reporting ................................................................................................................................................. 58
9. Conclusions ........................................................................................................................................ 63
10. Recommendations ........................................................................................................................... 66
Annexes ................................................................................................................................................... 69
Annex 1. The Biodiversity Indicator Development Framework .......................................................... 69
Annex 2. European monitoring networks relevant to biodiversity .................................................... 70
Annex 3. Biodiversity information institutions and indicator reports ................................................ 71
Annex 4. Conceptual and knowledge issues in measuring national and regional implementation of
Aichi Targets 1 to 19 ........................................................................................................................... 74
Table 1: The framework of provisional indicators for assessing progress at the global level towards the
CBD 2010 Target (CBD decision VII/30) .................................................................................................. 96
Table 2: The framework for the 2020 Aichi Nagoya Targets (abbreviated text – see Annex 4 for the full
text) ......................................................................................................................................................... 97

2
EXECUTIVE SUMMARY Note: This summary of the report should be read in conjunction with the recommendations for the 2011 AHTEG on indicators in Section 10.
Aims
The Convention on Biological Diversity (CBD) process for the development of global indicators, and the provision of advice to Parties on national and regional indicators and relevant capacity, is being taken forward by an Ad Hoc Technical Expert Group (AHTEG) on Indicators for the Strategic Plan for Biodiversity 2011‐2020. The AHTEG will meet in June 2011 and report to SBSTTA1‐15. This report aims to provide an evidence base and draft recommendations to support the AHTEG to meet the following two components of its terms of reference:
(a) Develop further guidance and propose options for the establishment of mechanisms to support Parties in their efforts to develop national indicators and associated biodiversity monitoring and reporting systems, in support of setting of targets, according to national priorities and capacities, and monitoring of progress towards them;
(b) Provide advice on the strengthening of linkages between global and national indicator development and reporting.
Methods
The evidence base for this report is compiled principally from three sources:
a) An analysis of the existence of indicators in CBD 4th national reports. Where indicators were found with data they were categorised as ‘evidenced’ indicators, and if there was only a reference to an indicator or biodiversity data but there was no data in the report they were categorised as ‘non‐evidenced’ indicators. This provided information on the subjects which countries have indicators for, particularly in relation to the CBD 2010 Biodiversity Target global indicator framework, and a broad picture of capacity for producing indicators.
b) An online questionnaire distributed with the aid of the Secretariat of the CBD and IUCN to national agencies responsible for biodiversity information and reporting, to obtain information on how national indicators relevant to implementation of the CBD were produced, who was involved, their use, how they were assessed, and constraints.
c) The experiences of UNEP‐WCMC in its capacity building for national biodiversity indicators development, particularly with the 2010 Biodiversity Indicators Partnership (BIP)2. This includes evidence from regional capacity building workshops involving a total of 45 countries, and provided information on current capacity and challenges for producing indicators for biodiversity, and what is required to progress their development.
Results
How many countries are producing indicators for biodiversity?
By March 2011 4th national reports had been submitted to the Secretariat of the CBD by 159 (83%) of the 193 Parties to the CBD, of which 121 (76%) had reported or referenced at least one indicator for biodiversity in their report, but only 58 (36%) included evidenced indicators (i.e. with data or figures) in their report. It is likely though, that many countries have additional relevant information that was either not readily available for use in the national reports, or could have been obtained from sectors such as forestry and fisheries which may not always be seen as sources of biodiversity‐relevant information.
1 Subsidiary Body on Scientific, Technical and Technological Advice 2 www.bipindicators.net

3
Thus, the results of the analysis of the 4th national reports should be seen as a minimum view of the current national situation and capacity for indicators for biodiversity.
Of a total of 134 respondents to the on‐line survey, representing 65 countries, 56% said that their country did have indicators relevant to implementation of the CBD, and these respondents represented 35 countries. 20% of respondents said that their country did not have relevant national indicators, and 24% said that they didn’t know.
How are indicators for biodiversity produced?
Over 80% of the on‐line survey respondents stated that their Environment Ministry is involved in the production of national indicators for implementation of the CBD. One or more of government biodiversity offices, national statistics offices, NGOs and academic bodies were involved in the production of their national indicators according to about 50% of respondents. From the experience of the Biodiversity Indicators Partnership capacity building workshops, a key factor in a countries’ capacity to produce indicators for biodiversity over time is whether or not there is a national office or institution with the responsibility for the co‐ordination, analysis and communication of biodiversity information.
Most of the countries that have established national indicators and reporting systems in support of their implementation of the CBD also have developed economies, as well as strong academic and voluntary sectors that assist the collection and use of science‐based information in decision‐making. However, there are a few developing countries where NGOs and academic institutions have led the establishment of national biodiversity monitoring, information management and reporting, such as MUIENR3 in Uganda, and Namibia Nature Foundation, or where government biodiversity information institutes have been established, such as the South African National Biodiversity Institute, and CONABIO4 in Mexico.
National indicator for biodiversity production is often most successful when there is collaboration between different government bodies, NGOs and academic institutes. This can include national statistical offices, which provide additional credibility, capacity and cross‐government profile and demand for the indicators.
Data sources for indicators for biodiversity
The on‐line survey respondents stated that the commonest data source for indicators is to adapt data from monitoring and reporting systems that have been designed for other purposes, which reflects both a lack of biodiversity‐specific monitoring systems and that biodiversity is a broad concept for which many relevant issues or sectors, such as forestry, can provide data. Data from surveys and assessments was the second commonest source for indicators. This data type may or may not provide trend data, and may not be entirely suitable for use for a specific indicator. The third commonest data source is academic research, which only in some cases may provide long‐term data sets, may be restricted to sub‐national scale analysis, and may not be designed to address questions or objectives that national indicators would be designed for. The fourth commonest source is data from monitoring systems developed for the indicators, which may be the ideal if resources are available to maintain the system. Data for national indicators from regional or global data sources was the least common source.
Which national indicators for biodiversity are being produced?
The analysis of indicators in 4th national reports related to the CBD 2010 global indicator categories found that ‘Coverage of protected areas’ is by far the commonest indicator which most CBD Parties can produce, as reported by a total of 91 Parties. The second most reported indicator, by 50 countries, is ‘Extent of forests and forest types’, although many more countries will have such data for reporting to the FAO Forest Resource Assessment. The third most frequent indicator in CBD 4th national reports is ‘Invasive alien species’, found with evidence (data) as an indicator in 9 reports, and references without evidence in 32 reports. Aggregation of the indicators found to the level of Focal Area of the CBD 2010 Target Framework found that over 100 Parties have at least some data on aspects of the status and trends of the components of biodiversity. Some indicators or relevant data on sustainable use, threats to
3 Makerere University Institute of Environment & Natural Resources 4 National Commission for the Knowledge and Use of Biodiversity

4
biodiversity, and ecosystem integrity is provided by at least 40 Parties. Only about 15 Parties include some indicators or information on status of traditional knowledge, innovations and practices, or resource transfers, in their 4th national reports to the CBD.
Indicators in CBD 4th national reports relevant to the Aichi Targets
An assessment of the number of indicators in CBD 4th national reports considered to be of relevance to each of the Aichi Targets found:
Target 14 (Essential ecosystem services) has the most evidenced and non‐evidenced indicators. This is probably because the concept and definition of ecosystem services is very broad, covering supporting, provisioning, regulating and cultural services, and so many different measures or indicators are relevant.
Target 5 (loss of habitats) has the second largest total, with 88 relevant evidenced and non‐evidenced indicators, which is likely to be predominantly for forest coverage, but includes other types of habitats and ecosystems.
Four other Targets have over 50 potentially relevant evidenced and non‐evidenced national indicators and so it could be considered as likely that some national indicators can be developed for them. These Targets are 4 (Use of natural resources), 7 (Areas under sustainable management), 11 (Protected areas), and 15 (Biodiversity and carbon stocks).
Target 6 (Sustainable fisheries) has 28 potentially relevant evidenced and non‐evidenced national indicators, and there would appear to be a good likelihood of some national indicators being possible for this Target.
Target 8 (Pollution) and Target 12 (Preventing extinctions) have only 5 and 4 relevant indicators evidenced in 4th national reports, although they have respectively 32 and 31 non‐evidenced national indicators, which may signify that few Parties have suitable data sets, or there is a lack of capacity for reporting on these subjects, or these are low priority issues for Parties.
Six of the Aichi Targets had 6 or fewer evidenced and non‐evidenced national indicators in CBD 4th national reports, and so may require new investments to identify and produce suitable indicators. These six Targets are:
3 (Incentives and subsidies that harm or promote biodiversity)
13 (Agricultural biodiversity)
16 (Access and Benefit Sharing implementation)
18 (Traditional knowledge)
19 (Biodiversity knowledge)
20 (Resources in support of the Convention)
Examination of CBD 4th national reports regarding Target 17 (NBSAPs) may perhaps be best considered in terms of existence or not of NBSAPs, and to date 173 Parties have developed NBSAPs.
Uses of national indicators for biodiversity
The on‐line survey asked, “What was the main reason for the choice of indicators for CBD implementation and reporting?” For about 30% of the 56 respondents, representing 35 countries, ‘For CBD goals and targets’ was their main reason. For 50% of respondents specific national objectives and targets or broad topics of national importance have been the main reason, rather than for CBD goals and targets. For 10% of respondents the reality of which indicators are actually produced was mostly determined by the existence and accessibility of suitable data.

5
Also, from the on‐line survey, the most common uses of national indicators are for government policy‐making and implementation, and for state‐of‐the environment reports or other assessments. Two other common uses are for reporting on progress for national government commitments, and reporting on progress to international agreements. The use of indicators for awareness raising and advocacy about biodiversity issues was much less commonly reported.
Regional indicators for biodiversity
A review of regional initiatives to produce indicators for biodiversity found that the SEBI5, CBMP6 and NordBio7 initiatives mostly produce biodiversity indicators in response to regional needs and decision processes. As a result, countries tend produce their own indicators in response to national management objectives and targets, with limited linkages to the regional process. The PROMEBIO in Central America is designed to promote standardisation and sharing of national indicator production to enable a regional perspective and actions.
Constraints in developing biodiversity targets, indicators and monitoring
A recent assessment of NBSAPs8 found that only about ten CBD Parties have time‐bound and measurable targets in their NBSAPs, although the authors considered that more countries probably have some targets for protected areas coverage at least. The results of the on‐line survey for this report identified constraints to national target setting to included lack of political will, lack of data, and difficulty in consultation and negotiation with other sectors and stakeholders.
The lack of suitable data for indicators, including the inaccessibility of existing data, is probably the most widespread problem for the calculation of indicators for biodiversity, followed by a lack of technical and institutional capacity, and lack of funding. Many developing countries, in particular, report a lack of funding, and without additional international and national funds many Parties will not be able to establish the necessary indicator, monitoring and reporting systems for their implementation of the Strategic Plan for Biodiversity 2011‐2020. However, this situation is linked to the often reported constraint of, “insufficient demand from government for such indicators”, with very little awareness or use of biodiversity indicators at all levels of government and society in some countries. Whilst the lack of suitable data for desired indicators is widespread, and requires new investment, it seems that in most countries at least some useful new indicators can be produced from reinterpretation of existing data.
In some countries, including many European countries, there are monitoring schemes to gather data for indicators for biodiversity, but the evidence from 4th national reports to the CBD is that most countries do not have such schemes. A difficulty appears to be that where indicators for biodiversity are not produced it is difficult to demonstrate the value of such indicators for decision‐making, and so it can be difficult to obtain funding for the monitoring to supply the data for the indicators.
A challenge for the national adaptation of the Aichi Targets and identification of possible indicators is that many of the targets include multiple and complex issues. As a support for the definition of national targets and indicators, Annex 4 of this report includes an outline for each Aichi Target of the conceptual and knowledge issues that are likely to be encountered in setting and measuring the target at national level. The potentially relevant indicators to each target identified with evidence of their existence in 4th national reports to the CBD are also listed.
Options to support Parties in developing targets, indicators, monitoring and reporting
The on‐line survey for this report found the following six options were given similar levels of importance in response to the question, “In addition to increased funding, what are the most important ways
5 Streamlining European Biodiversity Indicators 6 Circumpolar Biodiversity Monitoring Programme 7 Nordic Biodiversity Indicators 8 Prip, C; Gross, T; Johnston, S; Vierros, M (2010). Biodiversity Planning: an assessment of national biodiversity
strategies and action plans. United Nations University Institute of Advanced Studies, Yokohama, Japan.
6
international assistance could support developing CBD targets, indicators, and associated monitoring and reporting?”:
In‐country capacity building workshops etc. for the process of developing targets and indicators;
Website with guidance, reference materials, examples of indicator methods and uses, etc.
Regional capacity‐building and exchange workshops;
Technical assistance for indicators for specific biodiversity targets;
Printed guidance and examples on developing data and gathering (monitoring) and indicator reporting systems;
Printed guidance on the Aichi Targets and possible indicators.
Strengthening the linkages between global, regional and national indicator development
The CBD headline global indicators are rarely used at the national scale, and one reason for the weak linkages between global and national biodiversity indicators is that they are often intended for different users and purposes.
Harmonising global‐regional‐national indicator use will aid assessments of progress towards targets, particularly at broader scales. The more consistent the regional and national targets are to the global targets, the easier it will be to promote consistency in indicators across scales. However, it is difficult to ensure national level consistency, even for relatively mature processes, and even with significant investment many gaps remain. Global indicators are often driven by international agencies investing in and/or co‐ordinating data collection or modelling/extrapolating from limited national‐level data.
Parties are more likely to develop and use indicators where they own the process and perceive a benefit to themselves. The fulfilment of reporting requirements for global processes is unlikely to be a sufficient rationale to develop indicators if relevant national datasets and monitoring/reporting initiatives do not already exist.
Recommendations for the 2011 AHTEG on indicators
The recommendations for the 2011 AHTEG on indicators that arise from the findings of this report are presented in Section 10.

7
Acknowledgements
This report is for the UK Department for Environment Food and Rural Affairs (Defra) Project “National indicators, monitoring and reporting for CBD targets”, project code CR 0495.
The authors would like to thank the Project Steering Group for their guidance and decisions on the scope and structure of the report, the design of the on‐line survey, and their review and comments on the first and second drafts of the report. The members of the Steering Group are:
Andrew Stott, Defra ‐ Chair
Anna Delgado – Defra
Robert Höft – CBD Secretariat
Anne Teller – DG ENV, EC
James Williams – Joint Nature Conservation Committee
Josephine Langley, Network Co‐ordinator, IUCN, and other members of IUCN provided valuable comments on the design of the on‐line survey, distributed the on‐line survey through IUCN networks, and provided detailed comments on the first draft of the report.
Amor Torre‐Marin of the European Centre for Nature Conservation provided information on the European Streamlining 2010 Biodiversity Indicators initiative and European experience in producing biodiversity indicators.
We are very grateful to the CBD Secretariat for translation of the on‐line survey to French and Spanish, and for its distribution through their networks.
Pradyumna Rana, as a volunteer at UNEP‐WCMC, reviewed many of the CBD fourth national reports for indicators.
Greg Tomlinson, as a volunteer at UNEP‐WCMC, compiled the on‐line survey results and produced a preliminary analysis.
Siobhan Kenney, UNEP‐WCMC, improved many of the report’s graphics and produced its layout.
We are very grateful to the respondents around the world to the on‐line survey for their contribution of information and experience.
Citation
Bubb, P., Chenery, A., Herkenrath, P., Kapos, V., Mapendembe, A., Stanwell‐Smith, D., and Walpole,
M. (2011) National Indicators, Monitoring and Reporting for the Strategy for Biodiversity 2011‐2020.
UNEP‐WCMC: Cambridge, UK.
Contact:
Philip Bubb, Senior Programme Officer, Ecosystem Assessment Programme UNEP‐WCMC, 219 Huntingdon Road, Cambridge CB3 0DL, UK Tel. +44 1223 277314 Email: philip.bubb@unep‐wcmc.org
8
1. INTRODUCTION
Aims and objectives of the report
The CBD process for the development of global indicators and the provision of advice to Parties on national and regional indicators and relevant capacity is being taken forward by an Ad Hoc Technical Expert Group (AHTEG) on Indicators for the Strategic Plan for Biodiversity 2011‐2020. This AHTEG will meet in June 2011, and will report to SBSTTA‐15. This report aims to support the AHTEG to meet the following two components of its terms of reference:
(a) Develop further guidance and propose options for the establishment of mechanisms to support Parties in their efforts to develop national indicators and associated biodiversity monitoring and reporting systems, in support of setting of targets, according to national priorities and capacities, and monitoring of progress towards them;
(b) Provide advice on the strengthening of linkages between global and national indicator development and reporting.
This report was commissioned by the UK Department for Food and Rural Affairs (Defra) in support of the CBD Ad Hoc Technical Expert Group (AHTEG) on Indicators for the Strategic Plan 2011‐2020, June 2011. It aims to review the experience of development and use of indicators for the CBD Strategic Plan 2002‐2010 at national and regional levels, and to assess the availability and suitability of information to support development of new indicators, and provide recommendations for assessment and reporting of the Aichi Targets for 2020 agreed at CBD COP10 in Nagoya.
The objectives of the report are:
(1) to review experience of the development and use of indicators, and associated biodiversity monitoring and reporting systems, at national and regional levels in the context of the global framework of goals and targets for 2010;
(2) to identify key constraints, including data availability, and options for establishing mechanisms to further support Parties in developing targets and indicators, and associated monitoring and reporting, as a contribution to national and regional level implementation of the Strategic Plan for Biodiversity 2011‐2020;
(3) to identify possible approaches and methodologies for strengthening the linkages between global, regional and national indicator development and reporting, including the role of 5th and 6th national reports to the CBD.
Use and scope of the report
The report is principally designed to support the preparations and discussions of the AHTEG on indicators and it may also be useful as part of the supporting evidence for the recommendations of the AHTEG and their consideration by SBSTTA and COP.
The scope of this report is principally on the process aspects of the development and use of indicators, rather than the technical aspects of particular indicators. Whilst the report is predominantly concerning the indicators it also addresses the monitoring (data collection) and reporting processes that are necessary for their production.
This report has compiled an evidence base for the existence of national and regional indicators in relation to the 2010 Biodiversity Target, and whether these might be relevant to the new Aichi Targets, but it does not aim to identify which indicators might be needed or suitable for the Aichi Targets. Similarly, the report does not consider the specific data needs and sources for possible indicators for the Aichi Targets. The latter subject is addressed by the GEO‐BON report “Adequacy of Existing Biodiversity Observation Systems to support the CBD 2020 Targets”, which is also designed to support the 2011 AHTEG on indicators.
9
2. POLICY BACKGROUND
CBD Decisions
The major international policy context for this project is the Strategic Plan for Biodiversity 2011 to 2020, which was adopted at COP‐10 in October 2010, and includes twenty headline targets for 2020 (the Aichi Targets), organised under five strategic goals (UNEP/CBD/COP/10/X/2, and see Table 2 and Annex 3 of this report). The COP‐10 Decision urges Parties to develop national and regional targets using the Strategic Plan as a flexible framework, and the targets are to be integrated into updated and revised national biodiversity strategies and action plans (NBSAPs) and regional biodiversity strategies.
Parties are to report on their progress in developing national and regional targets towards the global targets, as well as the technical rationales and suggested milestones and indicators (UNEP/CBD/COP/10/9) at COP‐11. Fifth national reports to the CBD are due by 31 March 2014, and will report on implementation of the Strategic Plan for Biodiversity 2011‐2020. The reports are requested to include indicators where possible and feasible, including application, as appropriate, of global headline indicators contained in decision VIII/15 and additional indicators that may be adopted at COp‐11 for measuring progress towards the Aichi Targets.
A central part of the new CBD Strategic Plan at global, regional and national levels is the development and use of indicators to monitor and review its implementation. A set of global indicators for the Strategic Plan and its targets will be developed as a flexible framework for Parties to report to the COP in their 5th and 6th national reports. Equally, COP‐10 recognised the need for, “supporting national and regional efforts to establish or strengthen biodiversity monitoring and reporting systems to enable Parties to set their own targets and assess progress towards biodiversity targets established at national and/or regional level”, (UNEP/CBD/COP/DEC/X/7).
The 2010 Biodiversity Target, indicators development and reporting
T1he Strategic Plan for Biodiversity 2011‐2020 builds on the progress of the CBD Strategic Plan 2002‐2010, which included for the first time a global biodiversity target, “to achieve by 2010 a significant reduction of the current rate of biodiversity loss at the global, regional and national level as a contribution to poverty alleviation and to the benefit of all life on Earth.” In 2004, in decision VII/30, the COP adopted a framework of global indicators to, “facilitate the assessment of progress towards achieving the 2010 Biodiversity Target and communication of this assessment, to promote coherence among the programmes of work of the Convention and to provide a flexible framework within which national and regional targets may be set, and indicators identified.” The framework was further refined in CBD decision VIII/15, and includes seven focal areas and fifteen global headline indicators for assessing progress toward the 2010 target, and communicating related key messages (see Table 1).
A provisional CBD global 2010 Target indicators framework was developed by an AHTEG on indicators in October 2004. The work of the AHTEG was prepared by an electronic discussion forum in which a series of task forces commented on possible indicators. The AHTEG meeting was preceded by a Liaison Group meeting (Montreal, 18 October 2004) in which representatives of possible lead organizations on individual indicators discussed strategies for supporting the process. The purpose of the AHTEG was, “to assist the Subsidiary Body on Scientific, Technical and Technological Advice (SBSTTA) in identifying or developing indicators for assessing progress at the global level towards the 2010 target, and communicating effectively trends in biodiversity related to the three objectives of the Convention.”9. It should be noted that the development of indicators was for assessing progress at the global level, and the AHTEG had received the following guidance from the COP on the characteristics of the indicators to be identified or developed:
9 UNEP/CBD/SBSTTA/10/INF/7 http://www.cbd.int/doc/?mtg=TEGIND‐01

10
a) The indicators should not be used to evaluate the level of implementation of the Convention in individual Parties or regions;
b) The same indicators may be used at the global, regional, national and local levels; c) The indicators should relate to one or more of the various programmes of work of the
Convention; d) The indicators should take into consideration relevant Millennium Development Goals and
indicators developed by other relevant international processes; e) Existing data sets should be used.
One of the challenges identified in 2004 for using the CBD global indicators for reporting on the 2010 Biodiversity Target was that the existing indicators were developed and reported by a range of organisations, and there was no single mechanism for coordinating input to the CBD or identifying the key messages from the indicators as a suite. Another challenge was that the global indicators identified were at different stages of development and implementation. In some cases the indicators needed little additional work to develop and use them, in other cases there was significant work required to develop the indicator methodology and/or the underlying datasets. Consequently, the 2010 Biodiversity Indicators Partnership (2010 BIP) was established to address these challenges. It held its first meeting in 2005, and in 2007 a GEF Full‐sized Project for the 2010 BIP was approved. The Partnership brought together over 45 organizations working on indicator development, with the objectives of:
1. To generate information on biodiversity trends which is useful to decision makers;
2. To ensure improved global biodiversity indicators are implemented and available;
3. To establish links between biodiversity initiatives at the regional and national levels to enable capacity building and improve the delivery of the biodiversity indicators.
A full report of the outputs, experiences and lessons learnt from the 2010 BIP is available in CBD Technical Series No. 5310, and in all UN languages at www.bipindicators.net, with further information and resources for national biodiversity indicator development at www.bipnational.net
CBD and 2010 Biodiversity Target reporting
At the global scale the principal report on progress to reach the 2010 Biodiversity Target was ‘Global Biodiversity Outlook 3’11, produced by the CBD Secretariat with data and analysed provided by the 2010 BIP. At the national scale, Parties were requested to submit their 4th national reportsto the CBD by 30th March 2009, although reports continue to be submitted in 2011. The guidance for these reports on the use of indicators states, “In decision VII/5, the COP urged Parties to develop a set of biodiversity indicators as part of their national biodiversity strategies and action plans, taking into account the guidance, lessons learned and list of indicators provided in the note by the Executive Secretary prepared for the ninth meeting of the SBSTTA (UNEP/CBD/SBSTTA/9/10). The COP also recognized a set of indicators to assess progress at the global level towards the 2010 target, and to effectively communicate trends in biodiversity related to the three objectives of the Convention (decisions VII/30 and VIII/15), and has suggested that the same indicators may be used at the global, regional, national and local levels, where so desired by Parties.” As well as encouraging the use of indicators in the reports Parties were invited to include an optional Appendix IV of the national indicators used in the report.
10 https://www.cbd.int/doc/publications/cbd‐ts‐53‐en.pdf 11 Secretariat of the Convention on Biological Diversity (2010) Global Biodiversity Outlook 3. Montréal, 94 pages.

11
3. SCIENTIFIC BACKGROUND
This section of the report provides a brief overview of some of the scientific and technical issues in developing and using national and regional biodiversity indicators. It is largely based on the experience of UNEP‐WCMC in supporting biodiversity indicator development, including as part of the Biodiversity Indicators Partnership (BIP).
Definitions of indicators
The basic definition of an indicator used in the capacity building work of the BIP is, “a measure based on verifiable data that conveys information about more than itself”. A key aspect of this definition is that the data conveys information about more than itself. This means that indicators are purpose‐dependent ‐ the interpretation or meaning given to the data being used as an indicator depends on the purpose or issue of concern. Ideally, a measure or data set that is used as indicator should be presented with a definition of its purpose.
Biodiversity indicators can be simple measures, such as estimates of the population of a particular species over time, or more complex indices that combine several data sets into one value. Indicators are commonly presented as graphs, but other forms such as pie charts and maps can also be effective means of presentation.
The general term ‘biodiversity indicators’ has tended to be used to cover more than direct measures of biodiversity itself, such as species populations and extent of habitats. The term is also often used to cover indicators regarding actions to ensure biodiversity conservation and sustainable use, such as the creation of protected areas and management of harvested species, as well as measures of pressures or threats to biodiversity, such as habitat loss. Whilst ‘biodiversity indicators’ has tended to become a short‐hand for all aspects of measuring biodiversity conservation, this report has mostly used the phrase, ‘indicators for biodiversity’, to try and recognise that it is addressing more than the state of species and habitats. In the on‐line survey for this report the questions used the phrase, ‘indicators in support of implementation of the CBD’, and this phrase is maintained when referring to the results of the survey.
Uses of indicators and monitoring
“Addressing biodiversity loss requires knowledge about biodiversity, assessments of the effectiveness of policy and management decisions – usually through adaptive management – and decision‐making in accordance with the national biodiversity strategy, relevant biodiversity targets and other sustainable development objectives. Because of the complexity of biodiversity, incomplete taxonomic knowledge and high cost of biodiversity assessments and monitoring programmes, decision‐making will typically rely on a small number of indicators, for which data are available.
Indicators can be used to assess national performance and to signal key issues to be addressed through policy interventions and other actions. The development of indicators is, therefore, important for monitoring the status and trends of biological diversity and, in turn, feeding back information on ways to continually improve the effectiveness of biodiversity management programmes.
Indicators, when used to assess national or global trends, build a bridge between the fields of policy‐making and science. Policy makers set the targets and measurable objectives, while scientists determine relevant variables of biodiversity, monitor current state and develop models to make projections of future biodiversity status. Once they are selected, indicators can give direction to monitoring programmes to provide the necessary data.12”
There can be many reasons or motivations for the production of national‐level indicators, such as:
to summarise information for the design of conservation strategies (e.g. NBSAPs, protected area systems), and their monitoring, reporting and adaptive management;
12 Adapted from http://www.cbd.int/indicators/intro.shtml
12
to assist the development of policies and management plans for commercially important biodiversity (e.g. timber production, fisheries, wildlife tourism);
to help raise awareness and support for topics of importance to interest groups, including NGOs and academia, (e.g. protection of threatened species or sites, pollution problems, compliance with international agreements);
to help in understanding and communicating the evidence from assessments of state of the environment, biodiversity or ecosystem services, to identify and understand issues of concern.
Development steps for producing and using biodiversity indicators.
UNEP‐WCMC has developed and field‐tested over ten years a Biodiversity Indicator Development Framework to guide the production of successful indicators. The ten steps of the Framework are presented in Annex 1 and are fully explained in the guidance material and examples available in English,
French, Spanish and Arabic at www.bipnational.net. The framework encourages an investment in the definition of the purpose of an indicator or suite of indicators before starting their selection and production. Similarly, the Framework encourages developing indicators with a view to their permanence and sustainability, including monitoring and reporting systems.
Analytical frameworks
The use of analytical frameworks, such as Pressure‐State‐Response, is an established part of the analysis and communication of environmental information. Such frameworks have also been used to guide the development of strategies and plans and their indicators. The CBD 2010 Biodiversity Target framework of provisional global indicators used a framework of seven Focal Areas (see Table 1). This framework and issues for its development were examined at the “International Expert Workshop on the 2010 Biodiversity Indicators and Post‐2010 Indicator Development”, in Reading, UK in July 2009.13 The workshop recommended that, “the current framework of global indicators should be modified and simplified into four ‘focal areas’: Threats to Biodiversity; State of Biodiversity; Ecosystem services; and Policy Responses”.
Partners in the 2010 BIP and the Cambridge Conservation Initiative produced an analysis and recommendation that indicators for biodiversity are easier to understand, communicate and act upon when they are linked together in a set that connects policies to outcomes. They proposed that, “four kinds of indicators are needed to make a joined‐up set:
Responses – policies or actions to prevent or reduce biodiversity loss.
Pressures – the threats to biodiversity that responses aim to address.
State – the condition of biodiversity and how it is changing.
Benefits – amount and change in benefits and services that humans derive from biodiversity.”14
This framework has similarities to the subjects of the five Strategic Goals under the Strategic Plan for Biodiversity 2011‐2020 (Table 2), which forms a framework for the Aichi Targets and the development of indicators for them. These five Strategic Goals are:
A) Address the underlying causes of biodiversity loss by mainstreaming biodiversity across government and society.
B) Reduce the direct pressures on biodiversity and promote sustainable use.
C) To improve the status of biodiversity by safeguarding ecosystems, species and genetic diversity.
D) Enhance the benefits to all from biodiversity and ecosystem services.
13 http://www.cbd.int/doc/meetings/ind/emind‐02/official/emind‐02‐0709‐10‐workshop‐report‐en.pdf 14 http://www.bipindicators.net/linkedindicators

13
E) Enhance implementation through participatory planning, knowledge management and capacity building.
It has been the experience of the capacity building work of UNEP‐WCMC that analytical and strategic frameworks are valuable at the stage of determining the purpose or needs for indicators. However, efforts to assign particular indicators to one component or another of a framework are not so useful, because indicators are purpose‐dependent and a particular data set or metric can often be used an indicator for more than one purpose. For example, data on forest extent over time could be used for an indicator of the status of forest‐dependent species (status) or the success of conservation measures (response).
Criteria in developing and using indicators
There are many different sets of criteria that have been produced to guide the selection of indicators, including consideration of the use of the indicators and the technical capacity available. One such set of criteria was produced by participants in the 2010 BIP capacity building workshops to determine that a ‘successful’ indicator should be:
Scientifically valid ‐ a) there is an accepted theory of the relationship between the indicator and its purpose, with agreement that change in the indicator does indicate change in the issue of concern; b) the data used is reliable and verifiable.
Based on available data – so that the indicator can be produced over time.
Responsive to change in the issue of interest.
Easily understandable – a) conceptually, how the measure relates to the purpose, b) in its presentation, and c) the interpretation of the data.
Relevant to user’s needs.
It is used! ‐ for measuring progress, early‐warning of problems, understanding an issue, reporting, awareness‐raising, etc.
Additional criteria are likely to be identified by the 2011 AHTEG on indicators.
Skills for producing indicators for biodiversity The production and communication of indicators requires a range of skills and capacities, including:
a science‐based understanding of the biodiversity issue of interest,
understanding the scientific and statistical strengths and weaknesses of the data being used,
a basic competency in the processing of data to produce graphs and maps, etc with a scientific and statistical validity,
writing and presentation skills to communicate the indicator results to the intended users.
It is likely that a team of people or institutions will be required to provide these skills, and the collaborative production of indicators can greatly strengthen not only the scientific validity of indicators, but also increase access to data and raise the credibility of the indicators and the conclusions from them.

14
4. METHODS The evidence base for this report is compiled principally from the three sources of an analysis of the existence of indicators in CBD 4th national reports, an online questionnaire distributed internationally to national producers and users of biodiversity information and other interested parties, and the relevant experience of the 2010 Biodiversity Indicators Partnership.
Analysis of CBD 4th National Reports
A principal sources of evidence for this report was an analysis of the occurrence of indicators in CBD 4th national reports(http://www.cbd.int/reports/). By March 2011 reports had been submitted to the Secretariat of the CBD by 159 (83%) of the 193 Parties. Reports in French, Spanish, and Arabic were reviewed by speakers of these languages. Four reports in Russian and one in Thai were not able to be reviewed. Each of these reports was reviewed to identify any indicators or references to indicators that they contained. The indicators were first assigned as far as possible to one of the indicators of the framework of provisional indicators for assessing progress at the global level towards the CBD 2010 Target (CBD decision VII/30) – see also http://www.bipindicators.net/indicators. This framework consists of seven focal areas, nineteen headline indicators, and thirty‐one indicators (see Table 1). Each indicator or reference to an indicator found in the national reports was categorised as follows:
1. Indicator in development (specifically mentioned as such); 2. The topic is included in the report with some evidence of data, but is not presented in the form
of an indicator (e.g. a statement such as, ‘forest cover declined by 20%); 3. Indicator is referred to, but without results in the report; 4. Indicator with results, figures, etc. in the report; 5. A graph or analysis is reported, but as a single study.
In the analysis of the results it was decided to present the results for the category 4 indicators as ‘evidenced indicators’, and to combine the results for categories 2, 3 and 5 as ‘non‐evidence indicators’ for which there was insufficient evidence in the 4th national report that they exist in the format of an indicator. If the indicator could not be clearly matched to one of the CBD global 2010 Target indicators then it was recorded as an additional indicator. However, the ‘additional indicators’ were still assigned as far as possible to a classification of the CBD global 2010 Target indicators framework, to enable an analysis against this framework. For example, an indicator called, ‘Rate of degradation of ecosystems’ was assigned to be similar or relevant to CBD global indicator 1.1.1 Extent of forests and forest types, under the CBD global headline indicator 1.1 Trends in extent of selected biomes, ecosystems, and habitats. This was necessarily rather a subjective process, as the information provided on the indicators, or reference to possible indicators, was often very brief. This process resulted in the need to add a few new headline indicators to the CBD global 2010 Target indicators framework, as follows:
2.4 Indices of sustainable management (indices not relating to areas) 4.8 Other indicators of ecosystem services 4.9 Soil Quality 5.2 Other indicator of the status of indigenous and traditional knowledge 8 Policy legislation & conservation measures 8.1 Regional and national level policy legislation and conservation measures 8.2 Conservation organizations 8.3 Public awareness and participation in conservation and environmental management issues 8.4 Public and private enterprises involved in conservation measures
To enable an assessment of how current national indicators could be suitable for the Aichi Targets, each of the indicators identified in the 4th national reports to the CBD was then examined and assigned as relevant to one or more of the Aichi Targets, as appropriate.
15
The Questionnaire
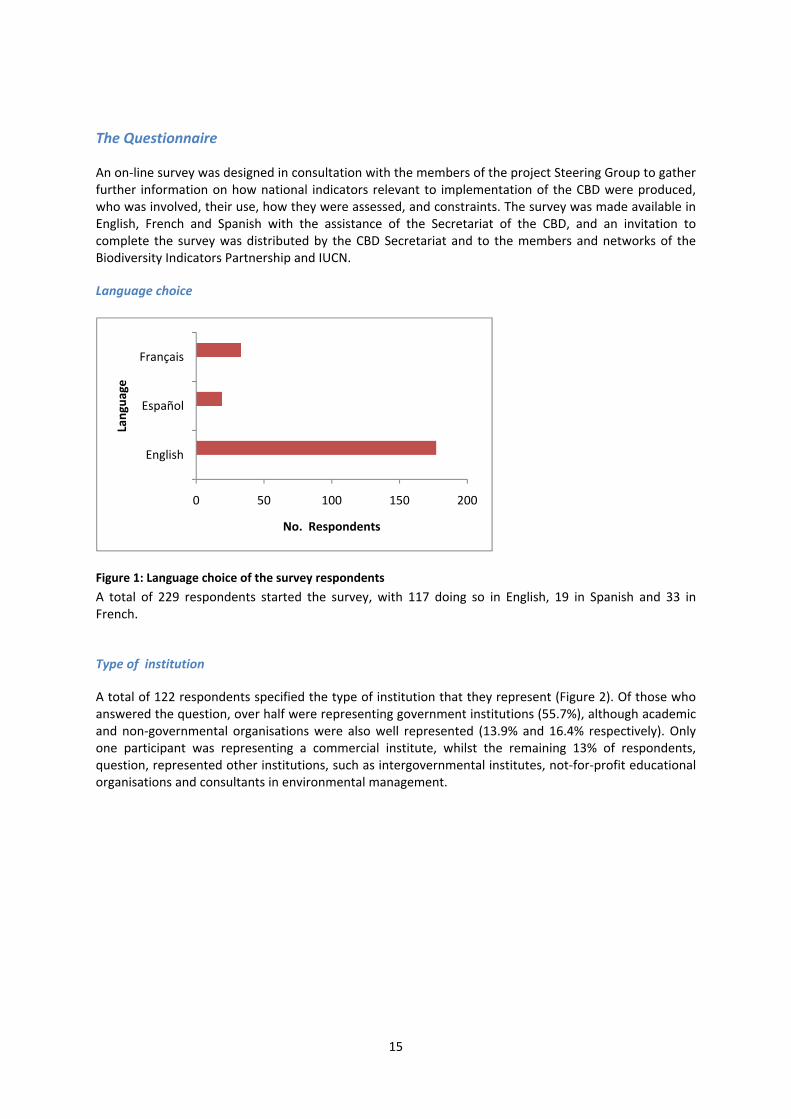
An on‐line survey was designed in consultation with the members of the project Steering Group to gather further information on how national indicators relevant to implementation of the CBD were produced, who was involved, their use, how they were assessed, and constraints. The survey was made available in English, French and Spanish with the assistance of the Secretariat of the CBD, and an invitation to complete the survey was distributed by the CBD Secretariat and to the members and networks of the Biodiversity Indicators Partnership and IUCN.
Language choice
Figure 1: Language choice of the survey respondents
A total of 229 respondents started the survey, with 117 doing so in English, 19 in Spanish and 33 in French.
Type of institution
A total of 122 respondents specified the type of institution that they represent (Figure 2). Of those who answered the question, over half were representing government institutions (55.7%), although academic and non‐governmental organisations were also well represented (13.9% and 16.4% respectively). Only one participant was representing a commercial institute, whilst the remaining 13% of respondents, question, represented other institutions, such as intergovernmental institutes, not‐for‐profit educational organisations and consultants in environmental management.
0 50 100 150 200
English
Español
Français
No. Respondents
Language

16
Figure 2: Type of institution represented by the respondents (%)
Role(s) regarding the National Indicators
Respondents were asked to specify their roles(s) regarding national indicators for implementation of the CBD, with a choice of six options plus ‘other’. Of the 140 respondents who answered the question, 31% were ‘User of indicators in reports, analyses and policy etc’, followed by ‘Oversee production of indicators’, with 20%, and then ‘Data provider’ and ‘Responsible for indicator/s calculation’, by 15% and 13% respectively. Of the remaining respondents, 27 had no specific role whilst 25 had roles different to those specified. These roles included using the indicators in conservation programs, indicator development, research and biodiversity monitoring.
Figure 3: Roles of respondents regarding national indicators for implementation of the CBD (%)

17
The BIP capacity building experience
This report incorporates the experience of UNEP‐WCMC in its capacity development work for the 2010 Biodiversity Indicators Partnership (BIP) and previous projects since 2000. Through the 2010 BIP direct engagement with national biodiversity indicator developers was conducted in a series of regional capacity building workshops, involving a total of forty‐five countries. The workshop reports are available at www.bipnational.net Workshops were conducted in south‐east Asia, the Caribbean, and Central America, to assist the bodies responsible for CBD implementation and reporting to have an improved understanding of the global framework of indicators for the CBD 2010 Target, and to identify ways to improve their national indicators. The workshops reviewed existing experiences with biodiversity indicators, conducted capacity‐building exercises, and examined possibilities for common regional indicators. In eastern and southern Africa more extensive capacity building was conducted through a UNEP project funded by the UN Development Account and implemented by UNEP‐WCMC as part of the 2010 BIP. A series of three regional workshops were conducted in both eastern and southern Africa for government environment and wildlife agencies, national statistical offices and conservation NGOS. Technical support was provided to participants in the interim periods. The project was designed to cover the steps in the Biodiversity Indicator Development Framework (Annex 1), using existing data sets. Reports of the workshops and national progress can be found at www.bipnational.net The indicator results, lessons learned, and recommendations from this work were presented at CBD SBSTTA‐14 and COP‐10.
18
1. RESULTS
National and regional experience in the development and use of indicators for biodiversity
This section first reviews this topic at the national level and then at the regional level.
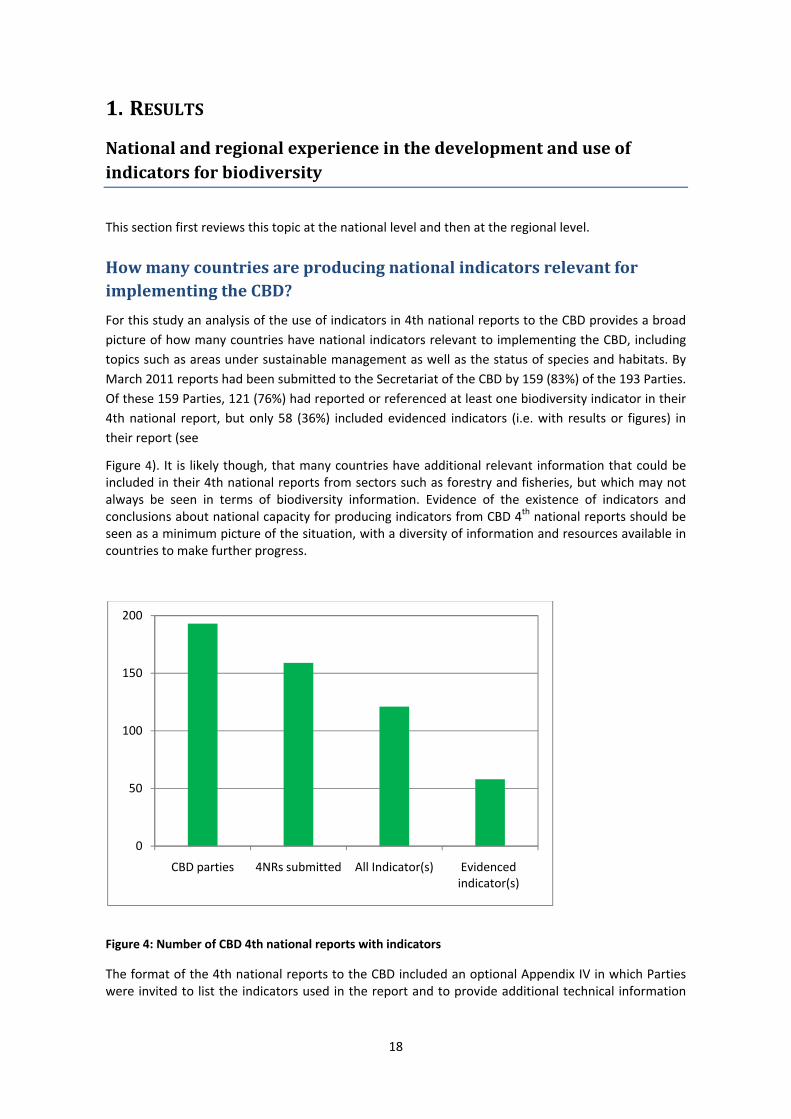
How many countries are producing national indicators relevant for implementing the CBD?
For this study an analysis of the use of indicators in 4th national reports to the CBD provides a broad
picture of how many countries have national indicators relevant to implementing the CBD, including
topics such as areas under sustainable management as well as the status of species and habitats. By
March 2011 reports had been submitted to the Secretariat of the CBD by 159 (83%) of the 193 Parties.
Of these 159 Parties, 121 (76%) had reported or referenced at least one biodiversity indicator in their
4th national report, but only 58 (36%) included evidenced indicators (i.e. with results or figures) in
their report (see
Figure 4). It is likely though, that many countries have additional relevant information that could be included in their 4th national reports from sectors such as forestry and fisheries, but which may not always be seen in terms of biodiversity information. Evidence of the existence of indicators and conclusions about national capacity for producing indicators from CBD 4th national reports should be seen as a minimum picture of the situation, with a diversity of information and resources available in countries to make further progress.
Figure 4: Number of CBD 4th national reports with indicators
The format of the 4th national reports to the CBD included an optional Appendix IV in which Parties were invited to list the indicators used in the report and to provide additional technical information
0
50
100
150
200
CBD parties 4NRs submitted All Indicator(s) Evidenced indicator(s)

19
and case studies. Of the 159 Parties which have submitted their 4th national report 27(17%) of these included an Appendix IV with some indicators in their report.
The on‐line questionnaire asked the respondents if there were any relevant national indicators for implementation of the CBD and reporting in their country. Of the total of 134 respondents, representing 65 countries, 56% said that their country did have such indicators, and these respondents represented 35 countries (Figure 5). 20% of respondents said that their country did not have relevant national indicators, and 24% said that they didn’t know. However, some of the respondents may have misunderstood the survey question as referring to the CBD 2010 Target framework of global headline indicators, rather than to any indicators of relevance to national implementation of the Convention.
Figure 5: Percentage of 134 respondents for, “Are there any relevant national indicators for implementation of the CBD and reporting in your country?”
It is evident that currently a great many countries do not have established national indicators that are considered to be relevant to the implementation of the CBD and the Strategic Plan for Biodiversity 2011‐2020. This does not necessarily mean that they do not have any relevant data to support the implementation of the CBD and the Strategic Plan, but that such data may not be analysed and made available in the form of indicators for particular needs. They may also have indicators on topics such as forestry and fisheries which are very relevant, but have not been used in relation to implementation of the CBD.
The results of the BIP capacity building workshops in eastern and southern Africa demonstrated that in most countries at least a few indicators of national relevance can be produced from existing data. For example, a collaboration of Ethiopian government agencies and NGOs produced the first national indicators in support of management of protected areas, with information on trends in abundance and distribution of five nationally important mammals and a threatened bird species, and trends in land use and protected areas coverage in Ethiopia.
How are national indicators relevant to the CBD produced?
Who are producing national indicators of biodiversity and other topics in support of implementation of the CBD? In many cases more than one institution may be involved in the production of an indicator or suite of
indicators. For example, an academic body or NGO may gather field data and conduct an initial

20
analysis, the national statistics office may validate and approve the analysis, and the environment
ministry adopts the results in its work. The questionnaire for this report asked who is involved in the
production of national biodiversity indicators, and 56 respondents with national indicators
(representing 35 countries) selected the options that applied (
Figure 6: Percentage frequency of actors involved in producing national indicators for implementation of the CBD (56 respondents)
Over 80% of respondents stated that their Environment Ministry is involved in the production of national indicators for implementation of the CBD. It should be noted that the questionnaire did not detail what was meant by ‘involvement’, which could range from the selection and commissioning of indicators, the gathering and processing of data, to their communication in reports. Similarly, the questionnaire was about all types of ‘biodiversity indicators’ that are relevant for implementation of the CBD, and the results reflect the diversity of institutions that may be involved in different indicators.
One or more of government biodiversity offices, national statistics offices, NGOs and academic bodies were involved in the production of their national indicators according to about 50% of respondents. From the experience of the BIP capacity building workshops, a key factor in a countries’ capacity to produce biodiversity indicators over time is whether or not there is a national office or institution with the responsibility for the co‐ordination, analysis and communication of biodiversity information. Whilst many countries have government agencies responsible for information and statistics for biodiversity‐relevant issues such as forests, fisheries, wildlife, and protected areas, the existence of a government or academic institute for biodiversity information is relatively uncommon outside Europe. Some examples of such institutes are:
China ‐ Nanjing Institute of Environmental Sciences of the Ministry of Environmental Protection South Africa – South Africa National Biodiversity Institute (SANBI)
21
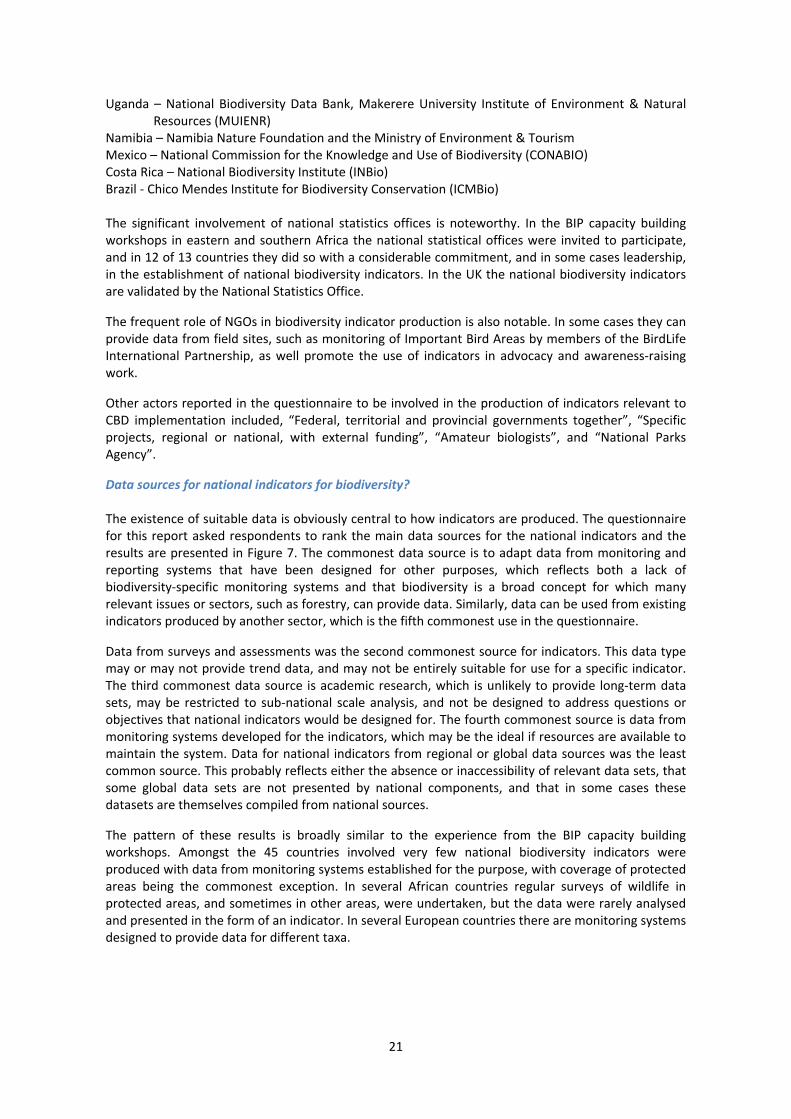
Uganda – National Biodiversity Data Bank, Makerere University Institute of Environment & Natural Resources (MUIENR)
Namibia – Namibia Nature Foundation and the Ministry of Environment & Tourism Mexico – National Commission for the Knowledge and Use of Biodiversity (CONABIO) Costa Rica – National Biodiversity Institute (INBio) Brazil ‐ Chico Mendes Institute for Biodiversity Conservation (ICMBio) The significant involvement of national statistics offices is noteworthy. In the BIP capacity building workshops in eastern and southern Africa the national statistical offices were invited to participate, and in 12 of 13 countries they did so with a considerable commitment, and in some cases leadership, in the establishment of national biodiversity indicators. In the UK the national biodiversity indicators are validated by the National Statistics Office.
The frequent role of NGOs in biodiversity indicator production is also notable. In some cases they can provide data from field sites, such as monitoring of Important Bird Areas by members of the BirdLife International Partnership, as well promote the use of indicators in advocacy and awareness‐raising work.
Other actors reported in the questionnaire to be involved in the production of indicators relevant to CBD implementation included, “Federal, territorial and provincial governments together”, “Specific projects, regional or national, with external funding”, “Amateur biologists”, and “National Parks Agency”.
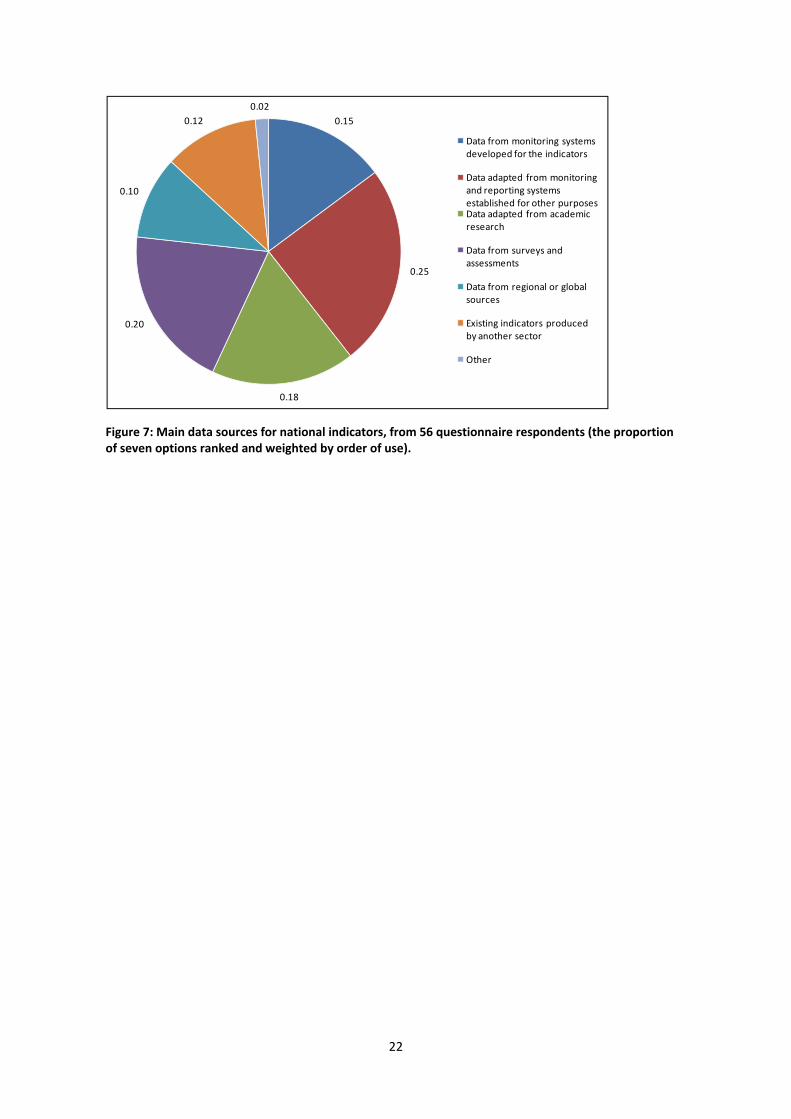
Data sources for national indicators for biodiversity? The existence of suitable data is obviously central to how indicators are produced. The questionnaire for this report asked respondents to rank the main data sources for the national indicators and the results are presented in Figure 7. The commonest data source is to adapt data from monitoring and reporting systems that have been designed for other purposes, which reflects both a lack of biodiversity‐specific monitoring systems and that biodiversity is a broad concept for which many relevant issues or sectors, such as forestry, can provide data. Similarly, data can be used from existing indicators produced by another sector, which is the fifth commonest use in the questionnaire.
Data from surveys and assessments was the second commonest source for indicators. This data type may or may not provide trend data, and may not be entirely suitable for use for a specific indicator. The third commonest data source is academic research, which is unlikely to provide long‐term data sets, may be restricted to sub‐national scale analysis, and not be designed to address questions or objectives that national indicators would be designed for. The fourth commonest source is data from monitoring systems developed for the indicators, which may be the ideal if resources are available to maintain the system. Data for national indicators from regional or global data sources was the least common source. This probably reflects either the absence or inaccessibility of relevant data sets, that some global data sets are not presented by national components, and that in some cases these datasets are themselves compiled from national sources.
The pattern of these results is broadly similar to the experience from the BIP capacity building workshops. Amongst the 45 countries involved very few national biodiversity indicators were produced with data from monitoring systems established for the purpose, with coverage of protected areas being the commonest exception. In several African countries regular surveys of wildlife in protected areas, and sometimes in other areas, were undertaken, but the data were rarely analysed and presented in the form of an indicator. In several European countries there are monitoring systems designed to provide data for different taxa.
22
Figure 7: Main data sources for national indicators, from 56 questionnaire respondents (the proportion of seven options ranked and weighted by order of use).
0.15
0.25
0.18
0.20
0.10
0.12
0.02
Data from monitoring systems developed for the indicators
Data adapted from monitoring and reporting systems established for other purposesData adapted from academic research
Data from surveys and assessments
Data from regional or global sources
Existing indicators produced by another sector
Other
23
Which national indicators are being produced, in relation to the CBD 2010 Target and the Aichi Biodiversity Targets?
Indicators in CBD 4th national reports and the CBD 2010 Target framework of global indicators
Figure 8 presents the number of CBD Parties reporting indicators in 4th national reports within the CBD 2010 indicator categories.
Figure 8: Number of CBD Parties reporting indicators in 4th national reportswithin CBD 2010 indicator categories
It is clear that indicator 1.3.1. ‘Coverage of protected areas’ is the indicator which most CBD Parties can produce, as reported by a total of 91 Parties. It is an indicator under Target 7 of the Millennium Development Goals (MDGs) and the establishment of protected area systems is one of the longest established activities of the biodiversity conservation community. The basic measure of the indicator

24
as coverage of a nation’s territory is relatively straightforward and there are likely to be at least basic national data sets for most countries. It is an indicator that is relevant to all countries. The second most reported indicator, by 50 countries, is 1.1.1. ‘Extent of forests and forest types’. This is also an MDG‐7 indicator and is basic measurement which most countries with forests are likely to have some data for, as part of national forest management and under international processes such as the FAO Forest Resources Assessment. The third most frequent indicator in CBD 4th national reports is 3.2.1. ‘Invasive alien species’, found with evidence as an indicator in 9 reports, and references without evidence in 32 reports. This result probably reflects the importance given to this issue by many Parties, but there are not widely‐established measures of this complex subject, and many indicators are lists of invasive alien species recorded or of measures for their control. The fourth most reported indicator is 4.2.1. ‘Water quality’, found with evidence as an indicator in just 4 reports, and references without evidence in 20 reports. All the other indicators are found in less than 20 reports. Some of the reasons for the low frequency of these indicators could be:
the subject of the indicator is not important or relevant to many countries,
there is insufficient data at the national level,
there is not the technical capacity to calculate the indicator,
the global indicator is not fully developed or defined for use at national level.
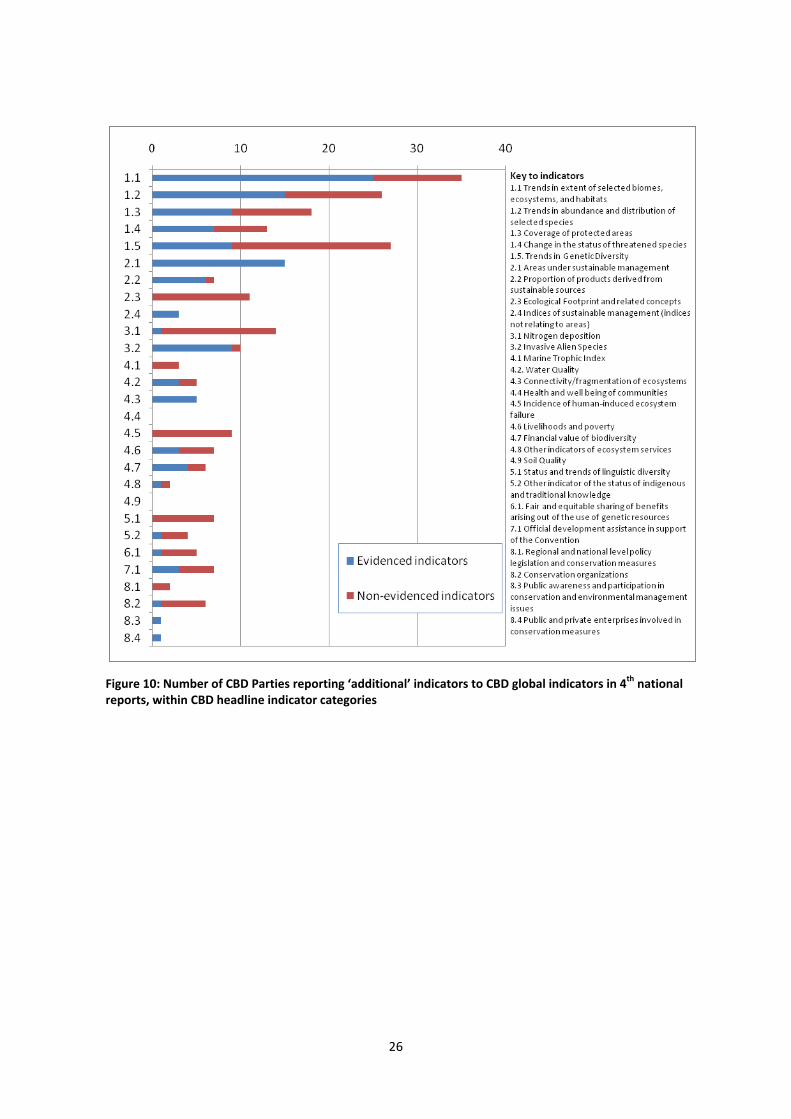
Figure 9 shows the number of CBD Parties reporting indicators in 4th national reports within the CBD global headline indicator categories, as this slightly aggregated level of analysis can assist in identifying the issues which countries are most able or interested in producing indicators for. This figure would appear to emphasise the very low number of Parties with indicators for headline indicator 1.2 ‘Trends in abundance and distribution of selected species’. However this pattern is very different when the same analysis is done for the ‘additional’ indicators to the CBD global 2010 Target indicators which are similar to the CBD indicators (Figure 10). This is because the global indicators such as Living Planet Index are rarely calculated at the national level, but there are suitable data sets of species of trends and abundance for simple indicator measures in some countries. Indicator 2.1 ‘Areas under sustainable management’ also has a significantly higher number of ‘additional’ indicators relevant to this category than for the CBD global headline indicator.
Figure 10 also shows that several other topics in addition to the CBD 2010 global headline indicators are of importance to some countries at least, including:
2.4 Indices of sustainable management (indices not relating to areas) 4.8 Other indicators of ecosystem services 4.9 Soil Quality 5.2 Other indicator of the status of indigenous and traditional knowledge 8.1 Regional and national level policy legislation and conservation measures 8.2 Conservation organizations 8.3 Public awareness and participation in conservation and environmental management issues 8.4 Public and private enterprises involved in conservation measures

25
Figure 9: Number of CBD Parties reporting indicators in 4th national reportswithin CBD 2010 headline indicator categories
26
Figure 10: Number of CBD Parties reporting ‘additional’ indicators to CBD global indicators in 4th national reports, within CBD headline indicator categories

27
Further aggregation of the indicators found in CBD 4th national reports to the level of Focal Area of the CBD 2010 Target Framework gives a clear picture of the type of data and subjects which Parties are interested in, and for which they have capacity to produce indicators (Figures 11 and 12). There is evidence from the 4th national reports that over 100 Parties have at least some data on aspects of the status and trends of the components of biodiversity (focal area 1). Some indicators or relevant data on sustainable use, threats to biodiversity, and ecosystem integrity is provided by at least 40 Parties. Only about 15 Parties include some indicators or information on status of traditional knowledge, innovations and practices, or resource transfers, in their 4th national reports to the CBD.
Figure 11: Number of CBD Parties using CBD global 2010 indicators in 4th national reports within CBD 2010 focal area categories
Figure 12: Number of CBD Parties reporting ‘additional’ indicators to CBD global indicators in 4th national
reports, within CBD 2010 focal area categories

28
Indicators in CBD 4th National Reports relevant to the Strategic Plan for Biodiversity 2011‐2020
A broad assessment of the current potential for Parties to have indicators suitable for measuring progress towards the Aichi Targets is provided by the data in
Figure 13, showing the number of indicators in CBD 4th national reports considered to be of relevance to each Target. The number of indicators found for each Target depends not just on how many relevant indicators with different names were identified, but also on the fact that many of the Aichi Targets include more than one topic or issue and specify how it could be addressed. For example, Target 11 on systems of protected areas includes identification of areas of particular importance for biodiversity and ecosystem services, as well as effective management, and there could be indicators of relevance to all of these topics. It should also be noted that in many cases an indicator can be relevant to more than one Target.
The analysis found that Target 14 (Essential ecosystem services) has the most evidenced and non‐evidenced indicators. This is probably because the concept and definition of ecosystem services is very broad, covering supporting, provisioning, regulating and cultural services, and so many different measures or indicators are relevant. Target 5 (Loss of habitats) has the second largest total, with 88 relevant evidenced and non‐evidenced indicators, which is likely to be predominantly for forest coverage, but includes other types of habitats and ecosystems.
Four other Targets have over 50 potentially relevant evidenced and non‐evidenced national indicators and so it could be considered as likely that some national indicators can be developed for them. These Targets are 4 (Use of natural resources), 7 (Areas under sustainable management), 11 (Protected areas), and 15 (Biodiversity and carbon stocks).
Target 6 (Sustainable fisheries) has 28 potentially relevant evidenced and non‐evidenced national indicators, and there would to appear to be a significant probability of some national indicators being possible for this Target. Target 8 (Pollution) and Target 12 (Preventing extinctions) have only 5 and 4 relevant indicators evidenced in 4th national reports, although they have respectively 32 and 31 non‐evidenced national indicators, which may signify that few Parties have suitable data sets, or there is a lack of capacity for reporting on these subjects, or these are low priority issues for Parties.
Target 10 (Vulnerable ecosystems) had 4 evidenced and 11 non‐evidenced national indicators, showing that in at least some cases relevant information may be available. Target 9 (Invasive alien species) has only 1 evidenced and 11 non‐evidenced national indicators, and this topic will certainly be a challenge for measurement and reporting of progress. Target 1 (Awareness of biodiversity values) has only 2 evidenced and 8 non‐evidenced relevant national indicators in CBD 4th national reports, which probably reflects that this is a new subject or goal for most Parties to the CBD. Target 2 (Integration of biodiversity values) has no evidenced and 13 non‐evidenced national indicators, which reflects perhaps the difficulty of measuring this aim and that it has not been a focus to date of many countries. Six of the Aichi Targets had only between zero and 6 evidenced and non‐evidenced national indicators in CBD 4th national reports, and so will require new investments to identify and produce suitable indicators. These six Targets are:
3 (Incentives and subsidies that harm or promote biodiversity)
13 (Agricultural biodiversity)
16 (Access and Benefit Sharing implementation)
18 (Indigenous and local communities)
19 (Biodiversity knowledge)
20 (Resources in support of the Convention)

29
Examination of CBD 4th national reports regarding Target 17 (NBSAPs) may perhaps be best considered in terms of existence or not of NBSAPs, and to date 173 Parties have developed NBSAPs.
Figure 13: No. of indicators in CBD 4th national reportsof relevance to each Aichi Target
A graph of the number of Parties with relevant indicators for each Aichi Target, as evidenced by the analysis of 4th national reports ( Figure 14), gives a similar pattern to the number of relevant indicators per Target. Whilst the numbers of Parties with relevant indicators may seem encouragingly high for many of the Targets, it should be noted that for this analysis the results can be very influenced by a small number of relatively frequent indicators. For example, most of the 112 Parties with a potentially relevant indicator for Target 11 (protected areas), will have an indicator of protected area coverage, but may not have other relevant indicators such as management effectiveness. Similarly, much of the high count of 104 Parties with a relevant indicator for target 14 (ecosystem services) could consist of data on coverage of forest or other habitats.
0 20 40 60 80 100 120
Awareness of BD values 1
Integration of BD values 2
Incentives 3
Use of nat. resources 4
Loss of habitats 5
Sustainable fisheries 6
Areas under sust. mgt. 7
Pollution 8
IAS 9
Vulnerable ecosystems 10
Protected areas 11
Preventing extinctions 12
Agricultural BD 13
Essential eco. services 14
BD & carbon stocks 15
ABS implementation 16
NBSAPs 17
Trad. knowledge 18
Biodiversity knowledge 19
Resource mobilization 20
Evidenced indicators
Non‐evidenced indicators

30
Figure 14: No. of Parties with relevant indicators for each Aichi target, from indicators in 4th national reports
The Aichi Targets of the 2011‐2020 Strategic Plan for Biodiversity are organised in support of five Strategic Goals and an analysis of the number of relevant indicators in 4th national reports for these Strategic Goals is presented in Figure 15. It is important to note that there are different numbers of Aichi Targets under each Strategic Goal, as shown in Figure 15, and so the numbers of potentially relevant indicators per Strategic Goal are not directly comparable. The clearest result from this analysis is the lack of evidence for use of national indicators relevant to Strategic Goal E (Enhance implementation through participatory planning, knowledge management and capacity building).
0 20 40 60 80 100 120
Awareness of BD values 1
Integration of BD values 2
Incentives 3
Use of nat. resources 4
Loss of habitats 5
Sustainable fisheries 6
Areas under sust. mgt. 7
Pollution 8
IAS 9
Vulnerable ecosystems 10
Protected areas 11
Preventing extinctions 12
Agricultural BD 13
Essential eco. services 14
BD & carbon stocks 15
ABS implementation 16
NBSAPs 17
Trad. knowledge 18
Biodiversity knowledge 19
Resource mobilization 20
Evidenced indicators
Non‐evidenced indicators
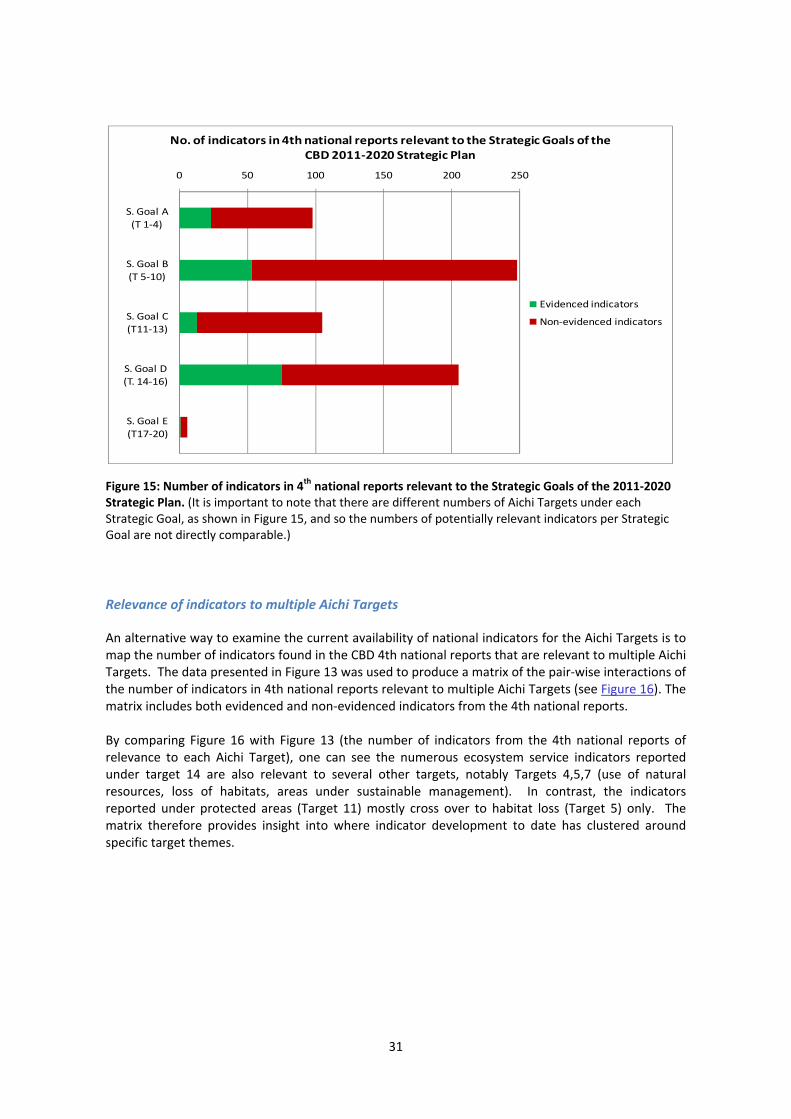
31
Figure 15: Number of indicators in 4th national reports relevant to the Strategic Goals of the 2011‐2020 Strategic Plan. (It is important to note that there are different numbers of Aichi Targets under each Strategic Goal, as shown in Figure 15, and so the numbers of potentially relevant indicators per Strategic Goal are not directly comparable.)
Relevance of indicators to multiple Aichi Targets
An alternative way to examine the current availability of national indicators for the Aichi Targets is to map the number of indicators found in the CBD 4th national reports that are relevant to multiple Aichi Targets. The data presented in Figure 13 was used to produce a matrix of the pair‐wise interactions of the number of indicators in 4th national reports relevant to multiple Aichi Targets (see Figure 16). The matrix includes both evidenced and non‐evidenced indicators from the 4th national reports. By comparing Figure 16 with Figure 13 (the number of indicators from the 4th national reports of relevance to each Aichi Target), one can see the numerous ecosystem service indicators reported under target 14 are also relevant to several other targets, notably Targets 4,5,7 (use of natural resources, loss of habitats, areas under sustainable management). In contrast, the indicators reported under protected areas (Target 11) mostly cross over to habitat loss (Target 5) only. The matrix therefore provides insight into where indicator development to date has clustered around specific target themes.
0 50 100 150 200 250
S. Goal A
(T 1‐4)
S. Goal B
(T 5‐10)
S. Goal C (T11‐13)
S. Goal D (T. 14‐16)
S. Goal E
(T17‐20)
No. of indicators in 4th national reports relevant to the Strategic Goals of the CBD 2011‐2020 Strategic Plan
Evidenced indicators
Non‐evidenced indicators
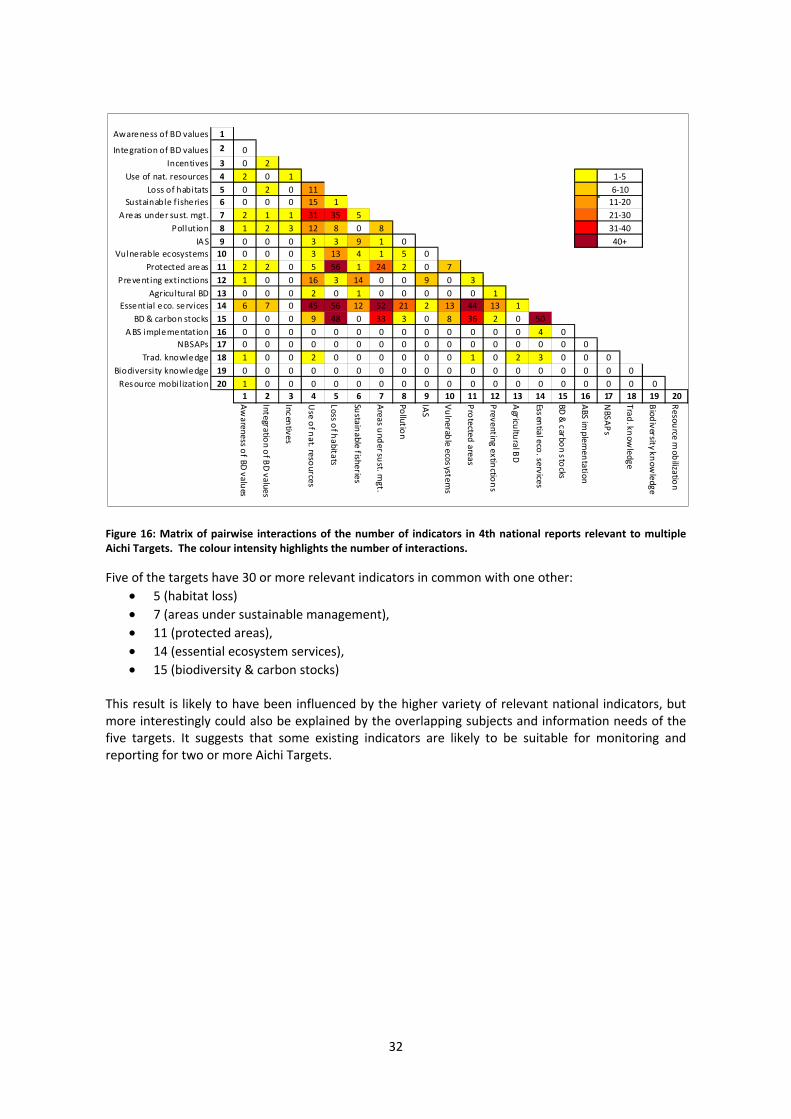
32
Figure 16: Matrix of pairwise interactions of the number of indicators in 4th national reports relevant to multiple Aichi Targets. The colour intensity highlights the number of interactions.
Five of the targets have 30 or more relevant indicators in common with one other:
5 (habitat loss)
7 (areas under sustainable management),
11 (protected areas),
14 (essential ecosystem services),
15 (biodiversity & carbon stocks) This result is likely to have been influenced by the higher variety of relevant national indicators, but more interestingly could also be explained by the overlapping subjects and information needs of the five targets. It suggests that some existing indicators are likely to be suitable for monitoring and reporting for two or more Aichi Targets.
Awareness of BD values 1
Integration of BD values 2 0
Incentives 3 0 2
Use of nat. resources 4 2 0 1
Loss of habitats 5 0 2 0 11
Sustainable f isheries 6 0 0 0 15 1
Areas under sust. mgt. 7 2 1 1 31 35 5
Pollution 8 1 2 3 12 8 0 8
IAS 9 0 0 0 3 3 9 1 0
Vulnerable ecosystems 10 0 0 0 3 13 4 1 5 0
Protected areas 11 2 2 0 5 56 1 24 2 0 7
Preventing extinctions 12 1 0 0 16 3 14 0 0 9 0 3
Agricultural BD 13 0 0 0 2 0 1 0 0 0 0 0 1
Essential eco. services 14 6 7 0 45 56 12 52 21 2 13 44 13 1
BD & carbon stocks 15 0 0 0 9 48 0 33 3 0 8 36 2 0 50
ABS implementation 16 0 0 0 0 0 0 0 0 0 0 0 0 0 4 0
NBSAPs 17 0 0 0 0 0 0 0 0 0 0 0 0 0 0 0 0
Trad. knowledge 18 1 0 0 2 0 0 0 0 0 0 1 0 2 3 0 0 0
Biodiversity knowledge 19 0 0 0 0 0 0 0 0 0 0 0 0 0 0 0 0 0 0
Resource mobilization 20 1 0 0 0 0 0 0 0 0 0 0 0 0 0 0 0 0 0 0
1 2 3 4 5 6 7 8 9 10 11 12 13 14 15 16 17 18 19 20
Awarene
ss of BD
values
Integratio
n of B
D values
Incentives
Use o
f nat. reso
urces
Loss of h
abitats
Sustain
able fisheries
Areas u
nder su
st. mgt.
Pollutio
n
IAS
Vulne
rable ecosystem
s
Protecte
d areas
Preventing extin
ctions
Agricu
ltural B
D
Essential eco
. service
s
BD & carbo
n stocks
ABS im
plemen
tation
NBSA
Ps
Trad. know
ledge
Biod
iversity know
ledge
Resou
rce mob
ilization
1‐5
6‐10
11‐20
21‐30
31‐40
40+
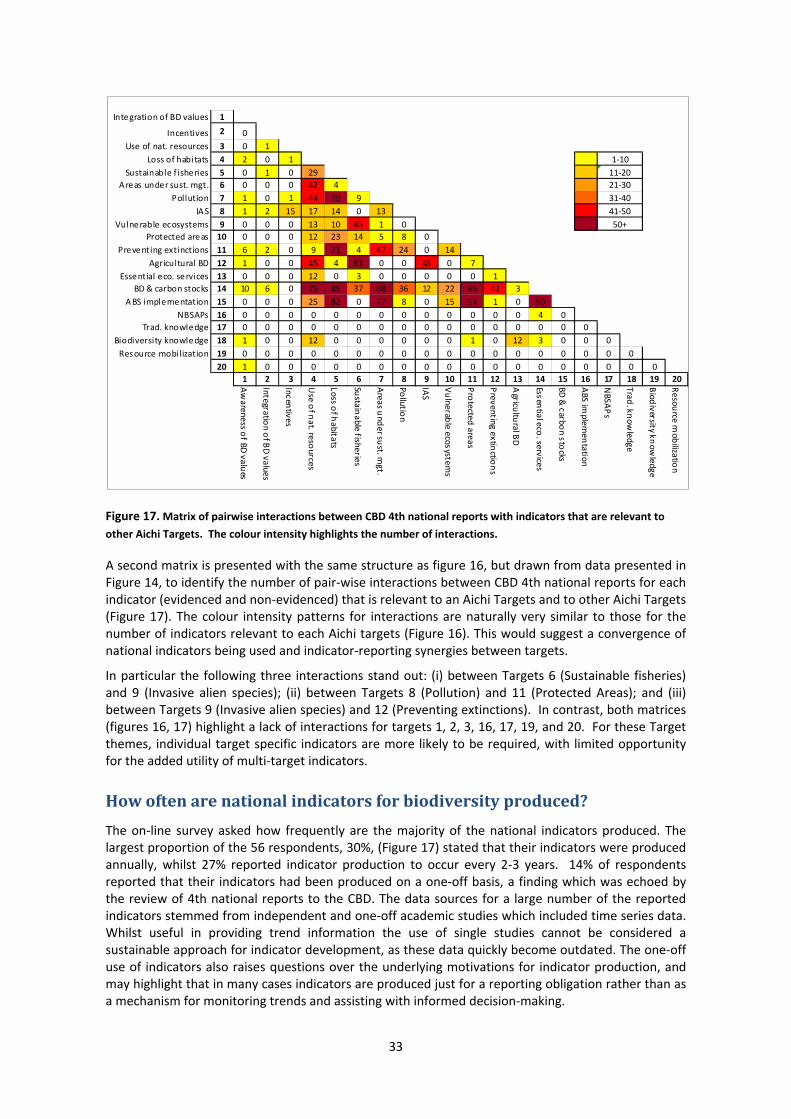
33
Figure 17. Matrix of pairwise interactions between CBD 4th national reports with indicators that are relevant to
other Aichi Targets. The colour intensity highlights the number of interactions.
A second matrix is presented with the same structure as figure 16, but drawn from data presented in Figure 14, to identify the number of pair‐wise interactions between CBD 4th national reports for each indicator (evidenced and non‐evidenced) that is relevant to an Aichi Targets and to other Aichi Targets (Figure 17). The colour intensity patterns for interactions are naturally very similar to those for the number of indicators relevant to each Aichi targets (Figure 16). This would suggest a convergence of national indicators being used and indicator‐reporting synergies between targets.
In particular the following three interactions stand out: (i) between Targets 6 (Sustainable fisheries) and 9 (Invasive alien species); (ii) between Targets 8 (Pollution) and 11 (Protected Areas); and (iii) between Targets 9 (Invasive alien species) and 12 (Preventing extinctions). In contrast, both matrices (figures 16, 17) highlight a lack of interactions for targets 1, 2, 3, 16, 17, 19, and 20. For these Target themes, individual target specific indicators are more likely to be required, with limited opportunity for the added utility of multi‐target indicators.
How often are national indicators for biodiversity produced?
The on‐line survey asked how frequently are the majority of the national indicators produced. The largest proportion of the 56 respondents, 30%, (Figure 17) stated that their indicators were produced annually, whilst 27% reported indicator production to occur every 2‐3 years. 14% of respondents reported that their indicators had been produced on a one‐off basis, a finding which was echoed by the review of 4th national reports to the CBD. The data sources for a large number of the reported indicators stemmed from independent and one‐off academic studies which included time series data. Whilst useful in providing trend information the use of single studies cannot be considered a sustainable approach for indicator development, as these data quickly become outdated. The one‐off use of indicators also raises questions over the underlying motivations for indicator production, and may highlight that in many cases indicators are produced just for a reporting obligation rather than as a mechanism for monitoring trends and assisting with informed decision‐making.
Integration of BD values 1
Incentives 2 0
Use of nat. resources 3 0 1
Loss of habitats 4 2 0 1
Sustainable f isheries 5 0 1 0 29
Areas under sust. mgt. 6 0 0 0 42 4
Pollution 7 1 0 1 44 79 9
IAS 8 1 2 15 17 14 0 13
Vulnerable ecosystems 9 0 0 0 13 10 45 1 0
Protected areas 10 0 0 0 12 23 14 5 8 0
Preventing extinctions 11 6 2 0 9 71 4 47 24 0 14
Agricultural BD 12 1 0 0 45 4 61 0 0 45 0 7
Essential eco. services 13 0 0 0 12 0 3 0 0 0 0 0 1
BD & carbon stocks 14 10 6 0 75 85 37 88 36 12 22 66 42 3
ABS implementation 15 0 0 0 25 82 0 77 8 0 15 54 1 0 90
NBSAPs 16 0 0 0 0 0 0 0 0 0 0 0 0 0 4 0
Trad. knowledge 17 0 0 0 0 0 0 0 0 0 0 0 0 0 0 0 0
Biodiversity knowledge 18 1 0 0 12 0 0 0 0 0 0 1 0 12 3 0 0 0
Resource mobilization 19 0 0 0 0 0 0 0 0 0 0 0 0 0 0 0 0 0 0
20 1 0 0 0 0 0 0 0 0 0 0 0 0 0 0 0 0 0 0
1 2 3 4 5 6 7 8 9 10 11 12 13 14 15 16 17 18 19 20
Awarene
ss of BD
values
Integratio
n of B
D values
Incentive
s
Use o
f nat. reso
urces
Loss of h
abitats
Sustain
able fisheries
Areas u
nder su
st. mgt.
Pollutio
n
IAS
Vulne
rable ecosystem
s
Protecte
d areas
Preventing extin
ctions
Agricu
ltural B
D
Essential e
co. se
rvices
BD & carbo
n stocks
ABS im
plemen
tation
NBSA
Ps
Trad. know
ledge
Biod
iversity know
ledge
Resou
rce mob
ilization
1‐10
11‐20
21‐30
31‐40
41‐50
50+

34
Figure 17: Percentage of 56 respondents for, "How frequently are the majority of the national indicators
produced?”
Why are national indicators produced?
The on‐line questionnaire asked, “What was the main reason for the choice of indicators for CBD implementation and reporting?” Of the 134 respondents who had national indicators 56 answered this question, representing 35 countries, and they could select one option only. The results (Figure 18) show that ‘For CBD goals and targets’ was the main reason for about 30% of respondents. For 50% of respondents specific national objectives and targets or broad topics of national importance have been the main reason, rather than for CBD goals and targets. In the experience of the 2010 BIP capacity building workshops, involving 45 countries, the existence of CBD goals and targets was not found to be the reason for producing indicators, except for ad hoc production for 4th national reports to the CBD. The BIP workshops also found that the CBD 2010 Target global indicator framework was often misunderstood as being a reporting requirement for countries, rather than being part of, “a flexible framework within which national and regional targets may be set, and indicators identified, where so desired by Parties” (CBD COP7 Decision VII/30). For 10% of respondents the reality of which indicators are actually produced was mostly determined by the existence and accessibility of suitable data. For many developing countries, or countries without a long tradition of environmental research, the availability of existing data is likely to be the principle determinant of which indicators are actually chosen and used. The BIP capacity building workshops found this to be the case in all countries which did not have an established national institution for the gathering and reporting of biodiversity information. However, it should be recognised that in many cases a data set can be analysed and interpreted for more than one use if the appropriate scientific and analytical skills exist.

35
Figure 18: Percentage of 56 respondents for, "What was the main reason for the choice of indicators for CBD implementation and reporting?”
Analytical and Reporting Frameworks to guide the selection of indicators
Sometimes indicators are selected and presented within frameworks for analysis and reporting, such as the Pressure‐State‐Response (PSR) framework, or the DPSIR framework which includes ‘driving forces’ and ‘impacts’ of environmental change. The structure of many reports on the state of the environment, and the framework of focal areas and indicators for reporting on the CBD’s 2010 Target (see www.twentyten.net), have been organised using a PSR framework and its variants.
In the on‐line questionnaire we asked the respondents that have national indicators in place for the implementation of the CBD whether a framework was used during indicator selection, and if so, which framework (Figure 19). Only 5% of the 56 respondents did not use any framework in indicator selection. The ‘CBD 2010 Target Framework of Focal Areas and Indicators’ and the use of ‘PSR (Pressure, State, Response), DPSIR or similar’ were similarly popular, with about 30% of respondents each. A further 20% used an ‘Ecosystem/habitat based’ framework, whilst the remaining 14% used other frameworks and some of their responses were:
• “The 5 types of capital: built, natural, human, financial, etc.. which correspond to our law on sustainable development”
• “CBD 2010 target and Ecosystems” • “Frameworks for Canadian Environmental Sustainability Indicators and Federal Sustainable
Development Strategy” • “Issue based” • “The indicator development is not yet well standardised. In fact, projects on biodiversity
monitoring in the country are using different frameworks and there is a need to set a common framework to be used by the different partners in terms of bio‐indicators development. There is still a debate on how to go about it in order to produce reliable and agreed indicators at national level”
• “Indicators are structured by themes (species, habitats, cultural landscape, etc.) and key factors for these themes. The final indicator set was also assigned to DPSR Framework”.

36
The diversity of analytical and reporting frameworks that are used may reflect different uses and priorities for national indicators by Parties. Some countries may prioritise their selection of indicators of indicators and reporting by the guidance of the CBD and wish to be seen to responding to the 2010 Biodiversity Target and its framework of headline global indicators. Other countries may put more emphasis on the production of indicators within their existing strategies and processes for biodiversity and environmental issues and reporting, and so use established PSR of ecosystem/habitat frameworks.
Figure 19: Percentage of 56 respondents for, "Was an indicator framework used in the indicator selection?”

37
Uses of national indicators
The on‐line questionnaire showed that national indicators relevant to CBD implementation are used for a wide range of purposes. The 56 questionnaire respondents that have national indicators were asked to rank their top three uses out of five options, and to report other uses (Figure 20).
The most common uses are for government policy‐making and implementation, and for state‐of‐the environment reports or other assessments. Two other common uses are for reporting on progress for national government commitments, and reporting on progress to international agreements. The use of indicators for awareness raising and advocacy about biodiversity issues was much less commonly reported. Two other reported uses were, “to guide and prioritize the research on biodiversity and conservation”, and, “for planning new protected areas for habitat conservation, migratory bird conservation and species at risk recovery”.
Obviously, the same indicators and data sets can be used for many purposes, with the presentation and interpretation of the indicator varying according to the purpose. The use of an indicator in a state of the environment report or other assessment may be to aid understanding of an issue and its significance. The same indicator may also inform policy‐making and the setting of priorities or targets, and then be used as measure of progress in reports on the implementation and impact of that policy.
Figure 20: Top uses of national ‘biodiversity’ indicators (proportion of top 3 uses from 56 questionnaire respondents)
0.24
0.280.18
0.20
0.090.01
Govt policy
SOE reports
National reports
MEA reports
Awareness
Other
38
Why and how are regional biodiversity indicators produced?
This section provides an overview on the purpose and development of indicators for biodiversity at the regional level for four regional indicator initiatives that have been established, with some conclusions from these initiatives.
Streamlining European 2010 Biodiversity Indicators
Reasons for the production of regional indicators
As a contracting Party of the CBD, in 1998 the European Union adopted the EU Biodiversity Strategy (EUBS), as a comprehensive response to the many requirements of the CBD. The European Union and its 27 Member States are contracting parties to the CBD and EU Heads of State and Government undertook in 2001 to halt the decline of biodiversity in the EU by 2010 and to restore habitats and natural systems. In 2002, they also joined some 130 world leaders in agreeing to significantly reduce the rate of biodiversity loss globally by 2010.
The Streamlining European 2010 Biodiversity Indicators (SEBI2010) initiative responds to the ‘Message of Malahide’ and the EU Council Conclusions of June 2004, which urged the European Commission to develop, test and finalize a first set of EU headline biodiversity indicators to monitor progress in reaching the 2010 biodiversity target. The process was launched in January 2005 to produce and develop consistency across global, regional, EU and national indicators to monitor progress towards the 2010 target (EEAa, 2007). SEBI 2010 has a pan‐European geographical coverage and developed capacity‐building in the region and across regions.
In 2003 the ‘Kyiv Resolution on Biodiversity’ (UNECE, 2003) was adopted at the fifth Ministerial Conference Environment for Europe (Kiev, Ukraine) reinforcing the objective to halt the loss of biological diversity at all levels by the year 2010. The ‘Message from Malahide’ was the main output of the Stakeholders’ Conference ‘Biodiversity and the EU – Sustaining Life, Sustaining Livelihoods’ that took place in Malahide, Ireland, in May 2004, under the Irish Presidency of the EU. The message referred to a set of biodiversity indicators which were based on the first set of indicators adopted at the CBD 7th Conference of the Parties in Kuala Lumpur in 2004. The same framework of 16 headline indicators was also adopted by the PEBLDS Council in 2005.
The Streamlining European 2010 Biodiversity Indicators (SEBI2010) initiative responds to the ‘Message of Malahide’ and the EU Council Conclusions of June 2004 which urged the European Commission to develop, test and finalize a first set of EU headline biodiversity indicators. The process was launched in January 2005 to produce and develop consistency across global, regional, EU and national indicators to monitor progress towards the 2010 target (EEAa, 2007).
Analytical and reporting frameworks used to guide the selection of the indicators
The set of indicators was grouped into subsets according to the CBD focal areas and was based on the comprehensive engagement of stakeholders: It began with the generation of over 140 possible indicators that by 2007 was reduced to 26. A set of eleven criteria were rigorously applied to all the proposed indicators. These criteria also proved useful in an evaluation of further indicators that have emerged in relation to biodiversity and climate change. Additional criteria were used to evaluate the indicator set as a whole:
Representative: the set of indicators provides a representative picture of the DPSIR chain.
Small in number: the smaller the total number of indicators, the easier it is to communicate cost‐effectively to policy‐makers and the public.
Aggregation and flexibility: aggregation should be facilitated on a range of scales.
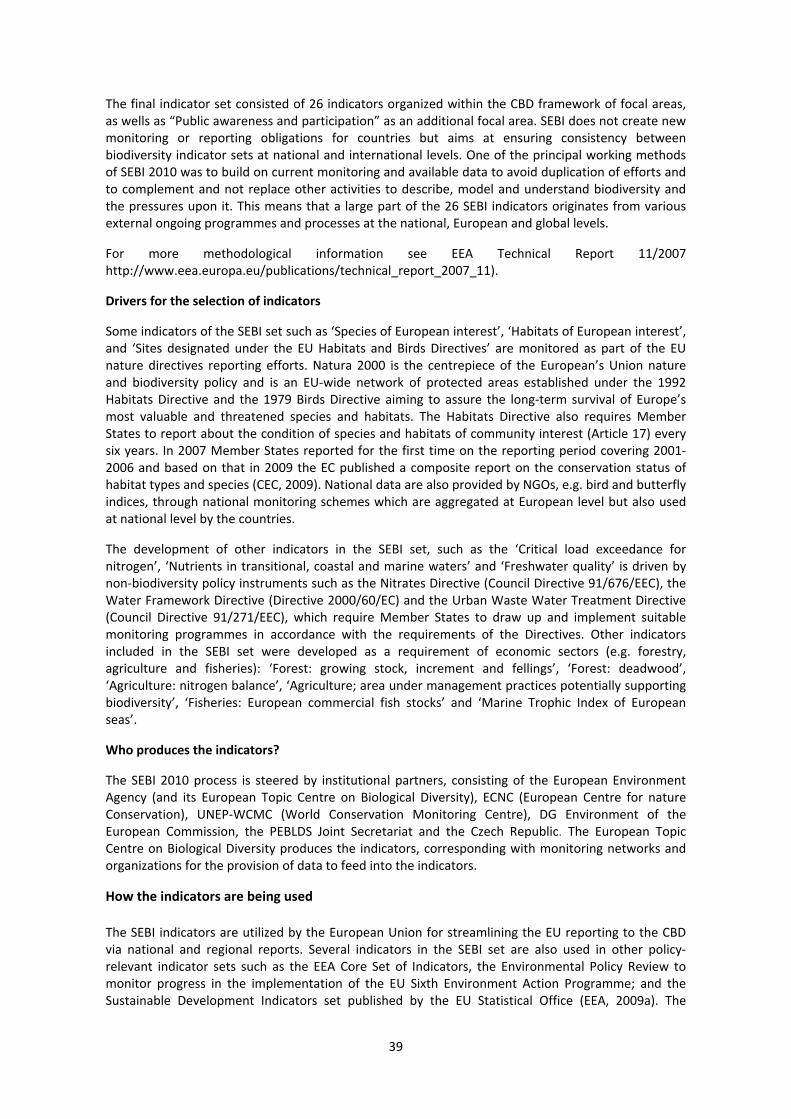
39
The final indicator set consisted of 26 indicators organized within the CBD framework of focal areas, as wells as “Public awareness and participation” as an additional focal area. SEBI does not create new monitoring or reporting obligations for countries but aims at ensuring consistency between biodiversity indicator sets at national and international levels. One of the principal working methods of SEBI 2010 was to build on current monitoring and available data to avoid duplication of efforts and to complement and not replace other activities to describe, model and understand biodiversity and the pressures upon it. This means that a large part of the 26 SEBI indicators originates from various external ongoing programmes and processes at the national, European and global levels.
For more methodological information see EEA Technical Report 11/2007 http://www.eea.europa.eu/publications/technical_report_2007_11).
Drivers for the selection of indicators
Some indicators of the SEBI set such as ‘Species of European interest’, ‘Habitats of European interest’, and ‘Sites designated under the EU Habitats and Birds Directives’ are monitored as part of the EU nature directives reporting efforts. Natura 2000 is the centrepiece of the European’s Union nature and biodiversity policy and is an EU‐wide network of protected areas established under the 1992 Habitats Directive and the 1979 Birds Directive aiming to assure the long‐term survival of Europe’s most valuable and threatened species and habitats. The Habitats Directive also requires Member States to report about the condition of species and habitats of community interest (Article 17) every six years. In 2007 Member States reported for the first time on the reporting period covering 2001‐2006 and based on that in 2009 the EC published a composite report on the conservation status of habitat types and species (CEC, 2009). National data are also provided by NGOs, e.g. bird and butterfly indices, through national monitoring schemes which are aggregated at European level but also used at national level by the countries.
The development of other indicators in the SEBI set, such as the ‘Critical load exceedance for nitrogen’, ‘Nutrients in transitional, coastal and marine waters’ and ‘Freshwater quality’ is driven by non‐biodiversity policy instruments such as the Nitrates Directive (Council Directive 91/676/EEC), the Water Framework Directive (Directive 2000/60/EC) and the Urban Waste Water Treatment Directive (Council Directive 91/271/EEC), which require Member States to draw up and implement suitable monitoring programmes in accordance with the requirements of the Directives. Other indicators included in the SEBI set were developed as a requirement of economic sectors (e.g. forestry, agriculture and fisheries): ‘Forest: growing stock, increment and fellings’, ‘Forest: deadwood’, ‘Agriculture: nitrogen balance’, ‘Agriculture; area under management practices potentially supporting biodiversity’, ‘Fisheries: European commercial fish stocks’ and ‘Marine Trophic Index of European seas’.
Who produces the indicators?
The SEBI 2010 process is steered by institutional partners, consisting of the European Environment Agency (and its European Topic Centre on Biological Diversity), ECNC (European Centre for nature Conservation), UNEP‐WCMC (World Conservation Monitoring Centre), DG Environment of the European Commission, the PEBLDS Joint Secretariat and the Czech Republic. The European Topic Centre on Biological Diversity produces the indicators, corresponding with monitoring networks and organizations for the provision of data to feed into the indicators.
How the indicators are being used
The SEBI indicators are utilized by the European Union for streamlining the EU reporting to the CBD via national and regional reports. Several indicators in the SEBI set are also used in other policy‐relevant indicator sets such as the EEA Core Set of Indicators, the Environmental Policy Review to monitor progress in the implementation of the EU Sixth Environment Action Programme; and the Sustainable Development Indicators set published by the EU Statistical Office (EEA, 2009a). The

40
European Commission has used the SEBI indicator set to support the mid‐term (2008) and final (2010) assessments of progress in implementing the EU Biodiversity Action Plan. The EU 2010 Biodiversity Baseline is based on SEBI indicators and methodological guidance. SEBI was also a stimulus and an example to regional‐regional cooperation; for example the recently launched ASEAN biodiversity outlook and the indicator capacity strengthening work undertaken in the BICS Africa project (EEA, 2010a, 2010b).
The SEBI 2010 initiative is a regional approach in which data collection occurs mostly at the regional level through a number of different monitoring programmes (highlighted above). A Consolidated Profile for the 2010 Assessment of Implementing the EU Biodiversity Action Plan (http://ec.europa.eu/environment/nature/biodiversity/comm2006/pdf/bap_2010/CONSOLIDATED%20PROFILE.pdf ) has shown the SEBI indicators to be of major use in reporting on implementation of the BAP. The number of member states using and reporting on the SEBI indicators for BAP implementation varies from indicator to indicator. However, the national uptake of SEBI indicators has increased and countries specifically mention SEBI as the source and inspiration for their national sets. ‘While SEBI 2010 is pan‐European in scope, some of the indicators specifically link to the EU policy framework that exists for the EU and its 27 Member States.’ The ECNC contribution on ‘National Indicators Monitoring and Reporting for Reporting for Global Targets’ (ETC/BD, 2009) highlighted in lessons learnt from the SEBI process that the potential for bottom‐up monitoring should be further investigated.
As well as utilising the SEBI indicators for reporting the majority of EU countries have developed their own biodiversity indicators. In some countries (Belgium, Czech Republic, France, Germany the Netherlands, Portugal and the UK) national indicator development has been aligned to the SEBI framework. Information by EU country on the use of the SEBI indicators and national indicators for reporting is available from the Biodiversity Information System for Europe website (http://biodiversity.europa.eu/countries_and_networks). SEBI was also a stimulus and an example to region to regional cooperation for the recently launched ASEAN biodiversity outlook report, as well as discussions on regional indicator production in the indicator capacity strengthening workshops undertaken in the BICSAfrica project (EEA, 2010a, 2010b).
A limitation in the use of the regional indicators for national reporting exists due to the fact that some of the SEBI indicators cannot be applied consistently throughout Member States (EEA, 2009b) and as such the ECNC contribution on ‘National Indicators Monitoring and Reporting for Reporting for Global Targets’ (ECNC, 2011) highlighted in lessons learnt from the SEBI process that the potential for
bottom‐up monitoring should be further investigated.
Circumpolar Biodiversity Monitoring Programme (CBMP)
Reasons for the production of regional indicators
In 2004, the Arctic Council released the Arctic Climate Impact Assessment (ACIA), a joint undertaking with the International Arctic Science Committee to evaluate and synthesize knowledge on trends and consequences related to climate variability, climate change, and increased ultraviolet radiation. A key recommendation of ACIA was to expand and enhance long‐term monitoring efforts in light of the global significance of Arctic biodiversity, increasing pressures on the region, and the limited capacity to monitor and understand changes that are occurring. In response to ACIA, the Arctic Council directed two of its working groups ‐ the Conservation of Arctic Flora and Fauna (CAFF) Working Group and Arctic Monitoring and Assessment Program—to examine the report's findings and develop follow—up programs to address key projections for the future of the Arctic.
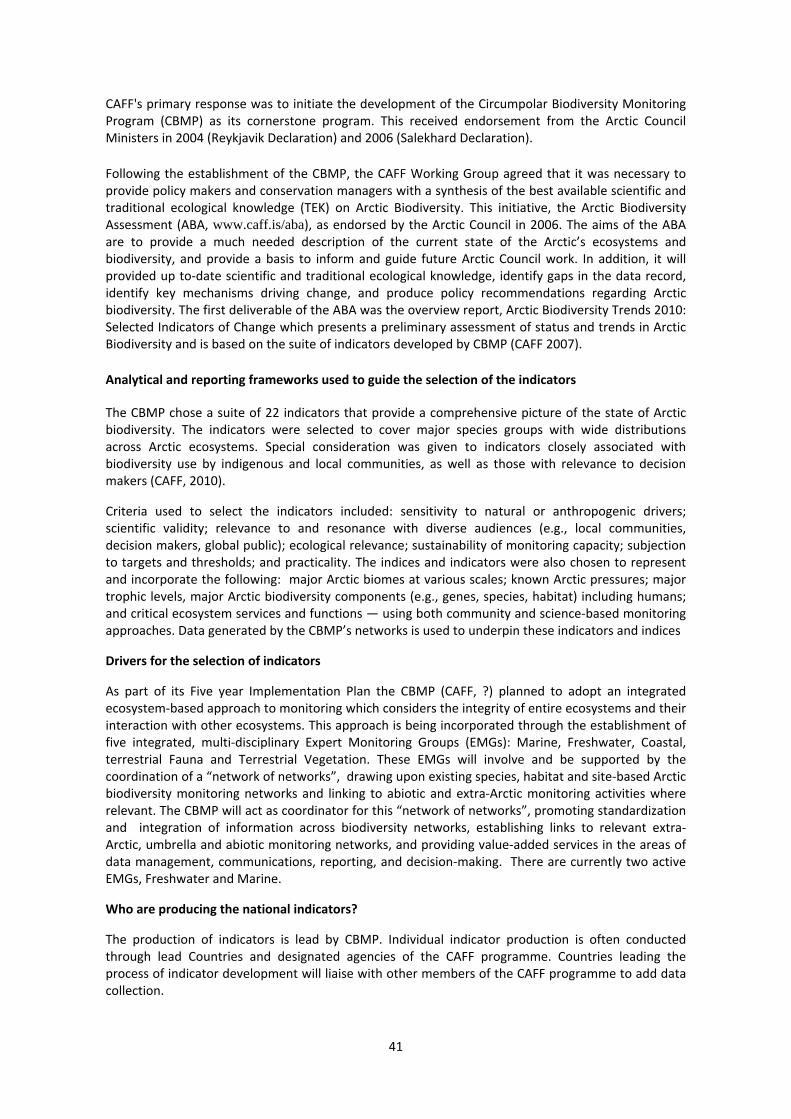
41
CAFF's primary response was to initiate the development of the Circumpolar Biodiversity Monitoring Program (CBMP) as its cornerstone program. This received endorsement from the Arctic Council Ministers in 2004 (Reykjavik Declaration) and 2006 (Salekhard Declaration).
Following the establishment of the CBMP, the CAFF Working Group agreed that it was necessary to provide policy makers and conservation managers with a synthesis of the best available scientific and traditional ecological knowledge (TEK) on Arctic Biodiversity. This initiative, the Arctic Biodiversity Assessment (ABA, www.caff.is/aba), as endorsed by the Arctic Council in 2006. The aims of the ABA are to provide a much needed description of the current state of the Arctic’s ecosystems and biodiversity, and provide a basis to inform and guide future Arctic Council work. In addition, it will provided up to‐date scientific and traditional ecological knowledge, identify gaps in the data record, identify key mechanisms driving change, and produce policy recommendations regarding Arctic biodiversity. The first deliverable of the ABA was the overview report, Arctic Biodiversity Trends 2010: Selected Indicators of Change which presents a preliminary assessment of status and trends in Arctic Biodiversity and is based on the suite of indicators developed by CBMP (CAFF 2007).
Analytical and reporting frameworks used to guide the selection of the indicators
The CBMP chose a suite of 22 indicators that provide a comprehensive picture of the state of Arctic biodiversity. The indicators were selected to cover major species groups with wide distributions across Arctic ecosystems. Special consideration was given to indicators closely associated with biodiversity use by indigenous and local communities, as well as those with relevance to decision makers (CAFF, 2010).
Criteria used to select the indicators included: sensitivity to natural or anthropogenic drivers; scientific validity; relevance to and resonance with diverse audiences (e.g., local communities, decision makers, global public); ecological relevance; sustainability of monitoring capacity; subjection to targets and thresholds; and practicality. The indices and indicators were also chosen to represent and incorporate the following: major Arctic biomes at various scales; known Arctic pressures; major trophic levels, major Arctic biodiversity components (e.g., genes, species, habitat) including humans; and critical ecosystem services and functions — using both community and science‐based monitoring approaches. Data generated by the CBMP’s networks is used to underpin these indicators and indices
Drivers for the selection of indicators
As part of its Five year Implementation Plan the CBMP (CAFF, ?) planned to adopt an integrated ecosystem‐based approach to monitoring which considers the integrity of entire ecosystems and their interaction with other ecosystems. This approach is being incorporated through the establishment of five integrated, multi‐disciplinary Expert Monitoring Groups (EMGs): Marine, Freshwater, Coastal, terrestrial Fauna and Terrestrial Vegetation. These EMGs will involve and be supported by the coordination of a “network of networks”, drawing upon existing species, habitat and site‐based Arctic biodiversity monitoring networks and linking to abiotic and extra‐Arctic monitoring activities where relevant. The CBMP will act as coordinator for this “network of networks”, promoting standardization and integration of information across biodiversity networks, establishing links to relevant extra‐Arctic, umbrella and abiotic monitoring networks, and providing value‐added services in the areas of data management, communications, reporting, and decision‐making. There are currently two active EMGs, Freshwater and Marine.
Who are producing the national indicators?
The production of indicators is lead by CBMP. Individual indicator production is often conducted through lead Countries and designated agencies of the CAFF programme. Countries leading the process of indicator development will liaise with other members of the CAFF programme to add data collection.

42
How the indicators are being used
An indicator report was published in 2010 entitled Arctic Biodiversity Trends 2010 – Selected indicators of change (CAFF, 2010). The indicators are produced and communicated through the CBMP website and reporting in order to communicate with a wide range of audiences including communities and regional management bodies and are not being used for any official reporting mechanisms and. The indicators are not being disaggregated by country.
NordBio2010
Reasons for the production of regional indicators
In 2005, Nordic countries adopted the EU target to ‘halt the loss of biodiversity by 2010’ and this was given emphasis in both the Nordic Environmental Action Plan 2005‐2008 (Nordic Council of Ministers, 2005) and in the Nordic Sustainable Development report (Nordic Council of Ministers, 2004). In March 2006 a workshop was held in Denmark to discuss how the 2010 Biodiversity target could be evaluated in a Nordic context (Normander et al, 2006). It was agreed that enough biodiversity data exist in the Nordic countries to develop indicators and possibly even a composite index that can describe the present state of the historical development of biodiversity. However, aggregation and harmonisation of the various datasets as well as discrepancies in the different nature monitoring programmes would have to be addressed.
Following the workshop, the project Nordic Biodiversity Indicators 2010 (NordBio2010) was launched. NordBio2010 was commissioned by the Nordic Council of Ministers and led by the Natural Environmental Research Institute of Denmark. Other national research institutes involved in the work are the Norwegian Institute for Nature Research, the Norwegian Forest and Landscape Institute, the Finnish Environment Institute, the Swedish University of Agricultural Sciences and the Icelandic Institute of Natural History.
Analytical and reporting frameworks used to guide the selection of the indicators
The NordBio2010 initiative developed a simple concept to clarify the use of biodiversity indicators; a concept that can describe both the quantity and quality dimensions of biodiversity (Normander et al. 2009). The concept selected was in parallel to the concept of the Natural Capital Index (ten Brink 2000). Changes in quantity are measured as trends in the area of pre‐defined habitats or ecosystems (such as forest, grassland or inland water bodies). Changes in quality are measured as species abundance trends, when applicable, as other habitat quality parameters, such as trends in the proportion of old trees in forests or grazing pressure on grasslands.
The indicator framework builds on a habitat classification that covers all major habitat types in the Nordic countries. Species and Habitat Indicator are selected per habitat depending on the availability of data. For example for constructed habitats four species and one habitat indicator was proposed whilst for forest habitat 11 species and five habitat indicators were proposed.
Drivers for the selection of indicators
The indicators are still in the development stage, however it is envisioned that data for the indicators will be obtained from available monitoring programmes, databases and research articles.
How the indicators are being used
The indicators are still in the development stage, however the baseline information including trends is presented the report, State of biodiversity in the Nordic countries ‐An assessment of progress towards achieving the target of halting biodiversity loss by 2010.
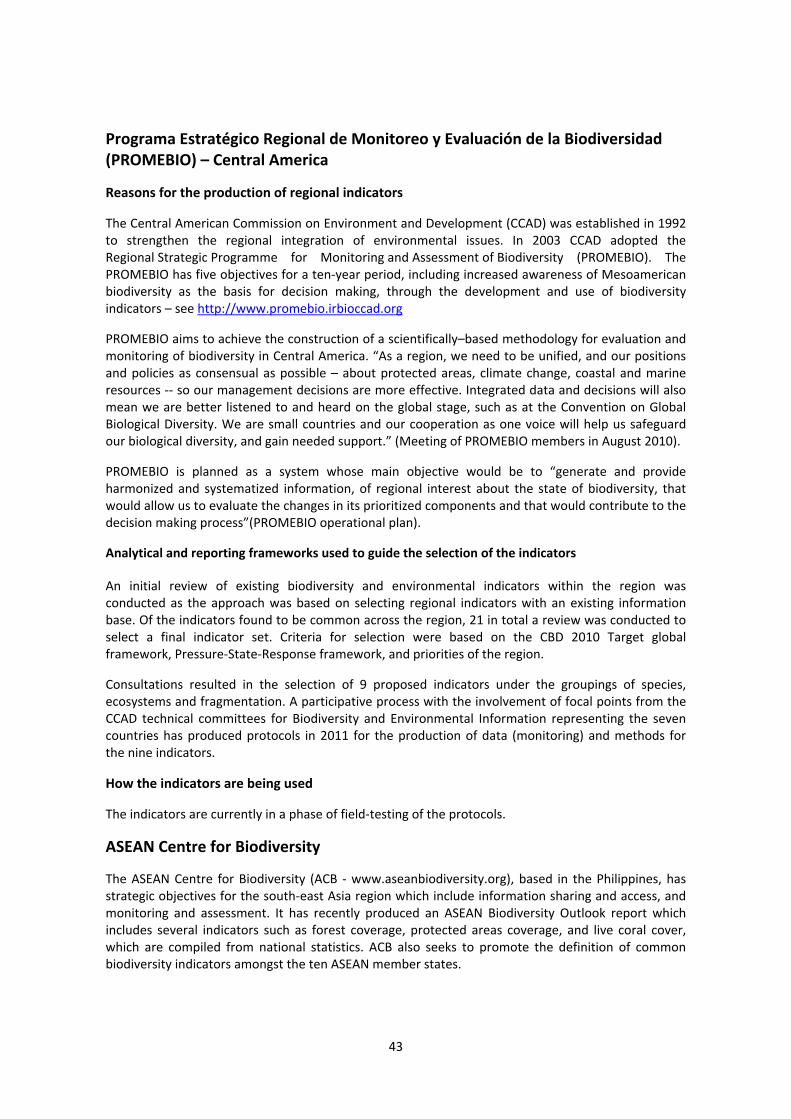
43
Programa Estratégico Regional de Monitoreo y Evaluación de la Biodiversidad (PROMEBIO) – Central America
Reasons for the production of regional indicators
The Central American Commission on Environment and Development (CCAD) was established in 1992 to strengthen the regional integration of environmental issues. In 2003 CCAD adopted the Regional Strategic Programme for Monitoring and Assessment of Biodiversity (PROMEBIO). The PROMEBIO has five objectives for a ten‐year period, including increased awareness of Mesoamerican biodiversity as the basis for decision making, through the development and use of biodiversity indicators – see http://www.promebio.irbioccad.org
PROMEBIO aims to achieve the construction of a scientifically–based methodology for evaluation and monitoring of biodiversity in Central America. “As a region, we need to be unified, and our positions and policies as consensual as possible – about protected areas, climate change, coastal and marine resources ‐‐ so our management decisions are more effective. Integrated data and decisions will also mean we are better listened to and heard on the global stage, such as at the Convention on Global Biological Diversity. We are small countries and our cooperation as one voice will help us safeguard our biological diversity, and gain needed support.” (Meeting of PROMEBIO members in August 2010).
PROMEBIO is planned as a system whose main objective would be to “generate and provide harmonized and systematized information, of regional interest about the state of biodiversity, that would allow us to evaluate the changes in its prioritized components and that would contribute to the decision making process”(PROMEBIO operational plan).
Analytical and reporting frameworks used to guide the selection of the indicators
An initial review of existing biodiversity and environmental indicators within the region was conducted as the approach was based on selecting regional indicators with an existing information base. Of the indicators found to be common across the region, 21 in total a review was conducted to select a final indicator set. Criteria for selection were based on the CBD 2010 Target global framework, Pressure‐State‐Response framework, and priorities of the region.
Consultations resulted in the selection of 9 proposed indicators under the groupings of species, ecosystems and fragmentation. A participative process with the involvement of focal points from the CCAD technical committees for Biodiversity and Environmental Information representing the seven countries has produced protocols in 2011 for the production of data (monitoring) and methods for the nine indicators.
How the indicators are being used
The indicators are currently in a phase of field‐testing of the protocols.
ASEAN Centre for Biodiversity
The ASEAN Centre for Biodiversity (ACB ‐ www.aseanbiodiversity.org), based in the Philippines, has strategic objectives for the south‐east Asia region which include information sharing and access, and monitoring and assessment. It has recently produced an ASEAN Biodiversity Outlook report which includes several indicators such as forest coverage, protected areas coverage, and live coral cover, which are compiled from national statistics. ACB also seeks to promote the definition of common biodiversity indicators amongst the ten ASEAN member states.
44
Conclusions
If the technical compilation and reporting of regional indicators is conducted by one agency, as for the SEBI2010 the indicators, this can aid the efficient production of a coherent and successful regional indicator suite. The selection process for the choice of indicators may act as a catalyst for national indicator development and this was found to be true of the SEBI processes.
The SEBI, CBMP and NordBio regional indicator initiatives mostly produce biodiversity indicators in response to regional needs and decision processes. As a result, countries tend to produce their own indicators in response to national management objectives and targets, with limited linkages to the regional process. The PROMEBIO is designed to promote standardisation and sharing of national indicator production to enable a regional perspective and actions.
References
CAFF . 2008. CBMP Five‐Year Implementation Plan. Developing an Integrated and Sustained Arctic Biodiversity Monitoring Network. Supporting Publication to the Circumpolar Biodiversity Monitoring Program Framework Document . CAFF http://cbmp.arcticportal.org/images/stories/pdf/low_res_5‐year_plan_cbmp_implementation_plan.pdf
CAFF. 2007. The Arctic Biodiversity Assessment, Work Plan and Financial Strategy. http://caff.arcticportal.org
CAFF. 2010. Arctic Biodiversity Trends 2010 – Selected indicators of change. CAFF. International Secretariat, Akureyi, Iceland http://www.arcticbiodiversity.is/index.php/en/the‐report
CEC, 2006. Communication form the Commission. Halting the loss of biodiversity by 2010 — and beyond. Sustaining ecosystem services for human well–being. COM(2006) 216 final. Commission of the European Communities, Brussels. http://eur‐lex.europa.eu/LexUriServ/LexUriServ.do?uri=COM:2006:0216:FIN:EN:PDF
CEC, 2009. Report from the Commission to the Council and the European Parliament. Composite report on the Conservation Status of Habitat Types and Species as required under Article 17 of the Habitats Directive. COM(2009) 358 final. Commission of the European Communities, Brussels. http://ec.europa.eu/environment/nature/knowledge/rep_habitats/docs/com_2009_358_en.pdf
ETC/BD, 2009. A survey of existing scientific or policy targets relevant for each SEBI indicator among global, European and national initiatives. prepared by ECNC.
EEA, 2010a. Assessing biodiversity in Europe — the 2010 report’: http://www.eea.europa.eu/publications/assessing‐biodiversity‐in‐europe‐84
EEA, 2010b. EU 2010 Biodiversity Baseline: http://www.eea.europa.eu/publications/eu‐2010‐biodiversity‐baseline
EEA, 2007. Halting the loss of biodiversity by 2010: proposal for a first set of indicators to monitor progress in Europe. EEA Technical report No 11/2007. EEA, Copenhagen. http://www.eea.europa.eu/publications/technical_report_2007_11
EEA, 2007b. Europe’s Environment – The fourth assessment. EEA, Copenhagen. http://www.eea.europa.eu/publications/state_of_environment_report_2007_1
EEA, 2009a. Progress towards the European 2010 biodiversity target. EEA Report No 4/2009. EEA, Copenhagen. http://www.eea.europa.eu/publications/progress‐towards‐the‐european‐2010‐biodiversity‐target

45
EEA, 2009b. Progress towards the European 2010 biodiversity target – indicator fact sheets. Compendium to EEA Report No 4/2009. EEA Report No 5/2009. EEA, Copenhagen. http://www.eea.europa.eu/publications/progress‐towards‐the‐european‐2010‐biodiversity‐target‐indicator‐fact‐sheets
EEA, 2010a. Assessing biodiversity in Europe — the 2010 report’: http://www.eea.europa.eu/publications/assessing-biodiversity-in-europe-84
EEA, 2010b. EU 2010 Biodiversity Baseline: http://www.eea.europa.eu/publications/eu-2010-biodiversity-baseline
UNECE, 2003. Fifth Ministerial Conference Environment for Europe. Kiev, Ukraine 21‐23 May 2003. Kyiv resolution on Biodiversity. Submitted by the Council of the Pan‐European Biological and Landscape Strategy through the Ad Hoc Working Group of Senior Officials. http://www.peblds.org/files/meetings/kyiv_biodiv_resolution_e.pdf
EEA, 2007b. Europe’s Environment – The fourth assessment. EEA, Copenhagen. http://www.eea.europa.eu/publications/state_of_environment_report_2007_1
Nordic Council of Ministers. 2004. Sustainable Development ‐ New Bearings for the Nordic Countries. TemaNord 2004:568.
Nordic Council of Ministers. 2005. Nordic Environmental Action Plan 2005–2008. ANP 2005:714.
Normander B, Glimskär A, Stabbetorp O, Auvinen A‐P, Levin G, Gudmundsson GA. 2006. Aggregation of indicators for biological diversity in the Nordic countries. TemaNord 2006:554. Nordic Council of Ministers.
Normander B., Levin, G., Auvinen, A‐P., Bratli, H., Stabbetorp, O., Hedblom, M., Glimskär, A. and Gudmundsson, G.A. 2009. State of biodiversity in the Nordic countries. An assessment of progress towards achieving the target of halting biodiversity loss by 2010. TemaNord 2009:50. http://www.norden.org/en/publications/publications/2009‐509/at_download/publicationfile
Ten Brink, B. 2000. Biodiversity indicators for the OECD Environmental Outlook and Strategy. RIVM, The Netherlands.

46
6. CONSTRAINTS IN DEVELOPING BIODIVERSITY TARGETS AND INDICATORS, AND ASSOCIATED MONITORING AND REPORTING SYSTEMS
Constraints in developing national targets for biodiversity
Lack of targets in NBSAPs
A recent assessment of NBSAPs15 concluded that, “it is striking that, despite recent strong calls to set time‐bound and measurable national biodiversity targets and the many COP decisions to this effect, very few new NBSAPs include such targets. Of forty NBSAPs developed or revised since 2004, only those of Germany, South Africa, and Liberia have included a system of measurable and quantitative targets, while those of Palau and Mauritius have included such targets for protected area coverage. Some countries, such as Austria, Brazil and Canada have adopted targets outside the framework of a stand‐alone NBSAP document, but nevertheless as part of an overall biodiversity planning framework.” Protected areas coverage is one of the few issues for which a number of countries have set quantitative targets. The NBSAP assessment also found that a few countries have adopted biodiversity targets within existing environmental planning processes, rather than producing an NBSAP, such as in Sweden. The BIP capacity building workshops encouraged countries to develop biodiversity indicators in support of existing management objectives and targets. However, a conclusion of the workshops was that only rarely are there measurable or quantifiable national targets relevant to biodiversity. One example of the impact of such targets and associated indicators is in South Africa, which has an NBSAP target that by 2020 its protected areas network will cover 12% of the terrestrial environment. Development in 2010 of an indicator for the target found that the country had 6% of terrestrial areas under protection, which resulted in the allocation of additional funding for the creation of Provincial Nature Reserves.
Lack of integration of NBSAPs within Millennium Development Goal Reports
The assessment of NBSAPs also compared developing countries’ Millennium Development Goal Reports (MDGRs) with NBSAPs in regard to target setting, finding a “generally weak alignment” between the two. Twenty‐three countries had reported that they had targets for forests and twenty‐two for protected areas in their MDGRs, though these were not always quantitative and time‐bound. Of the seven countries that have reported quantitative and time‐bound targets for protected areas in their MDGRs, only one (Viet Nam) has included a similar target in its NBSAP. Similarly, for quantitative and time‐bound targets for forest cover, only one country (South Africa) out of twelve who have reported targets in their MDGRs has a corresponding target in their NBSAP. This indicates a weak role that NBSAPs have often had in national development policy to date.
Targets as part of policy processes
The Strategic Plan for Biodiversity 2011‐2020 urges Parties to develop national and regional targets, including within the framework of the twenty headline Aichi targets for 2020. This renewed emphasis on the setting of national targets is likely to be a new and sometimes challenging way of implementing the Convention for many Parties. Coverage of forests and protected areas are two topics for which a significant number of countries have established targets, but there are very few examples of national targets for the much wider range of issues in the Strategic Plan for Biodiversity
15 Prip, C; Gross, T; Johnston, S; Vierros, M (2010). Biodiversity Planning: an assessment of national
biodiversity strategies and action plans. United Nations University Institute of Advanced Studies, Yokohama, Japan.
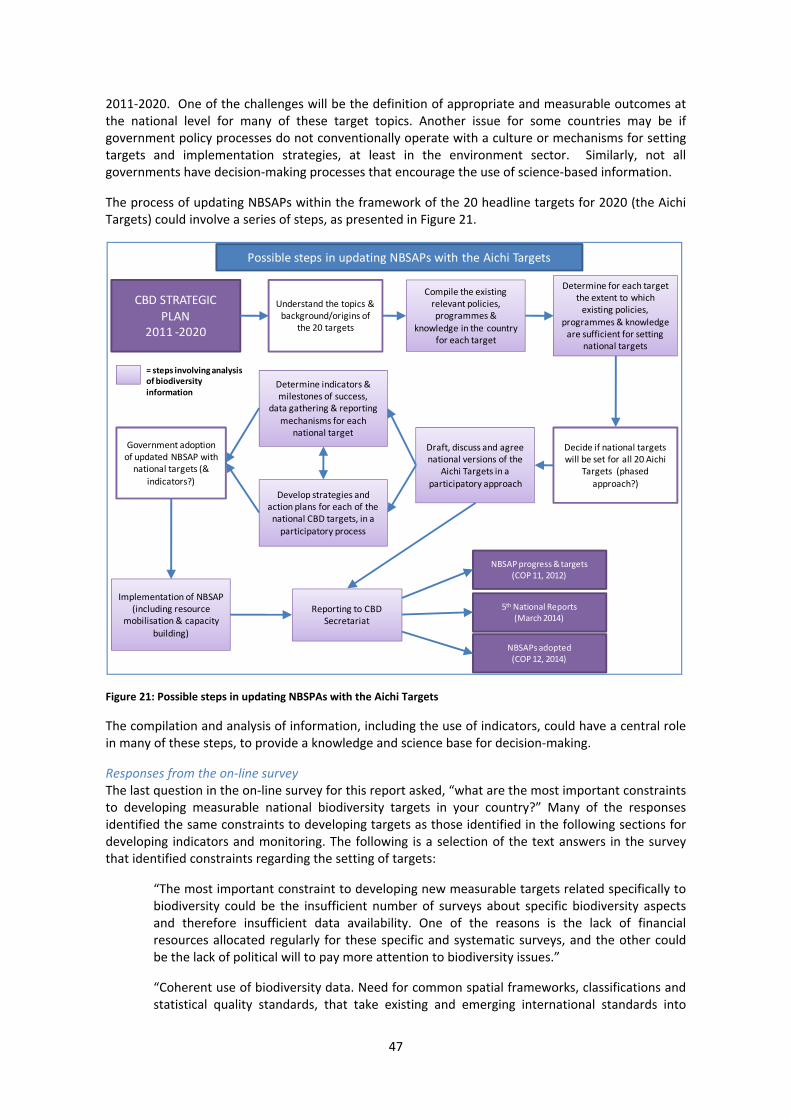
47
2011‐2020. One of the challenges will be the definition of appropriate and measurable outcomes at the national level for many of these target topics. Another issue for some countries may be if government policy processes do not conventionally operate with a culture or mechanisms for setting targets and implementation strategies, at least in the environment sector. Similarly, not all governments have decision‐making processes that encourage the use of science‐based information.
The process of updating NBSAPs within the framework of the 20 headline targets for 2020 (the Aichi Targets) could involve a series of steps, as presented in Figure 21.
Figure 21: Possible steps in updating NBSPAs with the Aichi Targets
The compilation and analysis of information, including the use of indicators, could have a central role in many of these steps, to provide a knowledge and science base for decision‐making.
Responses from the on‐line survey The last question in the on‐line survey for this report asked, “what are the most important constraints to developing measurable national biodiversity targets in your country?” Many of the responses identified the same constraints to developing targets as those identified in the following sections for developing indicators and monitoring. The following is a selection of the text answers in the survey that identified constraints regarding the setting of targets:
“The most important constraint to developing new measurable targets related specifically to biodiversity could be the insufficient number of surveys about specific biodiversity aspects and therefore insufficient data availability. One of the reasons is the lack of financial resources allocated regularly for these specific and systematic surveys, and the other could be the lack of political will to pay more attention to biodiversity issues.”
“Coherent use of biodiversity data. Need for common spatial frameworks, classifications and statistical quality standards, that take existing and emerging international standards into
CBD STRATEGIC PLAN
2011 ‐2020
Understand the topics & background/origins of
the 20 targets
Compile the existing relevant policies, programmes &
knowledge in the country for each target
Determine for each target the extent to which existing policies,
programmes & knowledge are sufficient for setting
national targets
Decide if national targets will be set for all 20 Aichi
Targets (phased approach?)
Determine indicators & milestones of success,
data gathering & reporting
mechanisms for each national target
Draft, discuss and agree national versions of the
Aichi Targets in a participatory approach
Develop strategies and action plans for each of the national CBD targets, in a participatory process
Government adoption of updated NBSAP with national targets (&
indicators?)
Implementation of NBSAP (including resource
mobilisation & capacity
building)
Reporting to CBD Secretariat
NBSAPs adopted(COP 12, 2014)
5th National Reports(March 2014)
NBSAP progress & targets(COP 11, 2012)
Possible steps in updating NBSAPs with the Aichi Targets
= steps involving analysis of biodiversity information

48
account Need for more coherent information management approaches including common and accessible storage for use by calibrators. A need for joint research on emerging topics such as ecosystem valuation (in collaboration with other international and national efforts).”
“Inaccessibility and availability of quality data. Most institutions had stopped collecting data, hence most data had either very big gaps and unreliable or just baseline database. Another constraint was lack of cooperation among stakeholders.”
“Establishing biological thresholds. Establishing what is normal variation. Difficulty in implementing a national biodiversity monitoring scheme across a vast and diverse region.”
“Lack of political will. Biodiversity is seen as a cost rather than an asset.”
“1 ‐ Lack of government funding. 2 ‐Insufficient coordination among different government agencies, academic and research institutions. 3 ‐ Shortage of technical manpower in the implementing agencies. 4 ‐ Conserving biodiversity is not a priority.”
“CBD issues have very low priority in governmental policy (both in financial and social policy). Targets are currently rather for resource use based and targeted to economical growth ‐ balance and sustainability are not issues in reality (although they are written into several documents).”
“Political will, from which all else flows. If the state made it a priority, we'd all organize a meeting or three, get all interested institutions to sign on, and set up the necessary plots and administrative networks and devote time to organizing baselines and protocols. It is all just ad‐hoc at the moment, with small projects started and then dropped as funding moves elsewhere.”
“Lack of logistical and financial help and time for the institutions and individuals that can do this.”
“Data (availability and accessibility, accuracy, format, and the capacity to transform the data); Weak environmental information management systems; ‐Institutional capacity ‐Poor Institutional coordination and collaboration; ‐Funding for both data collection and stakeholder consultations; ‐Low levels of scientific expertise in specialised area such as taxonomy, GIS, remote sensing.” “Policymaking in consensus between sectors.”
“Difficulty in consultation and negotiation process with related sector and stakeholders for developing national targets.”
“Financial resources, capacity development, technical case studies applicable to the national and subregional reality.”
Constraints in developing indicators
The questionnaire for this report asked respondents to rank the main constraints for producing national indicators for implementation of the CBD, with six options plus ‘other’. Twenty‐five respondents without national indicators answered the question, and 56 respondents with national indicators did so. The results were very similar for both groups and the combined result for 81 respondents is presented in Figure 22 as the proportion of the total scores for each option weighted by the respondent’s ranking values.

49
Figure 22: Main constraints to producing indicators for implementation of the CBD – 81 respondents with or without national indicators. Seven options ranked and weighed by importance.
All six of the constraints presented in the questionnaire received a significant ranking, but ‘Suitable data is absent or inaccessible’, ‘Technical and institutional capacity’, and ‘Finance issues’ were the most significant and each had about 20% of the ranking values.
Lack of suitable data for indicators The lack of suitable data for indicators, including the inaccessibility of data that may exist, is probably the most widespread problem in producing biodiversity indicators. This situation was consistently found in the 45 countries that participated in the 2010 BIP capacity building workshops. A common constraint is that data may only exist for a short time period, as a result of a study or one‐off survey, rather than from a monitoring programme designed to produce comparable data for identifying trends. The question on data sources in the on‐line survey for this report found that only 15% of the ranked values were for data from monitoring systems developed for biodiversity indicators. The inaccessibility of data for use in indicators is also a common problem. Since many biodiversity indicators are developed from data produced by other sectors, such as forestry or fisheries, or by institutions other than the producer of the indicator, then obtaining their permission and collaboration can require a significant investment.
“One of the biggest challenges to date has been securing the data needed in formats that facilitate the development of the indicator or index. It involves developing close relationships with multiple researchers and organisations and continual communication to develop a trusting relationship”. Mike Gill, Circumpolar Biodiversity Monitoring Program (CBMP)16.
Two questionnaire respondents commented:
“Most data available has been produced through external funding which may have objectives other than biodiversity indicators and student work”.
“Indicators are ad hoc in nature, based on the need to meet reporting requirements.”
The former leader of SANBI’s Biodiversity Monitoring framework said that one the biggest challenges was that, “although we found there was a huge amount of data out there, almost too much, it was not very conducive to calculating indicators. Often data sets were only collected once, or were collected at a very localized scale. Even when one found data sets available at regular, or any, time
16 Interviewed for the bipnational.net website
0.13
0.15
0.19
0.18
0.20
0.11
0.03No agency has a responsibility for production or co‐ordination of such national indicators
Insufficient demand from government for such indicators
Suitable data is absent or inaccessible
Technical and institutional capacity
Finance issues
Lack of guidance about the expectations of the CBD and other Conventions regarding indicators
Other

50
intervals on a national scale, they often did not have enough metadata to make them easily usable. It was often a long process of meetings with the data producers before a good enough understanding was built up to actually use the data.”17
Technical and institutional capacity The high ranking of the constraint of ‘technical and institutional capacity’ in the questionnaire is also consistent with the findings of the BIP capacity building workshops. Even if a country has the institutional capacity of at least one person with the responsibility of co‐ordinating the gathering and communication of biodiversity information, the technical capacity and skills they should have for producing biodiversity indicators include:
a science‐based understanding of the biodiversity issue of interest, understanding the scientific and statistical strengths and weaknesses of the data being used,
a basic competency in the processing of data to produce graphs and maps, etc. with a scientific and statistical validity,
writing and presentation skills to communicate the indicator results to the intended users. Finance issues and insufficient demand from government The constraint of ‘finance issues’ is also a frequent and fundamental problem in the production of biodiversity indicators, and not only for developing countries. This is probably linked to the constraint of, “insufficient demand from government for such indicators”, which was ranked fourth in the questionnaire. The participants in the 2010 BIP capacity building workshops in eastern and southern Africa found in many cases that there was very little awareness or use of biodiversity indicators at all levels of government and society. In some cases the whole concept of consistently gathering and reporting scientifically‐based biodiversity information to support decision‐making was new. Even for a country with some established national biodiversity indicators, such as South Africa, building awareness and support is necessary. The former leader of SANBI’s Biodiversity Monitoring framework said that the biggest achievement of their indicators initiative was, “to build buy‐in to the concept of indicators, and that they can be useful, even if they are not perfect.”18
Lack of responsibility for indicator production or co‐ordination The fifth ranked constraint of, ‘No agency has a responsibility for production or co‐ordination of such national indicators’, was also identified as a key obstacle to progress in many of the 2010 BIP capacity building workshops. Without at least one position or person who has the responsibility for the co‐ordination and reporting of national biodiversity information, including indicators, it is very difficult for decision‐makers and other stakeholders to be aware of and support biodiversity issues and the related information requirements. One questionnaire respondent commented:
“No one organisation is responsible nationally for the areas covered by the biodiversity headline indicators. It is therefore difficult to collate the information, particularly as data is required nationally, at an EU level (e.g. EUBAP), at a PAN EU level (SEBI) and globally (CBD) ‐ all with slight variations in timing and reporting requirements”.
Lack of appropriate guidance on expectations from Conventions The least ranked constraint was, “Lack of guidance about the expectations of the CBD and other Conventions regarding indicators”. One questionnaire respondent commented:
“Sometimes the guidance from CBD could be too demanding (i.e. difficult to get such information, too ideal, too academic, etc). In these situations, adapted versions are used”.
17 Interviewed for the bipnational.net website 18 Interviewed for the bipnational.net website

51
Constraints in developing biodiversity monitoring
Monitoring can be defined as the repeated collection of information over time in order to detect changes in one or more variables, and one use of indicators is as communication products to summarise and help interpret the results of monitoring. Whilst many indicators relevant to biodiversity conservation can be produced from data gathered for other purposes, there is usually a need to have some monitoring systems established for the needs of important biodiversity indicators.
There is very little specific information in the 4th national reports to the CBD on the existence of monitoring systems or relevant constraints, but the finding that only 58 of 159 reports include at least one indicator with evidence would imply that most countries do not have any established long‐term biodiversity monitoring. Similarly, the most frequently reported constraint to producing biodiversity indicators is the lack of suitable data for indicators.
Some countries have monitoring systems or conduct surveys for species of importance, but the information is not regularly analysed and communicated in the form of indicators. For example, the BIP capacity building workshop in eastern and southern Africa found that some countries had significant data sets from wildlife surveys, but the results were not being made easily available to decision‐makers. In one case the challenge was to develop a database of survey results to support the analyses and production of indicators.
In countries without biodiversity indicators and monitoring systems the challenge can be that biodiversity issues are not considered important enough to fund information gathering for decision‐making, but without this information it is difficult to demonstrate the importance of biodiversity issues.
In Europe there are several Europe‐wide monitoring networks (listed in Annex 2), and national and sub‐national monitoring schemes have been developed by many countries. In many cases inventories are conducted in the frame of on‐going research projects or at the request of regional governmental administrations or agencies, with little coordinated information available at national level. Other countries implement monitoring programmes at national level, integrating data collected by various scientific institutes, protected areas, expert agencies and NGOs under the coordination of the Ministry of Environment/Environmental Protection Agency. In other countries biodiversity monitoring is carried out by private data‐managing organizations that work at national level. They are supported by a variety of public and private institutions and organize the data collected mainly by NGOs and volunteers.
NGOs can have an important role in the establishment of monitoring systems for popular species and groups. In Europe, for example, birds and butterflies have significant popularity and consistent monitoring is linked to considerable volunteer effort. The BirdLife International Important Bird Area (IBA) monitoring programme is designed to support volunteer monitoring of indicators of state, pressures and conservation responses at IBAs around the world.
Lessons identified by ECNC for this study from existing biodiversity‐relevant monitoring schemes in Europe are:
resources for long‐term monitoring are often scarce;
a centrally coordinated and funded monitoring scheme should be given a level of priority;
highly motivated NGOs linked to popular species and groups can deliver extremely cost‐effective monitoring effort but need long term contractual arrangement and support from governments;
indicators linked to economic sectors are likely to have wide coverage and active monitoring but data access and information sharing need to be facilitated;
indicators must be based on data that is routinely collected, clearly defined, verifiable and scientifically acceptable, using standardised and consistently applied measurement methods;
some indicators cannot be applied consistently throughout the Member States;
the potential for bottom‐up monitoring should be further investigated and combined with top‐down effort.

52
Constraints in developing biodiversity reporting
The review of 4th national reports to the CBD for this study found very few specific references to information constraints encountered in the production of the reports, although some Parties did cite a lack of indicators and monitoring capacity. Many developing country Parties contracted consultants to produce their CBD national reports, which suggest a lack of government capacity for this task. In addition to reports for the CBD many countries in Europe and a few countries in other regions have produced reports and websites for their biodiversity indicators, and these are listed in Annex 3.
Previous reviews of national reporting to the biodiversity‐related conventions have identified a number of key constraints to successful national reporting to conventions19:
The purpose of national reporting needs to be explained and understood. This includes information on the use that convention bodies make of the reported information, and the options for Parties to use reported information in identifying obstacles to, and setting priorities, for implementation, reviewing their targets and measures, as well as communicating successes in Convention implementation to a wider public.
National reporting is an outcome of convention implementation and not a stand‐alone exercise. As such, reporting depends on the availability and accessibility of data and information related to implementation.
National reporting benefits from an inclusive participatory approach. The quality of national reports will be improved by involving key stakeholders in the reporting process, such as relevant government departments and agencies, indigenous and local communities, NGOs, the business and the research sectors as well as by integrating information from reporting to biodiversity‐related conventions and from reporting on mainstreaming.
Clear guidance for national reporting is required; a good example is provided by the reference manual and the regional workshops that the CBD Secretariat provided for the 4th national reports. Streamlined enabling tools need to be developed and streamlined to facilitate reporting (e.g. web applications).National reporting requires sufficient funding, which could be used not only for the compilation of the required information but also for improving the data accessibility and the inclusion of stakeholders in the reporting process.
Convention bodies need to provide feedback on national reports in the form of analyses of the information reported by Parties and integration in their assessments.
19 UNEP World Conservation Monitoring Centre (2005). A review of the national reporting systems of
the five global biodiversity‐related conventions. UNEP‐WCMC, Cambridge, UK. http://www.unep‐wcmc.org/conventions/harmonization/Review_of_reporting_synthesis_17.10.05.pdf
UNEP World Conservation Monitoring Centre (2009). Preconditions for harmonization of reporting to biodiversity‐related multilateral environmental agreements. Cambridge, UK. UNEP/CBD/WG‐RI/3/INF/10.

53
7. OPTIONS TO SUPPORT PARTIES IN DEVELOPING TARGETS AND INDICATORS, AND ASSOCIATED MONITORING AND REPORTING, FOR IMPLEMENTATION OF THE 20112020 STRATEGIC PLAN
The options and issues presented in this section of the report have been identified in response to the constraints, successes and lessons identified in the Results section of this report, including the results of the on‐line survey for this report, as well as the capacity building experience of UNEP‐WCMC and the 2010 BIP. Results of the on‐line survey In the on‐line survey 102 respondents ranked six options in answer to the question, “In addition to increased funding, what are the most important ways international assistance could support developing CBD targets, indicators, and associated monitoring and reporting?”. The results ranked all
six options with a similar importance (Figure 23), and the options can be seen as complementary. In‐country capacity building workshops for the process of developing targets and indicators was one of the highest ranked ways for international assistance to be provided, and regional capacity‐building and exchange workshops was ranked as slightly less important. In the experience of the 2010 BIP such workshops can have a substantial impact in catalysing and supporting new collaborations and indicators. The BIP regional workshops involved staff of environment ministries and wildlife authorities, academic institutes, national statistical offices, and NGOs. If possible, regional and national capacity development organisations should be partners in the organisation and delivery of the workshops, to facilitate regional adaptation and provide follow‐up support. The benefits of capacity development workshops are greatly increased if there can be more than a one‐off event, with a series of two or three meetings. This encourages the formation of work teams and collaborations amongst the participants to put into practice the new skills being developed. These teams or task forces then present their results and lessons learned at the next workshop, to receive further guidance and support. The workshops and national activities of the 2010 BIP were designed to cover the steps in the biodiversity indicator development framework (see Annex 1). The opportunity for new and experienced indicator developers from neighbouring countries to meet and learn from each other was consistently valued. The workshops should focus on learning through producing practical results that meet national priorities. Regional workshops can only involve a small number of participants per country and in‐country workshops are required to reach key stakeholders, including to build political support for the process of target setting and information and indicator development. Opportunities for exchange and technical support between experienced and new indicator developers should be developed, addressing both topic‐specific technical skills and process issues. A website with guidance, reference materials, examples of indicator methods and uses, social networking, etc. was amongst the highest ranked options for international assistance. An example of this type of resource is the website of the Biodiversity Indicators Partnership www.biodiversityindicators.net and its linked website to support national indicator developers www.bipnational.net, as well as links to organisations leading the development of specific indicators. The development of ‘communities of practice’ at national, regional and global scales around specific indicators and Aichi Targets could be encouraged. The website of the CBD Secretariat and its Clearing House Mechanism is a key resource for information on the Strategic Plan for Biodiversity 2011‐2020 and its implementation, including the future definition of indicators. Technical assistance for indicators for specific CBD targets was ranked fourth in the survey. Such assistance could be provided in a number of forms. It might involve in‐country visits by experts in a particular indicator or topic of an Aichi Target, or interaction on‐line with such experts. This would be closely linked to the other types of assistance of printed guidance on the CBD targets and possible
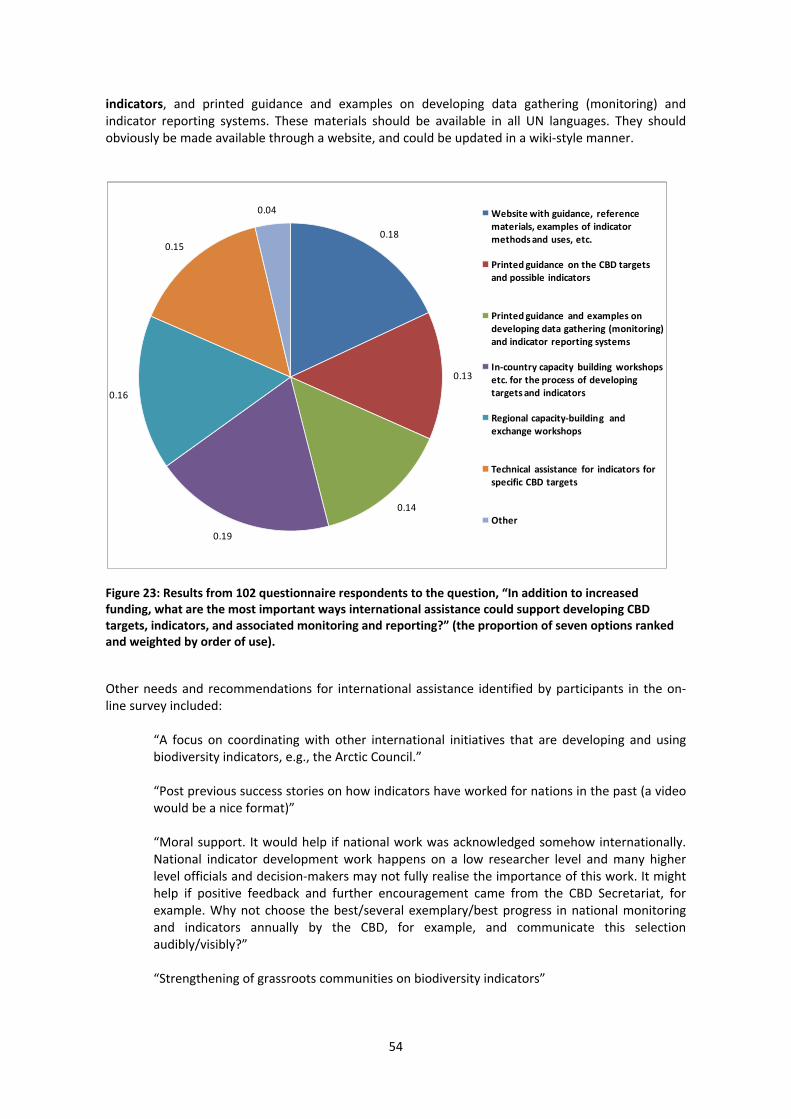
54
indicators, and printed guidance and examples on developing data gathering (monitoring) and indicator reporting systems. These materials should be available in all UN languages. They should obviously be made available through a website, and could be updated in a wiki‐style manner.
Figure 23: Results from 102 questionnaire respondents to the question, “In addition to increased funding, what are the most important ways international assistance could support developing CBD targets, indicators, and associated monitoring and reporting?” (the proportion of seven options ranked and weighted by order of use).
Other needs and recommendations for international assistance identified by participants in the on‐line survey included:
“A focus on coordinating with other international initiatives that are developing and using biodiversity indicators, e.g., the Arctic Council.” “Post previous success stories on how indicators have worked for nations in the past (a video would be a nice format)” “Moral support. It would help if national work was acknowledged somehow internationally. National indicator development work happens on a low researcher level and many higher level officials and decision‐makers may not fully realise the importance of this work. It might help if positive feedback and further encouragement came from the CBD Secretariat, for example. Why not choose the best/several exemplary/best progress in national monitoring and indicators annually by the CBD, for example, and communicate this selection audibly/visibly?” “Strengthening of grassroots communities on biodiversity indicators”
0.18
0.13
0.14
0.19
0.16
0.15
0.04 Website with guidance, reference materials, examples of indicator methods and uses, etc.
Printed guidance on the CBD targets and possible indicators
Printed guidance and examples on developing data gathering (monitoring) and indicator reporting systems
In‐country capacity building workshops etc. for the process of developing targets and indicators
Regional capacity‐building and exchange workshops
Technical assistance for indicators for specific CBD targets
Other

55
“The concerns are mainly in terms of developing the right targets for a country, which is relevant for the country, and would be used within the country ‐ as opposed to targets for reporting to CBD” “Training support for the production and analysis of biodiversity data, to increase the number of players in the field at national level” “I think there is a need for having regional meetings in which experiences and methods are exchanged, and a mechanism of indicator improvement, mutual consistency (or comparability) and a common language is started, which have taken place within the OECD on economic indicators.” “Regional co‐ordination and co‐operation is important for the development of targets and indicators. Also, generating awareness will create political support and adoption of targets by all relevant sectors”
Funding needs Whilst the above needs and activities are all important it should recognised that they were all identified in addition to the need for more funding to support developing CBD targets, indicators, and associated monitoring and reporting. The lack of funds is an issue that developing country Parties to the CBD have consistently highlighted as a major constraint for all aspects of implementing the Convention.
The BIP capacity building workshops found that major progress could be made in establishing new collaborations and indicators with modest funding to support meeting costs and the provision of some technical assistance. A principle of such assistance is to build the sustainability of new initiatives, working with issues that are national priorities and will attract ongoing national support without an unsustainable reliance on external funds.
A critical factor in national and regional target and indicator development is having the support of relevant government institutions and individuals, who will be responsible for implementing the strategies to achieve the targets and will be primary users of the findings from the indicators. The role of committed and skilled individuals within and outside government to champion this work is often a key to success, and appropriate ways to identify and support such individuals should be encouraged.
A principle of international support to Parties in developing targets and indicators, and associated monitoring and reporting, should be to build on whatever capacity already exists in a country or region. Similarly, any support needs to be appropriate to local cultures and decision‐making processes. For countries that currently do not have any measurable national biodiversity targets or indicators it may be appropriate to start by developing a limited number of relevant indicators, to establish the collaborations, basic skills and ways of working that this would require. The choice of subject for this should ideally one that is a national priority and that is of concern to more than just the ‘biodiversity community’, to attract wider support. The demonstration of the concept and utility of biodiversity indicators to current decision‐making concerns will hopefully lead to further support for their development.
A key objective for international assistance to Parties should be to promote in each country the existence of a national body, or even just one post or person, with the role of co‐ordinating the collection, analysis and communication of national biodiversity information. The existence of such capacity, as the institutionalisation of national biodiversity indicators, results in a fundamental improvement in the information for implementing the CBD.
Although this report has identified many constraints there are many developed and developing countries that have established national biodiversity targets, indicators and monitoring and reporting systems. This capacity and expertise is a major resource for other Parties to learn from. One option is to document and disseminate the results, methods and lessons of successful systems. Another option is for the international community to establish mechanisms such as the exchange of personnel

56
between established and new indicator developers or information managers, or technical support visits by experts to other countries. This should include addressing inadequate policy frameworks for the setting of national targets and strategies, as well as the information needs and challenges.
Similarly, national biodiversity indicator developers can learn from other sectors and institutions in their country that have established information gathering and reporting systems, such as the agriculture or health sector. National statistical office can be a key a partner and supporter in this regard, as they increasingly seek to include environmental information in their remit.
Data and monitoring systems The constraint of a lack of appropriate data, as well as the inaccessibility of data for indicators for biodiversity, is nearly universal. However, the BIP capacity building workshops established that in almost every situation there is at least some data that can be converted into relevant indicators, with the appropriate technical skills. For the process of setting national versions of the Aichi Targets and associated indicators, which include some new subjects for the CBD, such as ecosystem services, there will be significant needs for new data. Consequently, the investment in the design and operation of monitoring and reporting systems for specific targets and indicators needs to be addressed. The possible steps in the incorporation of the Aichi Targets into NBSAPs that are outlined in Figure 21 could incorporate the definition of monitoring and reporting capacity needs.
In many cases there are some existing national and international data sets that are suitable for indicators and national reporting, and a priority to obtain rapid results should be build national capacity and mechanisms to access and use this data. Some examples of relevant international data sets are:
Pan‐tropical change detection deforestation datasets are now widely available, e.g., using MODIS data, which can be used by tropical forest countries to report on Aichi Target 5;
Important Bird Areas have been identified in most countries through nationally driven processes, and so these countries should be able to report changes in protected areas coverage of these key biodiversity areas, as a contribution to Aichi Target 11;
Alliance for Zero Extinction sites have been identified in many countries and tracking protected areas coverage of these sites for Aichi Target 11 can provide important complementary information to reporting on changes in protected areas area extent per se;
The IUCN Red List website and database includes the national occurrence of all species, and so all countries can identify the species in their country for which their conservation status has been assessed. This will assist in reporting for Aichi Target 12, whilst recognising that many species have multi‐national distributions.
The GEO‐BON report “Adequacy of Existing Biodiversity Observation Systems to support the CBD 2020 Targets”, which is also being produced for the 2011 AHTEG on indicators provides further information on this subject.
The amount of investment a country decides to make in biodiversity monitoring can be seen as an optimisation problem, as the cost of monitoring competes with the costs of other actions to achieve the targets or goals. A recommendation is to provide guidance and assistance on conducting some form of cost‐benefit analysis of the options for implementing monitoring and reporting, considering the probability of different monitoring strategies successfully achieving their purpose with different levels of investment. Many high‐income countries have developed extensive biodiversity monitoring systems involving volunteers and co‐ordinated work across many sites. The development of the internet, mobile telephony, and remote‐sensing technology, are transforming what is possible in this field. The gathering, transmission, and processing of data, and the rapid multi‐media communication of results, can now involve hundreds or even thousands of participants and sites. Consideration should be made of how countries with such systems could support the application of this technology in developing countries, which often face the greatest threats to their biodiversity and have the least resources.

57
Achieving Target 19 Aichi Target 19 (By 2020, knowledge, the science base and technologies relating to biodiversity, its values, functioning, status and trends, and the consequences of its loss, are improved, widely shared and transferred, and applied), is especially relevant to the development of the other Targets, indicators, and associated monitoring and reporting. In some ways this Target underpins all of the others, and its definition at the national level should be in relation to supporting the definition and implementation of each of the other Targets. Such an assessment of information needs is a considerable task and the production of guidance and examples should be considered.
58
8. STRENGTHENING THE LINKAGES BETWEEN GLOBAL, REGIONAL AND NATIONAL INDICATOR DEVELOPMENT AND REPORTING
1. Introduction The CBD 2010 Biodiversity Target and associated global indicators were intended to be a flexible framework to guide Parties and to be adapted to national circumstances ‘where so desired by Parties’ (CBD COP 7 Decision VII/30). Although many Parties have used indicators that fell within this global framework, there were inevitable inconsistencies in the indicators, metrics and data collection methods used by different Parties. This is clearly demonstrated by the wide range of indicators recorded in CBD fourth national reports, as found in this report. The Strategic Plan for Biodiversity 2011‐2020 is an overarching framework for action by all partners. The establishment of national targets in line with the Aichi Biodiversity Targets, and their integration into updated national biodiversity strategies and action plans (NBSAPs), is key to the implementation of the Strategic Plan. From an indicators perspective, the priority at national scale will be to develop indicators to meet national needs, i.e. tailored to nationally adopted targets. However, there is a strong rationale for encouraging harmonised indicator use and reporting across Parties, not least because doing so increases the availability of information for tracking progress towards goals and targets at broader scales, i.e. regionally and globally. This section reviews experiences in promoting consistency in the use of common (scalable) indicators within the CBD and in other global processes where cross‐scale harmonisation has been attempted. 2. Lessons from the 2010 biodiversity indicators and the 2010 BIP The 2010 BIP included an objective to improve the delivery of global indicators by improving their use by national governments and regional organisations. For four of the global indicators with well‐established methods, comprehensive guidance documents were produced to enable national indicator developers to understand and adapt the indicators for their needs, and to encourage collaboration with the global indicator agencies. These guidance documents are available for the Red List Index, Living Planet Index, Coverage of Protected Areas, and the Wild Bird Index (available from www.bipnational.net). However, in the short term there appear to have been little demand from national indicator developers for these documents on national application of global indicators. The 2010 BIP conducted direct engagement with national biodiversity indicator developers through a series of regional capacity building workshops designed to assist the bodies responsible for CBD implementation and reporting to have an improved understanding of the global framework of indicators for the CBD 2010 Target, and to identify ways to improve their national indicators. The workshops reviewed existing experiences with biodiversity indicators, conducted capacity‐building exercises, and examined possibilities for common regional indicators. The key findings are as follows20: All the global headline indicator methods can in principle be applied at national scale, but such an application requires an understanding of their scientific concept and data requirements. This is most straightforward for the global indicators which rely on data reported at the national level, such as
20 2010BIP (2010) Biodiversity indicators and the 2010 Target: Experiences and lessons learnt from the 2010
Biodiversity Indicators Partnership. Secretariat of the Convention on Biological Diversity, Montréal, Canada. Technical Series no. 53, 200 pages.

59
coverage of protected areas and extent of forests, and which are area‐based measures. For some global indicators there are conceptual issues which need to be considered before their application at national level. For example, this is the case for the Red List Index and River Fragmentation, where the unit of analysis may well not fit within national boundaries, such as the global population of a species covering many countries, or a multi‐national river system. A national calculation for these indicators would first need to determine the appropriate scale and boundaries for including data, such as nationally endemic species, discrete national populations of species, or river basins and sub‐basins. The CBD headline global indicators are rarely used at the national scale. From the experience of conducting the 2010 BIP regional capacity building workshops involving 45 countries in south‐east Asia, the Caribbean, Central America, and eastern and southern Africa, almost none of the CBD headline global indicators are currently calculated at the national level in these countries. The two main exceptions are some form of coverage of protected areas and extent of forests, both of which are indicators within MDG 7. There is a national Living Planet Index in Uganda where the LPI global partners have worked with national partners; and the Ecological Footprint and biocapacity values are calculated and available for most countries. One reason for the weak linkages between global and national biodiversity indicators is that they are often intended for different users and purposes. Parties are unlikely to develop indicators for global reporting without an incentive or additional value for national use. From the 2010 BIP workshops it was evident that there was no apparent motivation or mechanism for countries to contribute to global biodiversity indicators, except for the existing mechanisms for reporting on coverage of forests and protected areas (which is partly why they are included as indicators for MDG‐7). 3. Lessons from other global processes Some other global processes have explicitly attempted to create reporting systems based on harmonised national, regional and global indicators. Two examples are presented here, the first another of the Rio Conventions, the second the UN Millennium Development Goals. 3.1 UN Convention to Combat Desertification (UNCCD) The UNCCD has adopted a 10‐year strategic plan and framework to enhance the implementation of the Convention for the period 2008‐2018. This included a number of strategic objectives and a number of indicators: 18 ‘performance indicators (mainly process‐based, relating to activities and inputs) and 11 ‘impact indicators’ (biophysical and socio‐economic indicators to track objectives relating to improvements in ecosystems, living conditions and global benefits). The UNCCD has identified a subset of these indicators as ‘minimum reporting requirements’ by countries, and in an effort to standardise data collection and reporting it has established an online reporting tool (PRAIS), supported by written guidance material and some regional training and support. In the first phase of PRAIS to 2010, only the performance indicators have been included in the PRAIS system and reported on. From 2011 efforts are underway to incorporate impact indicators. The results from the first round of performance indicator reporting, suggests that, although reporting rates were generally high, there are ongoing challenges particularly with data availability and consistency in monitoring processes21.
21 UNCCD (2010) Consideration of the iterative process relating to the assessment of implementation, including
performance indicators, methodology and the reporting procedures. Document ICCD/CRIC(9)/10.
60
For example, amongst the performance indicators included in the PRAIS reporting portal, “those indicators that required numerical data from heterogeneous sources were those that posed the greatest challenge. Both affected and developed country Parties indicated that they had difficulties with indicators on the number of information events on DLDD22 and the related number of participants, as well as with indicators requiring financial information. The problems experienced were mainly related to their measurability (methods of calculation, availability of information, disaggregating of information by year, etc.).” The situation for impact indicators is likely to be even more challenging. One country respondent notes “The system of monitoring, evaluation and research on DLDD and sustainable land management is underdeveloped and there is a lack of the required capacities for its operationalization. Data and information for reporting to UNCCD based on the existing PRAIS portal are not often readily available. Some of the information required by the PRAIS portal warrants a separate survey to generate it” Comment by respondent from Burkina Faso For some indicators, data collection is often catalysed (and funded) by external initiatives. For example, data on poverty rates for developing countries comes mainly from the World Bank’s Poverty Assessments. The World Bank periodically prepares poverty assessments of countries in which it has an active program, in close collaboration with national institutions, other development agencies, and civil society groups, including poor people’s organizations. For other indicators, including one of the mandatory impact indicators ‘land cover status’, there are no globally comparable time series data sets, let alone comparable methodologies in use at national scale23. Many Parties are understandably concerned about the implications of mandatory standardised reporting obligations. 3.2 Millennium Development Goals (MDGs) The eight MDGs, adopted after the Millennium Declaration in the year 2000, include 21 measurable, time‐bound targets tracked by 60 indicators (themselves often underpinned by multiple metrics). Annual indicator‐based progress reports are compiled by the UN Statistical Division (UNSD), as far as possible based on nationally reported statistics. Specialist international agencies, including global bodies like FAO and UNDP, alongside UN regional economic commissions, are responsible for compiling data for each indicator and for assessing progress at regional and global scales. Clear standards and definitions for each indicator are defined in a metadata handbook that is annually updated. The UNSD maintains an online database for each indicator, disaggregated nationally where possible This provides a picture of the extent to which each indicator is reported nationally. Key observations include:
Some indicators are not reported (or reportable) nationally. These include, for MDG‐7, proportion of fish stocks within sustainable limits, and proportion of species threatened with extinction (the Red List Index). The first of these applies in areas beyond national jurisdiction, the second relies on repeated assessments that are currently only undertaken globally and not nationally.
Many indicators have gaps in national data availability. On average, across 150 metrics used
to construct the MDG indicators, only 50% of developing countries have at least two data
22 Desertification, land degradation and drought 23 WCMC (2011) A Technical Guide to UNCCD Impact Indicators (unpublished draft report).

61
points for any individual metric. Those with high levels of national data availability include employment, tuberculosis rates, child mortality and education. Those with medium levels of national data availability include many poverty and health metrics. Those with low levels of national data availability include HIV metrics, family planning and ODA/debt metrics.
To compensate, international agencies will often model or extrapolate data to create a more
complete picture. Examples include malaria prevalence and mobile phone use. There are often discrepancies between national data and international sources, for a variety
of reasons. As a part of their role, the international specialist agencies often adjust national data to ensure international comparability.
The need for national capacity development for reporting the MDGs is well recognised. “Since the periodic assessment of progress towards the MDGs started, the international statistical community has been concerned about the lack of adequate data to monitor trends in many developing countries and to inform the global monitoring and political debate. The Inter‐agency and Expert Group on MDG Indicators (IAEG) regularly reviews and discusses countries' needs in building capacity for the production and analysis of MDG and development indicators, and works with national statistical offices to identify priorities in capacity building and to facilitate the coordination of technical assistance activities. A number of projects and activities have been launched by the agencies and organizations of IAEG, ranging from advocacy for the strengthening of official statistics with good statistical governance, to knowledge transfer and technical training on data collection, analysis and dissemination, including Population and Housing Censuses and Surveys.”24 4. Summary of issues for strengthening global‐regional‐national linkages in indicator development for the Aichi targets Harmonising global‐regional‐national indicator use will aid assessments of progress towards targets, particularly at broader scales. The more consistent the regional and national targets are to the global targets, the easier it will be to promote consistency in indicators across scales. However, it is difficult to ensure national level consistency, even for relatively mature processes, and even with significant investment many gaps remain. Global indicators are often driven by international agencies investing in and/or co‐ordinating data collection or modelling/extrapolating from limited national‐level data. Parties are more likely to develop and use indicators where they own the process and perceive a benefit to themselves. The fulfilment of reporting requirements for global processes is unlikely to be a sufficient rationale to develop indicators if relevant national datasets and monitoring/reporting initiatives do not already exist. Whilst guidance and advice on appropriate methods to use at the national scales is valuable and often welcomed by Parties, efforts to standardise methods across countries may not be successful in all cases. Where standardisation has occurred, it has often taken time to emerge and has relied on voluntary uptake. Complete standardisation may not be necessary to ensure national data can be used to track progress towards the 2020 goals and targets at regional and national scales. There appears to have been little if any evaluation of the benefits of national standardisation compared with the opportunities for meta‐analysis combining data collected in different ways in different countries.
24 http://unstats.un.org/unsd/mdg/Host.aspx?Content=Capacity/Capacity.htm

62
5. Approaches and methods for strengthening global‐national indicator linkages The following approaches are recommended to strengthen linkages between national, regional and global indicator development: • Consider the potential for nationally‐relevant target‐setting and indicator development when
developing the global indicator framework for the Strategic Plan for Biodiversity 2011‐2020.
• Agencies responsible for global indicators should, as a minimum, provide information and examples on their relevance and application at regional and national levels, including any common methods and metrics, without necessarily mandating common approaches. The provision of in‐country or on‐line technical assistance may also be necessary to establish sufficient national capacity for the adoption of global indicators.
• If global reporting bodies wish countries to adopt and report national indicators within global indicator frameworks they should accept that global reporting requirements are unlikely to be a sufficient incentive for countries to adopt global indicators, and to find other ways to motivate or support their uptake by countries.
• Accept that not all indicators can be standardised across multiple scales, as some indicators are only appropriate or useful at a particular scale, or may not be suitable for aggregation.
• Identify opportunities, where there may be little current national data collection but where a simple/efficient and available method could be promoted with sufficient investment and oversight.
• Develop the accessibility and quality of relevant global and regional data sets for the production of national indicators. This could involve organisations such as the Biodiversity Indicators Partnership and GEO‐BON. The data needs and methods of national indicators and who calculates them need to be identified and considered by global indicator and data providers. National statistical offices may have an important role to play in achieving this aim.

63
9. CONCLUSIONS Capacity to produce indicators
About three quarters of the world’s countries appear to have some indicators or evidence of relevant data in support of their implementation of the CBD, as evidenced by 121 (76%) of 159 Parties had reported or referenced at least one biodiversity indicator in their 4th national report. However, only 58 (36%) of Parties included evidenced indicators (i.e. with data or figures) in their report. It is likely that most countries have at least some data suitable for producing a few relevant indicators, but that the information is not readily accessible for producing indicators, or is not presented in the form of an indicator in their 4th national reports.
Most of the countries that have established national indicators and reporting systems in support of their implementation of the CBD also have developed economies, as well as strong academic and voluntary sectors that assist the collection and use of science‐based information in decision‐making. However, there are a few developing countries where NGOs and academic institutions have led the establishment of national biodiversity monitoring, information management and reporting, such as MUIENR25 in Uganda, and Namibia Nature Foundation, or where government biodiversity information institutes have been established, such as the South African National Biodiversity Institute, and CONABIO26 in Mexico. The existence of a national body, or even just one person, with the role of co‐ordinating the collection, analysis and communication of national biodiversity information results in a fundamental improvement in the information to support implementation of the CBD and the Strategic Plan for Biodiversity 2011‐2020.
National production of indicators for biodiversity is often most successful when there is collaboration between different government bodies, NGOs and academic institutes. This can include national statistical offices, which provide additional credibility, capacity and cross‐government profile and demand for the indicators.
Data sources
The commonest type of data source for national indicators is to adapt data from monitoring and reporting systems designed for other purposes. The use of data from surveys, assessments and academic research is also common, but this data is rarely suitable for long‐term reporting. Few countries have monitoring systems that have been designed to produce data for specific indicators for biodiversity. For many developing countries, or countries without a long tradition of environmental research, the availability of existing data is likely to be the principle determinant of which indicators are actually chosen and used. However, it should be recognised that in many cases a data set can be analysed and interpreted for more than one use if the appropriate scientific and analytical skills exist.
Existing national indicators for biodiversity
Coverage of protected areas is by far the commonest indicator found in an analysis of indicators in CBD 4th national reports (4NRs), and is included or referred to in reports by 91 Parties. Extent of forest and forest types is the second‐commonest indicator in 4NRs, with 50 Parties presenting or making reference to such information. Both of these are established indicators for Millennium Development Goal 7, and as well as being for topics of clear national importance, there are international mechanisms to support their national production and reporting, with relatively straightforward calculation methods. Information on invasive alien species is the third commonest indicator topic in 4NRs, which reflects the level of national attention to the issue, but standard measures for this issue do not exist yet. No other indicators of the CBD 2010 global indicator framework have more than ten occurrences with evidence of results in 4NRs, but there are significantly more occurrences of similar indicators to the CBD global headline indicators for ‘trends in abundance and distribution of species’ and ‘areas under sustainable management’. Over 100 Parties have at least some information in their 4NRs relevant to the CBD 2010 Target Focal Area of ‘status
25 Makerere University Institute of Environment & Natural Resources 26 National Commission for the Knowledge and Use of Biodiversity

64
and trends of components of biodiversity’, but there is much less information for the other focal areas.
From the evidence in 4NRs, Parties currently have no or very few potentially relevant indicators for seven of the Aichi Targets in the Strategic Plan for Biodiversity 2011‐2020: 3 (Incentives), 13 (Agricultural biodiversity), 16 (Access and Benefit Sharing implementation), 17 (National Strategies and Action Plans), 18 (Traditional knowledge), 19 (Biodiversity knowledge), 20 (Resource mobilization).
Six of the Aichi Targets each have over 50 potentially relevant evidenced or non‐evidenced national indicators across all the 4NRs: 14 (Essential ecosystem services), 5 (Loss of habitats), 4 (Use of natural resources), 7 (Areas under sustainable management), 11 (Protected areas), 15 (Biodiversity and carbon stocks). However, with the exception of Target 11, there is likely to be only very partial relevant information for these Targets in most countries.
There is an almost complete lack of indicators reported in CBD 4th national reports that are relevant to the Strategic Goal E (Enhance implementation through participatory planning, knowledge management and capacity building). This is in part because global indicators for this aim and the subjects of Aichi Targets under Strategic Goal E were not very developed under the CBD 2002‐2010 Strategic Plan, but also reflects the challenges of defining and measuring the subjects of traditional knowledge and knowledge management. The Aichi Targets under Strategic Goal E may be considered to only partially address the aim of capacity building for implementation of the Strategic Plan, and the lack of current indicators points to a need for much greater attention by Parties to this Strategic Goal.
Uses of indicators
About one third of respondents to the on‐line survey for this report used the CBD 2010 Target global indicator framework in the selection of national indicators, but other frameworks and topics, national targets, and the availability of data, were also major considerations. The most commonly reported uses of indicators were for government policy‐making and implementation, and for state‐of‐the environment reports or other assessments. Two other common uses are for reporting on progress for national government commitments, and reporting on progress to international agreements.
Constraints and opportunities
A separate study27 found that only about ten CBD Parties have time‐bound and measurable targets in their NBSAPs, although it considered that more countries probably have some targets for protected areas coverage at least. Measurable targets provide a focus for national implementation of the Strategic Plan for Biodiversity 2011‐2020, and a clear role and justification for the development of indicators and associated monitoring and reporting systems. The renewed emphasis on the setting of national targets in the Strategic Plan for Biodiversity 2011‐2020, with the breadth of issues in the 20 Aichi Targets, is likely to be a new way of implementing the Convention for many Parties, and a major challenge. The results of the on‐line survey for this report identified many constraints to national target setting, including lack of political will, lack of data, and difficulty in consultation and negotiation with other sectors and stakeholders.
The lack of suitable data for indicators, including the inaccessibility of existing data, is probably the most widespread problem for the calculation of indicators for biodiversity, followed by a lack of technical and institutional capacity, and lack of funding. Many developing countries in particular report a lack of funding, and without additional international and national funds many Parties will not be able to establish the necessary indicator, monitoring and reporting systems for their implementation of the Strategic Plan for Biodiversity 2011‐2020. However, this situation is linked to the often reported constraint of, “insufficient demand from government for such indicators”, with very little awareness or use of indicators for biodiversity at all levels of government and society in some countries. If even a few relevant indicators can be produced in a country and their utility for
27 Prip, C; Gross, T; Johnston, S; Vierros, M (2010). Biodiversity Planning: an assessment of national biodiversity
strategies and action plans. United Nations University Institute of Advanced Studies, Yokohama, Japan.

65
policy issues demonstrated, then building government and financial support for their production is much easier. Similarly, whilst the lack of suitable data for desired indicators is so widespread, and requires new investment, it seems that in most countries at least some useful new indicators can be produced from reinterpretation of existing data.
An additional challenge for the national adoption of the Aichi Targets and identification of possible indicators is that many of the Targets include multiple and complex issues. For some of the terms or concepts in the Targets there is not an established definition or application, such as ecosystem integrity, resilience and safe ecological limits. Whilst the Targets should be seen as a flexible framework for Parties to adopt, the provision of guidance and examples of how the Targets could be defined at the national level is required.
As a support to the definition of national Targets and indicators the authors of this report have outlined in Annex 4, for each Aichi Target, the conceptual and knowledge issues that are likely to be encountered in setting and measuring the Target at national level. The possibly relevant indicators identified with evidence of their existence in 4th national reports to the CBD are also listed.
The authors of this report have identified many constraints there are many developed and developing countries that have established national biodiversity targets, indicators and monitoring and reporting systems. This capacity and expertise is a major resource for other Parties to learn from. One option is to document and disseminate the results, methods and lessons of successful systems. Another option is for the international community to establish mechanisms such as the exchange of personnel between established and new indicator developers or information managers, or technical support visits by experts to other countries.
Similarly, those responsible for the development of national indicators for biodiversity can learn from other sectors and institutions in their country that have established information gathering and reporting systems, such as the agriculture or health sector. National statistical office can be a key partner and supporter in this regard, as they increasingly seek to include environmental information in their remit.
66
10. RECOMMENDATIONS The CBD AHTEG on Indicators for the Strategic Plan 2011‐2020 will primarily provide advice for the SBSTTA, which in turn will make recommendations to the COP. The AHTEG’s advice could include recommendations inviting Parties, or other bodies such as the GEF, to consider some actions or issues. The following recommendations or suggestions for consideration by the AHTEG are for various types of support to CBD Parties in their efforts to develop national indicators and associated biodiversity monitoring and reporting systems, including in support of setting and measuring national targets. The recommendations have been produced by the authors of this report on the basis of its findings. The recommendations are not listed in an order of priority.
For supporting national and regional indicator development and reporting: Recommendation:
The many countries without systematically‐produced indicators for biodiversity are encouraged to establish some form of post, committee or agency to promote and co‐ordinate the production and sharing of national biodiversity information.
Rationale: The existence of a national body, or even just one person, with the role of co‐ordinating the collection, analysis and communication of national biodiversity information results in a fundamental improvement in the information available to support implementation of the CBD and the Strategic Plan for Biodiversity 2011‐2020.
Recommendation: Parties with limited resources for implementation of the CBD could be advised and supported to initially establish a few indicators for priority issues identified within their NBSAPs and the Aichi Targets, to demonstrate the benefits of indicators and build support for their use for other issues.
Rationale: The adoption and reporting of the Aichi Targets for many Parties will require a step‐change in their mode of implementation of the CBD, in terms of defining for the first time measurable targets and reporting on progress. Where the use of indicators is not an established part of decision‐making and reporting it may be beneficial to demonstrate their value for issues of high national priority.
Recommendation: For international ‘biodiversity organisations’ and funding bodies to promote the development of ‘communities of practice’ for the measurement and reporting of the Aichi Targets at the national, regional and global scales, using internet resources and meetings to share experience and support. This would involve government, NGOs, academic bodies and business. The benefits from involving the wider public in recording observations (‘citizen science’) should also be investigated.
Rationale: National adaptation and reporting of the twenty Aichi Targets requires a range of expertise and information, and sometimes new ways of working (e.g. integrating biodiversity values into national accounts), which few countries are likely to have in place in the short term. However, amongst the diversity of CBD Parties and the international scientific and development community there are examples and expertise that others can learn from, covering all the issues involved in adoption of the Strategic Plan for Biodiversity 2011‐2020.

67
‘Communities of Practice’ for individual Aichi Targets and cross‐cutting issues, operating within countries, regions and globally can provide necessary practical advice and encouragement, including the dissemination of lessons learned and solutions to problems.
Recommendation:
For countries that have a capacity for producing and communicating biodiversity information, including indicators, means should be developed for their expertise to be shared with countries that have less developed capacity. Such means could include training, exchanges, technical expert visits, and on‐line communication.
Rationale: There are examples of successful indicator development in a variety of countries around the world and peer‐to‐peer learning is a very effective way to promote capacity development.
Recommendation: To promote the production of guidance and examples for each of the Aichi Targets to explain the scientific concepts and information needs that underpin the setting of national targets, strategy development, and reporting. A pragmatic approach should be taken, focusing on the key elements of the targets, and with examples of operational indicators that could be produced in a cost‐effective way. The guidance could be made available through the Convention’s Clearing‐House Mechanism.
Rationale: Since many of the Targets address complex issues, and some of the Targets address new areas for implementation of the CBD, guidance to help understand the scientific and technical aspects of the Targets and their measurement is an important requirement as countries update their NBSAPs. The writing of the guidance should involve relevant scientific and technical organisations.
Recommendation:
To promote a co‐ordinated suite of actions and resources for capacity development and support to Parties in developing indicators and monitoring and reporting systems, bringing together indicator developers, reporting organisations and scientific bodies, from national to global scales, to collaborate in providing:
o in–country and regional capacity building and exchange workshops; o a website with guidance, reference materials, examples of indicator methods and
use, and to support a ‘community of practice’; o thematic workshops involving biodiversity‐related MEAs and the other Rio
Conventions or processes within region/countries; o technical assistance and training for producing specific indicators.
Rationale: Co‐ordinated initiatives, such as the Biodiversity Indicators Partnership, have provided good experience of the value of these types of capacity development actions and resources, and these actions have been equally recommended from the on‐line survey for this report. These kinds of activities should involve the scientific and data‐providing communities as well development agencies.

68
Recommendation: To explain and promote the AHTEG’s recommendations as a contribution to achieving Aichi Target 19 (Biodiversity knowledge).
Rationale: The terms of reference of the AHTEG are directly applicable to supporting the achievement of the knowledge and science based aspects of Aichi Target 19 (By 2020, knowledge, the science base and technologies relating to biodiversity, its values, functioning, status and trends, and the consequences of its loss, are improved, widely shared and transferred, and applied).
For strengthening the linkages between global, regional and national indicator development and reporting: Recommendation:
The criteria for development of the global indicators for the Aichi Targets should give equal consideration to the relevance and feasibility of the indicators at the regional and national scales.
Rationale: The Strategic Plan for Biodiversity 2011‐2020 has a considerable emphasis on the updating of NBSAPs, including the national or regional adaptation of the Aichi Targets. For many countries and regional bodies the CBD global framework of indicators is a significant influence on their selection of indicators. Seeking comparability and aggregation of indicators across scales has been recommended by many regional and national indicator workshops and initiatives.
Recommendation: To give guidance to Parties on the relevance and practicality at national and regional scales of each of the global indicators recommended by the AHTEG for the Strategic Plan for Biodiversity 2011‐2020.
Rationale: Given the breadth of subjects covered by the Aichi Targets, and the current lack of relevant national indicators in many countries, guidance is needed for Parties to help them assess the relevance and practicality of each of the global indicators for use at national and regional scales.
Recommendation: To encourage any capacity development for indicators for the Strategic Plan for Biodiversity 2011‐2020 to be conducted in co‐ordination or collaboration with similar work by other international MEAs and processes, including MDG reporting and the IPBES. This should include seeking the involvement of national statistical offices.
Rationale: The Strategic Plan for Biodiversity 2011‐2020 is intended to not just relate to the implementation of the CBD, but to include all relevant sectors, other MEAs and development agencies. The forthcoming IPBES will have a major component of capacity building activities and the development of indicators capacity for the Strategic Plan for Biodiversity 2011‐2020 should be closely co‐ordinated with this. Similarly, other international agencies and initiatives such as UNDP, GEO‐BON, FAO, IUCN, etc. have capacity building activities in support of implementation of the CBD and individual indicators. The UN Statistics Division and National Statistics Offices are increasingly seeking to include environmental and biodiversity information in their work.

69
ANNEXES
Annex 1. The Biodiversity Indicator Development Framework The Biodiversity Indicator Development Framework has been developed from the national capacity building experience of UNEP‐WCMC and partners, including the 2010 BIP. The Framework contains steps that have been found to support the production of successful biodiversity indicators and is divided into three themes:
Purpose --- actions needed for selecting successful indicators Production --- essential to generate indicators Permanence --- mechanisms for ensuring indicator continuity and sustainability. Full explanation of each of the steps is available at www.bipnational.net
Figure 24: The Biodiversity Indicator Development Framework (for an explanation of each of the steps and examples of its application see www.bipnational.net)
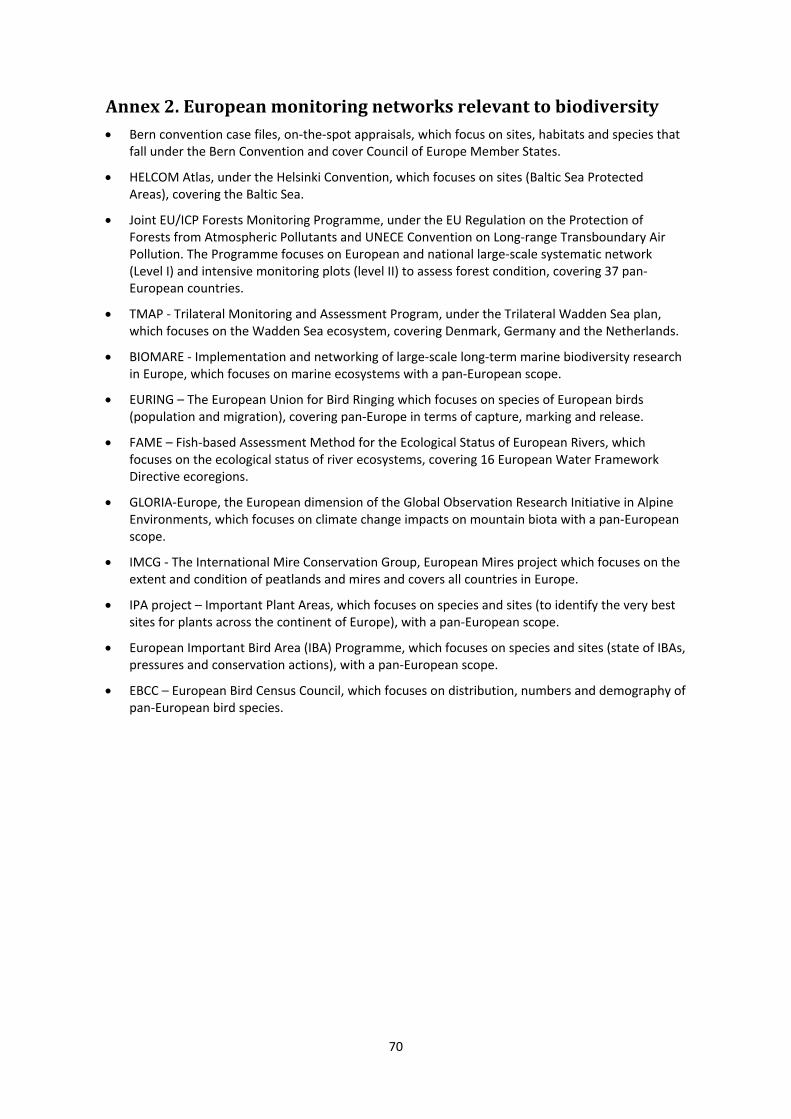
70
Annex 2. European monitoring networks relevant to biodiversity Bern convention case files, on‐the‐spot appraisals, which focus on sites, habitats and species that
fall under the Bern Convention and cover Council of Europe Member States.
HELCOM Atlas, under the Helsinki Convention, which focuses on sites (Baltic Sea Protected Areas), covering the Baltic Sea.
Joint EU/ICP Forests Monitoring Programme, under the EU Regulation on the Protection of Forests from Atmospheric Pollutants and UNECE Convention on Long‐range Transboundary Air Pollution. The Programme focuses on European and national large‐scale systematic network (Level I) and intensive monitoring plots (level II) to assess forest condition, covering 37 pan‐European countries.
TMAP ‐ Trilateral Monitoring and Assessment Program, under the Trilateral Wadden Sea plan, which focuses on the Wadden Sea ecosystem, covering Denmark, Germany and the Netherlands.
BIOMARE ‐ Implementation and networking of large‐scale long‐term marine biodiversity research in Europe, which focuses on marine ecosystems with a pan‐European scope.
EURING – The European Union for Bird Ringing which focuses on species of European birds (population and migration), covering pan‐Europe in terms of capture, marking and release.
FAME – Fish‐based Assessment Method for the Ecological Status of European Rivers, which focuses on the ecological status of river ecosystems, covering 16 European Water Framework Directive ecoregions.
GLORIA‐Europe, the European dimension of the Global Observation Research Initiative in Alpine Environments, which focuses on climate change impacts on mountain biota with a pan‐European scope.
IMCG ‐ The International Mire Conservation Group, European Mires project which focuses on the extent and condition of peatlands and mires and covers all countries in Europe.
IPA project – Important Plant Areas, which focuses on species and sites (to identify the very best sites for plants across the continent of Europe), with a pan‐European scope.
European Important Bird Area (IBA) Programme, which focuses on species and sites (state of IBAs, pressures and conservation actions), with a pan‐European scope.
EBCC – European Bird Census Council, which focuses on distribution, numbers and demography of pan‐European bird species.

71
Annex 3. Biodiversity information institutions and indicator reports
National
Belgium (Flanders): Biodiversity indicators 2008. State of Nature in Flanders. The report presents 21
Flemish biodiversity indicators according to the focal areas of the Convention on Biological Diversity
and the EU biodiversity headline indicators, in order to track progress towards the achievement of the
2010 target. http://www.inbo.be/files/bibliotheek/56/185056.pdf
Belgium (Wallonia): Environmental Outlook for Wallonia. Digust 2010. The report presents a selection
of socioeconomic and environmental indictors that provide an overview of the status and of the
evolution of the environment in Wallonia.
http://etat.environnement.wallonie.be/index.php?page=environmental‐outlook‐2010
Brazil: Chico Mendes Institute for Biodiversity. http://www.icmbio.gov.br/
Colombia: Instituto de Investigación de Recursos Biológicos Alexander von Humboldt. http://www.humboldt.org.co
Costa Rica: Instituto Nacional de Biodiversidad (INBio). http://www.inbio.ac.cr
Czech Republic: Report on the Implementation of 2010 Objectives in Protecting the Biodiversity of the Czech Republic. The report provides an overview of results from the Czech Republic’s biodiversity indicators. http://www.mzp.cz/osv/edice.nsf/DCDC245D147DC3ACC125780E0049429C/$file/OVV‐Zprava_naplnovani_cile‐20101220.pdf
Finland: Biodiversity.fi website. This website provides information on Finland’s large range of biodiversity indicators and their indicator development process. http://www.biodiversity.fi/en/home
France: National Biodiversity Strategy. Presentation of monitoring indicators of biodiversity
proposed for the metropolis. The report provides an overview of France’s 27 biodiversity
indicators. http://www.naturefrance.fr/IMG/pdf/indicateurs‐biodiv‐SNB‐metropole.pdf
Germany: Policy‐related indicators. Measure the Effectiveness of the German National Strategy on
Biological Diversity. A review of Germany’s biodiversity indicators which are assigned to a Driving
Force – Pressure – State – Impact – Response framework.
http://www.bfn.de/fileadmin/MDB/documents/themen/monitoring/Indicators_German_Biodiversity
_Strategy.pdf
Malta: The environment report 2008. The report monitors trends related to the most important
environmental parameters and aims to communicate key environmental issues and trends to
policymakers and civil society in a clear and concise way. http://www.mepa.org.mt/ter
Mexico: National System of Environmental Indicators (NARS) website. This website provides
information on Mexico’s biodiversity indicators.
http://www.semarnat.gob.mx/informacionambiental/SNIA/Pages/Estructura.aspx
Mexico: Comisión Nacional para el Conocimiento y Uso de la Biodiversidad.
http://www.conabio.gob.mx/

72
Netherlands: Nature Balance 2009. The report is an annual assessment of the natural environment
and landscape in the Netherlands. It monitors policy developments in the field of landscape and
natural environment and gives a view on emerging perspectives.
http://www.pbl.nl/en/publications/2009/nature‐balance‐2009
New Zealand: A Natural Heritage Management System is being developed, as part of New Zealand’s
response to the setting of its own national targets, indicators and measures on the status and trends
in biodiversity and (some elements) of ecosystem services. The Department of Conservation is
putting in place a national system to monitor and report on New Zealand’s biodiversity, using
indicators and measures from the NZ Biodiversity Assessment Framework.
https://www.biodiversity.govt.nz/index.html
http://www.doc.govt.nz/upload/documents/about‐doc/role/policies‐and‐plans/cms/nhms‐
monitoring‐factsheet.pdf
Portugal: Nature protection and biodiversity – State and impacts (Portugal). A review of Portugals
indicator progress to date. http://www.eea.europa.eu/soer/countries/pt/nature‐protection‐and‐
biodiversity‐state
Scotland: Scotland's Biodiversity Indicators ‐ Summary document. This report outlines the trends for
Scotland’s 22 biodiversity indicators chosen to address national priorities.
http://www.scotland.gov.uk/Resource/Doc/199632/0053322.pdf
South Africa: Environmental Indicators Database. This website includes a list of the biodiversity indicators being developed in South Africa. http://enviroindicator.deat.gov.za/cocoon/rsadb/docs/list
Spain: Perfil Ambiental de España 2009. Informe basado en indicadores. The report addresses the
description of the environment in Spain through a set of indicators, giving an overall vision of the
main thematic areas and the implied economic sectors.
Sweden: Sweden’s Environmental Objectives in Brief [2009] and a summary of the Environmental
Objectives Council’s progress report 2009. A brief account of the 16 objectives Sweden has adopted to
guide action towards a sustainable environment, which are to be met within a generation.
http://www.naturvardsverket.se/Documents/publikationer/978‐91‐620‐8324‐3.pdf
Switzerland: The state of biodiversity in Switzerland. Overview of the findings of Biodiversity
Monitoring Switzerland (BDM) as of May 2009.
http://www.bafu.admin.ch/publikationen/publikation/01035/index.html?
United Kingdom: UK Biodiversity Indicators in Your Pocket (BIYP) 2010. This pocket sized booklet
provides a summary of the 18 UK biodiversity indicators. It includes a table summarising traffic light
assessments. http://jncc.defra.gov.uk/biyp
Regional
Europe (SEBI2010): Assessing biodiversity in Europe — the 2010 report. The report makes use of
Streamlining European 2010 Biodiversity Indicators and considers the status and trends of pan‐
European Biodiversity http://www.eea.europa.eu/publications/assessing‐biodiversity‐in‐europe‐84

73
Europe (European Commission): Consolidated Profile ‐ Report from the Commission to the Council and
the European Parliament. The 2010 Assessment of Implementing the EU Biodiversity Action Plan.
Section C of this report review the use of the SEBI2010 indicators in national reporting on
implementation of the Biodiversity Action Plan.
http://ec.europa.eu/environment/nature/biodiversity/comm2006/pdf/bap_2010/CONSOLIDATED%2
0PROFILE.pdf
Arctic (Circumpolar Biodiversity Monitoring Programme): Arctic Biodiversity Trends 2010 – Selected
indicators of change. This report uses the regional indicator set to review biodiversity trends in the
Arctic. http://www.arcticbiodiversity.is/
Nordic Countries (NordBio2010): State of biodiversity in the Nordic countries. An assessment of
progress towards achieving the target of halting biodiversity loss by 2010. This report provides the
main findings of the project Nordic Biodiversity Indicators 2010 (NORDBIO2010) and presents the
proposed regional indicators. http://www.norden.org/en/publications/publications/2009‐
509/at_download/publicationfile

74
Annex 4. Conceptual and knowledge issues in measuring national and regional implementation of Aichi Targets 1 to 19
Introduction
This section of the report provides a brief analysis for each of the Aichi Targets of the conceptual issues and knowledge issues in setting and measuring the Target. For some of the Targets where there might possibly be different interpretations of their emphasis or scope, relevant text from the CBD rationale for the Targets has been included (https://www.cbd.int/sp/targets/rationale/)
Also, for each Target the potentially relevant national indicators with evidence of their existence as found in the analysis of 4th national reports to the CBD are listed.
Strategic goal A. Address the underlying causes of biodiversity loss by mainstreaming
biodiversity across government and society
Target 1
Target text
By 2020, at the latest, people are aware of the values of biodiversity and the steps they can take to
conserve and use it sustainably.
Conceptual and knowledge issues in setting and measuring the Target
CBD rationale: Increasing understanding, awareness and appreciation of the diverse values of
biodiversity, are necessary to create the willingness to undertake the behavioural changes required to
conserve and sustainably use biodiversity. The key audiences for such communication, education and
public awareness activities will vary between Parties, but generally could focus on national and local
governments, business, non‐governmental organizations and civil society groups, including in their
role as producers and consumers of biodiversity‐related goods.
Definitions and issues involved in setting and measuring a national target include:
Identification of appropriate target groups of ‘people’ or stakeholders; possibilities range from general public to key government officials. The selection of target groups affects both the values of interest and the relevant possibilities for action
definition of biodiversity and the values it has that should be conserved and used sustainably, and how they differ among different groups (e.g. scientists, business, government officials, general public, rural and urban populations, indigenous peoples) .
identification of the steps that can be taken by members of target groups, and for which awareness needs to be raised, to conserve and sustainably use biodiversity.
knowledge of the current awareness of different groups of the desired biodiversity values and steps that they can take to conserve and use it sustainably.
Knowledge of the best approaches for raising awareness with different groups Actions taken by governments to assess awareness and actions, as well as to raise awareness and
take actions.
Existing indicators

75
National:
At the national level six Parties give evidence of using indicators which could be deemed as relevant
for this target in their 4th national reports. National indicators listed with evidence of use include the
number of visitors to protected areas (Madagascar), consumption of organic products (Switzerland)
and volunteer time (United Kingdom). The UK indicator consists of an index of volunteer time spent in
biodiversity conservation in selected UK conservation charities and incorporates annual data from
2000 onwards.
Regional/national:
The indicator SEBI 26 is about public awareness and consists of the percentage of EU citizens who
have heard of the term biodiversity (and are taking actions) resulting from opinion polls on
biodiversity undertaken every 2 years and covering all 27 Member States (who can use the national
component as proxy).
Global
See proposals from http://www.cbd.int/doc/meetings/cop/cop‐10/official/cop‐10‐09‐en.pdf page 11
on possible indicators.
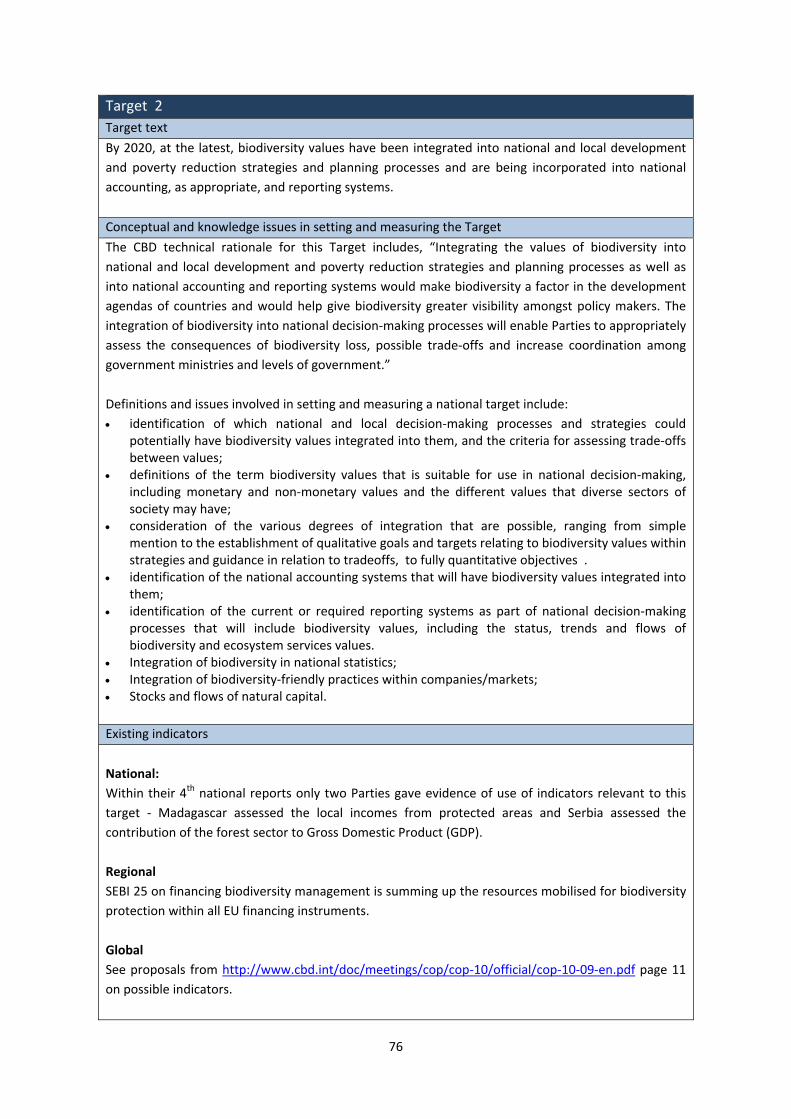
76
Target 2
Target text
By 2020, at the latest, biodiversity values have been integrated into national and local development
and poverty reduction strategies and planning processes and are being incorporated into national
accounting, as appropriate, and reporting systems.
Conceptual and knowledge issues in setting and measuring the Target
The CBD technical rationale for this Target includes, “Integrating the values of biodiversity into
national and local development and poverty reduction strategies and planning processes as well as
into national accounting and reporting systems would make biodiversity a factor in the development
agendas of countries and would help give biodiversity greater visibility amongst policy makers. The
integration of biodiversity into national decision‐making processes will enable Parties to appropriately
assess the consequences of biodiversity loss, possible trade‐offs and increase coordination among
government ministries and levels of government.”
Definitions and issues involved in setting and measuring a national target include:
identification of which national and local decision‐making processes and strategies could potentially have biodiversity values integrated into them, and the criteria for assessing trade‐offs between values;
definitions of the term biodiversity values that is suitable for use in national decision‐making, including monetary and non‐monetary values and the different values that diverse sectors of society may have;
consideration of the various degrees of integration that are possible, ranging from simple mention to the establishment of qualitative goals and targets relating to biodiversity values within strategies and guidance in relation to tradeoffs, to fully quantitative objectives .
identification of the national accounting systems that will have biodiversity values integrated into them;
identification of the current or required reporting systems as part of national decision‐making processes that will include biodiversity values, including the status, trends and flows of biodiversity and ecosystem services values.
Integration of biodiversity in national statistics; Integration of biodiversity‐friendly practices within companies/markets; Stocks and flows of natural capital.
Existing indicators
National:
Within their 4th national reports only two Parties gave evidence of use of indicators relevant to this
target ‐ Madagascar assessed the local incomes from protected areas and Serbia assessed the
contribution of the forest sector to Gross Domestic Product (GDP).
Regional
SEBI 25 on financing biodiversity management is summing up the resources mobilised for biodiversity
protection within all EU financing instruments.
Global
See proposals from http://www.cbd.int/doc/meetings/cop/cop‐10/official/cop‐10‐09‐en.pdf page 11
on possible indicators.
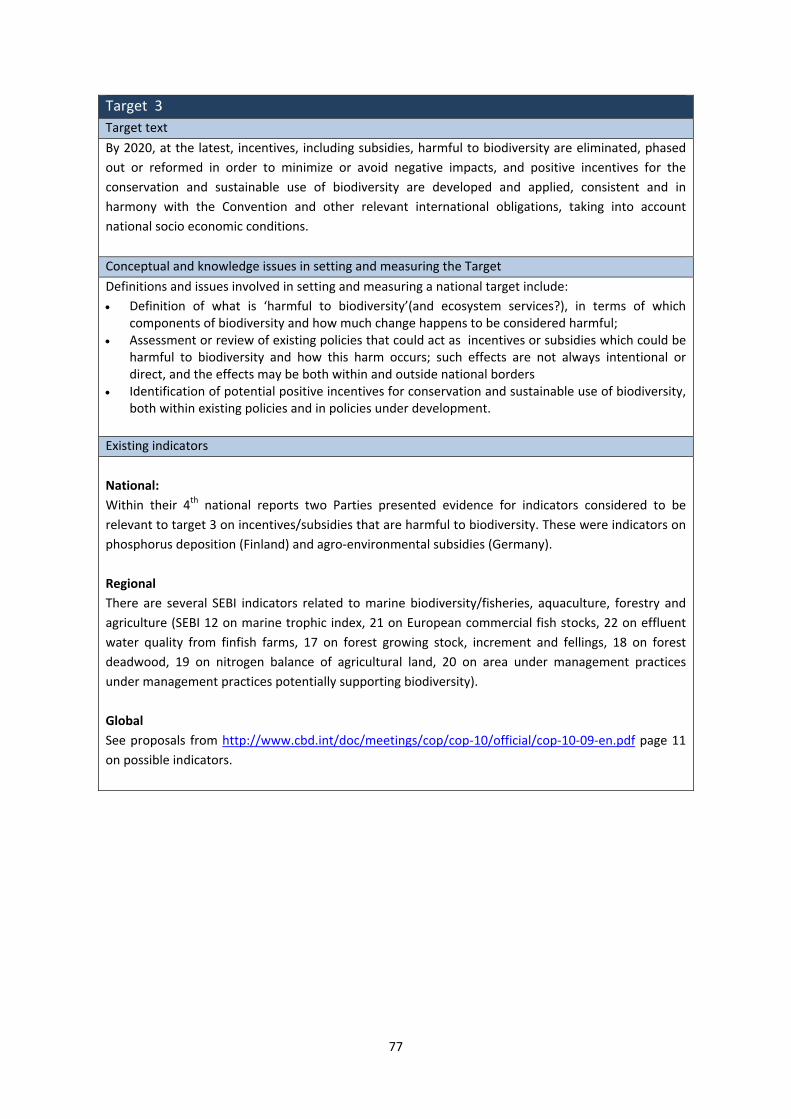
77
Target 3
Target text
By 2020, at the latest, incentives, including subsidies, harmful to biodiversity are eliminated, phased
out or reformed in order to minimize or avoid negative impacts, and positive incentives for the
conservation and sustainable use of biodiversity are developed and applied, consistent and in
harmony with the Convention and other relevant international obligations, taking into account
national socio economic conditions.
Conceptual and knowledge issues in setting and measuring the Target
Definitions and issues involved in setting and measuring a national target include:
Definition of what is ‘harmful to biodiversity’(and ecosystem services?), in terms of which components of biodiversity and how much change happens to be considered harmful;
Assessment or review of existing policies that could act as incentives or subsidies which could be harmful to biodiversity and how this harm occurs; such effects are not always intentional or direct, and the effects may be both within and outside national borders
Identification of potential positive incentives for conservation and sustainable use of biodiversity, both within existing policies and in policies under development.
Existing indicators
National:
Within their 4th national reports two Parties presented evidence for indicators considered to be
relevant to target 3 on incentives/subsidies that are harmful to biodiversity. These were indicators on
phosphorus deposition (Finland) and agro‐environmental subsidies (Germany).
Regional
There are several SEBI indicators related to marine biodiversity/fisheries, aquaculture, forestry and
agriculture (SEBI 12 on marine trophic index, 21 on European commercial fish stocks, 22 on effluent
water quality from finfish farms, 17 on forest growing stock, increment and fellings, 18 on forest
deadwood, 19 on nitrogen balance of agricultural land, 20 on area under management practices
under management practices potentially supporting biodiversity).
Global
See proposals from http://www.cbd.int/doc/meetings/cop/cop‐10/official/cop‐10‐09‐en.pdf page 11
on possible indicators.

78
Target 4
Target text
By 2020, at the latest, governments, business and stakeholders at all levels have taken steps to
achieve or have implemented plans for sustainable production and consumption and have kept the
impacts of use of natural resources well within safe ecological limits.
Conceptual and knowledge issues in setting and measuring the Target
The CBD technical rationale for this Target includes, “bringing the use of natural resources within safe
ecological limits is an integral part of the Strategic Plan. Reducing total demand and increasing
resource use and energy efficiency contribute to the target which can be pursued through
government regulations and/or incentives, education and research, and social and corporate
responsibility.”
Definitions and issues involved in setting and measuring a national target include:
Identification of the sectors and practices of natural resource use that have the greatest impacts on biodiversity
definition of what are safe ecological limits for impacts of natural resource use in relation to current and future societal needs (e.g. minimum or maximum levels of stock or supply of ecosystem services and biodiversity, functioning of ecosystem processes, thresholds of undesirable change);
assessment of the impact of use of natural resources (including pollution) on their status as being within safe ecological limits;
assessment of the roles and impacts of governments, business and stakeholders in their consumption and production of natural resources;
identification of potential steps for altering resource use that can be implanted or incorporated into plans.
Existing indicators
National:
At the national scale 31 Parties provided evidence of using indicators within their 4th national reports
that could be regarded as relevant to this target. The most common indicators include indicators of
trends in abundance and distribution of selected species (8 Parties), the area of forest under
sustainable management (6 Parties), bird population/trends by habitat type (5 Parties), the Ecological
Footprint and related concepts (4 Parties), population of key species (4 Parties), plant diversity and
conservation status (4 Parties), area of agricultural ecosystems under sustainable management (4
Parties), and unsustainable fishing/exploitation and catch per unit effort (4 Parties). The UK (9
indicators) and Canada (8 indicators) reported the most indicators related to this target.
Regional
SEBI 23 consists of the ecological footprint of EU countries. There are several SEBI indicators related
to marine biodiversity/fisheries, aquaculture, forestry and agriculture (SEBI 12 on marine trophic
index, 21 on European commercial fish stocks, 22 on effluent water quality from finfish farms, 17 on
forest growing stock, increment and fellings, 18 on forest deadwood, 19 on nitrogen balance of
agricultural land, 20 on area under management practices under management practices potentially
supporting biodiversity).
Global
See proposals from http://www.cbd.int/doc/meetings/cop/cop‐10/official/cop‐10‐09‐en.pdf page 11
on possible indicators.

79
Strategic goal B. Reduce the direct pressures on biodiversity and promote sustainable
use
Target 5
Target text
By 2020, at the latest, the rate of loss of all natural habitats, including forests, is at least halved and
where feasible brought close to zero, and degradation and fragmentation is significantly reduced.
Conceptual and knowledge issues in setting and measuring the Target
Definitions and issues involved in setting and measuring a national target include:
definition of what are natural habitats, including forest types; assessment of past rates of loss, including definition of an appropriate time frame for measuring
rates of loss; definition of what is considered to be degradation of natural habitats (e.g. loss of valued species,
loss of ecosystem services); definition of habitat fragmentation and appropriate measures, taking into account that some
habitats may be naturally fragmented; assessment of past rates of degradation and fragmentation of habitats, including definition of an
appropriate time frame for measuring rates of change.
Existing indicators
National:
There are 36 Parties that have shown evidence of indicators relevant to this target, in their 4th
national reports. The main indicators used assessed the extent of forests and forest types (20 Parties)
and the extent of assorted habitats (10 Parties). Other potentially relevant indicators listed include
the extent of area of forest under sustainable management (5 Parties), indices of sustainable
management (5 Parties), habitat conservation status (5 Parties), extent of forest fires (4 Parties) and
protected area overlays with biodiversity (4 Parties). Switzerland reported 9 indicators relevant to this
target and Finland reported 11.
Regional
There are several SEBI indicators related to species, habitats, protected areas, ecosystems and
fragmentation (SEBI 01 on abundance of common species/birds & butterflies, 02 on Red List Index for
European species, 03 on species of European interest, 04 on ecosystem coverage, 05 of habitats of
European interest, 07 of nationally designated protected areas, 08 on sites designated under the EU
Habitats and Birds Directives, 13 on fragmentation of natural and semi‐natural areas and 14 on
fragmentation of river systems).
Global
See proposals from http://www.cbd.int/doc/meetings/cop/cop‐10/official/cop‐10‐09‐en.pdf page 11
on possible indicators.

80
Target 6
Target text
By 2020, all fish and invertebrate stocks and aquatic plants are managed and harvested sustainably,
legally and applying ecosystem based approaches, so that overfishing is avoided, recovery plans and
measures are in place for all depleted species, fisheries have no significant adverse impacts on
threatened species and vulnerable ecosystems and the impacts of fisheries on stocks, species and
ecosystems are within safe ecological limits.
Conceptual and knowledge issues in setting and measuring the Target
Definitions and issues involved in setting and measuring a national target include:
definition of what are sustainable harvest levels for all fish and invertebrate stocks and aquatic plants;
definition of when the stocks of fish, invertebrates and aquatic plants are considered to be depleted and recovered;
definition of what are safe ecological limits for fisheries and marine and freshwater ecosystems for current and future societal needs (e.g. minimum or maximum levels of stock or supply, including ecosystem services and biodiversity values, functioning of ecosystem processes, thresholds of undesirable change);
identification of depleted species definition of which threatened species and vulnerable ecosystems could be impacted by fisheries
and the levels of impact which would be considered as adverse; assessment of current levels and trends of harvesting of fish, invertebrates and aquatic plants and
whether the stocks are depleted and the impacts of harvesting (including for non‐target species) are within safe ecological limits.
Existing indicators
National:
Within the 4th national reports, 26 Parties provided evidence of having utilized indicators that are
relevant to this target. The most prevalent national indicator used for this target is on trends in
abundance and distribution of selected species (8 Parties). Other indicators used include the
population of key species (4 Parties), population and abundance indices for threatened and endemic
species (4 Parties), unsustainable fishing/exploitation and catch per unit effort (4 Parties), exports of
valuable commercial species (3 Parties), and indices of aquatic ecosystems and fisheries management
(3 Parties).
Regional
There are several SEBI indicators related to marine biodiversity/fisheries, aquaculture, forestry and
agriculture, species, habitats, protected areas and fragmentation (SEBI 12 on marine trophic index, 21
on European commercial fish stocks, 22 on effluent water quality from finfish farms, 02 on Red List
Index for European species, 03 on species of European interest, 04 on ecosystem coverage, 05 of
habitats of European interest, 07 of nationally designated protected areas, 08 on marine sites
designated under the EU Habitats and Birds Directives).
Global
See proposals from http://www.cbd.int/doc/meetings/cop/cop‐10/official/cop‐10‐09‐en.pdf page 11
on possible indicators.

81
Target 7
Target text
By 2020, areas under agriculture, aquaculture and forestry are managed sustainably, ensuring
conservation of biodiversity.
Conceptual and knowledge issues in setting and measuring the Target
identification of areas managed for agriculture, aquaculture and forestry definition of what constitutes sustainable agriculture, aquaculture and forestry, including how it
ensures conservation of biodiversity, and what assessment approaches exist; definition of the desired, or minimum acceptable, aspects or values of biodiversity (and
ecosystem services) that should be conserved in areas with agriculture, aquaculture and forestry;
Existing indicators
National:
At the national level there are 34 Parties that have provided evidence of using indicators that are
regarded as relevant to this target, based on information in their 4th national reports. Like for target 5,
the most common relevant indicator used assessed the extent of forests and forest types (20 Parties).
Other indicators used by multiple Parties assessed the area of forest under sustainable management
[certification] (5 Parties), indices of sustainable management (5 Parties), Ecological Footprint and
related concepts (4 Parties), extent of forest fires (4 Parties), land use and land use changes (3
Parties), and populations of commercial species, harvest/exploitation and production levels (3
Parties). The countries that reported the highest use of relevant indicators are Switzerland (8
indicators), Canada and Serbia (both 7 indicators).
Regional
There are several SEBI indicators related to marine biodiversity/fisheries, aquaculture, forestry and
agriculture (SEBI 12 on marine trophic index, 21 on European commercial fish stocks, 22 on effluent
water quality from finfish farms, 17 on forest growing stock, increment and fellings, 18 on forest
deadwood, 19 on nitrogen balance of agricultural land, 20 on area under management practices
under management practices potentially supporting biodiversity, 02 on Red List Index for European
species, 03 on species of European interest, 04 on ecosystem coverage, 05 of habitats of European
interest, 07 of nationally designated protected areas, 08 on marine sites designated under the EU
Habitats and Birds Directives, 13 on fragmentation of natural and semi‐natural areas and 14 on
fragmentation of river systems).
Global
See proposals from http://www.cbd.int/doc/meetings/cop/cop‐10/official/cop‐10‐09‐en.pdf page 11
on possible indicators.

82
Target 8
Target text
By 2020, pollution, including from excess nutrients, has been brought to levels that are not
detrimental to ecosystem function and biodiversity.
Conceptual and knowledge issues in setting and measuring the Target
identification of important sources and levels of pollution (sectors, activities) identification of current impacts of pollution on ecosystem function(ing), biodiversity and
ecosystem services definition of ecosystem function(ing) and detrimental change in relation to biodiversity and
ecosystem services,; identification of levels of pollution that are detrimental to ecosystem function(ing) and
biodiversity
Existing indicators
National:
There are 14 Parties that have evidence of use of national indicators that relate to this target, on the
basis of information from their 4th national reports. Indicators listed with evidence of use include
nitrogen deposition (4 Parties), Ecological Footprint and related concepts (4 Parties), water quality
indicators (4 Parties), seawater and inland water quality (3 Parties) and various other indicators on
pollution and contamination such as air pollution, pollution of aquatic ecosystems, waste and toxic
substance production, and pesticides. Finland reported nine indicators that relate to this target.
Regional
The SEBI indicators consist of 09 on critical load exceedance for nitrogen and 15 on nutrients in
transitional, coastal and marine waters.
Global
See proposals from http://www.cbd.int/doc/meetings/cop/cop‐10/official/cop‐10‐09‐en.pdf page 11
on possible indicators.

83
Target 9
Target text
By 2020, invasive alien species and pathways are identified and prioritized, priority species are
controlled or eradicated, and measures are in place to manage pathways to prevent their introduction
and establishment.
Conceptual and knowledge issues in setting and measuring the Target
definition of which species are alien invasive species, in terms of being a current or future problem for the conservation and sustainable use of biodiversity and ecosystem services;
definition of criteria for identifying priority species assessment of potential IAS is relation to criteria assessment of the current and likely future impact of each alien invasive species on the
conservation and sustainable use of biodiversity and ecosystem services; identification of pathways of introduction identification of management options.
Existing indicators
National:
Existing national indicators related to this target have been shown to be used by 21 Parties within
their 4th national reports. Nine Parties reported on the use of indicators assessing trends in the
invasive alien species. Other likely relevant indicators include assessments of the Red List Index (4
Parties), the population of key species (4 Parties), the population and abundance indices for
threatened and endemic species (4 Parties), and various other indicators directly related to invasive
alien species, such as their impacts on biodiversity, eradication and control.
Regional
SEBI 10 is on invasive alien species in Europe.
Global
See proposals from http://www.cbd.int/doc/meetings/cop/cop‐10/official/cop‐10‐09‐en.pdf page 11
on possible indicators.

84
Target 10
Target text
By 2015 the multiple anthropogenic pressures on coral reefs, and other vulnerable ecosystems
impacted by climate change or ocean acidification are minimized, so as to maintain their integrity and
functioning.
Conceptual and knowledge issues in setting and measuring the Target
The CBD technical rationale for this Target includes, “given the ecological inertias related to climate change and ocean acidification, it is important to urgently reduce other anthropogenic pressures on vulnerable ecosystems such as coral reefs, so as to give vulnerable ecosystems time to cope with the pressures caused by climate change. This can be accomplished by addressing those pressures on which are most amenable to rapid positive changes and would include activities such as reducing pollution and overexploitation and harvesting practices which have negative consequences on ecosystems.”
Definitions and issues involved in setting and measuring a national target include:
identification of which ecosystems, in addition to coral reefs, are vulnerable to climate change and/or ocean acidification impacts
identification of other pressures acting on those ecosystems that increase their vulnerability to loss of ‘integrity and functioning’;
definition of what are the key components of integrity and functioning for the vulnerable ecosystems and the target levels or properties for these components ;
identification of the scale and impact of the anthropogenic pressures in addition to climate change and/or ocean acidification that are impacting vulnerable ecosystems.
Existing indicators
National:
Eleven Parties have provided evidence of using national indicators relevant to this target within their
4th national reports. The most common indicators relate to unsustainable fishing/exploitation and
catch per unit effort (Brazil, Netherlands, Nicaragua & Peru), seawater and inland water quality
(Austria, Brazil & Finland), proportion of fish stocks in safe biological limits (Canada & UK), the Marine
Trophic Index (China & UK), and responsible fishing methods/technologies (Brazil & Canada). Brazil,
Indonesia and the UK each have used three indicators related to this target, with Indonesia’s
indicators focused on the condition of coral reefs and mangrove cover.
Regional
SEBI indicator on climate change in development.
Global
See proposals from http://www.cbd.int/doc/meetings/cop/cop‐10/official/cop‐10‐09‐en.pdf page 11
on possible indicators.
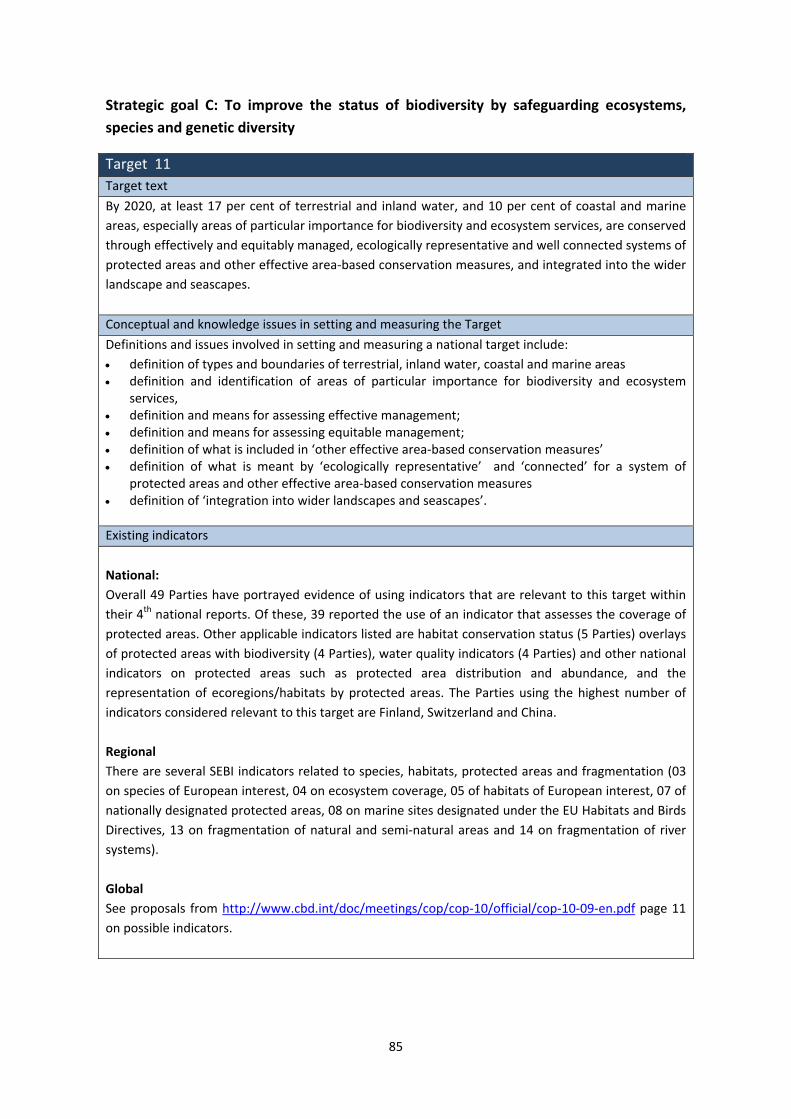
85
Strategic goal C: To improve the status of biodiversity by safeguarding ecosystems,
species and genetic diversity
Target 11
Target text
By 2020, at least 17 per cent of terrestrial and inland water, and 10 per cent of coastal and marine
areas, especially areas of particular importance for biodiversity and ecosystem services, are conserved
through effectively and equitably managed, ecologically representative and well connected systems of
protected areas and other effective area‐based conservation measures, and integrated into the wider
landscape and seascapes.
Conceptual and knowledge issues in setting and measuring the Target
Definitions and issues involved in setting and measuring a national target include:
definition of types and boundaries of terrestrial, inland water, coastal and marine areas definition and identification of areas of particular importance for biodiversity and ecosystem
services, definition and means for assessing effective management; definition and means for assessing equitable management; definition of what is included in ‘other effective area‐based conservation measures’ definition of what is meant by ‘ecologically representative’ and ‘connected’ for a system of
protected areas and other effective area‐based conservation measures definition of ‘integration into wider landscapes and seascapes’.
Existing indicators
National:
Overall 49 Parties have portrayed evidence of using indicators that are relevant to this target within
their 4th national reports. Of these, 39 reported the use of an indicator that assesses the coverage of
protected areas. Other applicable indicators listed are habitat conservation status (5 Parties) overlays
of protected areas with biodiversity (4 Parties), water quality indicators (4 Parties) and other national
indicators on protected areas such as protected area distribution and abundance, and the
representation of ecoregions/habitats by protected areas. The Parties using the highest number of
indicators considered relevant to this target are Finland, Switzerland and China.
Regional
There are several SEBI indicators related to species, habitats, protected areas and fragmentation (03
on species of European interest, 04 on ecosystem coverage, 05 of habitats of European interest, 07 of
nationally designated protected areas, 08 on marine sites designated under the EU Habitats and Birds
Directives, 13 on fragmentation of natural and semi‐natural areas and 14 on fragmentation of river
systems).
Global
See proposals from http://www.cbd.int/doc/meetings/cop/cop‐10/official/cop‐10‐09‐en.pdf page 11
on possible indicators.

86
Target 12
Target text
By 2020, the extinction of known threatened species has been prevented and their conservation
status, particularly of those most in decline, has been improved and sustained.
Conceptual and knowledge issues in setting and measuring the Target
Definitions and issues involved in setting and measuring a national target include:
identification of which known threatened species are most in decline and the reasons for their decline;
identification of threatened species at risk of extinction by 2020 assessment of the conservation status of known threatened species in 2020, including likely
future trajectories.
Existing indicators
National:
At a national level 32 Parties have provided evidence of use of indicators regarded to be related to
this target. Indicators reported by Parties include those assessing the trends in abundance and
distribution of selected species (8 Parties), the population of key species (4 Parties), the Red List Index
(4 Parties), plant diversity and conservation status (4 Parties), bird populations/trends by habitat
types (5 Parties), the population and abundance indices for threatened and endemic species (4
Parties), and the conservation status of species (4 Parties).
Regional
There are several SEBI indicators related to species, habitats, protected areas and fragmentation (02
Red List index for European species, 03 on species of European interest, 05 of habitats of European
interest, 07 of nationally designated protected areas, 08 on sites designated under the EU Habitats
and Birds Directives).
Global
See proposals from http://www.cbd.int/doc/meetings/cop/cop‐10/official/cop‐10‐09‐en.pdf page 11
on possible indicators.

87
Target 13
Target text
By 2020, the genetic diversity of cultivated plants and farmed and domesticated animals and of wild
relatives, including other socio‐economically as well as culturally valuable species, is maintained, and
strategies have been developed and implemented for minimizing genetic erosion and safeguarding
their genetic diversity.
Conceptual and knowledge issues in setting and measuring the Target
Definitions and issues involved in setting and measuring a national target include:
identification of cultivated plants and farmed and domesticated animals
definition and identification of ‘other socio‐economically as well as culturally valuable species’;
definition and assessment of the genetic diversity of cultivated plants and farmed and domesticated animals, including other socio‐economically as well as culturally valuable species, in 2011 and 2020;
identification and assessment of the status of wild relatives of cultivated plants and farmed and domesticated animals, in 2011 and 2020;
identification of the causes of loss of genetic diversity of cultivated plants and farmed and domesticated animals, including other socio‐economically as well as culturally valuable species;
identification of the causes of loss of wild relatives of cultivated plants and farmed and domesticated animals, including other socio‐economically as well as culturally valuable species;
identification of options for minimizing genetic erosion including gene banks and ex‐situ conservation programmes.
Existing indicators
National:
Indicators that are considered relevant to this target have been used by 12 Parties, based on evidence
of their use within the 4th national reports. These 12 Parties are Argentina, Bangladesh, Brazil,
Hungary, Indonesia, Madagascar, Myanmar, the Netherlands, Nigeria, Sudan, Switzerland and the UK.
The most common indicator assessed ex situ crop collections (6 Parties), with other indicators
assessing the genetic diversity of terrestrial domesticated animals (3 Parties), livestock genetic
diversity (3 Parties) and indices of breeding success and propagation (2 Parties), alongside others.
Regional
SEBI 06 is on livestock genetic diversity.
Global
See proposals from http://www.cbd.int/doc/meetings/cop/cop‐10/official/cop‐10‐09‐en.pdf page 11
on possible indicators.

88
Strategic goal D: Enhance the benefits to all from biodiversity and ecosystem services.
Target 14
Target text
By 2020, ecosystems that provide essential services, including services related to water, and
contribute to health, livelihoods and well‐being, are restored and safeguarded, taking into account
the needs of women, indigenous and local communities, and the poor and vulnerable.
Conceptual and knowledge issues in setting and measuring the Target
The CBD technical rationale for this Target includes, “Some ecosystems, such as those that provide
ecosystem services related to the provision of water, are particularly important in that they provide
services that are essential for human wellbeing, in particular for the lives and livelihoods of women
and indigenous and local communities, including the poor and vulnerable. Accordingly, priority should
be given to safeguarding, or restoring such ecosystems, and to ensuring that people have adequate
access to these services. Ecosystems which provide essential services and that contribute to local
livelihoods should be identified through participatory processes at local, national and global levels and
in accordance with Article 10 of the Convention. The resulting information should be integrated into
development plans to ensure that these ecosystems receive the necessary protection and
investments.”
Definitions and issues involved in setting and measuring a national target include:
identification of which ecosystem services are essential for the country and for different groups, including women, indigenous and local communities, and the poor and vulnerable, and of likely future needs;
identification of which ecosystems provide the essential services;
assessment of the condition and trends of those ecosystems and the services they provide;
identify needs for restoration or safeguarding of those ecosystems to provide these services at needed levels;
identification of appropriate actions to restore and/or safeguard as needed of those ecosystems;
assessment of potential impacts of restoration or safeguarding actions on women, indigenous and local communities, and the poor and vulnerable;
assessment of whether groups that require essential ecosystem services, including women, indigenous and local communities, and the poor and vulnerable, have sufficient access to the services to meet their needs.
Existing indicators
National:
National level indicators identified as relevant to this target were shown to be used by 40 Parties,
based on analysis of their 4th national reports. The indicators reported the most are those assessing
the extent of forest and forest types (20 Parties), extent of assorted habitats (10 Parties), trends in
abundance & distribution of selected species (8 Parties), and habitat conservation status (5 Parties).
Other highly relevant indicators listed are water quality (Brazil, China, Finland & UK), water quantity
89
(Brazil & Serbia), biodiversity for food and medicine (Russian Federation), and medicinal plant
conservation measures (Nigeria). Some countries have reported the use of over ten indicators that are
related to this target, these being Finland (13 indicators), Canada (12), Serbia (12) and Switzerland
(11). No Parties reported provided evidence of using indicators on the health and well being of
communities directly dependant on ecosystem goods and services within their 4th national reports.
Regional
There are few SEBI indicators related to fragmentation (13 on fragmentation of natural and semi‐
natural areas and 14 on fragmentation of river systems).
Global
See proposals from http://www.cbd.int/doc/meetings/cop/cop‐10/official/cop‐10‐09‐en.pdf page 11
on possible indicators.

90
Target 15
Target text
By 2020, ecosystem resilience and the contribution of biodiversity to carbon stocks has been
enhanced, through conservation and restoration, including restoration of at least 15 per cent of
degraded ecosystems, thereby contributing to climate change mitigation and adaptation and to
combating desertification.
Conceptual and knowledge issues in setting and measuring the Target
The CBD technical rationale for this Target includes, “Restored landscapes and seascapes can improve
resilience, including adaptive capacity of ecosystems and societies, contributing to climate change
adaptation and generating additional benefits for people, in particular indigenous and local
communities and the rural poor.”
Definitions and issues involved in setting and measuring a national target include:
assessment of the current and past contribution of biodiversity to carbon stocks (terrestrial, aquatic and marine), principally through assessing carbon stocks of major ecosystems and vegetation types;
identification of ecosystems where conservation will lead to increase in carbon stocks, i.e. those with sequestration potential, which may act as carbon sinks, including natural ecosystems in early successional stages;
identification and quantification of extent and carbon stocks of degraded ecosystems;
identification of degraded systems where restoration would increase carbon stocks;
assessment of the contribution of biodiversity to carbon stocks in 2020 using methods and definitions comparable with assessment of current carbon stocks, and identification of change in total stocks and in those where conservation or restoration action has been taken.
Existing indicators
National:
At the national scale 36 Parties showed evidence of the use of indicators that are relevant to target
15. As for several other targets, the indicators most commonly reported relate to the extent of forests
and forest types (20 Parties), the extent of assorted habitats (10 Parties), habitat conservation status
(5 Parties), Ecological Footprint and related concepts (4 Parties), and the extent of forest fires (4
Parties). Brazil reported the use of an indicator specifically on the area of forest under sustainable
management [degradation and deforestation].
Regional
There are several SEBI indicators related to ecosystems, habitats, and protected areas (04 on
ecosystem coverage, 05 of habitats of European interest, 07 of nationally designated protected areas,
08 on sites designated under the EU Habitats and Birds Directives).
Global
See proposals from http://www.cbd.int/doc/meetings/cop/cop‐10/official/cop‐10‐09‐en.pdf page 11
on possible indicators.

91
Target 16
Target text
By 2015, the Nagoya Protocol on Access to Genetic Resources and the Fair and Equitable Sharing of
Benefits Arising from their Utilization is in force and operational, consistent with national legislation.
Conceptual and knowledge issues in setting and measuring the Target
Definition of what ‘in force’ means.
Identification of operational instruments for ABS (legislation frameworks, agreements,
technical assistance programmes).
Existing indicators
National:
Only China gave evidence of using an indicator that relates to this target, according to 4th national
reports. The indicator used by China assessed the benefit sharing arising from genetic resources laws
and regulations.
Regional
There is SEBI 24 on patent application based on genetic resources.
Global
See proposals from http://www.cbd.int/doc/meetings/cop/cop‐10/official/cop‐10‐09‐en.pdf page 11
on possible indicators.

92
Strategic goal E. Enhance implementation through participatory planning, knowledge
management and capacity building
Target 17
Target text
By 2015, each Party has developed, adopted as a policy instrument, and has commenced
implementing an effective, participatory and updated national biodiversity strategy and action plan.
Conceptual and knowledge issues in setting and measuring the Target
None.
Existing indicators
National:
There are no national indicators considered relevant to this target that have evidence of use within
the 4th national reports.
Regional
No SEBI indicator.
Global
See proposals from http://www.cbd.int/doc/meetings/cop/cop‐10/official/cop‐10‐09‐en.pdf page 11
on possible indicators.

93
Target 18
Target text
By 2020, the traditional knowledge, innovations and practices of indigenous and local communities
relevant for the conservation and sustainable use of biodiversity, and their customary use of biological
resources, are respected, subject to national legislation and relevant international obligations, and
fully integrated and reflected in the implementation of the Convention with the full and effective
participation of indigenous and local communities, at all relevant levels.
Conceptual and knowledge issues in setting and measuring the Target
Definitions and issues involved in setting and measuring a national target include:
identification of indigenous and local communities and effective ways of ensuring their participation;
definition of terms and ways of describing traditional knowledge, innovations and practices of indigenous and local communities relevant for the conservation and sustainable use of biodiversity, considering their acceptability to these communities and other stakeholders involved in the implementation of the Convention;
identification of the traditional knowledge, innovations and practices of indigenous and local communities that are relevant for the conservation and sustainable use of biodiversity;
definitions of respecting such knowledge;
identification of ways of, and opportunities for integrating traditional knowledge in policies and actions to implement the Convention.
Existing indicators
National:
Indicators regarded to be related to this target have been shown to be used by seven Parties –
Australia, Brazil, Madagascar, Myanmar, the Netherlands, Russian Federation and the UK – within
their 4th national reports. Indicators reported are on the status and trends of linguistic diversity and
numbers of speakers of indigenous languages (Australia & Russian Federation), livestock genetic
diversity (Brazil, Netherlands & UK), genetic diversity of terrestrial domesticated animals
(Madagascar, Myanmar & UK), and activities and legislation adopted to protect traditional knowledge
(Russian Federation).
Regional
No SEBI indicator.
Global
See proposals from http://www.cbd.int/doc/meetings/cop/cop‐10/official/cop‐10‐09‐en.pdf page 11
on possible indicators.
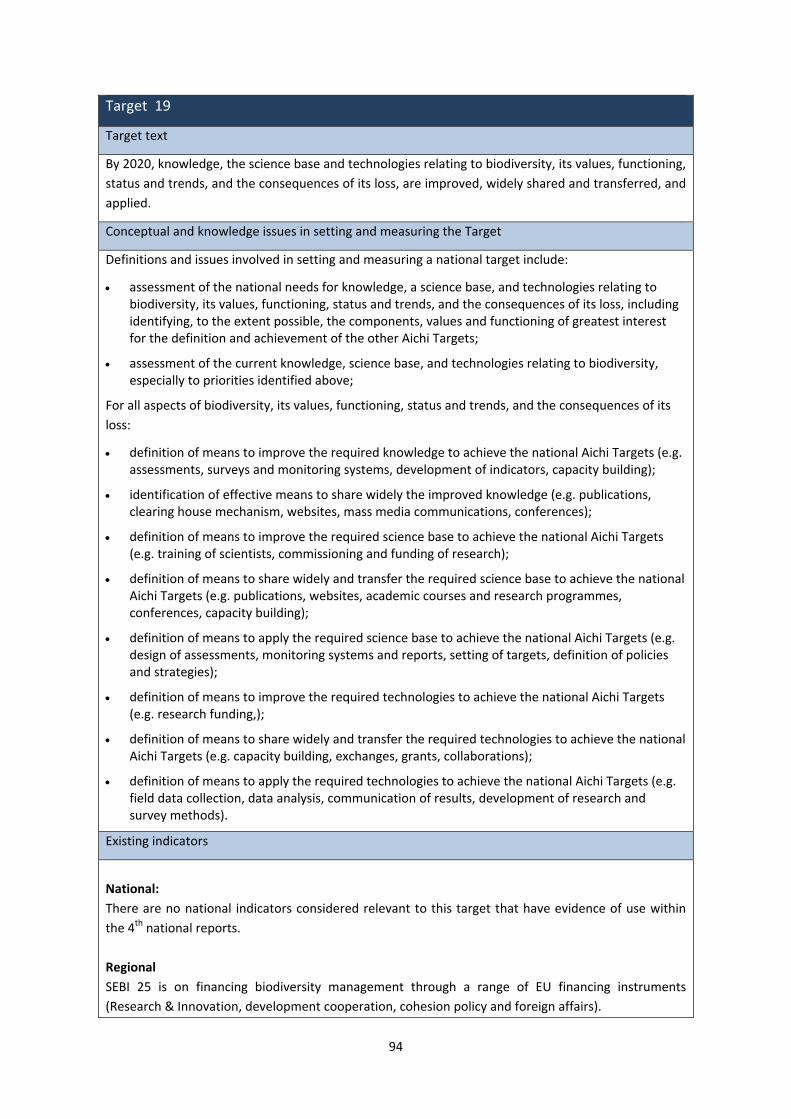
94
Target 19
Target text
By 2020, knowledge, the science base and technologies relating to biodiversity, its values, functioning,
status and trends, and the consequences of its loss, are improved, widely shared and transferred, and
applied.
Conceptual and knowledge issues in setting and measuring the Target
Definitions and issues involved in setting and measuring a national target include:
assessment of the national needs for knowledge, a science base, and technologies relating to biodiversity, its values, functioning, status and trends, and the consequences of its loss, including identifying, to the extent possible, the components, values and functioning of greatest interest for the definition and achievement of the other Aichi Targets;
assessment of the current knowledge, science base, and technologies relating to biodiversity, especially to priorities identified above;
For all aspects of biodiversity, its values, functioning, status and trends, and the consequences of its
loss:
definition of means to improve the required knowledge to achieve the national Aichi Targets (e.g. assessments, surveys and monitoring systems, development of indicators, capacity building);
identification of effective means to share widely the improved knowledge (e.g. publications, clearing house mechanism, websites, mass media communications, conferences);
definition of means to improve the required science base to achieve the national Aichi Targets (e.g. training of scientists, commissioning and funding of research);
definition of means to share widely and transfer the required science base to achieve the national Aichi Targets (e.g. publications, websites, academic courses and research programmes, conferences, capacity building);
definition of means to apply the required science base to achieve the national Aichi Targets (e.g. design of assessments, monitoring systems and reports, setting of targets, definition of policies and strategies);
definition of means to improve the required technologies to achieve the national Aichi Targets (e.g. research funding,);
definition of means to share widely and transfer the required technologies to achieve the national Aichi Targets (e.g. capacity building, exchanges, grants, collaborations);
definition of means to apply the required technologies to achieve the national Aichi Targets (e.g. field data collection, data analysis, communication of results, development of research and survey methods).
Existing indicators
National:
There are no national indicators considered relevant to this target that have evidence of use within
the 4th national reports.
Regional
SEBI 25 is on financing biodiversity management through a range of EU financing instruments
(Research & Innovation, development cooperation, cohesion policy and foreign affairs).

95
Global
See proposals from http://www.cbd.int/doc/meetings/cop/cop‐10/official/cop‐10‐09‐en.pdf page 11
on possible indicators.
Target 20
Target text
By 2020, at the latest, the mobilization of financial resources for effectively implementing the
Strategic Plan 2011‐2020 from all sources and in accordance with the consolidated and agreed
process in the Strategy for Resource Mobilization should increase substantially from the current
levels.
Conceptual and knowledge issues in setting and measuring the Target
This Target is only addressed by this report in terms of national funding for implementation of the
CBD, as per the terms of reference for the report.
Reference to the 15 resource mobilisation indicators adopted in COP 10 decision X/3, item 7 pages 2‐3
(http://www.cbd.int/doc/decisions/COP‐10/cop‐10‐dec‐03‐en.doc) should be made.
Existing indicators
National:
There are eight Parties that have provided evidence of using indicators in their 4th national reports
that could be considered relevant to this target. Indicators listed assessed the official development
assistance provided in support of the Convention (Australia, Ecuador, Russian Federation & Samoa),
the money spent on nature protection (Azerbaijan, Ecuador & Guatemala), projects financed in
regards to the environment (China), and expenditure and investments in environmental protection
(Peru).
Regional
SEBI 25 is on financing biodiversity management through EU financing instruments. SEBI 26 is on
public awareness.
Global
See proposals from http://www.cbd.int/doc/meetings/cop/cop‐10/official/cop‐10‐09‐en.pdf page 11
on possible indicators.
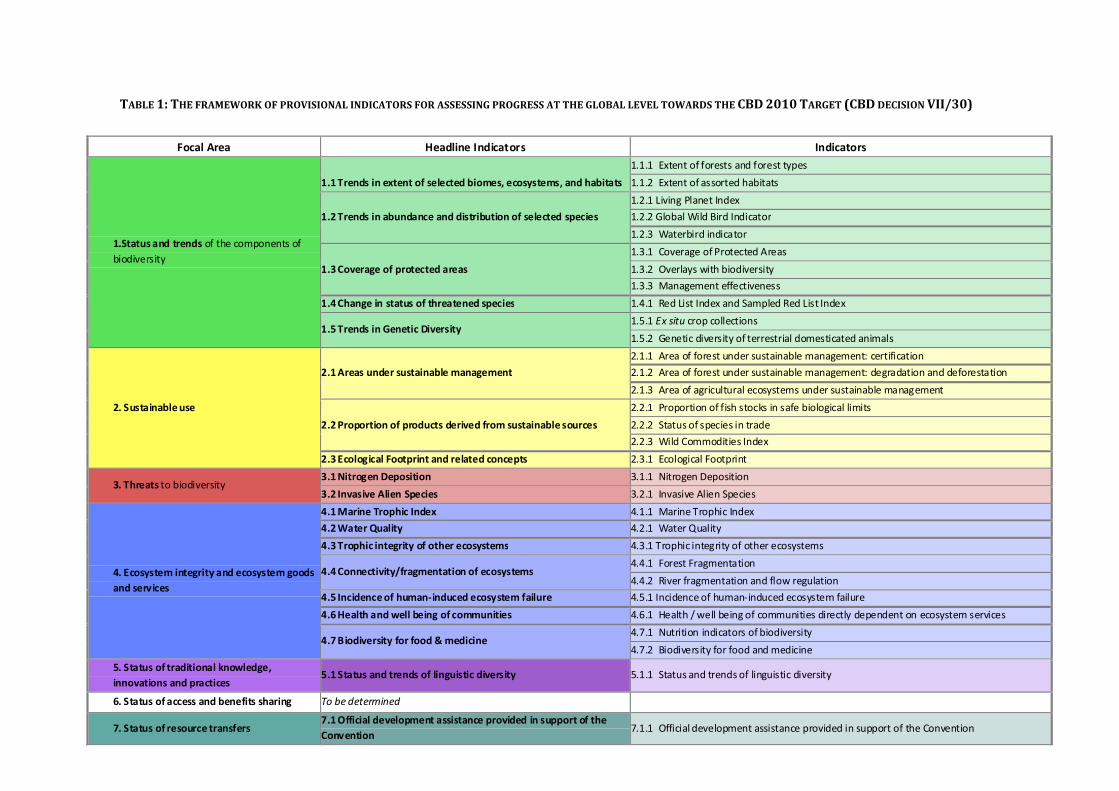
96
TABLE 1: THE FRAMEWORK OF PROVISIONAL INDICATORS FOR ASSESSING PROGRESS AT THE GLOBAL LEVEL TOWARDS THE CBD 2010 TARGET (CBD DECISION VII/30)
Focal Area Headline Indicators Indicators
1.Status and trends of the components of
biodiversity
1.1 Trends in extent of selected biomes, ecosystems, and habitats
1.1.1 Extent of forests and forest types
1.1.2 Extent of assorted habitats
1.2 Trends in abundance and distribution of selected species
1.2.1 Living Planet Index
1.2.2 Global Wild Bird Indicator
1.2.3 Waterbird indicator
1.3 Coverage of protected areas
1.3.1 Coverage of Protected Areas
1.3.2 Overlays with biodiversity
1.3.3 Management effectiveness
1.4 Change in status of threatened species 1.4.1 Red List Index and Sampled Red List Index
1.5 Trends in Genetic Diversity 1.5.1 Ex situ crop collections
1.5.2 Genetic diversity of terrestrial domesticated animals
2. Sustainable use
2.1 Areas under sustainable management
2.1.1 Area of forest under sustainable management: certification
2.1.2 Area of forest under sustainable management: degradation and deforestation
2.1.3 Area of agricultural ecosystems under sustainable management
2.2 Proportion of products derived from sustainable sources
2.2.1 Proportion of fish stocks in safe biological limits
2.2.2 Status of species in trade
2.2.3 Wild Commodities Index
2.3 Ecological Footprint and related concepts 2.3.1 Ecological Footprint
3. Threats to biodiversity 3.1 Nitrogen Deposition 3.1.1 Nitrogen Deposition
3.2 Invasive Alien Species 3.2.1 Invasive Alien Species
4. Ecosystem integrity and ecosystem goods
and services
4.1 Marine Trophic Index 4.1.1 Marine Trophic Index
4.2 Water Quality 4.2.1 Water Quality
4.3 Trophic integrity of other ecosystems 4.3.1 Trophic integrity of other ecosystems
4.4 Connectivity/fragmentation of ecosystems 4.4.1 Forest Fragmentation
4.4.2 River fragmentation and flow regulation
4.5 Incidence of human‐induced ecosystem failure 4.5.1 Incidence of human‐induced ecosystem failure
4.6 Health and well being of communities 4.6.1 Health / well being of communities directly dependent on ecosystem services
4.7 Biodiversity for food & medicine 4.7.1 Nutrition indicators of biodiversity
4.7.2 Biodiversity for food and medicine
5. Status of traditional knowledge,
innovations and practices 5.1 Status and trends of linguistic diversity 5.1.1 Status and trends of linguistic diversity
6. Status of access and benefits sharing To be determined
7. Status of resource transfers 7.1 Official development assistance provided in support of the
Convention 7.1.1 Official development assistance provided in support of the Convention

97
TABLE 2: THE FRAMEWORK FOR THE 2020 AICHI NAGOYA TARGETS (ABBREVIATED TEXT – SEE ANNEX 4 FOR THE FULL TEXT)
Strategic goal A. Address the underlying causes of biodiversity loss
Target 1: By 2020, people are aware of the values of biodiversity and the steps they can take to conserve and use it sustainably.
Target 2: By 2020, biodiversity values are integrated into national and local development and poverty reduction strategies and planning processes and national accounts…
Target 3: By 2020, incentives, including subsidies, harmful to biodiversity are eliminated, phased out or reformed…
Target 4: By 2020, Governments, business and stakeholders have plans for sustainable production and consumption and keep the impacts of resource use within safe ecological limits.
Strategic goal B. Reduce the direct pressures on biodiversity and promote sustainable use
Target 5: By 2020, the rate of loss of all natural habitats, including forests, is at least halved and where feasible brought close to zero, and degradation and fragmentation is significantly reduced.
Target 6: By 2020 all fish and invertebrate stocks and aquatic plants are managed and harvested sustainably, so that overfishing is avoided…
Target 7: By 2020 areas under agriculture, aquaculture and forestry are managed sustainably, ensuring conservation of biodiversity.
Target 8: By 2020, pollution, including from excess nutrients, has been brought to levels that are not detrimental to ecosystem function and biodiversity.
Target 9: By 2020, invasive alien species and pathways are identified and prioritized, priority species are controlled or eradicated, and measures are in place to manage pathways to prevent their introduction and establishment.
Target 10: By 2015, the multiple anthropogenic pressures on coral reefs, and other vulnerable ecosystems impacted by climate change or ocean acidification are minimized, so as to maintain their integrity and functioning.
Strategic goal C: To improve the status of biodiversity by safeguarding ecosystems, species and genetic diversity
Target 11: By 2020, at least 17 per cent of terrestrial and inland water, and 10 per cent of coastal and marine areas are conserved through systems of protected areas…
Target 12: By 2020 the extinction of known threatened species has been prevented and their conservation status, particularly of those most in decline, has been improved and sustained.
Target 13: By 2020, the genetic diversity of cultivated plants and farmed and domesticated animals and of wild relatives is maintained.
Strategic goal D: Enhance the benefits to all from biodiversity and ecosystem services
Target 14: By 2020, ecosystems that provide essential services are restored and safeguarded.
Target 15: By 2020, ecosystem resilience and the contribution of biodiversity to carbon stocks has been enhanced, through conservation and restoration, including restoration of at least 15 per cent of degraded ecosystems.
Target 16: By 2015, the Nagoya Protocol on Access and Benefits Sharing is in force and operational.
Strategic goal E. Enhance implementation through participatory planning, knowledge management and capacity building
Target 17: By 2015 each Party has developed, adopted as a policy instrument, and has commenced implementing an effective, participatory and updated NBSAP.
Target 18: By 2020, the traditional knowledge, innovations and practices of indigenous and local communities and their customary use, are respected.
Target 19: By 2020, knowledge, the science base and technologies relating to biodiversity, its values, functioning, status and trends, and the consequences of its loss, are improved, widely shared and transferred, and applied.
Target 20: By 2020, the mobilization of financial resources for effectively implementing the Strategic Plan for Biodiversity 2011‐2020 from all sources, should increase substantially.