Embed Size (px)
Citation preview
Experimental Validation of the Hyperpolarized 129Xe Chemical Shift Saturation Recovery
Technique in Healthy Volunteers and Subjects with Interstitial Lung Disease
Running Head: Experimental Validation of HP 129Xe CSSR
Neil J. Stewart1, General Leung1, Graham Norquay1, Helen Marshall1, Juan Parra-Robles1, Philip S.
Murphy2, Rolf F. Schulte3, Charlie Elliot4, 5, Robin Condliffe4, 5, Paul D. Griffiths1, David G. Kiely4, 5,
Moira K. Whyte4, Jan Wolber1, 6, Jim M. Wild1
1 Academic Unit of Radiology, University of Sheffield, Royal Hallamshire Hospital, Sheffield, UK, 2
Clinical Imaging, GlaxoSmithKline, Brentford, UK, 3 GE Global Research, Garching, DE, 4 Academic
Directorate of Respiratory Medicine, University of Sheffield, Royal Hallamshire Hospital, Sheffield, UK, 5 Sheffield Pulmonary Vascular Disease Unit, Sheffield Teaching Hospitals, Royal Hallamshire Hospital,
Sheffield, UK, 6 Medical Diagnostics, GE Healthcare, Amersham, UK
Corresponding author: Jim M. Wild, [email protected],
Academic Unit of Radiology, C Floor, Royal Hallamshire Hospital, Sheffield, South Yorkshire, S10 2JF,
United Kingdom
Word count (minus title page, abstract, figure captions, references): 4902
(Word limit = 5000)
Abstract
Purpose: To assess the sensitivity of the hyperpolarized 129Xe chemical shift saturation recovery (CSSR)
technique for non-invasive quantification of changes to lung microstructure and function in idiopathic
pulmonary fibrosis (IPF) and systemic sclerosis (SSc).
Methods: Ten healthy volunteers, four subjects with SSc and four with IPF were scanned at 1.5 T. A
CSSR pulse sequence was implemented using binomial-composite radiofrequency pulses to monitor 129Xe
magnetization in tissues and blood plasma (T/P) and red blood cells (RBCs). The dynamics of 129Xe
uptake into these compartments were fitted with three existing analytical models of gas diffusion to
extract important parameters of lung physiology. These parameters were quantitatively compared
between models.
Results: Uptake of xenon into the pulmonary capillaries was impaired in subjects with IPF and SSc.
Statistically significant septal thickening was measured by 129Xe CSSR in IPF patients. Preliminary data
suggests age-dependent alterations to septal thickness in healthy volunteers. These findings were
reproduced using each of the literature models. CSSR-derived parameters were compared with gold-
standard indicators of pulmonary function; diffusing capacity of carbon monoxide and pulmonary transit-
time.
Conclusion: CSSR with hyperpolarized 129Xe is sensitive to pathology-induced degradation of lung
structure/function and shows promise for quantification of disease severity and monitoring treatment
response.
Word count: 200 (max 200)
Keywords: hyperpolarized gas; xenon-129; lung physiology; gas-exchange; idiopathic pulmonary
fibrosis; systemic sclerosis
1
Introduction
MRI with the hyperpolarized (HP) noble gases 3He and 129Xe has facilitated innovative, non-invasive
studies of lung structure (1-3) and function (4-7). Advances in spin exchange optical pumping (SEOP)
technologies (8-10) have enabled routine achievement of 129Xe nuclear polarizations of up to 40%,
allowing the acquisition of pulmonary ventilation images of comparable quality to 3He (11). 129Xe
possesses attractive properties for in-vivo functional studies of the lungs; for example its solubility in
parenchymal tissues and blood (12). Also, since the xenon electron cloud is highly polarizable, 129Xe
exhibits a wide range of NMR chemical shifts in different chemical environments (13). Of particular
importance for lung studies are the resonances of 129Xe dissolved in parenchymal tissues and blood
plasma (T/P) and 129Xe dissolved in red blood cells (RBCs) – collectively termed “dissolved-phase” 129Xe.
These are well separated from the “gaseous-phase” 129Xe resonance, at 197 ppm and 217 ppm downfield,
respectively. Since xenon is chemically inert and is not metabolized in the body, the NMR signal
measured from dissolved-phase 129Xe in-vivo is governed by diffusive uptake from the lung airspaces and
perfusion in the capillaries, allowing quantitative mathematical modeling of the gas-exchange process
from 129Xe NMR data.
These properties have been explored in several studies of gas-exchange function in the lungs with
different pulse sequences. Direct imaging techniques (4,5,14) have been used, wherein the gaseous and
dissolved 129Xe resonances from the lungs are imaged simultaneously to provide information about
pulmonary ventilation and perfusion. The xenon polarization transfer contrast (XTC) method (15-17),
uses the weak signal from dissolved 129Xe to modulate the higher SNR gaseous 129Xe images via
diffusional exchange. The chemical shift saturation recovery (CSSR) spectroscopy method (18-20)
involves monitoring the time-dependent build-up of dissolved 129Xe magnetization in the T/P and RBC
compartments following selective saturation. XTC has been extended recently to allow acquisition of gas-
exchange contrast images at multiple exchange times (MXTC) (21,22), however, unlike CSSR, this
method has not been shown to provide separation between the two dissolved 129Xe compartments. The
ability of the CSSR spectroscopic technique to yield dynamic information about both dissolved 129Xe
compartments simultaneously is thus a unique advantage over alternative techniques. The dynamics of
xenon exchange measured by 129Xe CSSR can be modeled with standard diffusion equations (18,20) in
order to estimate parameters of lung function and structure, including septal thickness, capillary transit-
time and surface-area-to-volume ratio. To date, this methodology has been applied in preliminary studies
in humans (19,20,23), which included two subjects with chronic obstructive pulmonary disease (COPD)
and two with interstitial lung disease (ILD) (20). In addition, it has been utilized to examine lung function
in small animals with models of lung disease (24-27).
2
The CSSR technique is particularly suited to quantification of gas-exchange impairment in interstitial
pulmonary pathologies, such as idiopathic pulmonary fibrosis (IPF), a condition characterized by fibrosis
of parenchymal tissues (28,29). IPF is the most prevalent form of ILD and carries a poor prognosis. Also
of interest is systemic sclerosis (SSc), a rare connective-tissue disease in which respiratory problems are
the most common cause of death, characterized by varying contributions from alveolar, interstitial and
pulmonary-vascular components (30,31). Assessment of the causes of symptomatic limitation in these
patients is challenging: pulmonary function tests including measurement of the diffusing capacity of
carbon monoxide - DLCO, are frequently reduced, but DLCO provides no information as to the mechanism
of the abnormality of gas-exchange. Quantitative high-resolution CT can be used to assess the extent of
structural lung disease but is challenging in IPF and is limited by a multitude of co-factors that contribute
to X-ray attenuation (32). Interestingly, a reduced DLCO is frequently observed in SSc patients with
normal CT scans. Novel techniques are therefore required to quantify the functional consequences of
structural changes in the lung impacting on gas-exchange and also to assess efficacy of possible
treatments.
The purpose of this work was to demonstrate the practicality of the CSSR method for non-invasive
quantification of lung microstructure, gas-uptake and pulmonary-vascular function in healthy normals and
subjects with SSc and IPF. For 129Xe CSSR to be accepted as a clinical tool for routine application,
experimental substantiation with existing gold-standard methods is needed. Here, we compare 129Xe
CSSR-derived parameters with DLCO measurements and dynamic contrast enhanced (DCE)-MRI (33,34).
Current quantitative models of diffusive uptake of xenon in the lungs (20,26,35) are reviewed and their
application to in-vivo data is appraised in order to determine the most appropriate and informative model
for routine clinical use.
Methods
Study Subjects
Four subjects with SSc and four with IPF were recruited for this preliminary study. Inclusion criteria:
patients aged 35-85 years; confirmed diagnosis of IPF or SSc (determined from current clinically-
accepted guidelines); resting oxygen hemoglobin saturation level (SaO2) of ≥ 90% on room air, as
measured by pulse-oximetry. Patients receiving targeted drug therapies were excluded.
Ten healthy volunteers aged 23-74 years - with no history of respiratory or connective-tissue disease -
were also recruited. The study protocol and recruitment procedure were approved by the National
3

Research Ethics Committee. Pulmonary function tests (including whole-lung transfer factor, DL CO, forced
expiratory volume in one second, FEV1, and forced vital capacity, FVC) were performed on all subjects
and blood samples were taken from all patients.
CSSR Spectroscopy Details
All HP 129Xe spectroscopy experiments were performed on a 1.5 T whole-body MRI scanner (GE
Healthcare, Milwaukee, WI), with a flexible transmit-receive vest coil (Clinical MR Solutions,
Brookfield, WI) tuned to the 129Xe Larmor frequency (17.66 MHz). 129Xe was polarized by spin-exchange
optical pumping (36-38), using a “freeze-out” accumulation procedure and a home-built xenon polarizer
(10). This system uses a gas-mixture of 3% isotopically-enriched xenon (86% 129-isotope), 87% helium
and 10% nitrogen (Spectra Gases, The Linde Group, UK), and routinely achieves static (in-cell) 129Xe
nuclear polarizations of 30-40% and between 10-15% following cryogenic accumulation.
Specially-designed radiofrequency (RF) pulses were employed for excitation of 129Xe nuclei in all
experiments. A 14-element, pulse-width modulated, binomial-composite RF pulse (1.13 ms duration)
provided extremely selective excitation of dissolved 129Xe (39). When centered on the 129Xe gas
resonance, the excitation profile of the “balanced” binomial pulse yielded an on-resonant excitation of
almost zero and maximum RF power deposition at a frequency ~ 3500 Hz (200 ppm at 1.5 T) downfield
from the center frequency. Thus, for CSSR, near-perfect saturation of dissolved-phase 129Xe (flip-angle ~
90°) in the lung could be attained whilst a small, repeatable excitation of gaseous 129Xe (flip-angle ~ 1°)
was ensured by adding a single positive element (length 0.02 ms) to the end of the RF pulse (39).
Prior to CSSR, in order to calibrate the flip-angle and gaseous 129Xe center frequency, subjects inhaled 1
L of gas extracted from the cell of the polarizer (3% xenon, 30-40% polarization) from a Tedlar bag
(Jensen, Coral Springs, FL). A simple pulse-acquire sequence was utilized for this purpose, with thirty RF
pulses and an inter-pulse delay time (TR) of 30 ms (≪ T1 of 129Xe gas in the lungs (40)), leading to a
breath-hold of less than one second. The bandwidth was 12 kHz and the center frequency was chosen
such that the RF pulse excitation profile was maximal at the 129Xe gas frequency. The normalized decay in
129Xe gas signal from pulse-to-pulse was fitted to a function of the form 1 cos n
, where α denotes the
flip-angle and n the RF pulse number.
The calibrated RF pulse amplitude was then used to determine the equivalent settings required for a 90°
excitation of dissolved 129Xe for CSSR experiments. Each subject exhaled to functional residual capacity
(FRC) and then inhaled a 50:50 mixture of cryogenically-accumulated, isotopically-enriched xenon gas
(10-15% nuclear polarization) and nitrogen gas from a 1 L Tedlar bag. The saturation recovery technique
4
involves varying the time allowed for gas-exchange (TR) after each successive saturation pulse, in order
to sensitize the NMR acquisition to gas-uptake (see Figure 1). 25 different TRs were used in the range 20
ms to 1 s; these were sequentially swept through in three repeated cycles during a single breath-hold in
order to obtain average signal values for each TR and to estimate the uncertainty in each measurement
(standard deviation of each point). Additional pulse sequence parameters were as follows: 12 kHz
receiver bandwidth; 64 spectral points; total breath-hold, 15 s.
CSSR Data Analysis
CSSR “xenon-uptake curves” were generated by evaluating F(t), the ratio of dissolved 129Xe signal
intensity at time t = TR to gaseous 129Xe signal intensity at t = 0 (the start of the TR), for each TR. The
signal intensities were calculated by integration of the respective NMR peaks in the magnitude spectra.
The first acquired free induction decay (FID) was discarded since it was associated with an unknown
exchange time during inhalation. The signal intensities from each of the three consecutive TR sweeps
were first normalized by the 129Xe gas peak and corrected for differences in flip-angle experienced by
gaseous and dissolved-phase 129Xe and then finally, the signals were averaged to represent the mean
result. The combined signal from 129Xe in T/P and RBC compartments (i.e. total dissolved 129Xe) was
fitted with the model of Patz et al. (hereafter denoted “Patz”) (18-20), and individual uptake curves for 129Xe in T/P and RBCs were fitted with the models of Månsson et al. (hereafter denoted “Månsson”) (26),
and Chang (hereafter denoted “MOXE”; model of xenon exchange) (35), using non-linear least squares
fitting routines developed in Matlab (MathWorks, Natick, MA).
A complete mathematical description of each model can be found in the respective papers cited above;
however, the principal results are reviewed below and a diagrammatical summary of the underlying
geometry of each model is provided in Figure 2.
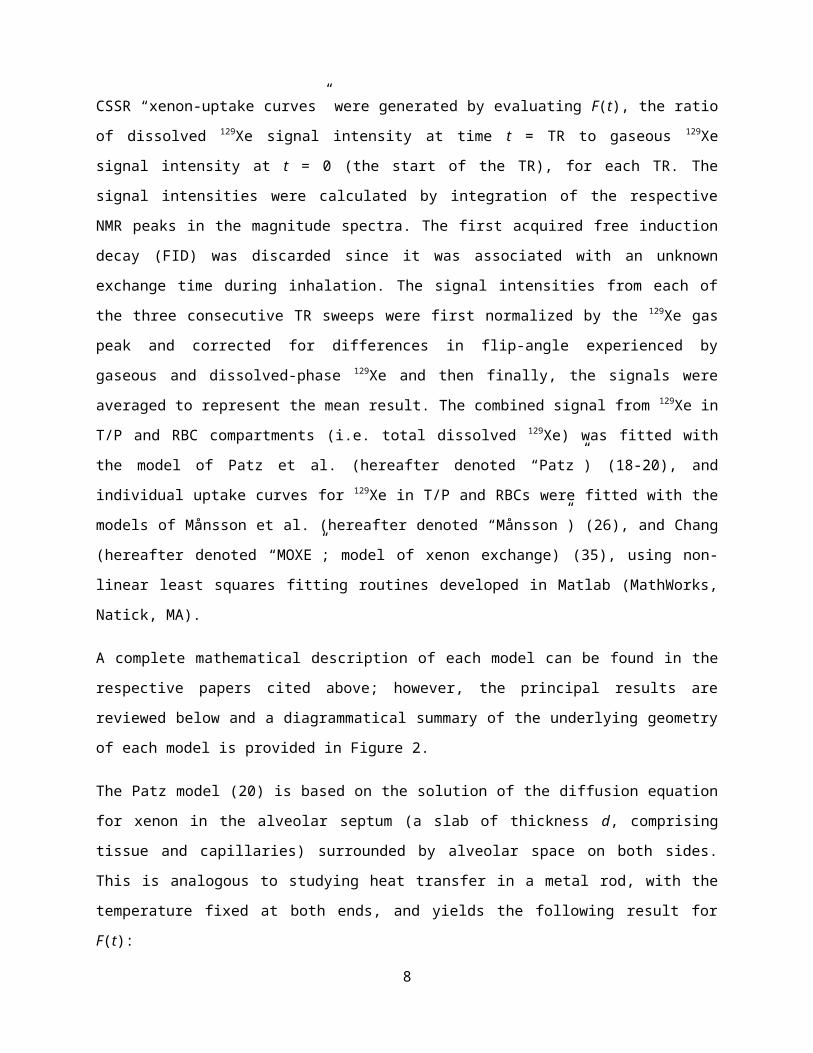
The Patz model (20) is based on the solution of the diffusion equation for xenon in the alveolar septum (a
slab of thickness d, comprising tissue and capillaries) surrounded by alveolar space on both sides. This is
analogous to studying heat transfer in a metal rod, with the temperature fixed at both ends, and yields the
following result for F(t):
22 2
40
1 8 1( ) , / /0 2
ddiss A A
gas G Gx
M t S Sd t t dF t x t dx f Dt d d g Dt dM t d V V D
(1)
5
Where: Mdiss(t∞) denotes the dissolved 129Xe magnetization when the septal slab is saturated with xenon;
Mgas(t=0) denotes the gaseous 129Xe magnetization at t = 0; ρ is the dimensionless dissolved 129Xe
magnetization density in the septal slab, τ is the capillary transit-time (the average length of time a RBC
resides in the gas-exchange region), SA/VG is the alveolar surface-area-to-volume ratio, D and λ are the
dissolved-phase 129Xe diffusion coefficient and xenon Ostwald solubility in tissues, respectively, and f and
g are functions defined in the following way:
2 22 2 2
2 8 1 ex/ pn odd
Dt d Dtf nn d
(2a)
22 24 2
1 exp 1/n odd
Dtg nn d
Dt d
(2b)
The MOXE model (35) is an extension of this methodology in which the septum is separated into its
parenchymal tissue and capillary components. Using the hematocrit (HCT) and tissue-barrier-to-septum
ratio (δ/d) parameters to differentiate the contributions of tissues and blood plasma to the combined T/P
peak, two coupled equations describing xenon uptake into T/P and RBCs have been derived (STP(t) and
SRBC(t) respectively). In this and the Patz model, xenon diffusion is considered along only one direction (x)
and blood flow is perpendicular to and independent of diffusion.
2
2 2
2
2 4
2 2
2 8 1 1 cos exp
2 8 1 1 2 1 cos 1 exp
2 8 1 1 1 cos
TPn odd
n odd
n odd
n n tS t bd n d T
t T n n tbd n d T
t nd n d
2
exp n tT
(3a)
Where: 2A
G
SdbV
;
2
2
dTD
and η denotes the fraction of 129Xe in RBCs to 129Xe in blood as a whole.
The parameter STP(t) is essentially equivalent to F(t) in the Patz model, minus the RBC contribution.
Recasting the terms within curly brackets in Equation 3a as Sx(t), the time-dependence of the 129Xe RBC
signal can be written:
6

(3b)
Equations 3a and 3b are coupled, such that they can be simultaneously fitted to experimental data, thereby
constraining the fit parameters. An estimate of hematocrit can be extracted from the η parameter in the
following manner:
1RBC
RBC P
HCT
(3c)
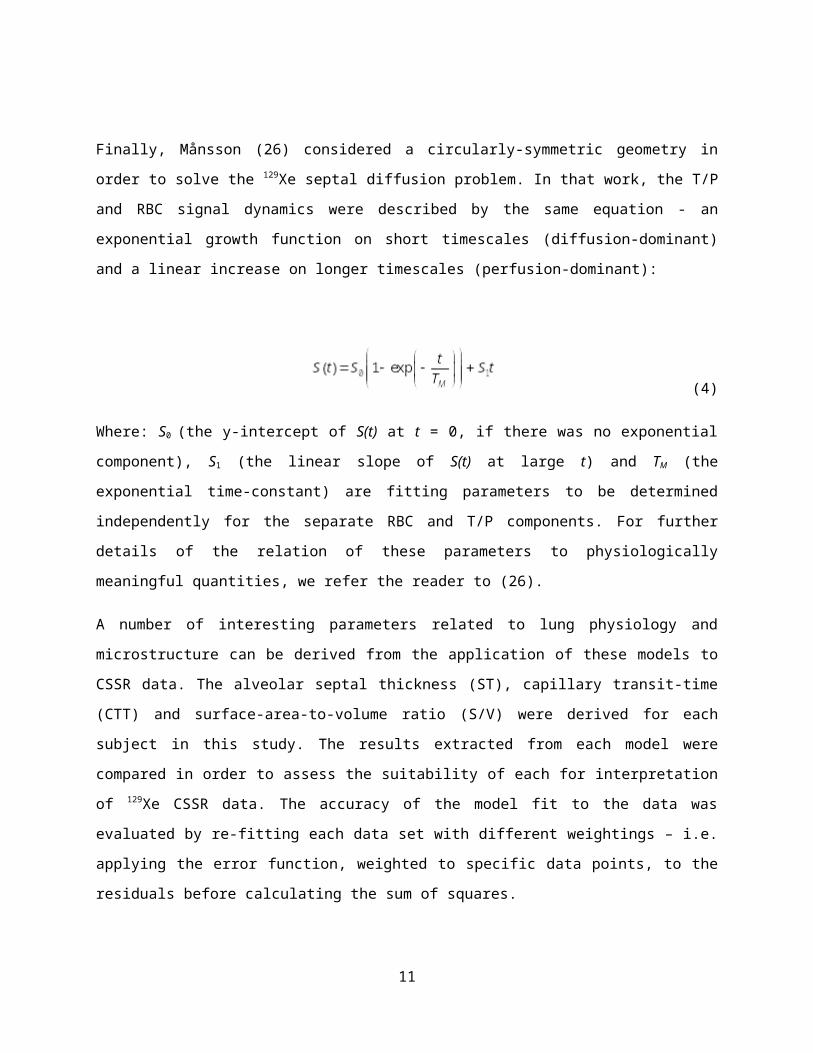
Finally, Månsson (26) considered a circularly-symmetric geometry in order to solve the 129Xe septal
diffusion problem. In that work, the T/P and RBC signal dynamics were described by the same equation -
an exponential growth function on short timescales (diffusion-dominant) and a linear increase on longer
timescales (perfusion-dominant):
(4)
Where: S0 (the y-intercept of S(t) at t = 0, if there was no exponential component), S1 (the linear slope of
S(t) at large t) and TM (the exponential time-constant) are fitting parameters to be determined
independently for the separate RBC and T/P components. For further details of the relation of these
parameters to physiologically meaningful quantities, we refer the reader to (26).
A number of interesting parameters related to lung physiology and microstructure can be derived from the
application of these models to CSSR data. The alveolar septal thickness (ST), capillary transit-time (CTT)
and surface-area-to-volume ratio (S/V) were derived for each subject in this study. The results extracted
from each model were compared in order to assess the suitability of each for interpretation of 129Xe CSSR
data. The accuracy of the model fit to the data was evaluated by re-fitting each data set with different
weightings – i.e. applying the error function, weighted to specific data points, to the residuals before
calculating the sum of squares.
7
Furthermore, as a semi-quantitative measure of gas-exchange efficiency, the ratio of RBC to T/P peak
integrals was determined from phased CSSR spectra at a TR of 100 ms, consistent with the recent work of
Kaushik et al. (41). Lastly, statistical testing was performed using SPSS (IBM SPSS Statistics, V19,
Armonk, NY) in order to: (i) identify parameters of lung physiology that were significantly different
between subject groups (two-tailed, one-way analysis of variance (ANOVA) with post-hoc contrast); (ii)
determine significant correlations between parameters (Pearson’s correlation coefficients).
DCE-MRI
For validation of the xenon capillary transit-times measured by CSSR, two measures of pulmonary-
vascular output were determined from DCE-MRI: (i) the full-width at half-maximum (FWHM) of the
lung parenchyma enhancement and (ii) the pulmonary transit-time. Patients were placed in an 8-channel
cardiac-array coil and a 0.05 mL/kg dose of 1 mmol/mL Gd-DPTA solution (Gadovist, Schering,
Leverkusen, DE) was injected with a power injector (Spectris, Medrad, Warrendale, PA) at a rate of 4
mL/s into the antecubital vein, followed by a 20 mL saline flush. A time-resolved 3D coronal gradient-
recalled echo sequence with: 2x phase acceleration and view sharing (42); 24 slices of thickness 10 mm;
bandwidth = ±125 kHz; TE/TR = 0.8/2.3 ms; flip-angle = 30°; 200 x 80 matrix; 36 temporal phases at an
effective frame rate of 2 volumetric frames per second, was used to image the dynamics of the first pass
of Gd through the pulmonary vasculature. In order to calculate the pulmonary transit-time (PTT) from the
time series of images, signal enhancement as a function of time was evaluated for regions of interest
(ROIs) placed in the left atrium and pulmonary artery (43). The PTT was calculated by subtracting the
time-to-peak signal of the pulmonary artery from that of the left atrium. For the FWHM of the lung
parenchyma enhancement, a ROI was placed on each lung and the FWHMs of the resulting signal
enhancement curves were averaged. Due to the positioning of the ROIs, both methods intrinsically
provided an estimation of the “whole-lung” Gd transit-time for comparison to CSSR data.
Results
NMR spectra typically highlighted a dominant peak due to 129Xe dissolved in parenchymal tissues and
blood plasma (T/P) with an accompanying small peak from 129Xe in RBCs, in both SSc and IPF patients
when compared to healthy volunteers. At short exchange times, 129Xe spectra from patients exhibited
almost no signal from RBCs, and only a moderate peak was observed at very long TRs (~ 1 s) (see Figure
3, right panel). As illustrated in the left panel of Figure 3, 129Xe uptake curves indicated that gas-exchange
from the alveoli to capillaries was impaired and delayed in both patient groups compared to volunteers.
8
The xenon uptake (exponential, diffusive part of the curve) was visibly prolonged in patients and the T/P
component was observed to reach a greater value of F(TR), consistent with the spectra.
The apparent inhibition of gas-exchange in patients suggested thickening of septal tissue, and this was
corroborated by fitting the 129Xe uptake curves with the models of Patz, Månsson and Chang (MOXE).
Each model exhibited a considerably increased whole-lung alveolar ST in older healthy volunteers and
patients with SSc, and an even greater increase in IPF subjects, when compared to younger (< 50 years)
volunteers (see Table 1 for a summary of CSSR-derived parameters and pulmonary function test results).
The ST values determined from application of the MOXE model to 129Xe CSSR data are shown in Figure
4. Using a dissolved-phase 129Xe diffusion coefficient of D = 3.3x10⁻⁶ cm2s-1 (17), mean ST values derived
from this model were 10.0 ± 1.6 μm for healthy volunteers, 13.0 ± 1.5 μm for subjects with SSc and 17.2
± 1.1 μm for those with IPF. Statistically significant differences between derived ST values for all three
subject groups were found upon fitting each of the three models of lung microstructure to HP 129Xe CSSR
data. These values are summarized in Table 2, along with the P values denoting statistical significance.
A strong, positive correlation was identified between the CSSR-derived ST and healthy volunteer age
(correlation statistics: r = 0.74, P = 0.015 using MOXE; r = 0.77, P = 0.010, Patz; r = 0.75, P = 0.012,
Månsson), as illustrated in the center panel of Figure 4. This correlation was used to remove the effect of
aging from volunteer and patient data (bottom panel, Figure 4). With age-correction, a significant increase
in ST in IPF patients was still observed (P < 0.05) for all models, however no model exhibited a
difference in ST between volunteers and SSc subjects (P > 0.05). The results of the age-correction are
detailed in Table 2.
Furthermore, a statistically significant correlation was observed between the CSSR-derived ST values and
DLCO. Results from fitting CSSR data with MOXE are displayed against %-predicted DLCO in Figure 5.
Pearson’s correlation coefficients (r) and P values for ST versus %-predicted DLCO were: r = -0.90, P <
0.001 for data fitted with the Patz model; r = -0.91, P < 0.001, MOXE; r = -0.92, P < 0.001, Månsson.
The correlations against DLCO in standard units (mL/min/mmHg, i.e. not considering predictions for
height, age, sex) were: r = -0.85, P < 0.001 for data fitted with the Patz model; r = -0.85, P < 0.001,
MOXE; r = -0.86, P < 0.001, Månsson.
Complementary to the CSSR modeling results, the ratio of RBC-to-T/P peak integrals was found to be
significantly different between patients and healthy volunteers, although, unlike the ST parameter, the
ratio did not distinguish between the two patient groups. Mean values (P values) were: 0.42 ± 0.18 in
healthy volunteers; 0.18 ± 0.04 in SSc subjects (P(HV-SSc) = 0.040) and 0.13 ± 0.04 in IPF subjects
(P(HV-IPF) = 0.009, P(SSc-IPF) > 0.05). Furthermore, the RBC-to-T/P ratio measurements correlated
9

well with ST values from all models (r = -0.74, P < 0.001, MOXE, r = -0.74, P < 0.001, Patz, r = -0.77, P
< 0.001, Månsson).
The mean CSSR CTT was: 2.2 ± 1.0 s, 2.5 ± 0.7 s, 2.5 ± 0.6 s (volunteers); 2.3 ± 0.8 s, 2.5 ± 0.9 s, 2.0 ±
0.5 s (SSc); 2.2 ± 0.2 s, 2.4 ± 0.2 s, 1.5 ± 0.1 s (IPF); respectively for the MOXE, Patz and Månsson
models. This parameter was not significantly different between subject groups (P > 0.05). The CTTs
calculated from CSSR were not found to correlate significantly with the PTT or lung FWHM as
determined from DCE-MRI; the highest correlation coefficient was between the CTT (Patz) and the lung
FWHM (r = 0.34, P = 0.416). In addition, the derived hematocrit from the MOXE and Månsson models
was notably lower in IPF patients as compared to healthy volunteers, with values of: 0.23 ± 0.05 and 0.24
± 0.05 (volunteers); 0.17 ± 0.04 and 0.15 ± 0.01 (SSc); 0.15 ± 0.01 and 0.11 ± 0.01 (IPF). The HCT was
significantly different between healthy volunteers and IPF patients (MOXE) and between volunteers and
both patient groups (Månsson model) (P < 0.05). Finally, as extracted from the MOXE and Patz models,
the mean alveolar surface-area-to-volume ratio was: 135 ± 37 cm -1 and 128 ± 36 cm-1 (volunteers); 141 ±
53 cm-1 and 134 ± 51 cm-1 (SSc); 166 ± 53 cm-1 and 156 ± 51 cm-1 (IPF); respectively, with P values of
significance between groups > 0.05 in all cases.
Discussion
Clinical Findings
Septal thickness values for healthy volunteers calculated from Patz and MOXE models agreed well with
CT observations (10 μm for normals) (44). Thickening of alveolar septa in IPF patients is attributable to
underlying fibrotic changes in lung microstructure that were confirmed by CT. The significance of
apparent septal thickening in SSc subjects is clinically interesting and must be further assessed as these
patients had little discernible fibrosis on CT and no evidence of pulmonary hypertension (PH). If
validated histologically, this may help explain the reduced DLCO frequently observed in patients with SSc
in the absence of PH and ILD. Nevertheless, since some patients were > 50 years old, the measured
thickening may be partially attributable to age-dependent changes in the gas-exchange surface, as
identified by the apparent increase in ST of healthy volunteers with age. Indeed, with more healthy
volunteer data, it may be possible to derive a “%-predicted ST”, in agreement with the clinical standard
for DLCO (i.e. normalizing for subject height, sex, age).
Of further potential clinical importance is the fact that the surface-area-to-volume ratio derived from these
CSSR models is not significantly different between subject groups. This finding might suggest that the
remodeling of lung parenchyma due to fibrosis is not necessarily associated with emphysematous
10
processes. In future work, we endeavor to assess this result with 3He apparent diffusion coefficient
mapping (45). Finally, we re-iterate that the RBC-to-T/P ratios also exhibit significant differences
between subject groups. However, since this parameter is a semi-quantitative measurement of gas-
exchange that does not distinguish between diffusive and perfusive components of 129Xe uptake, it is not
possible to derive clinically-relevant parameters of lung microstructure.
The demonstration of a distinct relation between whole-lung transfer factor, DLCO, and 129Xe CSSR ST is
the first in-vivo validation of the CSSR technique with a clinically-accepted method and has important
implications for routine application of this technique. For example, if adapted to enable acquisition of
regionally-localized spectra (e.g. with receiver-coil arrays), the CSSR method could provide information
about gas-exchange that is not obtainable by standard pulmonary function testing or indeed, CT. The lack
of correlation between 129Xe CSSR CTT values and DCE-MRI parameters suggests that the CTT
parameter is not sensitive to small changes in pulmonary-vascular output, or, that its meaning has been
obscured by other modeling parameters. In all cases, CTT values were significantly lower than the
corresponding DCE-MRI PTT values; however, this would be expected due to the different definitions of
the parameters. The former describes the average time a RBC resides in the gas-exchange region, whilst
the latter represents the complete transit-time of a contrast bolus from the right heart, through the
pulmonary-arterial system and lung gas-exchange vasculature and back to the left atrium through the
pulmonary-venous system. Although the lung FWHM metric potentially provides a closer representation
of the CTT measurement, the MR signal (even with contrast enhancement) was close to the noise level in
many patients and thus it was difficult to accurately estimate the FWHM; this may explain the
observation of large FWHM values compared to PTT values.
The HCT values derived from the MOXE and Månsson models were in general lower than expected from
patient blood samples. The CSSR-HCT was found to be reduced in patients with IPF when compared
with healthy volunteers (P < 0.05), although blood samples indicated relatively normal values. As
recently highlighted (23), the HCT in the narrow capillaries is reduced (to values as low as 0.28) when
compared to the whole-body HCT – due to the Fåhraeus effect (46). Although this may partially explain
the low HCT values for healthy subjects, it does not indicate why the CSSR-derived HCT of patients
should be further reduced. However, fixing the HCT to a nominal value in the expected range (0.4-0.5)
and repeating the fitting process, tends to yield increased ST values for all subjects. Thus, the apparent
reduced HCT values in patients may actually be a further artefact of inhibited gas-exchange / septal
thickening and the inter-dependent nature of the model parameters. In fact, the HCT correlates with the
ST parameter for both models on the P < 0.01 level.
11
Modeling
Based upon the statistical testing, it could be argued that each of the three models assessed are useful for
quantification of lung microstructure. A pictorial comparison of the application of each of the three
models to 129Xe CSSR data from a single healthy volunteer is shown in the left panel of Figure 6. It can be
seen that each of the three models describes the data reasonably well; the goodness-of-fit as determined
from R2 and χ2 statistics was typically better for MOXE and Patz models, because the Månsson model
fails to follow the middle section of the uptake curves as accurately as the other two models, suggesting
that it is not appropriate to only consider a single exponential component of diffusive uptake. Also
depicted in Figure 6 (right panel) are Bland-Altman plots highlighting the systematic differences between
CSSR parameters extracted from all three models. As expected due to the geometries employed, the Patz
and MOXE models perform similarly, whereas the Månsson ST values are consistently lower than those
of the MOXE model, with an increased discrepancy in patients. Despite these systematic differences,
parameters extracted from all models correlate with each other to the significance level of P < 0.01.
Since MOXE is an incremental extension of the Patz model, providing estimates of additional important
parameters of lung physiology, it would seem to be the most accurate and beneficial model to use in
CSSR studies wherein the dissolved 129Xe resonances can be spectrally resolved. Despite this fact, an
increased number of inter-dependent fit parameters may obscure their interpretation; for example, in this
study the tissue-barrier-to-septum ratio parameter could not be compared between subject groups due to
the fact that in some cases, the parameter tended to unrealistically low and even negative values. Hence in
all fitting results shown, δ/d was restricted to within a range 0.05 – 0.30 (note, this restriction had
negligible effect on the other fitting parameters). Therefore, it may be advantageous to reduce the
complexity of the MOXE model, by constraining the fit parameters. To this end, with further data, we
may be able to establish a link between the CTT parameter and DCE-MRI data and could utilize this to
yield prior knowledge about the CTT. Furthermore, it may be possible to estimate the true tissue-barrier-
to-septum ratio from the RBC-to-T/P signal ratio measurements, which arguably provide a better
representation of the relative fractions of xenon in parenchymal tissues and blood. In combination with
knowledge of the HCT (from blood samples) the MOXE fitting could be reduced to a 2 or 3-parameter
problem, though some correction may be required to account for the Fåhraeus effect.
Experimental Limitations
Achievement of precise 90° excitations of dissolved-phase 129Xe in-vivo is problematic. The design of the
flexible transmit-receive coil used in this work does not deliver a uniform flip-angle across the whole of
the lungs (~ 12% variation overall). Of course, the delivered flip-angle is dependent on the position of the
12
flexible coil, and the loading realized by subjects of varying size. The coil transmit inhomogeneity has
important implications for CSSR measurements. Since the acquired 129Xe spectra are whole-lung
averages, the averaging process takes into account not only the heterogeneity in gas-exchange function
across the lungs, but also the variation in delivered flip-angle. Furthermore, we often observed elevated
dissolved 129Xe signal amplitudes at the start of the first TR sweep, which may be associated with B 1
inhomogeneity and hence imperfect dissolved 129Xe saturation. Indeed, the early data points may be
affected not only by the unknown exchange time present during inhalation, but also by 129Xe signal
outside the active region of the coil (this effect was not observed in subsequent TR sweeps). More
homogeneous transmitter coils (e.g. of birdcage design (47)) could be utilized; however these would
typically be larger and less power-efficient than flexible coils, necessitating increased RF powers to
achieve complete saturation of dissolved-phase 129Xe.
Conclusions
CSSR spectroscopy with HP 129Xe is capable of detecting alterations in whole-lung structure-function,
allowing non-invasive measurement of alveolar septal thickness. We have shown statistically significant
septal thickening in subjects with IPF and SSc, the latter with little / no known interstitial involvement.
Further data may elucidate whether the technique is sensitive to age-dependent changes in lung
microstructure. Previously established models of xenon uptake have been reviewed and each has been
shown to distinguish between ILD subjects and healthy volunteers. Additionally, the 129Xe CSSR
technique has been compared for the first time against gold-standard clinical methods; DLCO and DCE-
MRI. The findings presented in this article highlight the potential of this technique for identification of
clinically-important alterations of lung microstructure and pulmonary-vascular function. Its use in a
number of novel studies to provide information not obtainable by CT and pulmonary function testing can
be envisaged.
Acknowledgements
This project was funded by the MRC and EPSRC, with support from GE Healthcare, GSK, EUFP7 PINet
and NIHR. The authors would like to thank: Dr. C. Billings and Mr. I. Smith, who assisted with
pulmonary function testing; Mr. D. Capener for help with the DCE-MRI protocol; Mrs L. Armstrong and
Drs S. Walmsley, S. Bianchi and N. Hussain for help with patient recruitment.
References
13
1. Altes TA, Powers PL, Knight-Scott J, Rakes G, Platts-Mills TAE, De Lange EE, Alford BA,
Mugler JP, III, Brookeman JR. Hyperpolarized 3He MR lung ventilation imaging in asthmatics:
Preliminary findings. Journal of Magnetic Resonance Imaging 2001;13(3):378-384.
2. Saam BT, Yablonskiy DA, Kodibagkar VD, Leawoods JC, Gierada DS, Cooper JD, Lefrak SS,
Conradi MS. MR imaging of diffusion of 3He gas in healthy and diseased lungs. Magnetic
Resonance in Medicine 2000;44(2):174-179.
3. Yablonskiy DA, Sukstanskii AL, Leawoods JC, Gierada DS, Larry Bretthorst G, Lefrak SS,
Cooper JD, Conradi MS. Quantitative in vivo assessment of lung microstructure at the alveolar
level with hyperpolarized 3He diffusion MRI. Proceedings of the National Academy of Sciences
of the United States of America 2002;99(5):3111-3116.
4. Cleveland ZI, Cofer GP, Metz G, Beaver D, Nouls J, Kaushik SS, Kraft M, Wolber J, Kelly KT,
McAdams HP, Driehuys B. Hyperpolarized 129Xe MR Imaging of Alveolar Gas Uptake in
Humans. PLoS ONE 2010;5(8):e12192.
5. Mugler JP, III, Altes TA, Ruset IC, Dregely IM, Mata JF, Miller GW, Ketel S, Ketel J, Hersman
FW, Ruppert K. Simultaneous magnetic resonance imaging of ventilation distribution and gas
uptake in the human lung using hyperpolarized xenon-129. Proc Natl Acad Sci U S A. Volume
107. United States; 2010. p 21707-21712.
6. Patz S, Hersman FW, Muradian I, Hrovat MI, Ruset IC, Ketel S, Jacobson F, Topulos GP,
Hatabu H, Butler JP. Hyperpolarized 129Xe MRI: A viable functional lung imaging modality?
European Journal of Radiology 2007;64(3):335-344.
7. Fain SB, Korosec FR, Holmes JH, O'Halloran R, Sorkness RL, Grist TM. Functional lung
imaging using hyperpolarized gas MRI. Journal of Magnetic Resonance Imaging 2007;25(5):910-
923.
8. Driehuys B, Cates GD, Miron E, Sauer K, Walter DK, Happer W. High-volume production of
laser-polarized Xe-129. Appl Phys Lett 1996;69(12):1668-1670.
9. Hersman FW, Ruset IC, Ketel S, Muradian I, Covrig SD, Distelbrink J, Porter W, Watt D, Ketel
J, Brackett J, Hope A, Patz S. Large production system for hyperpolarized 129Xe for human lung
imaging studies. Academic Radiology 2008;15(6):683-692.
10. Norquay G, Parnell SR, Xu X, Parra-Robles J, Wild JM. Optimized production of hyperpolarized
129Xe at 2 bars for in vivo lung magnetic resonance imaging. Journal of Applied Physics
2013;113(4):044908-044909.
11. Kirby M, Svenningsen S, Owrangi A, Wheatley A, Farag A, Ouriadov A, Santyr GE, Etemad-
Rezai R, Coxson HO, McCormack DG, Parraga G. Hyperpolarized 3He and 129Xe MR Imaging
14
in Healthy Volunteers and Patients with Chronic Obstructive Pulmonary Disease. Radiology
2012;265(2):600-610.
12. Eger EI, Larson CP. Anaesthetic Solubility In Blood And Tissues: Values And Significance.
British Journal of Anaesthesia 1964;36(3):140-149.
13. Miller KW, Reo NV, Schoot Uiterkamp AJM. Xenon NMR: Chemical shifts of a general
anesthetic in common solvents, proteins, and membranes. Proceedings of the National Academy
of Sciences of the United States of America 1981;78(8 I):4946-4949.
14. Qing K, Ruppert K, Jiang Y, Mata JF, Miller GW, Shim YM, Wang C, Ruset IC, Hersman FW,
Altes TA, Mugler JP, III. Regional mapping of gas uptake by blood and tissue in the human lung
using hyperpolarized xenon-129 MRI. Journal of Magnetic Resonance Imaging 2013;39(2):346-
359.
15. Muradyan I, Butler JP, Dabaghyan M, Hrovat M, Dregely I, Ruset I, Topulos GP, Frederick E,
Hatabu H, Hersman WF, Patz S. Single-breath xenon polarization transfer contrast (SB-XTC):
Implementation and initial results in healthy humans. Journal of Magnetic Resonance Imaging
2013;37(2):457-470.
16. Ruppert K, Brookeman JR, Hagspiel KD, Mugler JP, III. Probing lung physiology with xenon
polarization transfer contrast (XTC). Magnetic Resonance in Medicine 2000;44(3):349-357.
17. Ruppert K, Mata JF, Brookeman JR, Hagspiel KD, Mugler JP, III. Exploring Lung Function with
Hyperpolarized 129Xe Nuclear Magnetic Resonance. Magnetic Resonance in Medicine
2004;51(4):676-687.
18. Butler JP, Mair RW, Hoffmann D, Hrovat MI, Rogers RA, Topulos GP, Walsworth RL, Patz S.
Measuring surface-area-to-volume ratios in soft porous materials using laser-polarized xenon
interphase exchange nuclear magnetic resonance. Journal of Physics Condensed Matter
2002;14(13):L297-L304.
19. Patz S, Muradian I, Hrovat MI, Ruset IC, Topulos G, Covrig SD, Frederick E, Hatabu H,
Hersman FW, Butler JP. Human Pulmonary Imaging and Spectroscopy with Hyperpolarized
129Xe at 0.2T. Academic Radiology 2008;15(6):713-727.
20. Patz S, Muradyan I, Hrovat M, Dabaghyan M, Washko G, Hatabu H, Butler JP. Diffusion of
hyperpolarized 129 Xe in the lung: a simplified model of 129 Xe septal uptake and experimental
results. New Journal of Physics 2011;13(1):015009.
21. Dregely I, Mugler JP, III, Ruset IC, Altes TA, Mata JF, Miller GW, Ketel J, Ketel S, Distelbrink
J, Hersman FW, Ruppert K. Hyperpolarized Xenon-129 gas-exchange imaging of lung
microstructure: first case studies in subjects with obstructive lung disease. Journal of magnetic
resonance imaging 2011;33(5):1052-1062.
15
22. Dregely I, Ruset IC, Mata JF, Ketel J, Ketel S, Distelbrink J, Altes TA, Mugler JP, III, Miller
GW, Hersman FW, Ruppert K. Multiple-exchange-time xenon polarization transfer contrast
(MXTC) MRI: Initial results in animals and healthy volunteers. Magnetic Resonance in Medicine
2012;67(4):943-953.
23. Chang YV, Quirk JD, Ruset IC, Atkinson JJ, Hersman FW, Woods JC. Quantification of human
lung structure and physiology using hyperpolarized 129Xe. Magnetic Resonance in Medicine
2014;71(1):339-344.
24. Driehuys B, Cofer GP, Pollaro J, Mackel JB, Hedlund LW, Johnson GA. Imaging alveolar-
capillary gas transfer using hyperpolarized 129Xe MRI. Proceedings of the National Academy of
Sciences of the United States of America 2006;103(48):18278-18283.
25. Imai H, Kimura A, Iguchi S, Hori Y, Masuda S, Fujiwara H. Noninvasive detection of pulmonary
tissue destruction in a mouse model of emphysema using hyperpolarized 129Xe MRS under
spontaneous respiration. Magnetic Resonance in Medicine 2010;64(4):929-938.
26. Månsson S, Wolber J, Driehuys B, Wollmer P, Golman K. Characterization of diffusing capacity
and perfusion of the rat lung in a lipopolysaccaride disease model using hyperpolarized 129Xe.
Magnetic Resonance in Medicine 2003;50(6):1170-1179.
27. Freeman MS, Cleveland ZI, Qi Y, Driehuys B. Enabling hyperpolarized 129Xe MR spectroscopy
and imaging of pulmonary gas transfer to the red blood cells in transgenic mice expressing human
hemoglobin. Magnetic Resonance in Medicine 2013;70(5):1192-1199.
28. Gross TJ, Hunninghake GW. Idiopathic Pulmonary Fibrosis. New England Journal of Medicine
2001;345(7):517-525.
29. Pardo A, Selman M. Idiopathic pulmonary fibrosis: New insights in its pathogenesis.
International Journal of Biochemistry and Cell Biology 2002;34(12):1534-1538.
30. Bussone G, Mouthon L. Interstitial lung disease in systemic sclerosis. Autoimmunity reviews
2011;10(5):248-255.
31. Koh ET, Lee P, Gladman DD, Abu-Shakra M. Pulmonary hypertension in systemic sclerosis: An
analysis of 17 patients. British Journal of Rheumatology 1996;35(10):989-993.
32. Best AC, Meng J, Lynch AM, Bozic CM, Miller D, Grunwald GK, Lynch DA. Idiopathic
pulmonary fibrosis: Physiologic tests, quantitative CT indexes, and CT visual scores as predictors
of mortality. Radiology 2008;246(3):935-940.
33. Fink C, Risse F, Buhmann R, Ley S, Meyer FJ, Plathow C, Puderbach M, Kauczor HU.
Quantitative Analysis of Pulmonary Perfusion using Time-Resolved Parallel 3D MRI - Initial
results. RoFo Fortschritte auf dem Gebiet der Rontgenstrahlen und der Bildgebenden Verfahren
2004;176(2):170-174.
16

34. Sergiacomi G, Bolacchi F, Cadioli M, Angeli ML, Fucci F, Crusco S, Rogliani P, Pezzuto G,
Romeo F, Mariano E, Simonetti G. Combined pulmonary fibrosis and emphysema: 3D time-
resolved MR angiographic evaluation of pulmonary arterial mean transit time and time to peak
enhancement. Radiology 2010;254(2):601-608.
35. Chang YV. MOXE: A model of gas exchange for hyperpolarized 129Xe magnetic resonance of
the lung. Magnetic Resonance in Medicine 2013;69(3):884-890.
36. Happer W. Optical Pumping. Reviews of Modern Physics 1972;44(2):169-249.
37. Happer W, Miron E, Schaefer S, Schreiber D, Van Wijngaarden WA, Zeng X. Polarization of the
nuclear spins of noble-gas atoms by spin exchange with optically pumped alkali-metal atoms.
Physical Review A 1984;29(6):3092-3110.
38. Walker TG, Happer W. Spin-exchange optical pumping of noble-gas nuclei. Reviews of Modern
Physics 1997;69(2):629-642.
39. Leung G, Norquay G, Schulte RF, Wild JM. Radiofrequency pulse design for the selective
excitation of dissolved 129Xe. Magnetic Resonance in Medicine 2014;doi:10.1002/mrm.25089.
40. Möller HE, Chen XJ, Chawla MS, Driehuys B, Hedlund LW, Johnson GA. Signal Dynamics in
Magnetic Resonance Imaging of the Lung with Hyperpolarized Noble Gases. Journal of Magnetic
Resonance 1998;135(1):133-143.
41. Kaushik SS, Freeman MS, Rackley C, Stiles J, Foster WM, Roos JE, McAdams HP, Driehuys B.
Establishing Biomarkers of Gas-Transfer Using Hyperpolarized 129Xe Dissolved-Phase
Spectroscopy in Healthy Volunteers and Subjects with Pulmonary Fibrosis. In: Proceedings of the
22nd Annual Meeting of the ISMRM, Milan, Italy 2014:2279.
42. Korosec FR, Frayne R, Grist TM, Mistretta CA. Time-resolved contrast-enhanced 3D MR
angiography. Magnetic Resonance in Medicine 1996;36(3):345-351.
43. Skrok J, Shehata ML, Mathai S, Girgis RE, Zaiman A, Mudd JO, Boyce D, Lechtzin N, Lima
JAC, Bluemke DA, Hassoun PM, Vogel-Claussen J. Pulmonary Arterial Hypertension: MR
Imaging-derived First-Pass Bolus Kinetic Parameters Are Biomarkers for Pulmonary
Hemodynamics, Cardiac Function, and Ventricular Remodeling. Radiology 2012;263(3):678-
687.
44. Gil J, Marchevsky AM, Jeanty H. Septal thickness in human lungs assessed by computerized
interactive morphometry. Laboratory investigation; a journal of technical methods and pathology
1988;58(4):466-472.
45. Wang C, Altes TA, Mugler JP, III, Miller GW, Ruppert K, Mata JF, Cates GD, Borish L, de
Lange EE. Assessment of the lung microstructure in patients with asthma using hyperpolarized
17
3He diffusion MRI at two time scales: Comparison with healthy subjects and patients with
COPD. Journal of Magnetic Resonance Imaging 2008;28(1):80-88.
46. Fåhræus R, Lindqvist T. The viscosity of the blood in narrow capillary tubes. American Journal
of Physiology -- Legacy Content 1931;96(3):562-568.
47. De Zanche N, Chhina N, Teh K, Randell C, Pruessmann KP, Wild JM. Asymmetric quadrature
split birdcage coil for hyperpolarized 3He lung MRI at 1.5T. Magnetic Resonance in Medicine
2008;60(2):431-438.
List of Figure Captions
Figure 1: The CSSR pulse sequence, as implemented in this work. Pulse-width modulated binomial RF
pulses (amplitude modulated shown for display purposes) can produce 90° excitations of dissolved-phase 129Xe, with minimal on-resonance excitation of gaseous 129Xe. These RF pulses were used for both
saturation and excitation of NMR signal (generated free induction decays are shown in grey). The inter-
pulse delay time (TR) was varied between values of 20 ms and 1000 ms, in order to quantify the
dynamics of xenon uptake. Each TR sweep was repeated three times to estimate the same-breath
variability in the CSSR measurement.
***Double column figure***
Figure 2: Comparison of the geometries adopted for diffusional modeling of xenon uptake in the lungs;
from the airspace across the alveolar septum, thickness d. The Patz and MOXE models consider solving
the diffusion equation with periodic boundary conditions in one dimension, x, created by identical
airspaces on either side of the septum. (i) the model of Patz does not distinguish between T/P and RBC
compartments; (ii) the model of Chang (MOXE) includes a tissue barrier term (δ) permitting separation of
the T/P and RBC compartments, in conjunction with the blood hematocrit; (iii) the Månsson model also
considers the two dissolved 129Xe compartments individually, but with a circularly symmetric geometry,
with an alveolar radius (RA) and tissue and capillary thicknesses LT and LC, respectively. In the first two
models, blood flow is treated orthogonal to and independent of diffusional gas-exchange. In each case D
denotes the diffusion coefficient of xenon, in the airspace (D0, xenon self-diffusion coefficient), tissues
(DT), blood (DB) or combined dissolved-phase (DD). Note: in the main body of this manuscript, D (instead
of DD) is used to represent the dissolved-phase xenon diffusion coefficient, which is assumed to be the
same for both tissues and blood in all three models. In practice, these values are likely to be different but
are not currently well-known; hence we designate them with different symbols for completeness.
18
***Double column figure***
Table 1: Subject demographics and pulmonary function test results. Septal thicknesses (ST), capillary
transit-times (CTT), surface-area-to-volume ratios (S/V) and hematocrit (HCT) values, as extracted from
fitting the models of Chang (MOXE), Patz and Månsson to HP 129Xe CSSR data, are quoted along with
pulmonary transit-times (PTT) and the FWHM of lung parenchyma signal enhancement calculated from
the first pass of gadolinium contrast agent through the lung vasculature, and HCT values derived from
patient blood samples.
***Double column table***
Figure 3: Left panel: Dynamics of 129Xe uptake into tissues and blood plasma (T/P), and RBCs, for (a) a
typical healthy volunteer, (b) a subject with SSc and (c) a subject with IPF. Uptake curves, denoted by
F(TR), are displayed with corresponding MOXE model fits (solid black lines). Dashed lines indicate
increments in F(TR) of 0.005. Right panel: NMR spectra (moderately line-broadened and zero-filled to
128 points) of subjects from the same three groups, acquired at a TR of 1000 ms. The peaks due to 129Xe
in RBCs, T/P and the gaseous-phase (G) are clearly indicated.
***1.5 column figure***
Table 2: Average septal thickness values and corresponding P values of statistical significance for healthy
volunteers and patients, extracted from the models of Patz, Chang and Månsson, including values
corrected for predicted changes due to subject age. Quoted uncertainties represent the standard deviation
of the septal thickness values for each group.
***Double column table***
Figure 4: Top: Mean (whole-lung) alveolar septal thicknesses for healthy volunteers and subjects with
SSc and IPF, as derived from fitting the MOXE model to 129Xe CSSR data, displayed in order of subject
ID from Table 1. Center: Positive correlation between septal thickness and healthy volunteer age, with
corresponding Pearson’s correlation coefficient (r) and P value. Bottom: “Age-corrected” alveolar septal
thickness values for all subjects.
***Single column figure***
Figure 5: Validation of HP 129Xe CSSR-derived septal thickness values (from the MOXE model) with the
clinical gold-standard measure of pulmonary function, whole-lung transfer factor (DLCO). The Pearson’s
correlation coefficient (r) and corresponding P value are shown. Error bars in ST were estimated by re-
19
fitting the data with different weightings applied to the residuals before taking the sum of squares, as
described in the main text. Note: %-predicted DLCO represents the measured DLCO value as a percentage
of an expected value, based on subject height, sex, age etc.
***Single column figure***
Figure 6: (i) Comparison of the accuracy and applicability of the Patz (a), MOXE (b) and Månsson (c)
models in describing in-vivo 129Xe CSSR data from a single healthy volunteer. Blue data points denote the
total dissolved 129Xe signal intensities, green the T/P component and red the RBC component. The model
fits are shown both with forced weighting to the middle section of each curve (dashed lines), and in the
absence of any weighting (solid lines). (ii) Bland-Altman plots of the systematic differences in CSSR-
derived parameters (septal thickness (top), capillary transit time (center) and surface-area-to-volume ratio
(bottom)) between models, in each case comparing the Patz and Månsson model results to those of the
MOXE model.
***Double column figure***
20