Embed Size (px)
Citation preview
General rights Copyright and moral rights for the publications made accessible in the public portal are retained by the authors and/or other copyright owners and it is a condition of accessing publications that users recognise and abide by the legal requirements associated with these rights.
Users may download and print one copy of any publication from the public portal for the purpose of private study or research.
You may not further distribute the material or use it for any profit-making activity or commercial gain
You may freely distribute the URL identifying the publication in the public portal If you believe that this document breaches copyright please contact us providing details, and we will remove access to the work immediately and investigate your claim.
Downloaded from orbit.dtu.dk on: May 15, 2020
A novel MR contrast agent for angiography and perfusion: Hyperpolarized water
Lipsø, Hans Kasper Wigh
Publication date:2016
Document VersionPublisher's PDF, also known as Version of record
Link back to DTU Orbit
Citation (APA):Lipsø, H. K. W. (2016). A novel MR contrast agent for angiography and perfusion: Hyperpolarized water.Technical University of Denmark, Department of Electrical Engineering.

A novel MR contrast agent for angiography
and perfusion: Hyperpolarized water
PhD Dissertation
Kasper Wigh Lipsø
November 2016

ii
Front page image: Coronal angiography in a pig imaged by hyperpolarized water MRI.
iii
Abstract
Magnetic Resonance Imaging (MRI) is an important tool in medical imaging, and is widely used
for its high spatial and temporal resolution, and low safety concerns. However, the technique has its
limitations due to the inherent low sensitivity, making it inferior to Computed Tomography (CT) in
terms of spatial and temporal sensitivity and to nuclear medicine methods in terms of molecular
imaging sensitivity. By hyperpolarization, the available signal can be enhanced by several orders of
magnitude, and potentially close some of these gaps.
In this thesis work, the purpose is to demonstrate that water, hyperpolarized by dissolution
Dynamic Nuclear Polarization (d-DNP), can be applied as an MRI contrast agent for angiography and
perfusion.
The first part of the project focuses on development of a protocol for production of large
samples of hyperpolarized protons in D2O. The samples are polarized and dissolved in a fluid path
compatible with the installed base of commercial polarizers developed for clinical research. The solid-
state DNP is optimized at 6.7 T and 1.2 K by microwave frequency modulation. A solid-state
polarization of 70% is obtained. The dissolution procedure is optimized by introduction of a
fluorinated solvent to accelerate the transition from solid to liquid state, and efficient radical
extraction is obtained with a two-phase system of water and heptane. A final liquid state polarization
of 13% in samples of 16 mL is obtained, suitable for large animal experiments.
In second part of the project, hyperpolarized water is applied for angiographic imaging and
perfusion measurements in a pig model. Renal angiography of 0.55 mm in-plane isotropic resolution is
demonstrated and perfusion measurements provides values comparable to conventional Gd-T1-DCE
analysis. Finally, it is demonstrated that the method can be applied to acquire dynamic coronary MR
angiography with temporal resolution of less than 1 s, apparent Signal-to-Noise Ratio of 269±169 and
coronary sharpness of 0.31±0.086 mm-1, which is superior to coronary MRA available in today’s
clinical practice.

iv
Resumé
Magnetisk resonans billeddannelse (MRI) er et vigtigt redskab i medicinsk diagnostik, og bliver
brugt i stor udstrækning pga. den høje billedopløsning og lave sundhedsrisiko. Metoden har dog sine
begrænsninger, da den naturligt har en lav sensitivitet, der gør den underlegen i sammenligning med
CT mht. spatiel og temporal opløsning, og med nuklearmedicinsk billeddiagnostik mht. sensitivitet af
molekylær billeddannelse. Det tilgængelige signal kan forøges med flere størrelsesordner ved
hyperpolarisering.
Formålet med denne afhandling er at demonstrere hvordan vand, hyperpolariseret ved
Dynamisk Nuklear Polarisation (DNP), kan anvendes som MRI konstrastvæske til angiografi og
perfusionsmålinger.
Den første del af projektet fokuserer på udviklingen af en protokol til produktion af store doser
af hyperpolariserede protoner opløst i D2O. Prøven polariseres og opløses i et aflukket væskesystem
(fluid path), som er kompatibelt med de kommercielle polarisatorer der i dag er i brug til klinisk
forskning. DNP optimeres ved 6.7 T og 1.3 K med mikrobølge-frekvensmodulering, og en faststof
polarisation af 70% opnås. Opløsningsprocessen forbedres ved at introducere en fluoreret solvent,
der øger hastigheden af overgangen fra fast til flydende form, og effektiv ekstraktion af radikalet
opnås med et to-fase system af vand og heptan. Derved opnås 13% polarisation i den opløste prøve á
16 mL; en passende mængde til forsøg i store dyr.
I den anden del af projektet anvendes hyperpolariseret vand til angiografi og
perfusionsmålinger i grise. Angiografi i nyren demonstreres med 0.55 mm isotropisk opløsning, og
perfusionsmålinger giver værdier sammenlignelige med konventionel Gd-T1-DCE analyse. Tilsidst
demonstreres det, at metoden kan anvendes til at optage dynamisk MR koronarangiografi med
tidsopløsning af mindre end et sekund, signal-støj-forhold (aSNR) på 269±169 og koronarskarphed på
0.31±0.086 mm-1, som er overlegent i sammenligning med nuværende kliniske MR
koronarangiografier.
v
Acknowledgements
First of all, I would like to express my gratitude for my mentor and supervisor, Jan Henrik
Ardenkjær-Larsen. I am grateful that I have be given this opportunity, and it has been a pleasure
working with one of the pioneers of d-DNP, providing excellent advice in every corner of the field, as
well as general guidance and inspiration from both industrial and academic approaches. It has been a
journey to follow our 3-man research group translating into a state-of-the-art research center of 20+
employees. I would like to thank my colleagues at Hypermag for forming a nice work environment.
Special thanks to Sean Bowen, who challenged my chemical understanding again and again, to my
office mates, Bakri, Oleksandr and Ronja, and to our technician, Jan Kilund, for creative solutions to
even my tiniest technical problems, as well as motivational talks.
I have also enjoyed the atmosphere at the DRCMR at Hvidovre Hospital. Thanks to my co-
supervisor Lars G. Hanson for his always great mood and sometimes great humor, and for the solid
introduction into the world of MRI. I am grateful for the inspiration and support from my co-
supervisor Lise Vejby Søgaard, who sadly passed away one year into my PhD. It was a pleasure to
work with Sascha Gude, whose joyful personality would always make up for scan sessions way too
early in the morning, and thanks to Mette Hauge Lauritzen for encouraging discussions and assistance
with my challenges of animals handling.
Thanks to Christoffer Laustsen and the group at the MR Research Centre for great
collaboration on our many common projects, and for making my many trips to Århus something I look
back upon with pleasure.
I appreciate the funding from The Danish Research Council for funding the project, and the
Otto Mønsted Foundation for supporting my travels.
Finally, I would like to thank my family for all their support and involvement during this period.
Mette and Rosa, I could not have done this without your love and understanding.
vi
Preface
This thesis is submitted in partial fulfillment of the requirement for obtaining a PhD degree at
the PhD school of Electrical Engineering at the Technical University of Denmark (DTU). The project
was supervised by Professor Jan Henrik Ardenkjær-Larsen and co-supervisor, Associate Professor Lars
G. Hanson.
The thesis present work conducted during my employment at the Department of Electrical
Engineering at DTU from December 2012 to June 2016. During the period, I have had several research
stays at other DNP facilities in Denmark, namely
Danish Research Center for Magnetic Research Center (DRCMR), Centre for Functional and
Diagnostic Imaging and Research, Copenhagen University Hospital Hvidovre, Denmark
Department of Clinical Medicine, MR Research Centre, Aarhus University, Aarhus, Denmark
Department of Clinical Physiology, Nuclear Medicine & PET and Cluster for Molecular Imaging,
Rigshospitalet and University of Copenhagen, Denmark
In addition, I have had the pleasure of attending several research meeting, namely
4th International DNP Symposium, Elsinore, Denmark, August 2013
ISMRM 21st Annual Meeting & Exhibition, Milan, Italy, May 2014
Hyperpolarized Magnetic Resonance, Egmond Aan Zee, Netherlands. August 2015
Furthermore, I have benefitted from teaching in the MSc. course 31590 Biomedical Product
Development as well as assisting in the supervision of the MSc. projects of students Sarah Teuber
Henriksen and Sotirios Sarros.

vii
List of Publications
The thesis builds on a basis of the following research papers and conference contributions:
Articles in scientific journals
I. Dissolution Dynamic Nuclear Polarization capability study with fluid path.
Ronja Malinowski, Kasper Wigh Lipsø, Mathilde H. Lerche and Jan Henrik Ardenkjær-
Larsen.
Journal of Magnetic Resonance, 2016, 272, 141-146.
II. Large dose hyperpolarized water with dissolution-DNP at high magnetic field.
Kasper Wigh Lipsø, Sean Bowen, Oleksandr Rybalko and Jan Henrik Ardenkjær‐Larsen.
Accepted manuscript, In Press, Journal of Magnetic Resonance, 2016.
III. Hyperpolarized 13C MR angiography.
Kasper Wigh Lipsø, Peter Magnusson and Jan Henrik Ardenkjær-Larsen.
Current Pharmaceutical Design, 2016, 22, 90-95.
IV. Renal MR Angiography and Perfusion in the Pig using Hyperpolarized Water.
Kasper Wigh Lipsø, Esben Søvsø Szocska Hansen, Rasmus Stilling Tougaard, Christoffer
Laustsen and Jan Henrik Ardenkjær-Larsen.
Magnetic Resonance in Medicine, 2016.
V. Dynamic Coronary MR Angiography in the Pig using Hyperpolarized Water.
Kasper Wigh Lipsø, Esben Søvsø Szocska Hansen, Rasmus Stilling Tougaard, Christoffer
Laustsen and Jan Henrik Ardenkjær-Larsen.
Manuscript in preparation.
viii
Conference contributions
VI. Cerebral Angiography in Rats: Comparison of 1H TOF-MRA, SPIO Enhancement and
Hyperpolarized 13C bSSFP.
Kasper Wigh Lipsø, Peter Magnusson, Lise Vejby Søgaard and Jan Henrik Ardenkjær-
Larsen.
Poster presentation. ISMRM 21st Annual Meeting & Exhibition, Milan, Italy. May 2014.
VII. Magnetic Resonance Angiography in the Pig using Hyperpolarized Water.
Kasper Wigh Lipsø, Sean Bowen, Christoffer Laustsen, Esben Søvsø Szocska Hansen,
Thomas Nørlinger and Jan Henrik Ardenkjær-Larsen
Oral presentation, Hyperpolarized Magnetic Resonance - Joint 5th International DNP
Symposium and COST Action EUROHyperPOL Final Meeting, Egmond Aan Zee,
Netherlands. August 2015.
VIII. Hyperpolarized Water Perfusion in the Porcine Brain – a Pilot Study.
Esben Søvsø Szocska Hansen, Kasper Wigh Lipsø, Rasmus Stilling Tougaard, Christoffer
Laustsen, and Jan Henrik Ardenkjær-Larsen.
Submitted abstract. ISMRM 25st Annual Meeting & Exhibition, Honolulu, USA. April
2017.
ix
List of Figures
Figure 1: Luminal narrowing in proximal LAD and stenosis in middle LAD .............................................. 4
Figure 2: Time-of-flight imaging without and with contrast enhancement. ............................................ 7
Figure 3: Human coronary artery anatomy. ............................................................................................. 8
Figure 4: Comparison of CT perfusion, SPECT, and invasive coronary angiography .............................. 10
Figure 5: Spin polarization at thermal equilibrium for electrons, protons and carbon-13 .................... 12
Figure 6: Graphical interpretation of frequency modulation and definition of parameters ................. 14
Figure 7: Molecular structure of TEMPO. ............................................................................................... 14
Figure 8: Hyperpolarized 13C angiogram of a pig heart .......................................................................... 17
Figure 9: Myocardial perfusion in rats with hyperpolarized 13C urea .................................................... 18
Figure 10: Fluid path for d-DNP for research purposes .......................................................................... 24
Figure 11: SPINlab and fluid path for clinical use. .................................................................................. 26
Figure 12: The two isomers of nonafluorobutyl methyl ether ............................................................... 32
Figure 13: Thermal polarization build-up of a 30 mM TEMPO in water/glycerol 1:1 (w/w) sample. .... 34
Figure 14: Frequency sweep of 30 mM TEMPO in water/glycerol 1:1 (w/w) ........................................ 35
Figure 15: DNP build-up curves............................................................................................................... 35
Figure 16: a) FID of first hyperpolarized signal, b) NMR signal of hyperpolarized sample .................... 36
Figure 17: Absorbance spectra of example measurement. .................................................................... 38
Figure 18: Proton concentration measurement.. ................................................................................... 39
Figure 19: Molecular structure of HP001................................................................................................ 42
Figure 20: Rat cerebral angiography after hyperpolarized injection. ..................................................... 44
Figure 21: Time series of bSSFP imaging of intravenous injections of hyperpolarized HP001. ............. 44
Figure 22: Anatomy of the human kidney. ............................................................................................. 46
Figure 23: Renal arterial tree imaged by fluoroscopy during insertion of catheter. .............................. 47
Figure 24: Hyperpolarized water phantom experiment ......................................................................... 49
Figure 25: Renal angiographies in a pig .................................................................................................. 50
Figure 26: Perfusion maps of the kidney of four individual pigs ............................................................ 51
Figure 27: Coronary angiographies after hyperpolarized water injections in three different animals .. 54
Figure 28: Coronary angiography time series ......................................................................................... 55
Figure 29: Time of arrival of hyperpolarized water ................................................................................ 56
x
List of Tables
Table 1: Proton relaxation times for H2O-D2O mixtures in degassed samples ..................................... 19
Table 2: Relaxation times for oxygen-free waters. ................................................................................ 19
Table 3: Longitudinal relaxation time constants for 1H in various sample compositions ...................... 19
Table 4: Comparison of magnetization for three situations. .................................................................. 21
Table 5: Results from dissolutions with large sample filling ................................................................... 28
Table 6: Results from dissolutions with small sample filling. ................................................................. 29
Table 7: DNP results for various sample compositions and polarization parameters. .......................... 36
Table 8: Liquid state polarization and T1 at 9.4 T.................................................................................... 37
xi
Abbreviations and Symbols
α Flip angle
AIF Arterial Input Function
ASL Arterial Spin Labelling
aSNR Apparent signal-to-noise ratio
BBB Blood-Brain-Barrier
BOLD Blood-oxygen-level dependent
bSSFP balanced Steady-State Free
Precession
CAD Coronary Artery Disease
CE Contrast Enhanced
CNR Contrast-to-Noise Ratio
CT Computed Tomography
CTA Computed Tomography
Angiography
d-DNP dissolution-Dynamic Nuclear
Polarization
DCE-MRI Dynamic contrast-enhanced
Magnetic Resonance Imaging
DM Dissolution Medium
DMSO-d6 Deuterated Dimethyl Sulfoxide
DNP Dynamic Nuclear Polarization
ECG Electrocardiography
EDTA Ethylenediaminetetraacetic acid
EPA Electron Paramagnetic Agent
EPR Electron Paramagnetic
Resonance
FWHM Full Width at Half Maximum
FID Free Induction Decay
FOV Field of View
FP Fluid Path
Gd Gadolinium
GRE Gradient Echo
HP Hyperpolarization/
Hyperpolarized
HP001 bis-1,1-(hydroxymethyl)-[1-
13C]cyclopropane-d8
LAD Left anterior descending
coronary artery
MIP Maximum Intensity Projection
MR Magnetic Resonance
MRA Magnetic Resonance
Angiography
xii
MRI Magnetic Resonance Imaging
N Number of repetitions
NFBME Nonafluorobutyl methyl ether
NMR Nuclear Magnetic Resonance
NSF Nephrogenic Systemic Fibrosis
OE Overhauser Effect
PC Phase Contrast
PEEK Polyether Ether Ketone
PET Positron Emission Tomography
PHIP ParaHydrogen-Induced
Polarization
PTFE Polytetrafluoroethylene
QC Quality Control
P Partition coefficient
R1 Longitudinal Relaxation Rate
R2 Transverse Relaxation Rate
RF Radio Frequency
SE Solid Effect
SNR Signal-to-Noise Ratio
SPECT Single-photon emission
computed tomography
T1 Longitudinal relaxation time
T2 Transverse relaxation time
TE Echo Time
TEMPO 2,2,6,6-Tetramethylpiperidine-
1-oxyl
TM Thermal Mixing
TOF Time-Of-Flight
TR Repetition Time
US Ultra Sound

xiii
Table of Contents
1 Introduction .................................................................................................................................. 1
1.1 Aims ........................................................................................................................................ 1
1.2 Clinical Motivation ................................................................................................................. 2
2 Angiography and Perfusion .......................................................................................................... 4
2.1 Coronary Catheterizations ..................................................................................................... 4
2.2 Computed Tomography ......................................................................................................... 5
2.1 Ultrasound ............................................................................................................................. 5
2.2 Magnetic Resonance Angiography ........................................................................................ 5
2.3 Coronary Angiography ........................................................................................................... 8
2.4 Perfusion ................................................................................................................................ 9
3 Hyperpolarization ....................................................................................................................... 11
3.1 Dynamic Nuclear Polarization .............................................................................................. 12
3.2 Dissolution-DNP (d-DNP) ..................................................................................................... 15
3.3 Hyperpolarized 13C Angiography and Perfusion .................................................................. 16
3.4 Hyperpolarized Water .......................................................................................................... 18
4 Safety of the formulation and administration ............................................................................ 22
5 Studies and Results ..................................................................................................................... 24
5.1 Study I: Dissolution Dynamic Nuclear Polarization capability study with fluid path ........... 24
5.1.1 Introduction .................................................................................................................. 24
5.1.2 Methods ........................................................................................................................ 25
5.1.3 Results ........................................................................................................................... 28
5.1.4 Discussion ..................................................................................................................... 29
5.1.5 Conclusion .................................................................................................................... 30
5.2 Study II: Large dose hyperpolarized water with dissolution-DNP at high magnetic field ... 31
5.2.1 Introduction .................................................................................................................. 31
5.2.2 Methods ........................................................................................................................ 32
5.2.3 Results ........................................................................................................................... 34
xiv
5.2.4 Discussion ..................................................................................................................... 39
5.2.5 Conclusions ................................................................................................................... 41
5.3 Study III: Hyperpolarized 13C MR Angiography .................................................................... 42
5.3.1 Introduction .................................................................................................................. 42
5.3.2 Methods ........................................................................................................................ 42
5.3.3 Results ........................................................................................................................... 43
5.3.4 Discussion ..................................................................................................................... 45
5.3.5 Conclusion .................................................................................................................... 45
5.4 Study IV: Renal MR Angiography and Perfusion in the Pig using Hyperpolarized Water ... 46
5.4.1 Introduction .................................................................................................................. 46
5.4.2 Methods ........................................................................................................................ 47
5.4.3 Results ........................................................................................................................... 49
5.4.4 Discussion ..................................................................................................................... 51
5.4.5 Conclusion .................................................................................................................... 52
5.5 Study V: Dynamic Coronary MR Angiography in the Pig using Hyperpolarized Water ....... 53
5.5.1 Introduction .................................................................................................................. 53
5.5.2 Methods ........................................................................................................................ 53
5.5.3 Results ........................................................................................................................... 54
5.5.4 Discussion ..................................................................................................................... 56
5.5.5 Conclusion .................................................................................................................... 57
6 Discussion ................................................................................................................................... 58
7 Conclusion .................................................................................................................................. 63
Bibliography ........................................................................................................................................ 65
Appendix: Article Collection ............................................................................................................... 76
Paper I ............................................................................................................................................. 77
Paper II ............................................................................................................................................ 85
Paper III ......................................................................................................................................... 109
Paper IV ......................................................................................................................................... 117
Paper V .......................................................................................................................................... 125
1
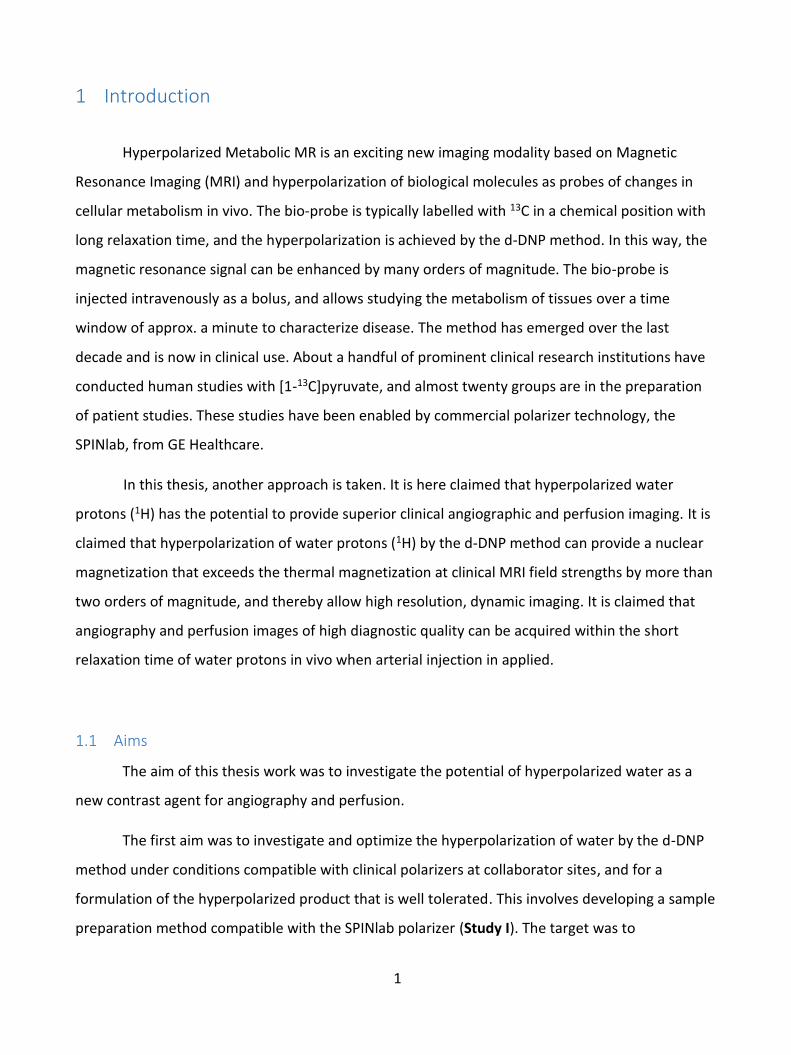
1 Introduction
Hyperpolarized Metabolic MR is an exciting new imaging modality based on Magnetic
Resonance Imaging (MRI) and hyperpolarization of biological molecules as probes of changes in
cellular metabolism in vivo. The bio-probe is typically labelled with 13C in a chemical position with
long relaxation time, and the hyperpolarization is achieved by the d-DNP method. In this way, the
magnetic resonance signal can be enhanced by many orders of magnitude. The bio-probe is
injected intravenously as a bolus, and allows studying the metabolism of tissues over a time
window of approx. a minute to characterize disease. The method has emerged over the last
decade and is now in clinical use. About a handful of prominent clinical research institutions have
conducted human studies with [1-13C]pyruvate, and almost twenty groups are in the preparation
of patient studies. These studies have been enabled by commercial polarizer technology, the
SPINlab, from GE Healthcare.
In this thesis, another approach is taken. It is here claimed that hyperpolarized water
protons (1H) has the potential to provide superior clinical angiographic and perfusion imaging. It is
claimed that hyperpolarization of water protons (1H) by the d-DNP method can provide a nuclear
magnetization that exceeds the thermal magnetization at clinical MRI field strengths by more than
two orders of magnitude, and thereby allow high resolution, dynamic imaging. It is claimed that
angiography and perfusion images of high diagnostic quality can be acquired within the short
relaxation time of water protons in vivo when arterial injection in applied.
1.1 Aims
The aim of this thesis work was to investigate the potential of hyperpolarized water as a
new contrast agent for angiography and perfusion.
The first aim was to investigate and optimize the hyperpolarization of water by the d-DNP
method under conditions compatible with clinical polarizers at collaborator sites, and for a
formulation of the hyperpolarized product that is well tolerated. This involves developing a sample
preparation method compatible with the SPINlab polarizer (Study I). The target was to
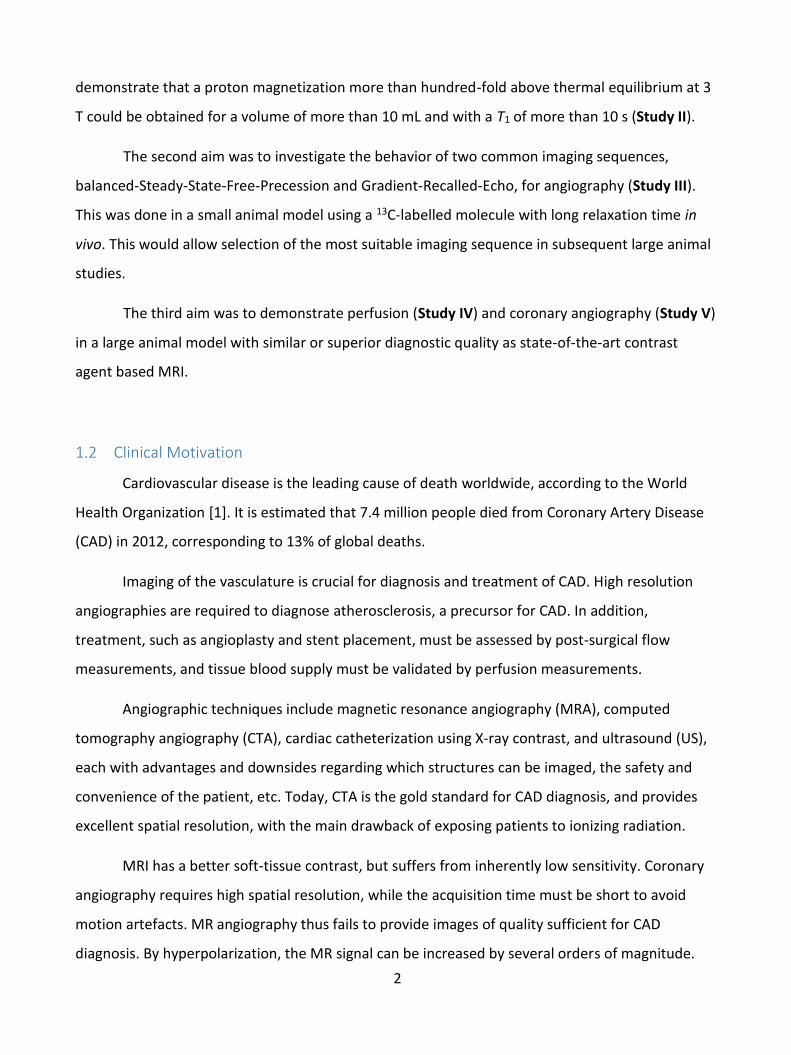
2
demonstrate that a proton magnetization more than hundred-fold above thermal equilibrium at 3
T could be obtained for a volume of more than 10 mL and with a T1 of more than 10 s (Study II).
The second aim was to investigate the behavior of two common imaging sequences,
balanced-Steady-State-Free-Precession and Gradient-Recalled-Echo, for angiography (Study III).
This was done in a small animal model using a 13C-labelled molecule with long relaxation time in
vivo. This would allow selection of the most suitable imaging sequence in subsequent large animal
studies.
The third aim was to demonstrate perfusion (Study IV) and coronary angiography (Study V)
in a large animal model with similar or superior diagnostic quality as state-of-the-art contrast
agent based MRI.
1.2 Clinical Motivation
Cardiovascular disease is the leading cause of death worldwide, according to the World
Health Organization [1]. It is estimated that 7.4 million people died from Coronary Artery Disease
(CAD) in 2012, corresponding to 13% of global deaths.
Imaging of the vasculature is crucial for diagnosis and treatment of CAD. High resolution
angiographies are required to diagnose atherosclerosis, a precursor for CAD. In addition,
treatment, such as angioplasty and stent placement, must be assessed by post-surgical flow
measurements, and tissue blood supply must be validated by perfusion measurements.
Angiographic techniques include magnetic resonance angiography (MRA), computed
tomography angiography (CTA), cardiac catheterization using X-ray contrast, and ultrasound (US),
each with advantages and downsides regarding which structures can be imaged, the safety and
convenience of the patient, etc. Today, CTA is the gold standard for CAD diagnosis, and provides
excellent spatial resolution, with the main drawback of exposing patients to ionizing radiation.
MRI has a better soft-tissue contrast, but suffers from inherently low sensitivity. Coronary
angiography requires high spatial resolution, while the acquisition time must be short to avoid
motion artefacts. MR angiography thus fails to provide images of quality sufficient for CAD
diagnosis. By hyperpolarization, the MR signal can be increased by several orders of magnitude.

3
Hyperpolarized water could overcome both the challenge of high spatial resolution and short
acquisition time, while also being compatible with the equipment and MRI sequences already
existing in the clinic. Furthermore, the tracer could serve as a perfusion marker for treatment
assessment, to form a one-stop shop for CAD diagnosis and assessment.
With the target of complementing existing MRI techniques to achieve a full MR cardiac
package, a novel contrast agent consisting of hyperpolarized water will be presented. The
hypothesis is that the signal of the hyperpolarized nuclei can provide enough sensitivity to
produce images of similar resolution and quality as CTA. The main goal of this project was to
demonstrate coronary angiography and perfusion using hyperpolarized water MRI in large
animals. The hope was to form a basis for future perspectives of a novel CAD diagnostic tool,
which could potentially replace CTA and hence save the radiation burden in millions of people
every year.
13C-labelled pyruvate is the main research target in the field of hyperpolarization by d-DNP.
Pyruvate is the end product of glycolysis, and serves at the precursor to the tricarboxylic acid cycle
for ATP production. By spectroscopic imaging or chemical shift imaging, concentrations of
metabolism products such as lactate, alanine and bicarbonate, can be monitored, and thus the
biochemical pathways can be followed over time. In addition to being a non-invasive, radiation
free technology, the method provides otherwise unavailable measures of metabolism.
The method has been applied in preclinical studies for several years [2], and several
research groups have initiated clinical research with promising results [3,4].

4
2 Angiography and Perfusion
Medical imaging is essential in diagnosis and therapy assessment, where MRI and CT are
the major modalities with 72 million and 26 million, examinations every year in the US alone [5].
Angiography is the field of visualizing the lumen of blood vessels and organs in the body,
and can be achieved by several techniques and modalities.
2.1 Coronary Catheterizations
Every year, millions of people in the United States suspected of having CAD are examined
with coronary catheterizations [6]. Coronary catheterizations is a minimally invasive method to
obtain images of the coronary arteries, in which a catheter is inserted through an artery in the
groin or arm to reach the heart. The end of the catheter is placed in the coronary arteries, where
contrast agent is injected during X-ray imaging. An example is shown in Figure 1A.
Figure 1: Luminal narrowing in proximal left anterior descending artery (LAD, arrow) and stenosis in middle LAD (arrow head) in a 66 year old male. A) Coronary catheterization X-ray image showing the fine structure of the arterial branches and apparent vessel narrowing. B) Thin-slab maximum intensity projection (MIP) across the LAD plane from a 64-slice multi detector CT scan, showing non-calcified plaque in proximal LAD and mixed calcified and non-calcified atherosclerotic plaque in middle LAD. Reprinted with permission from [7].
The method can provide images of high resolution, and the catheter can be applied for angioplasty
and stent placement. However, several complications are associated with coronary
catheterization. Smaller risks include infection, allergic reactions to the contrast agent and
5
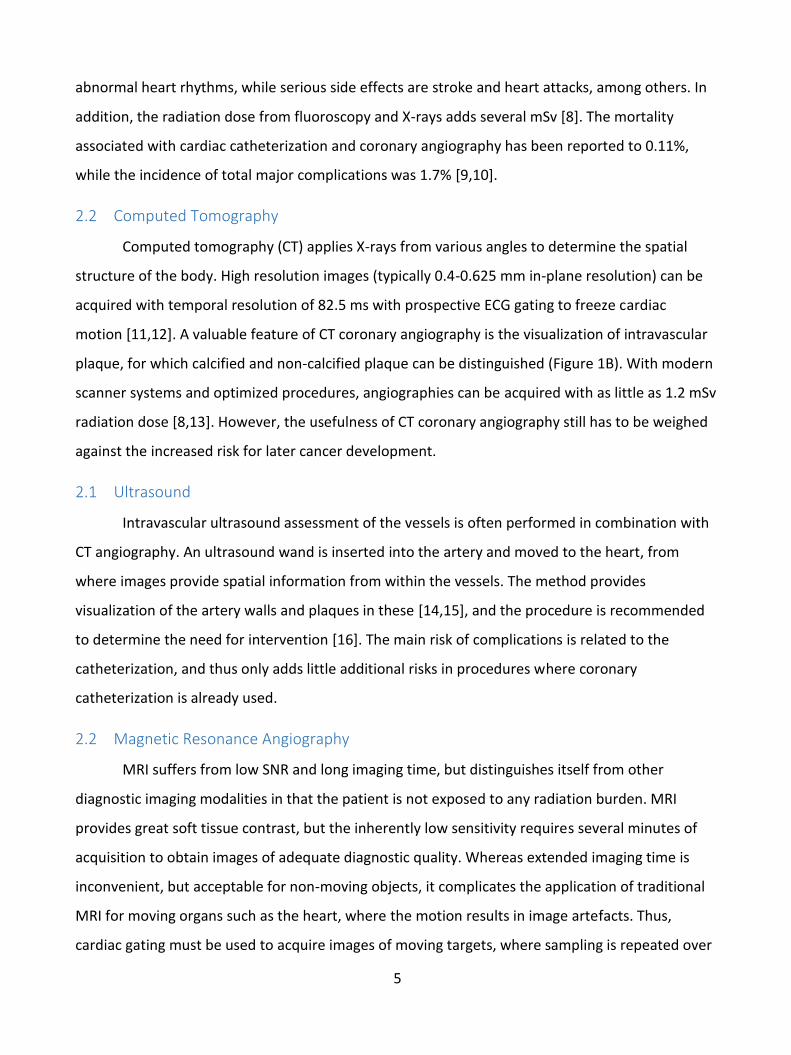
abnormal heart rhythms, while serious side effects are stroke and heart attacks, among others. In
addition, the radiation dose from fluoroscopy and X-rays adds several mSv [8]. The mortality
associated with cardiac catheterization and coronary angiography has been reported to 0.11%,
while the incidence of total major complications was 1.7% [9,10].
2.2 Computed Tomography
Computed tomography (CT) applies X-rays from various angles to determine the spatial
structure of the body. High resolution images (typically 0.4-0.625 mm in-plane resolution) can be
acquired with temporal resolution of 82.5 ms with prospective ECG gating to freeze cardiac
motion [11,12]. A valuable feature of CT coronary angiography is the visualization of intravascular
plaque, for which calcified and non-calcified plaque can be distinguished (Figure 1B). With modern
scanner systems and optimized procedures, angiographies can be acquired with as little as 1.2 mSv
radiation dose [8,13]. However, the usefulness of CT coronary angiography still has to be weighed
against the increased risk for later cancer development.
2.1 Ultrasound
Intravascular ultrasound assessment of the vessels is often performed in combination with
CT angiography. An ultrasound wand is inserted into the artery and moved to the heart, from
where images provide spatial information from within the vessels. The method provides
visualization of the artery walls and plaques in these [14,15], and the procedure is recommended
to determine the need for intervention [16]. The main risk of complications is related to the
catheterization, and thus only adds little additional risks in procedures where coronary
catheterization is already used.
2.2 Magnetic Resonance Angiography
MRI suffers from low SNR and long imaging time, but distinguishes itself from other
diagnostic imaging modalities in that the patient is not exposed to any radiation burden. MRI
provides great soft tissue contrast, but the inherently low sensitivity requires several minutes of
acquisition to obtain images of adequate diagnostic quality. Whereas extended imaging time is
inconvenient, but acceptable for non-moving objects, it complicates the application of traditional
MRI for moving organs such as the heart, where the motion results in image artefacts. Thus,
cardiac gating must be used to acquire images of moving targets, where sampling is repeated over
6
several cardiac cycles. With this technique, cine imaging, the heart function can be assessed.
However, the image quality is limited, and the resolution of >1.5 mm is inadequate for CAD
diagnosis [17,18].
Due to its safety and good soft tissue contrast, MRI is the preferred technique for several
types of diagnostic imaging today. However, in one third of the examinations, gadolinium based
contrast agents are used. The use of gadolinium-based contrast agents is especially problematic
for kidney patients, where development of Nephrogenic Systemic Fibrosis (NSF) since 2006 has
been linked with contrast-enhanced MRI in patients with reduced kidney function [19]. A
retrospective study of about 370 patients with severe renal insufficiency who had undergone
contrast-enhanced MRI with the Gd-based contrast agent Omniscan estimated the risk of NSF to
4%. Another study found gadolinium in the tissue of patients with NSF [20], another indication for
the link between Gd and NSF. In addition, recent studies have determined high signal intensity in
the dentate nucleus and globus pallidus in T1-weighted images of the brain for patients who had
undergone 6 or more contrast-enhanced MRI examinations. The high signal intensity in these
areas are associated with diseases such as multiple sclerosis and hepatitis dysfunction. Thus, new
solutions for MRI signal enhancement are called for. Angiographic images using magnetic
resonance can be acquired with or without injection of contrast agents. Non contrast-enhanced
MRA can be obtained via the time-of-flight (TOF) principle, or by phase contrast (PC) [21–23].
Time-of-flight
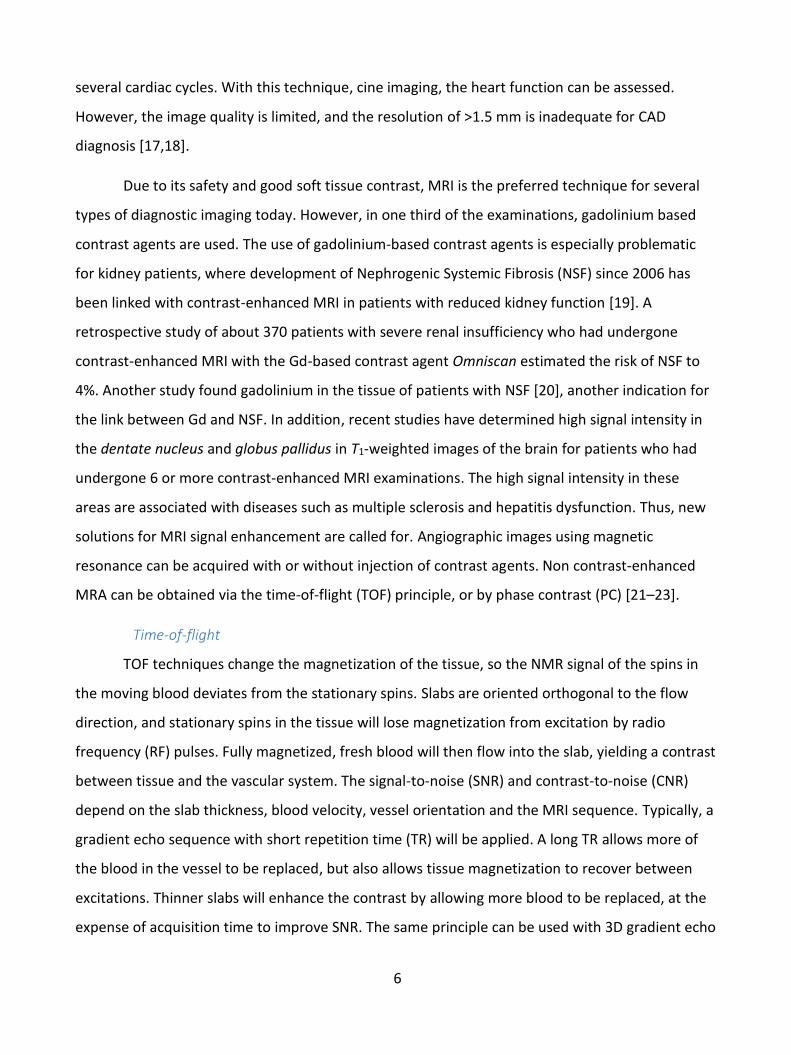
TOF techniques change the magnetization of the tissue, so the NMR signal of the spins in
the moving blood deviates from the stationary spins. Slabs are oriented orthogonal to the flow
direction, and stationary spins in the tissue will lose magnetization from excitation by radio
frequency (RF) pulses. Fully magnetized, fresh blood will then flow into the slab, yielding a contrast
between tissue and the vascular system. The signal-to-noise (SNR) and contrast-to-noise (CNR)
depend on the slab thickness, blood velocity, vessel orientation and the MRI sequence. Typically, a
gradient echo sequence with short repetition time (TR) will be applied. A long TR allows more of
the blood in the vessel to be replaced, but also allows tissue magnetization to recover between
excitations. Thinner slabs will enhance the contrast by allowing more blood to be replaced, at the
expense of acquisition time to improve SNR. The same principle can be used with 3D gradient echo
7
sequence, where a series of thin slices are imaged and stacked after reconstruction. An example is
shown in Figure 2.
Phase contrast
In the phase contrast technique, bipolar gradients are used to encode the velocity of the
spins. A gradient is applied, and after a delay, a second gradient of equal magnitude, but opposite
direction, is turned on. Spins of flowing blood will be phase shifted, because the position in the
gradient field has changed from the first to the second gradient. Stationary tissue spins will have
zero phase shift. The NMR signal of the moving spins is linearly decreasing with their phase shift.
The gradient pair can be applied in all three directions; thus, the flow is imaged in all directions.
The phase shifted image is subtracted from an image without velocity encoding, and the resulting
angiography provides quantitative information of flow velocity and direction.
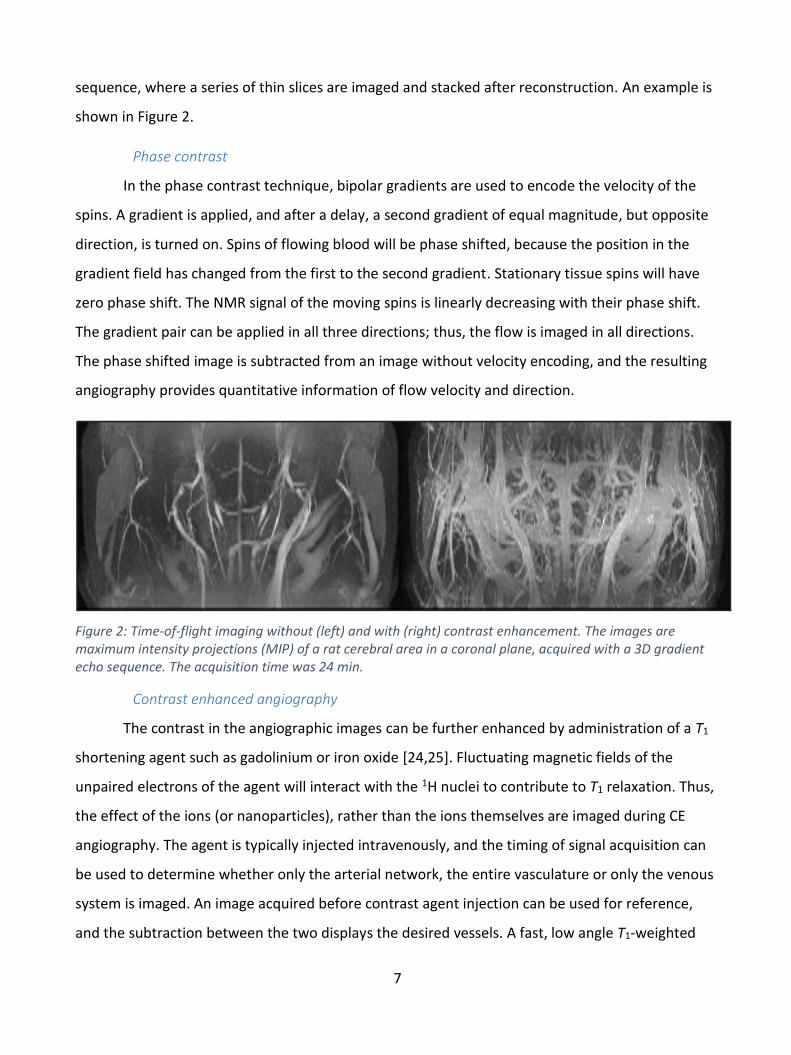
Figure 2: Time-of-flight imaging without (left) and with (right) contrast enhancement. The images are maximum intensity projections (MIP) of a rat cerebral area in a coronal plane, acquired with a 3D gradient echo sequence. The acquisition time was 24 min.
Contrast enhanced angiography
The contrast in the angiographic images can be further enhanced by administration of a T1
shortening agent such as gadolinium or iron oxide [24,25]. Fluctuating magnetic fields of the
unpaired electrons of the agent will interact with the 1H nuclei to contribute to T1 relaxation. Thus,
the effect of the ions (or nanoparticles), rather than the ions themselves are imaged during CE
angiography. The agent is typically injected intravenously, and the timing of signal acquisition can
be used to determine whether only the arterial network, the entire vasculature or only the venous
system is imaged. An image acquired before contrast agent injection can be used for reference,
and the subtraction between the two displays the desired vessels. A fast, low angle T1-weighted
8
sequence such as FLASH is typically used for CE angiography. An example using the iron based
blood pool agent Clariscan™ and a 3D gradient echo sequence is shown in Figure 2.
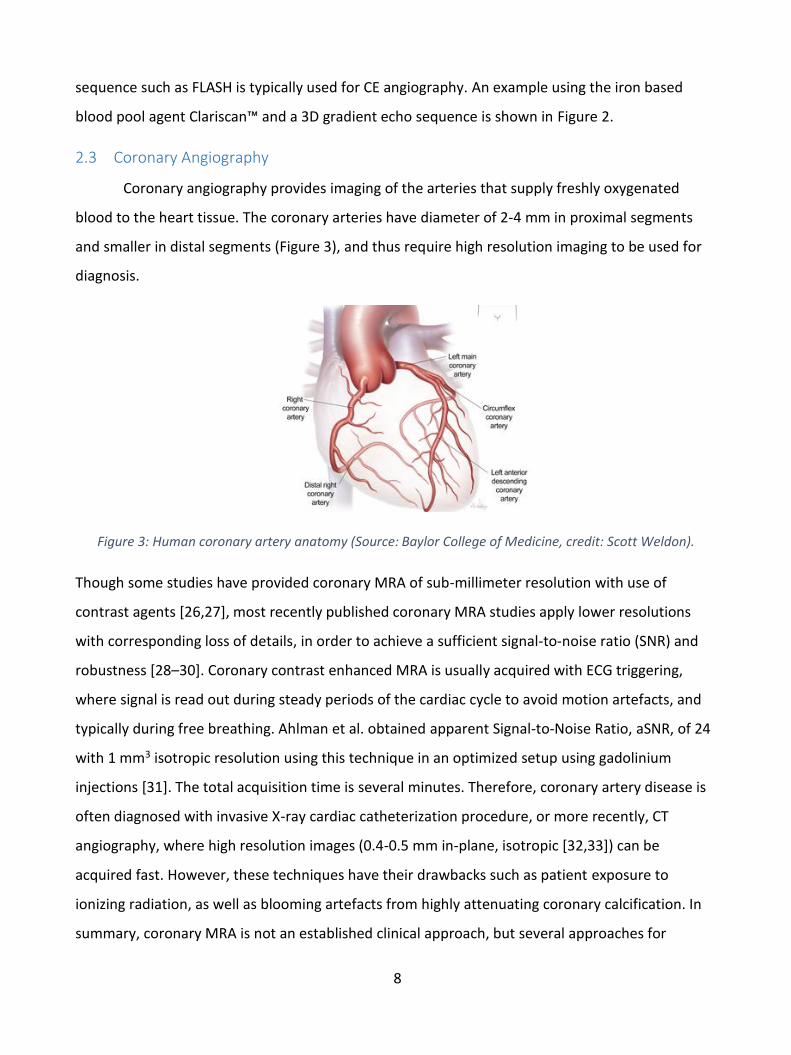
2.3 Coronary Angiography
Coronary angiography provides imaging of the arteries that supply freshly oxygenated
blood to the heart tissue. The coronary arteries have diameter of 2-4 mm in proximal segments
and smaller in distal segments (Figure 3), and thus require high resolution imaging to be used for
diagnosis.
Figure 3: Human coronary artery anatomy (Source: Baylor College of Medicine, credit: Scott Weldon).
Though some studies have provided coronary MRA of sub-millimeter resolution with use of
contrast agents [26,27], most recently published coronary MRA studies apply lower resolutions
with corresponding loss of details, in order to achieve a sufficient signal-to-noise ratio (SNR) and
robustness [28–30]. Coronary contrast enhanced MRA is usually acquired with ECG triggering,
where signal is read out during steady periods of the cardiac cycle to avoid motion artefacts, and
typically during free breathing. Ahlman et al. obtained apparent Signal-to-Noise Ratio, aSNR, of 24
with 1 mm3 isotropic resolution using this technique in an optimized setup using gadolinium
injections [31]. The total acquisition time is several minutes. Therefore, coronary artery disease is
often diagnosed with invasive X-ray cardiac catheterization procedure, or more recently, CT
angiography, where high resolution images (0.4-0.5 mm in-plane, isotropic [32,33]) can be
acquired fast. However, these techniques have their drawbacks such as patient exposure to
ionizing radiation, as well as blooming artefacts from highly attenuating coronary calcification. In
summary, coronary MRA is not an established clinical approach, but several approaches for
9
feasibility are made due to the potential advantages over competing diagnostic technologies [34].
Other interesting tools such as assessment of atherosclerotic disease in vessel walls could follow
from high resolution, motion-robust MRA techniques [35].
2.4 Perfusion
In physiology, perfusion is the process of a body delivering blood to a capillary bed in its
biological tissue. Perfusion is defined as the passage of fluid through the lymphatic system or
blood vessels to an organ or a tissue. Myocardial perfusion provides an accurate means for
diagnosing obstructive CAD, and post-surgical flow measurements are an integrated part of a
number of treatments for cardiac disease.
Perfusion measurements can be performed with MRI in several ways. The late gadolinium
enhancement method images the temporal concentrations of a water soluble gadolinium chelated
agent through the changes in relaxation time with a T1-weighted gradient echo sequence [36]. The
main drawback is the gadolinium-related complications discussed earlier, and the low sensitivity. A
noninvasive method using Arterial Spin Labelling (ASL) eliminates both catheterization and
gadolinium, but the sensitivity is even lower than for the late enhancement method [37].
A method corresponding to the late gadolinium enhancement in MRI is the tracing of
iodinated contrast agents using CT [33,38]. The method provides higher sensitivity, but
incorporates the safety concerns of CT (cancer development) and adds new complications from
toxicity of the iodinated contrast agent [39].
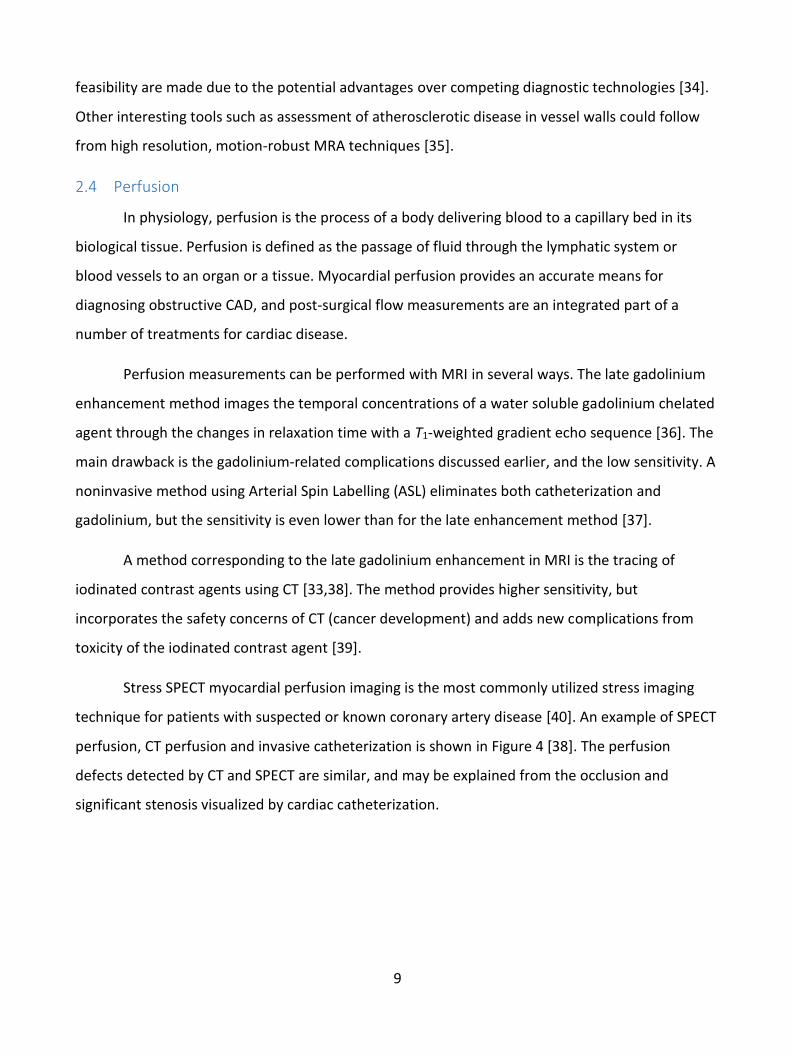
Stress SPECT myocardial perfusion imaging is the most commonly utilized stress imaging
technique for patients with suspected or known coronary artery disease [40]. An example of SPECT
perfusion, CT perfusion and invasive catheterization is shown in Figure 4 [38]. The perfusion
defects detected by CT and SPECT are similar, and may be explained from the occlusion and
significant stenosis visualized by cardiac catheterization.
10
Figure 4: Comparison of SPECT perfusion (left), CT perfusion (center), and invasive coronary angiography (right) in a 55 year-old man in stress (top) and rest (bottom). The perfusion defects detected by CT and SPECT are related to the stenosis in the left circumflex at stress (top, right) and occlusion in the LAD at rest (right, bottom). Reprinted with permission from [38].
PET is another modality for perfusion imaging, and studies suggest that is may provide
better diagnostic quality than SPECT [41]. Due to the permeability differences and active transport
limitations of contrast agents, it has been attempted to find a suitable tracer based on water
molecules. Thus, 15O-labeled water as a tracer for positron emission tomography (PET) imaging has
been suggested [42–44], with the main drawbacks of the limited spatial and temporal resolution
of PET, the need for an on-site cyclotron, and the risk profile of the radioactive tracer. Other
recent suggestions for a water based perfusion tracer include NMR detection of H217O in the blood
after a short 17O2 gas inhalation [45].
11
3 Hyperpolarization
When a sample is allowed to be undisturbed for a long time in a magnetic field, it reaches a
state of thermal equilibrium. The populations of nuclear spin states follow the Boltzmann
distribution. For a spin I, the number of spins in the state 𝑚 is given by [46]
𝑁𝑚 = 𝑁0
𝑒−𝐸𝑚𝑘𝐵𝑇
∑ 𝑒−𝐸𝑛𝑘𝐵𝑇𝑛=𝐼
𝑛=−𝐼
where 𝑁0 is the total spin population, 𝑘𝐵 is Boltzmann’s constant, T is the temperature, and 𝐸𝑚 is
the energy of the eigenstate m given by
𝐸𝑚 = −𝑚 𝛾 ħ 𝐵0
where the state 𝑚, in the case of spin ½, can be parallel (𝑚 = +½) or antiparallel (𝑚 = −½) to
the magnetic field, 𝐵0, γ is the gyromagnetic ratio and ħ is the reduced Planck’s constant. The
polarization is defined as the normalized population difference,
𝑃 = 𝑁↑ − 𝑁↓
𝑁↑ + 𝑁↓
where N↑ and N↓ are the numbers of spins aligned and anti-aligned with the magnetic field,
respectively. The thermal polarization is then given as
𝑃 = tanh (ħ 𝛾𝐵
2𝑘𝐵𝑇).
For 1H and 13C in a clinical MRI system of 3 T at room temperature, the polarization is 10 ppm and
2.5 ppm, respectively.
The potential for sensitivity improvement is therefore tremendous; in principle, close to
five orders of magnitude depending on the nucleus and field strength. Since the earliest days of
magnetic resonance, various ideas of enhancing the signal-to-noise ratio by increasing the nuclear
spin polarization above thermal equilibrium have been investigated. Trivially, the polarization can
be increased by raising the magnetic field and lowering the temperature, but there are limited
possibilities in conventional NMR and MRI. Currently, the highest magnetic field strength is 23 T
12
for NMR and 9.4 T for whole body MRI. Only in solid-state NMR is there any room to optimize the
sensitivity by lowering the temperature.
Hyperpolarization is the process of polarizing spins beyond the Boltzmann distribution.
Hyperpolarization signifies a spin polarization that deviates strongly from thermal equilibrium. A
characteristic of hyperpolarization is that the polarization is created ex situ, and therefore cannot
be restored to the initial state. The polarization decays irreversible by relaxation or signal
acquisition. In 2003, a novel method for polarizing nuclear spins in molecules in solution was
demonstrated. The method takes advantage of Dynamic Nuclear Polarization (DNP) in the solid
state followed by rapid dissolution in a suitable solvent. The polarization is retained almost
completely in the dissolution step creating a solution with a non-thermal nuclear polarization
approaching unity. Enhancements of more than 10,000 can be achieved using d-DNP (dDNP) [47].
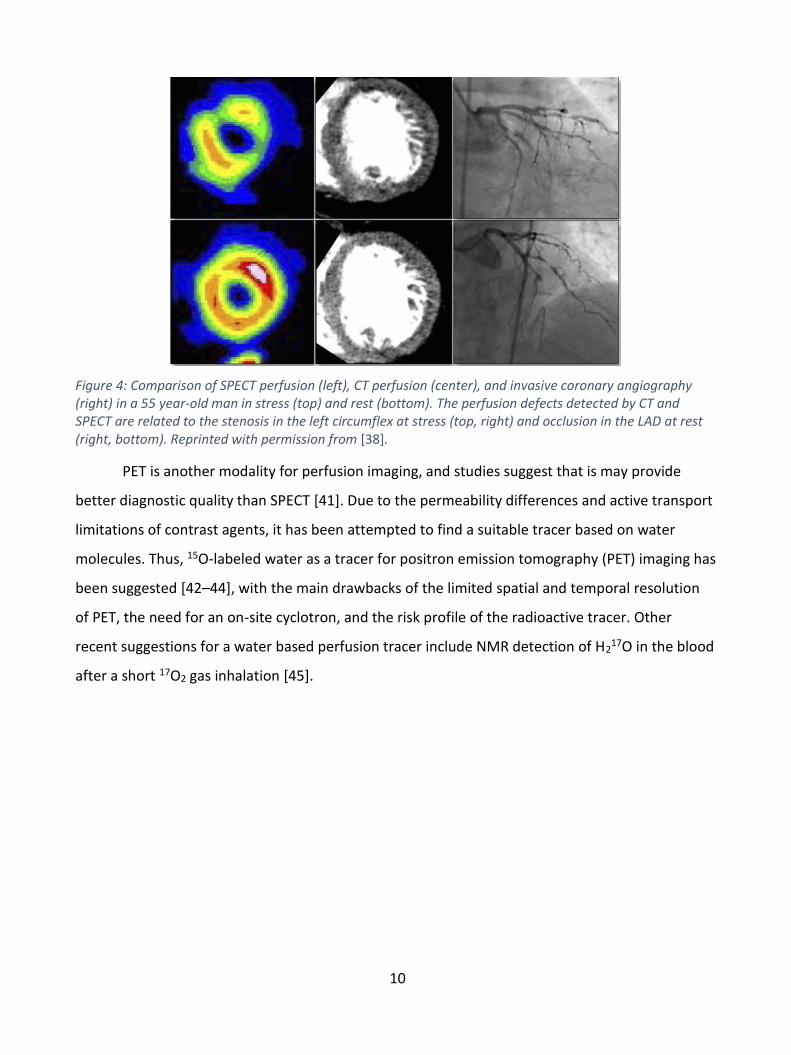
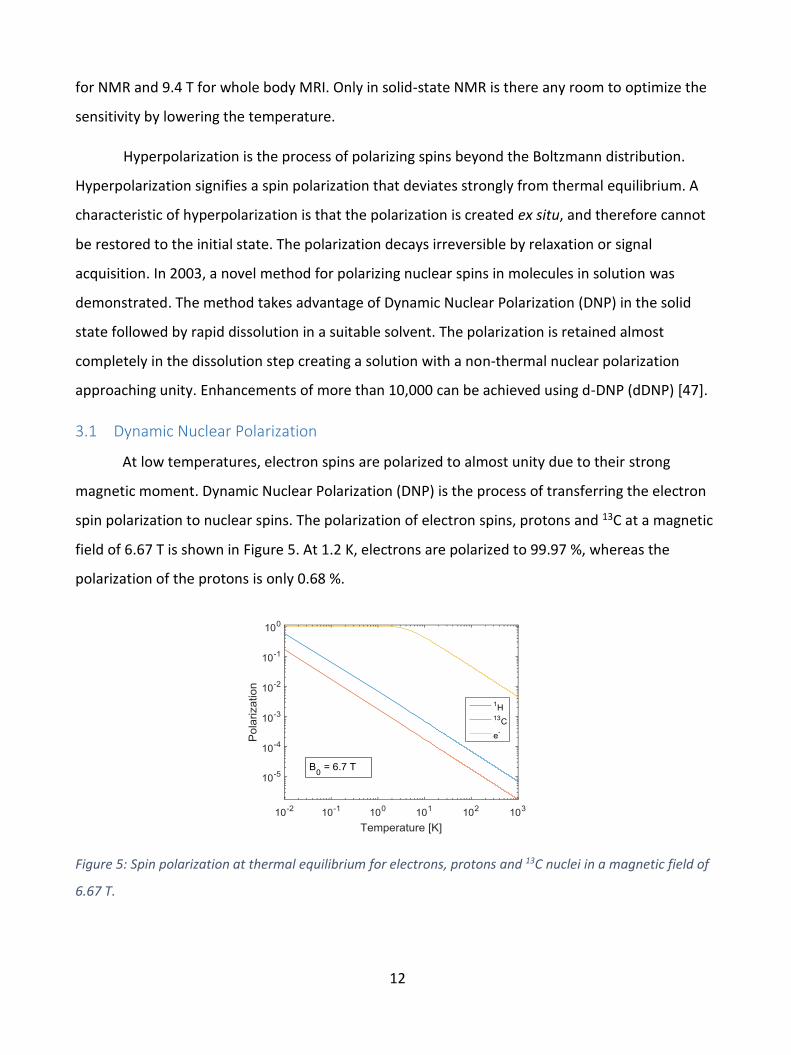
3.1 Dynamic Nuclear Polarization
At low temperatures, electron spins are polarized to almost unity due to their strong
magnetic moment. Dynamic Nuclear Polarization (DNP) is the process of transferring the electron
spin polarization to nuclear spins. The polarization of electron spins, protons and 13C at a magnetic
field of 6.67 T is shown in Figure 5. At 1.2 K, electrons are polarized to 99.97 %, whereas the
polarization of the protons is only 0.68 %.
Figure 5: Spin polarization at thermal equilibrium for electrons, protons and 13C nuclei in a magnetic field of
6.67 T.
13
The spin polarization of the unpaired electrons is transferred to nuclear spins by irradiation
with microwaves close to the resonance frequency of the electron spin in the solid state. DNP was
predicted by Albert Overhauser in 1953 for conduction electrons in a metal [48], and later, in the
same year, Carver and Richter demonstrated the effect experimentally using metallic lithium, and
later on using other materials [49,50]. Abragam extended the theory to electron spins in solution
[51], and it was soon demonstrated that also nuclear spins in the solid state could be polarized
dynamically [52]. Several mechanisms for DNP have been described.
The solid effect invokes the interaction between low concentration free electrons and
atomic nuclei by flip-flop transitions induced by the microwave field [53], where double quantum
or zero quantum transitions are exited and exploits the hyperfine coupling between electrons and
surrounding nuclei. The principle was described by Abragam and Goldman in 1978 [54]. The solid
effect is generally observed when the electron paramagnetic resonance (EPR) linewidth is
significantly narrower than the NMR frequency.
Thermal mixing is a two-step process. The first step is a single quantum transition, and
therefore thermal mixing requires less microwave power than the solid effect. Thermal mixing is
efficient when the EPR linewidth is comparable to or larger than the NMR Larmor frequency, and
when the electron spin concentration is high enough to ensure a common electron spin
temperature through dipolar couplings [55,56].
Thermal mixing breaks down when the electron spin resonance is inhomogeneously
broadened and a spin temperature cannot be assigned to the dipolar reservoir. In this situation,
the mechanism has been named the cross effect, and the DNP efficiency is reduced. At low
temperature, this situation may arise at high magnetic fields where the EPR linewidth is becoming
much wider than the electron dipolar couplings. The DNP efficiency may be recovered by
increasing the concentration of electron spins to increase the electron-electron dipolar interaction
or by MW frequency modulation.
The transfer of polarization from electrons to nuclei can be increased and accelerated by
modulation of the microwave frequency. Thurber et al. [57] demonstrated in 2010 that DNP effect
and rate can be enhanced by modulation of the magnetic field strength, and Hovav et al. [58]
showed that modulation of the microwave frequency at 3.38 T and 30 K can yield even larger
14
effect, while being more flexible and depositing less heat than modulation of the static magnetic
field. Later, Bornet et al. [59] published results on frequency modulation by sinusoidal frequency
modulation at 6.7 T magnet and 1.2 K.
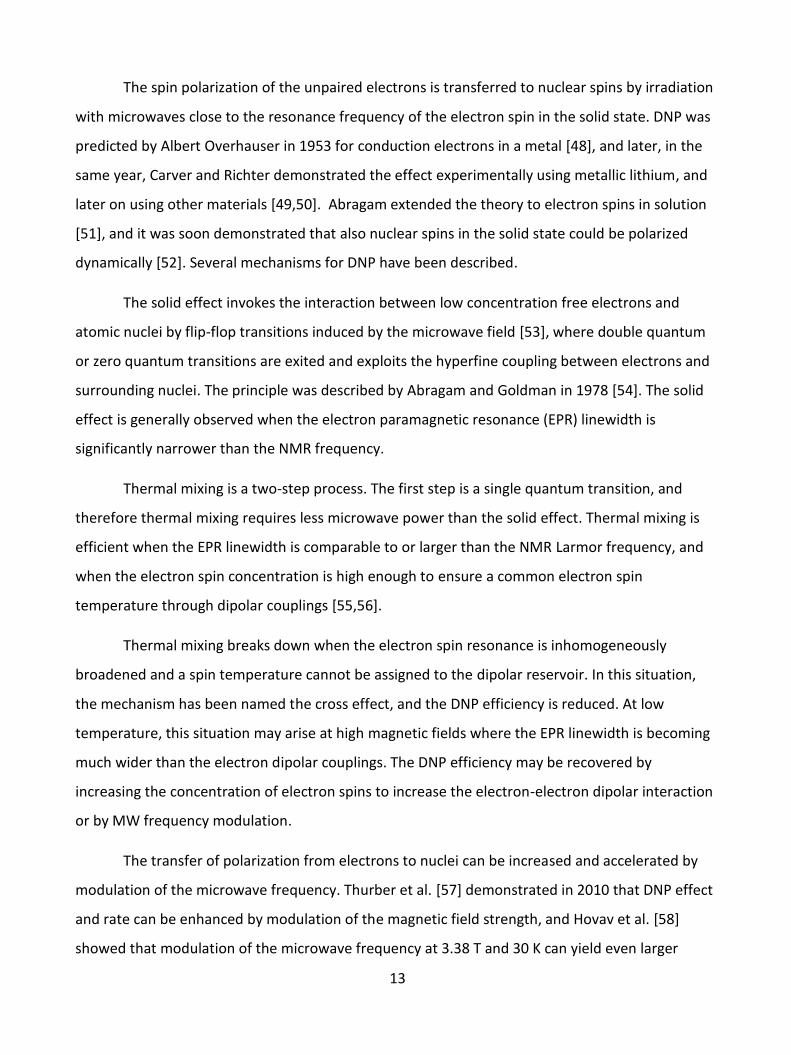
The optimal carrier frequency, fµw, is determined by a frequency sweep. The sinusoidal
modulation is characterized by the modulation frequency, fmod, and the modulation range, Δfµw,
where the latter is sometimes expressed modulation amplitude amod = Δfµw/2. A graphical
definition is shown in Figure 6.
Figure 6: Graphical interpretation of frequency modulation and definition of parameters. Reprinted with
permission from [59].
By implementation of frequency modulation in DNP, electron spins packets in a range of
resonance frequencies are exited. Thus, the modulation of the microwave frequency should cover
a substantial part of the inhomogeneously broadened radical EPR line for maximum efficiency. In
addition, the modulation frequency should be higher than the inverse electron T1 for full
utilization of electron polarization.
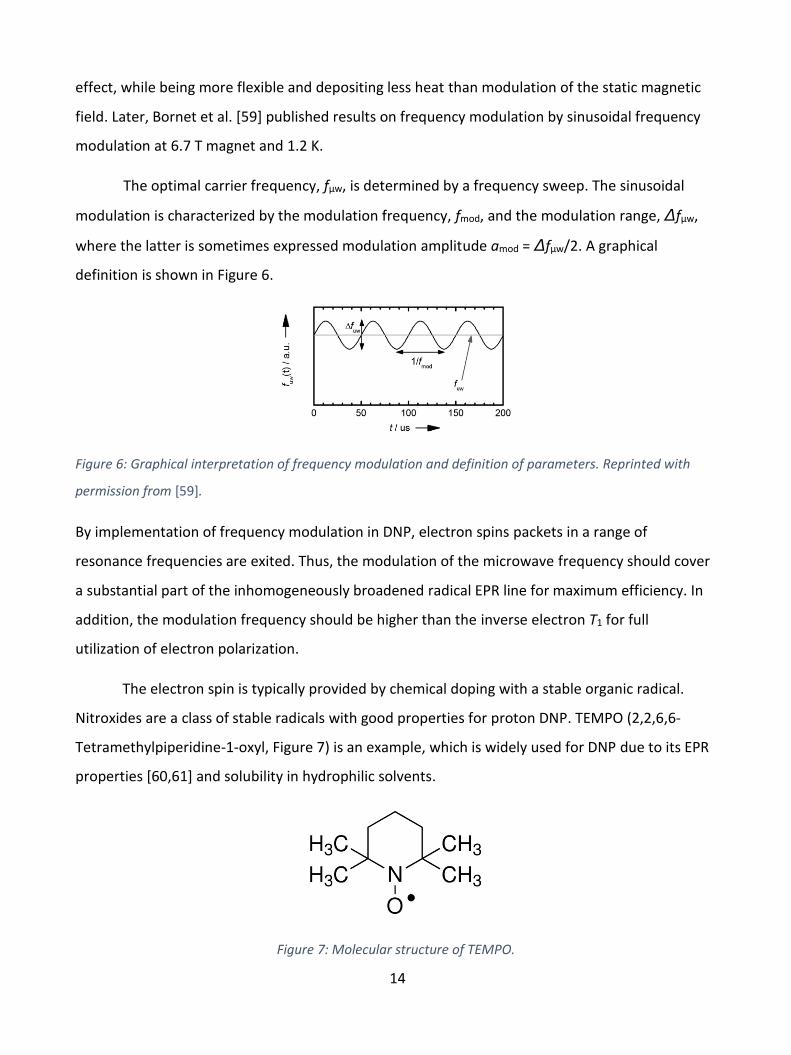
The electron spin is typically provided by chemical doping with a stable organic radical.
Nitroxides are a class of stable radicals with good properties for proton DNP. TEMPO (2,2,6,6-
Tetramethylpiperidine-1-oxyl, Figure 7) is an example, which is widely used for DNP due to its EPR
properties [60,61] and solubility in hydrophilic solvents.
Figure 7: Molecular structure of TEMPO.

15
Trityls are a group of narrow EPR linewidth radicals that are usually applied for 13C
hyperpolarization. The linewidth of the trityl matches closely the Larmor frequency of 13C, and is
therefore the best-known radical for direct 13C DNP. However, the narrow EPR line width makes it
inefficient for proton polarization, since the solid effect is difficult to drive at high magnetic field
and low temperature. The trityl OX063 is used in Study III for hyperpolarization of the 13C labelled
compound HP001 (long T1 quarternary carbon labelling).
Frozen water (ice) is a crystalline sample that will not provide a uniform doping of the
electron paramagnetic agent. Thus, a glassing agent such as glycerol or dimethyl sulfoxide (DMSO)
is typically used in the sample to ensure good glassing. However, the glassing agent may be
omitted and replaced by techniques such as rapid freezing [62]. For in vivo studies the glassing
agent has to be well tolerated. This limits the choice, and typical options are glycerol, DMSO,
ethanol, or mixtures thereof.
3.2 Dissolution-DNP (d-DNP)
D-DNP is the most versatile method for obtaining hyperpolarized nuclear spins in solution.
DNP in the solid state at low temperature allows high nuclear polarization of a range of nuclei and
molecules. The polarized solid sample is rapidly dissolved without substantially loss of polarization
[47,63]. The dissolved sample is transferred for detection in either an NMR spectrometer for in
vitro experiments, or to an MRI system for imaging in vivo. The longitudinal relaxation time, T1,
reduces significantly once the sample has been dissolved, and the transfer from polarizer to
detector must therefore be fast. Ardenkjær-Larsen and coworkers demonstrated in 2003 that 13C-
urea could be dissolved and transferred to an NMR tube in a spectrometer in less than 6 s [47]. For
in vivo studies of metabolism, T1 has to be relatively long. Both from a logistical perspective, but
also to ensure enough time for circulation and metabolism. Therefore, 13C-labelling of carboxylic
acids or carbonyls in small molecules has been preferred. The longitudinal relaxation time is
affected by many parameters. Generally, small molecules (<100 Da) have fast dynamics, averaging
interactions such as dipolar and chemical-shift-anisotropy. A high temperature favors fast
dynamics, further averaging the interactions. The magnetic field environment has to be favorable;
sudden changes of magnetic field orientation in low magnetic fields can be detrimental, if the
change is non-adiabatic. Relaxation may be enhanced in low field if the hyperpolarized nuclear
spin is coupled to a quadrupolar nucleus or if paramagnetic impurities are present. After
16
dissolution, the relaxation induced by the paramagnetic agent used for DNP is typically
insignificant. This is the case for trityls, and therefore no removal of this radical is necessary.
However, nitroxides have higher relaxivity and are used in higher concentrations, and may
therefore have to be removed. Likewise, molecular oxygen is paramagnetic and will contribute
significantly to water proton relaxation.
For in vitro studies with fast transfer systems, nuclear spins with sub-second T1 has been
detected [64]. An automated injection system for in vivo studies was published in [65], where it is
demonstrated that the time from dissolution to injection can be reduced to 3 s. Recently, Shang et
al. suggested a handheld electromagnet carrier to conserve polarization in the dissolved sample by
placing it in a >50 G field [66], and others [67] have proposed a magnetic tunnel to prolong T1.
3.3 Hyperpolarized 13C Angiography and Perfusion
Hyperpolarization of nuclear spins is interesting for angiography and perfusion due to the
large magnetization, and hence signal, that can be created. The large signal can be exchanged for
high SNR images with high spatial and temporal resolution. 13C-labelled exogenous compounds are
favorable due to their long T1. In 2001, Golman and coworkers [68] demonstrated that 13C can be
hyperpolarized with the PHIP method and applied for MRA. A 13C polarization of 4% was obtained,
and angiographic imaging of the vena cava and its branching veins was demonstrated in the rat.
Svensson et al. [69] achieved 13C polarization of 15% of bis-1,1-(hydroxymethyl)-[1-
13C]cyclopropane-d8 (HP001) at time of injection using d-DNP, and acquired angiographies of the
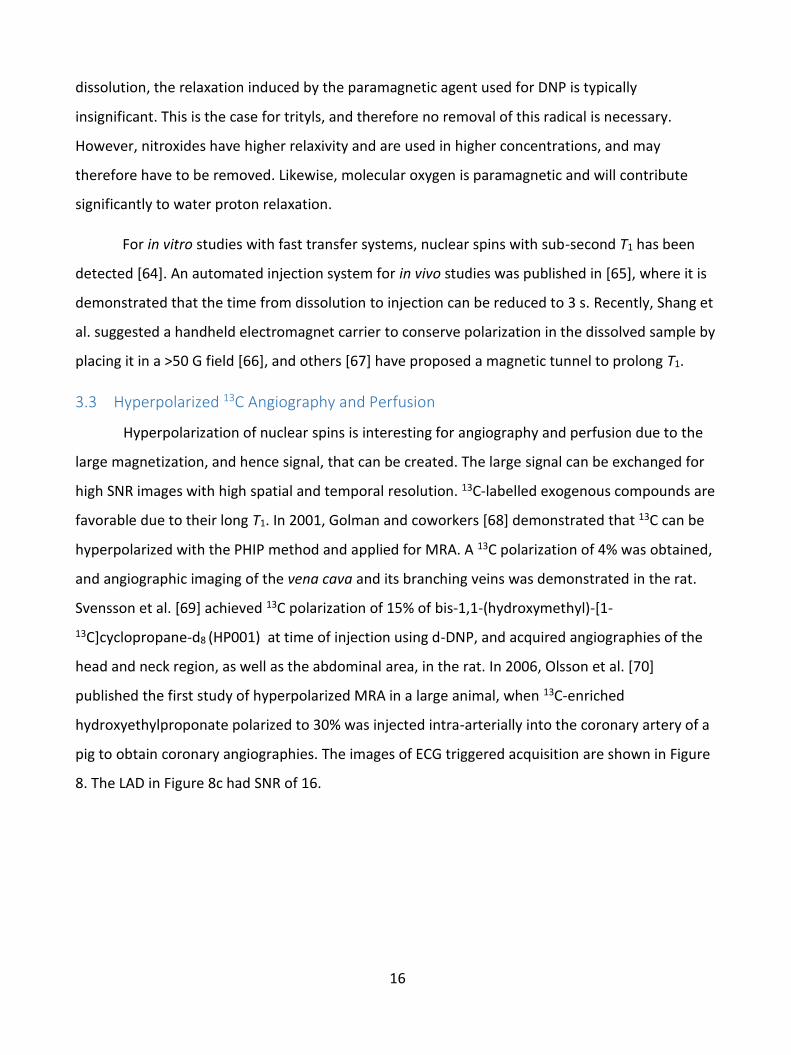
head and neck region, as well as the abdominal area, in the rat. In 2006, Olsson et al. [70]
published the first study of hyperpolarized MRA in a large animal, when 13C-enriched
hydroxyethylproponate polarized to 30% was injected intra-arterially into the coronary artery of a
pig to obtain coronary angiographies. The images of ECG triggered acquisition are shown in Figure
8. The LAD in Figure 8c had SNR of 16.
17
Figure 8: Hyperpolarized 13C angiogram of a pig heart with pixel size 1.5×1.5 mm2. Injection in left and right
coronary arteries. Images were acquired every heartbeat after ECG triggering with acquisition time of 422
ms. Arrows show artefacts, believed to be caused by intensity variation. Reprinted with permission from
[70].
In addition to angiography, hyperpolarized 13C compounds have been suggested as
perfusion markers. The method was first demonstrated for cerebral perfusion in rats [71,72], and
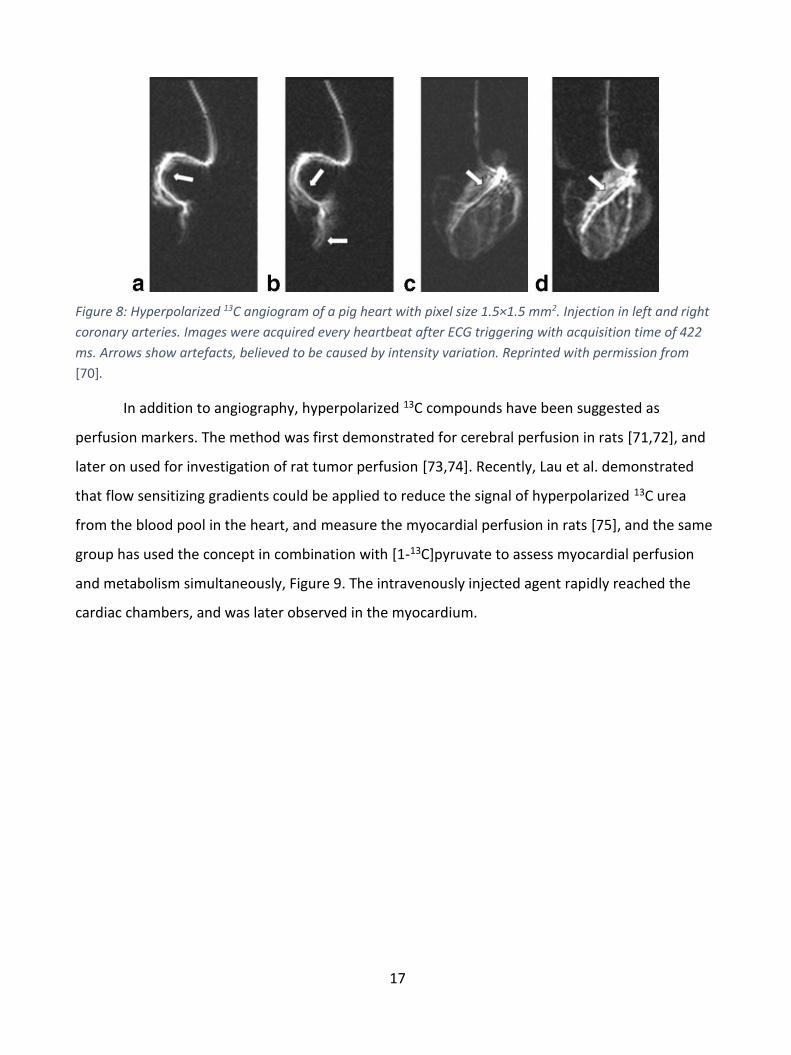
later on used for investigation of rat tumor perfusion [73,74]. Recently, Lau et al. demonstrated
that flow sensitizing gradients could be applied to reduce the signal of hyperpolarized 13C urea
from the blood pool in the heart, and measure the myocardial perfusion in rats [75], and the same
group has used the concept in combination with [1-13C]pyruvate to assess myocardial perfusion
and metabolism simultaneously, Figure 9. The intravenously injected agent rapidly reached the
cardiac chambers, and was later observed in the myocardium.
18
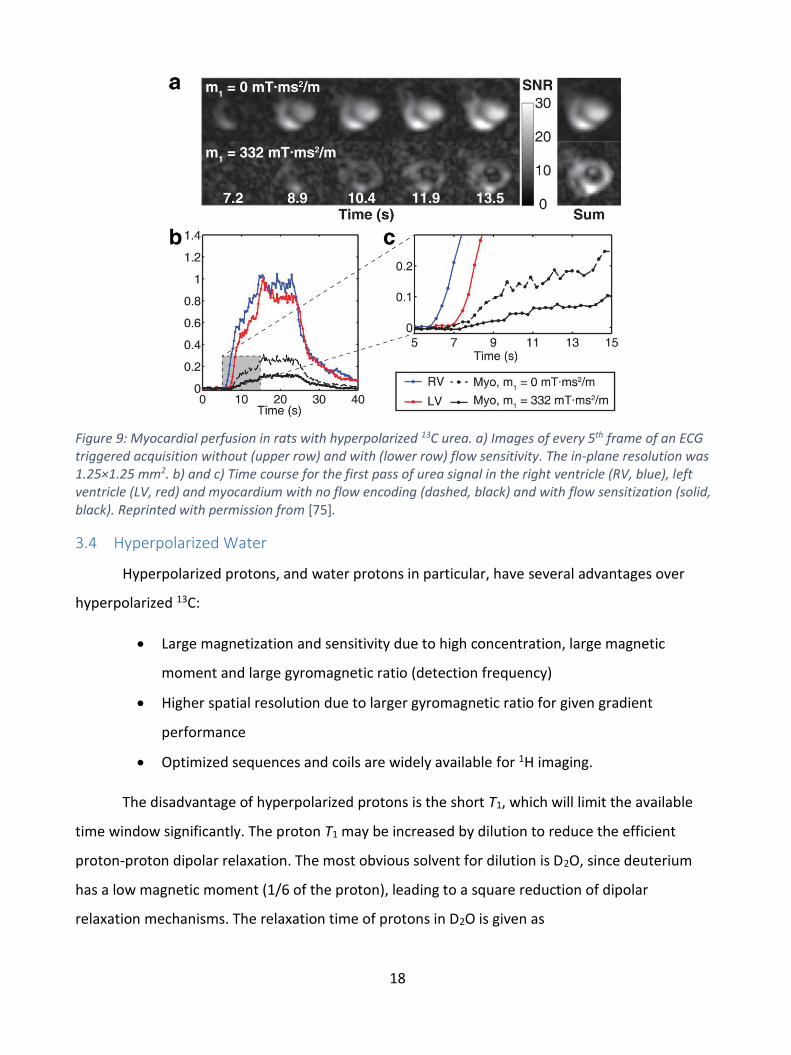
Figure 9: Myocardial perfusion in rats with hyperpolarized 13C urea. a) Images of every 5th frame of an ECG triggered acquisition without (upper row) and with (lower row) flow sensitivity. The in-plane resolution was 1.25×1.25 mm2. b) and c) Time course for the first pass of urea signal in the right ventricle (RV, blue), left ventricle (LV, red) and myocardium with no flow encoding (dashed, black) and with flow sensitization (solid, black). Reprinted with permission from [75].
3.4 Hyperpolarized Water
Hyperpolarized protons, and water protons in particular, have several advantages over
hyperpolarized 13C:
Large magnetization and sensitivity due to high concentration, large magnetic
moment and large gyromagnetic ratio (detection frequency)
Higher spatial resolution due to larger gyromagnetic ratio for given gradient
performance
Optimized sequences and coils are widely available for 1H imaging.
The disadvantage of hyperpolarized protons is the short T1, which will limit the available
time window significantly. The proton T1 may be increased by dilution to reduce the efficient
proton-proton dipolar relaxation. The most obvious solvent for dilution is D2O, since deuterium
has a low magnetic moment (1/6 of the proton), leading to a square reduction of dipolar
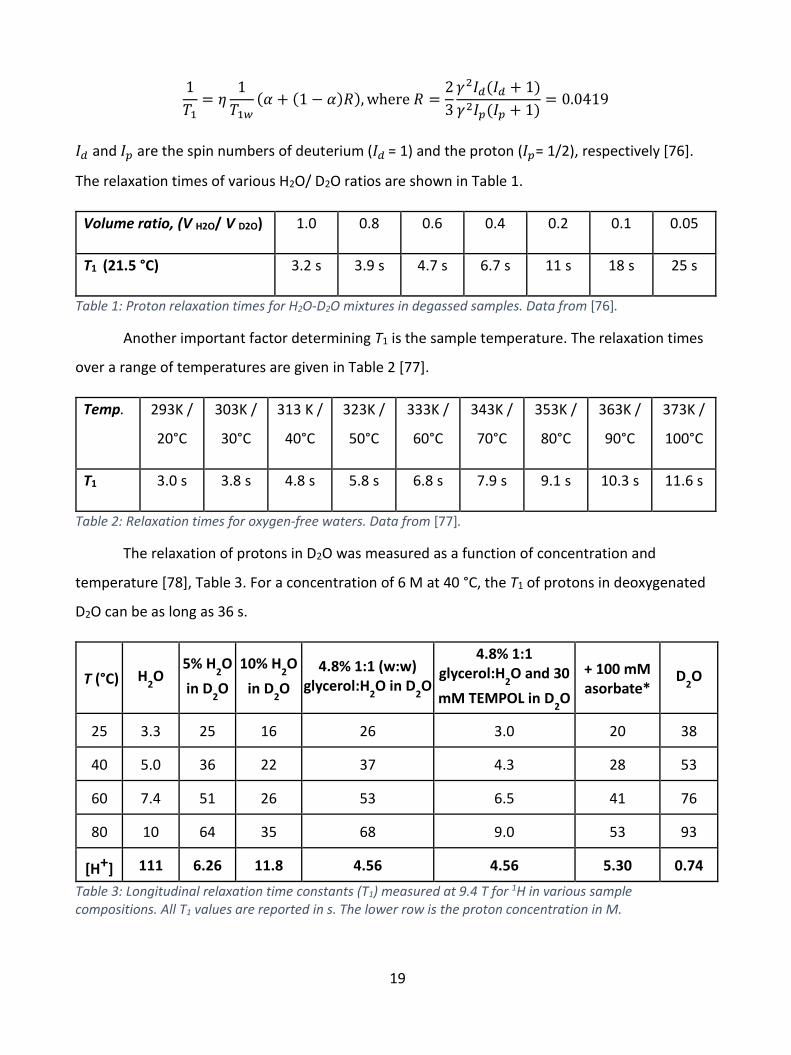
relaxation mechanisms. The relaxation time of protons in D2O is given as
19
1
𝑇1= 𝜂
1
𝑇1𝑤
(𝛼 + (1 − 𝛼)𝑅), where 𝑅 =2
3
𝛾2𝐼𝑑(𝐼𝑑 + 1)
𝛾2𝐼𝑝(𝐼𝑝 + 1)= 0.0419
𝐼𝑑 and 𝐼𝑝 are the spin numbers of deuterium (𝐼𝑑 = 1) and the proton (𝐼𝑝= 1/2), respectively [76].
The relaxation times of various H2O/ D2O ratios are shown in Table 1.
Volume ratio, (V H2O/ V D2O) 1.0 0.8 0.6 0.4 0.2 0.1 0.05
T1 (21.5 °C) 3.2 s 3.9 s 4.7 s 6.7 s 11 s 18 s 25 s
Table 1: Proton relaxation times for H2O-D2O mixtures in degassed samples. Data from [76].
Another important factor determining T1 is the sample temperature. The relaxation times
over a range of temperatures are given in Table 2 [77].
Temp. 293K /
20°C
303K /
30°C
313 K /
40°C
323K /
50°C
333K /
60°C
343K /
70°C
353K /
80°C
363K /
90°C
373K /
100°C
T1 3.0 s 3.8 s 4.8 s 5.8 s 6.8 s 7.9 s 9.1 s 10.3 s 11.6 s
Table 2: Relaxation times for oxygen-free waters. Data from [77].
The relaxation of protons in D2O was measured as a function of concentration and
temperature [78], Table 3. For a concentration of 6 M at 40 °C, the T1 of protons in deoxygenated
D2O can be as long as 36 s.
T (°C) H2O
5% H2O
in D2O
10% H2O
in D2O
4.8% 1:1 (w:w) glycerol:H
2O in D
2O
4.8% 1:1 glycerol:H
2O and 30
mM TEMPOL in D2O
+ 100 mM asorbate*
D2O
25 3.3 25 16 26 3.0 20 38
40 5.0 36 22 37 4.3 28 53
60 7.4 51 26 53 6.5 41 76
80 10 64 35 68 9.0 53 93
[H+] 111 6.26 11.8 4.56 4.56 5.30 0.74
Table 3: Longitudinal relaxation time constants (T1) measured at 9.4 T for 1H in various sample compositions. All T1 values are reported in s. The lower row is the proton concentration in M.
20
Dissolved molecular oxygen, O2, and the nitroxide radical are two dominant relaxation
sources. The relaxivity of dissolved molecular oxygen is given in [79] as RO2 = 0.0094 L/mg/s. At 25
°C, water dissolves 8.6 mg/L O2, and therefore removing 90% of the dissolved oxygen would bring
the relaxation rate contribution to 0.008 s-1. It is therefore not too demanding to eliminate this
contribution by thorough degassing of all solvents and containers. It should be noted that organic
solvents can have much higher solubility of molecular oxygen. Höfer et al. [80] provides a
relaxation rate contribution for a nitroxide radical of RNitroxide = 0.55 s-1mM-1 at 25 °C in low field.
To have minimal effect on T1, the relaxation rate contribution should be less than e.g. 0.02 s-1,
which means that the concentration of the nitroxide should be less than 40 µM. Several
techniques have been applied for minimizing the relaxation from the radical after dissolution. One
way is to quench the radical with ascorbic acid. The method has been demonstrated to be useful
[78,81], although polarization is lost during the quenching process, because the redox reaction is
relatively slow and requires high ascorbic acid concentration. In addition, the ascorbic acid is
unstable in the heated solutions, and browning can be observed. Furthermore, the method leaves
unwanted residues in the solution, which may be problematic for clinical application. Another
method is to filter out the nitroxide by using a cation such as amino-TEMPO, which can be
removed with ion exchange. However, few working systems have been demonstrated, and the
relaxation of water protons in the filter is unknown. Instead, the radical has been suggested
removed by extraction in an organic solvent [61,82]. This method has the advantage that the
organic solvent can be used to provide heat for dissolution of the sample, such that the dissolution
medium and hence dilution can be minimized.
With dilute water protons, a large initial magnetization can theoretically be achieved. Table
4 calculates the magnetization for three different situations. Relaxation factor is calculated from
the T1 and a transfer time of 15 s. A dilution factor estimates the dilution in the vasculature, for
intra-arterial or intravenous injection methods. The tissue water proton signal is taken as
reference, assuming a T1 and repetition time of 1 s. As example, and based on a target T1 of 20 s,
the magnetization of 5 M protons in D2O is 628 times larger than the tissue proton magnetization
at 3 T, if it is assumed that 20% polarization can be achieved. For a 13C-labelled molecule of 500
mM concentration and initial polarization of 50%, the magnetization is 79 times higher than the
tissue magnetization, but 8 times smaller than the hyperpolarized proton magnetization.
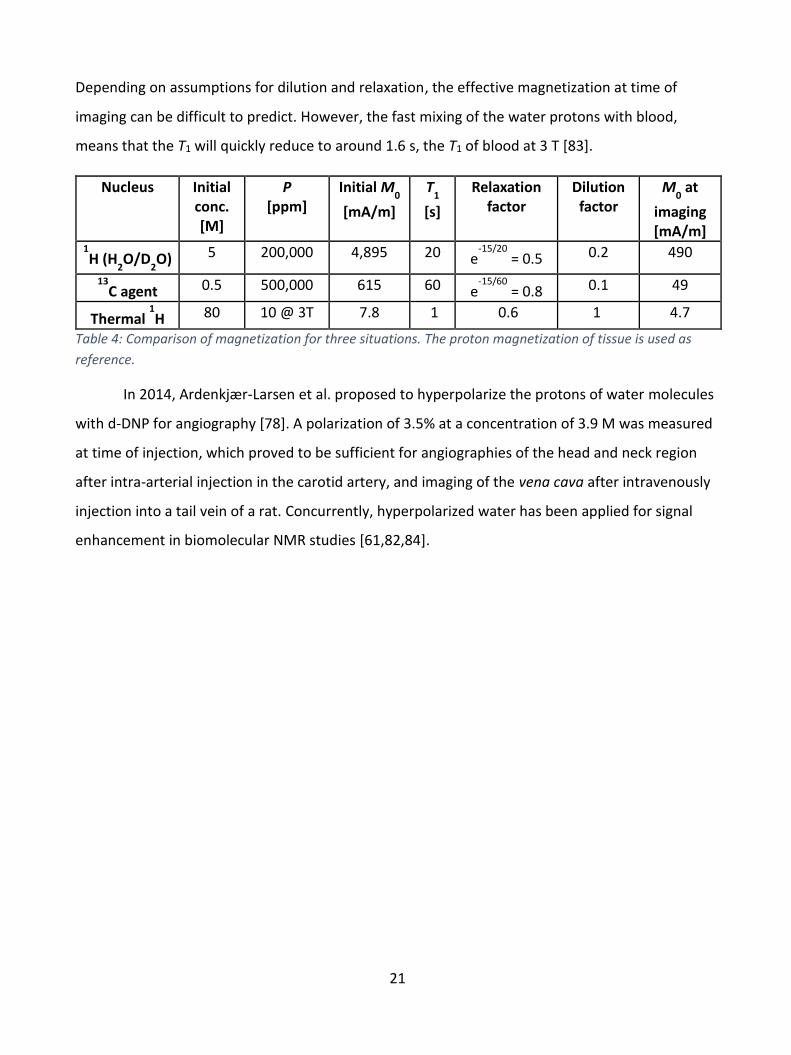
21
Depending on assumptions for dilution and relaxation, the effective magnetization at time of
imaging can be difficult to predict. However, the fast mixing of the water protons with blood,
means that the T1 will quickly reduce to around 1.6 s, the T1 of blood at 3 T [83].
Nucleus Initial conc. [M]
P [ppm]
Initial M0
[mA/m]
T1
[s]
Relaxation factor
Dilution factor
M0 at
imaging [mA/m]
1H (H
2O/D
2O) 5 200,000 4,895 20 e
-15/20 = 0.5 0.2 490
13C agent 0.5 500,000 615 60 e
-15/60 = 0.8 0.1 49
Thermal 1H 80 10 @ 3T 7.8 1 0.6 1 4.7
Table 4: Comparison of magnetization for three situations. The proton magnetization of tissue is used as
reference.
In 2014, Ardenkjær-Larsen et al. proposed to hyperpolarize the protons of water molecules
with d-DNP for angiography [78]. A polarization of 3.5% at a concentration of 3.9 M was measured
at time of injection, which proved to be sufficient for angiographies of the head and neck region
after intra-arterial injection in the carotid artery, and imaging of the vena cava after intravenously
injection into a tail vein of a rat. Concurrently, hyperpolarized water has been applied for signal
enhancement in biomolecular NMR studies [61,82,84].
22
4 Safety of the formulation and administration
The formulation that was developed in this thesis work, and used in pig experiments, was
approx. 5 M 1H in D2O with 9 g/L NaCl, 1 mM calcium disodium ethylenediaminetetraacetic acid
(EDTA), approx. 25 mM glycerol and trace amount of heptane. No formal safety studies have been
performed, but the formulation was well-tolerated in animal studies. The safety concerns with the
formulation are discussed only by principle.
The temperature of the formulation was close to body temperature at time of injection, i.e.
in the range 35-40 °C. The pH of the formulation was close to physiologic, but unbuffered. Only the
weak EDTA concentration provides a minimal buffering capacity. The formulation was adjusted to
isotonic with sodium chloride. On these parameters, the formulation was considered optimal and
safe. However, it may be that some further optimization of the composition of salts (Ca2+, Mg2+,
K+) in the formulation could be introduced similar to iodinated contrast agents [85].
The solubility of heptane in water is 0.0003% (v/v), or 3 ppm, at 25 °C (logP of 4.274). This
means that the pig could receive a dose of 45 nL (60 ng) when 15 mL of the formulation is given.
The acute oral toxicity of heptane has been determined to >5,000 mg/kg in rat [86]. This means
that a high, acute toxicity, safety margin should be present. However, local toxicity at point or
organ of injection is unclear and needs to be determined, as well as other long term side effects of
heptane. It is a general concern that, potentially, pure heptane could be injected into the animal, if
complete separation is not accomplished. Alternatively, an organic solvent with lower solubility
and/or better safety profile, may be applied for the extraction.
Deuterium oxide (D2O) is an inherent and major component of the formulation. Approx. 15
mL of D2O (3.3 g of deuterium) is given to a pig of 30 kg in the experiments performed as part of
this thesis. Deuterium accounts for 0.0156% of all hydrogen, or 0.0312% by mass. A 70 kg person
contains approx. 7 kg (10%) [87] of hydrogen and would thus have a natural level of deuterium of
2.2 g. The dose of deuterium given in these experiments are thus at the level of the endogenous
level. The injected deuterium will exchange with exchangeable protons in proteins and
metabolites as well as be incorporated in molecules by e.g. hydration reactions.
Experiments in mice, rats, and dogs have shown that a degree of 25% deuteration causes
(sometimes irreversible) sterility, because neither gametes nor zygotes can develop [88]. High

23
concentrations of heavy water (90%) rapidly kill fish, tadpoles, flatworms, and Drosophila.
Mammals (for example, rats) given heavy water to drink die after a week, at a time when their
body water approaches about 50% [89]. The mode of death appears to be the same as that in
cytotoxic poisoning (such as chemotherapy) or in acute radiation syndrome (though deuterium is
not radioactive), and is due to deuterium's action in generally inhibiting cell division. It is more
toxic to malignant cells than normal cells. As in chemotherapy, deuterium-poisoned mammals die
of a failure of bone marrow (bleeding and infection) and intestinal-barrier functions (diarrhea and
fluid loss). Oral doses of heavy water in the range of several grams, typically 0.2 g D2O per kg body
weight, as well as heavy oxygen, 18O, are routinely used in human metabolic experiments; the
double-labelled-water method [90]. It is known from this method that much of the deuterium will
be excreted with water by renal elimination.
Cardiac catheterization is a procedure to examine the function of the heart. A thin catheter
is inserted into a large blood vessel that leads to the heart. During the procedure, the pressure and
blood flow in the heart can be measured. Coronary angiography is done during cardiac
catheterization. A contrast dye visible in X-rays is injected through the catheter. X-ray images show
the dye as it flows through the heart arteries. This shows where arteries are blocked. The chances
that problems will develop during cardiac catheterization are low. A small number of people have
minor problems. Some develop bruises where the catheter had been inserted (puncture site).
Overall, arterial line placement is considered a safe procedure, with a rate of major complications
that is below 1% [91]. It is not entirely without risks, however, and it requires appropriate
knowledge of the anatomy and procedural skills. Arterial lines can be placed in multiple arteries,
including the radial, ulnar, brachial, axillary, posterior tibial, femoral, and dorsalis pedis arteries. In
1995, a total of approx. 1 million patients underwent cardiac catheterization in Europe alone [92].

24
5 Studies and Results
5.1 Study I: Dissolution Dynamic Nuclear Polarization capability study with fluid path
5.1.1 Introduction
The aim of this study was to develop a method for filling of the fluid path that allows reuse,
and to determine the capability of the fluid path system for d-DNP by validation of the
reproducibility of the produced sample properties.
Figure 10: Fluid path for d-DNP for research purposes. Dissolution medium is heated and pressurized in the syringe (right) before transfer through the inner concentric tube to the sample vial (right), and the dissolved sample is transferred back through the outer concentric tube, where an exit tube can be attached.
The fluid path was introduced in 2011 [93]. In contrast to the earlier vapor pressure driven
dissolution systems [94,95], the fluid path dissolution is driven by pressure driven piston in the
syringe. The primary purpose of the fluid path was to provide a sterile environment during
polarization and dissolution, and the technology is now being used in 20 SPINlab facilities
worldwide.
25
The fluid path exists in two different versions. One version, the fluid path for research
purposes, Figure 10, applies a ferrule union, and the sample vial and lower outer tube can thus be
replaced, to facilitate reuse of the rest of the fluid path. During initial testing, variation in the
dissolution time was observed. The union was believed to be the main source of variation,
because the manually tightened ferrule would manipulate the geometry of the outer concentric
tube, and thus hinder the flow. Even though a system using a torque wrench was established to
avoid this issue, the modification of the tube and irreproducible dissolution times were still
observed. The fluid path for research purposes has successfully been applied in numerous
hyperpolarization experiments. However, for hyperpolarization of water, the dissolution time is
crucial for obtaining high final polarization, because of the short relaxation time, the need for fast
dilution in D2O, and rapid radical extraction. Hence, the variation was unacceptable for these
studies. The fluid path for clinical purpose has no union. Instead, the concentric tubes are
uninterrupted from syringe to sample vial and back. The standard filling protocol implies one time
use of expensive, sometimes limited available fluid paths, where the sample is pipetted into the
sample vial before attaching the vial to the outer tube with a UV-curing adhesive.
In the method developed in this study, a filling tube is guided through the inner tube for
dispersion of the sample. By introduction of the method, fluid paths can be reused, which is a
large asset for labs using the system. In addition, the need for UV cured gluing is only needed for
the first time use of a fluid path.
The method was originally developed and optimized for hyperpolarization of water. Later
on, it was expanded to pyruvate hyperpolarization, to accommodate the general need in modern
d-DNP. The main difference between fluid path use for water and pyruvate is the need for
degassed solvents to minimize the T1 of water samples.
5.1.2 Methods
Fluid path system
A fluid path system was used for dissolution of samples polarized in a homebuilt and a
clinical polarizer. It was made up of two parts, as shown in Figure 11; Part A consisted of a syringe
for dissolution medium, concentric tubes leading the dissolution medium to the sample placed in a
vial and back to a valve in the syringe, and an exit tube leading the dissolved sample to a receiver.
26
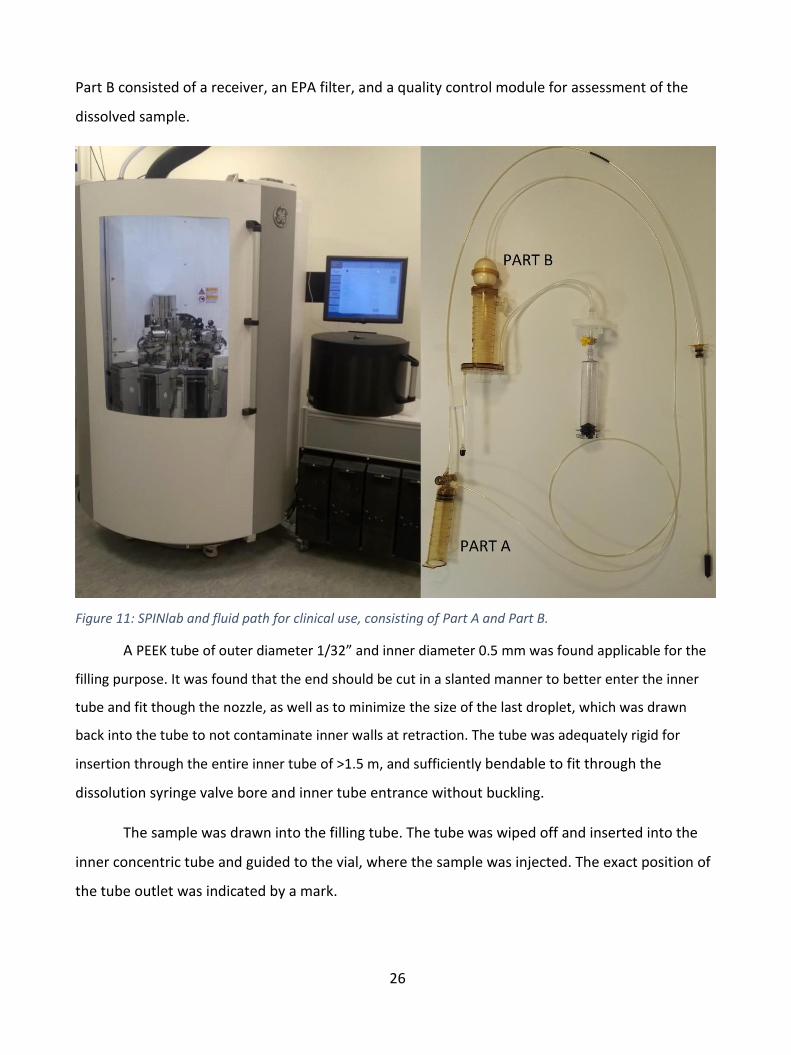
Part B consisted of a receiver, an EPA filter, and a quality control module for assessment of the
dissolved sample.
Figure 11: SPINlab and fluid path for clinical use, consisting of Part A and Part B.
A PEEK tube of outer diameter 1/32” and inner diameter 0.5 mm was found applicable for the
filling purpose. It was found that the end should be cut in a slanted manner to better enter the inner
tube and fit though the nozzle, as well as to minimize the size of the last droplet, which was drawn
back into the tube to not contaminate inner walls at retraction. The tube was adequately rigid for
insertion through the entire inner tube of >1.5 m, and sufficiently bendable to fit through the
dissolution syringe valve bore and inner tube entrance without buckling.
The sample was drawn into the filling tube. The tube was wiped off and inserted into the
inner concentric tube and guided to the vial, where the sample was injected. The exact position of
the tube outlet was indicated by a mark.
27
Large Samples
1.47 g µL [1-13C]pyruvic acid containing Electron Paramagnetic Agent (EPA, 15 mM
AH111501) was injected into the sample vial with the filling tube. 38.0 g ultra-pure water with 0.1
g/L EDTA was added to the dissolution syringe. 26.2 g ultra-pure water with 0.1 g/L EDTA and 15.0
g 0.72 M NaOH, 0.4 M TRIS base, 0.1 g/L EDTA were added to the receiver of the fluid path Part B.
The samples were polarized a clinical polarizer (SPINlab, GE Healthcare) operating at 5 T
and 0.85 K and dissolved in a fluid path Part A with an attached Part B receiver with EPA filter.
The quality control (QC) module measured 6 parameters of the dissolved sample in 15 s
without direct contact.
6.7 T Homebuilt Polarizer
The initial aim of Study 1 and Study II was to develop filling techniques and protocols for
hyperpolarized water. Hence, a 6.7 T magnet (Magnex, Oxford, UK) was adapted to facilitate the
fluid path technology, so that the methods could be transferred to SPINlab polarizers for
preclinical imaging. The magnet was modified with a flow-type variable temperature insert. A
microwave source provided 55 mW microwaves at 188.0±0.6 GHz. A heater-pressure module was
implemented for heating the dissolution medium and driving dissolution. A valve was
implemented to keep a pressure of 12 bar during heating, adequate to sustain the vapor pressure
of the heated solvents. At dissolution, the pressure was increased to 16 bar and the dissolution
medium syringe valve was opened. Solid-state NMR was performed with a saddle coil connected
to an NMR console. The operating temperature was 1.1-1.2 K. The dissolution process was
controlled by a LabVIEW program, and the various phases of polarizing, dissolution medium
heating, and dissolution process could be controlled individually.
Small Samples
40 µL [1-13C]pyruvic acid containing 15 mM AH111501 was injected into the sample vial
with the filling tube. The filling tube was connected to a helium gas source to flush remaining
sample into the vial. 13.3 g 0.2 M tris-hydroxymethyl aminomethane (TRIS base) with 0.1 g/L EDTA
and 138 µL NaOH (10 M) was added to the dissolution syringe.

28
The samples were polarized in the homebuilt polarizer for one hour. Liquid state NMR data
was acquired on a 9.4 T spectrometer. 13C polarization and relaxation time was measured with
excitations of α = 3⁰ every 2 s, starting approx. 10 s post dissolution. The thermal signal was
acquired by adding 15 µL Omniscan to reduce T1 to <1 s with 2000 averages of repetition delay 0.5
s and α = 3⁰.
5.1.3 Results
Two sample size were tested in the study.
1) A human dose for clinical studies of 1.47 g pyruvic acid/EPA was polarized and dissolved in
a clinical polarizer, aiming for 40 mL 250 mM pyruvate sample, reaching an average
polarization of 34.2%. Six quality control parameters were measured online on the SPINlab.
The relevant measures and standard deviations are shown in Table 5.
Average Standard deviation Relative STD (%) PA/EPA added (g)
1.47
0.02
1.4
DM in syringe (g) 38.0 0.1 0.2 DM in receiver (g) NM in receiver (g)
25.8 14.3
0.3 0.2
1.0 1.4
PA/NaOH mol ratio 1.6 0.002 0.2 Pyruvate conc. (mM) 246 19 7.7 pH 7.71 0.17 2.2 EPA conc. (µM) 1.17 0.28 24 Temperature (⁰C) 32.0 1.3 4.0 Volume (mL) >40 mL Polarization (%) 34.2 2.9 (n = 3)* 8.5
Table 5: Results from dissolutions with large sample filling (n = 11).
2) A smaller dose for small animal preclinical studies of 40 mg pyruvic acid/EPA was polarized
and dissolved in a homebuilt polarizer aiming for 5 mL 80 mM pyruvate sample, reaching
an average polarization of 43.7%.
Six quality control parameters were measured: Final pyruvate concentration, pH, EPA
concentration, temperature, output volume and polarization, Table 6. They all showed high
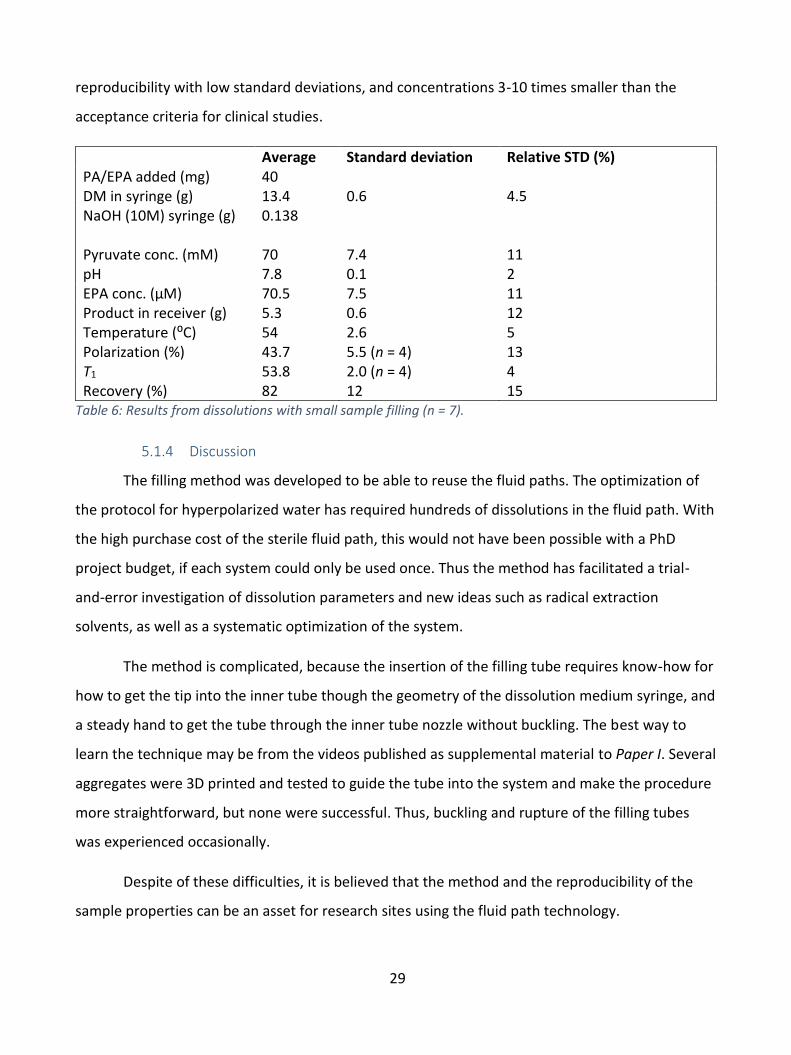
29
reproducibility with low standard deviations, and concentrations 3-10 times smaller than the
acceptance criteria for clinical studies.
Average Standard deviation Relative STD (%) PA/EPA added (mg) 40 DM in syringe (g) 13.4 0.6 4.5 NaOH (10M) syringe (g) 0.138 Pyruvate conc. (mM)
70
7.4
11
pH 7.8 0.1 2 EPA conc. (µM) 70.5 7.5 11 Product in receiver (g) 5.3 0.6 12 Temperature (⁰C) 54 2.6 5 Polarization (%) 43.7 5.5 (n = 4) 13 T1 53.8 2.0 (n = 4) 4 Recovery (%) 82 12 15
Table 6: Results from dissolutions with small sample filling (n = 7).
5.1.4 Discussion
The filling method was developed to be able to reuse the fluid paths. The optimization of
the protocol for hyperpolarized water has required hundreds of dissolutions in the fluid path. With
the high purchase cost of the sterile fluid path, this would not have been possible with a PhD
project budget, if each system could only be used once. Thus the method has facilitated a trial-
and-error investigation of dissolution parameters and new ideas such as radical extraction
solvents, as well as a systematic optimization of the system.
The method is complicated, because the insertion of the filling tube requires know-how for
how to get the tip into the inner tube though the geometry of the dissolution medium syringe, and
a steady hand to get the tube through the inner tube nozzle without buckling. The best way to
learn the technique may be from the videos published as supplemental material to Paper I. Several
aggregates were 3D printed and tested to guide the tube into the system and make the procedure
more straightforward, but none were successful. Thus, buckling and rupture of the filling tubes
was experienced occasionally.
Despite of these difficulties, it is believed that the method and the reproducibility of the
sample properties can be an asset for research sites using the fluid path technology.

30
5.1.5 Conclusion
A novel fluid path filling method has been developed. The method facilitates reproducible
polarization and low variance in the quality control parameters. In addition, the method allows
multiple reuses of the fluid path, and potentially saves preparation time, because the UV cured
gluing or laser welding process is only needed for first time usage.

31
5.2 Study II: Large dose hyperpolarized water with dissolution-DNP at high magnetic field
5.2.1 Introduction
The aim of this study was to develop a protocol for production of hyperpolarized water
samples of volumes suitable for large animal experiments, and to optimize polarization, relaxation
time and radical removal.
The end goal is to deliver a safe sample of highest possible polarization at time of injection
into the animal. The latter requires a high solid-state polarization, efficient dissolution with
minimal polarization loss, and long relaxation time to conserve polarization during the transfer
and injection. The fluid path system described in Study I is applied to be able to use the method in
clinical setups with SPINlab facilities.
Dipolar relaxation is the main source of relaxation in the sample. Pure water has a T1 of 3.2
s, due to the dipolar relaxation between neighboring protons. The polarized sample is therefore
dissolved in D2O. Due to its smaller magnetic moment, which enters quadratically in the relaxation
process, a deuteron should be about ten times less effective for the relaxation of neighboring
protons than another proton [76]. The relaxation times of various H2O/ D2O ratios were shown in
Table 1. Determination of the proton concentration in the dissolved sample is a balance between
achieving long relaxation time, while keeping the protons concentrated to get the highest possible
signal. A sample size of 1 mL sample was determined to achieve sample sizes suited for large
animal experiments. In order to secure a uniform radical distribution in the sample, half of the
sample volume was substituted for glycerol. By dissolution in 16 mL D2O dissolution medium, the
final H2O volume fraction is 0.031. Thus, the relaxation from neighboring protons alone will give a
T1 of more than 25 s, which is acceptable.
The radical is another contributor to relaxation. In the low magnetic field, the sample is
exposed to during the transfer and injection time, nitroxide relaxation rate contribution of RNitroxide
= 0.55 s-1mM-1 at 25 °C has been reported [80]. For the 1 mL 30 mM TEMPO sample dissolved in 16
mL dissolution medium, the radical would result in a T1 of less than 1 s, if not removed. Several
techniques has been discussed earlier to minimize relaxation from the radical. Quenching of the
radical by ascorbic acid has been successfully applied in other studies [78,81], but the process
takes time and leaves unwanted products in the final sample. Filtration of the radical is another

32
solution, but few working systems have been demonstrated, and the relaxation mechanisms in the
filtering process are unknown. Therefore, the radical was extracted in an organic phase.
The relaxation contribution from the oxygen in the system originating from air in the fluid
path and dissolved in the solvents contributes to the relaxation rate with 0.0094 L/mg/s [79]. The
concentration of dissolved oxygen in air saturated water at 25 °C is around 8.6 mg/L, which leads
to a relaxation rate contribution of 0.081 s-1. The corresponding oxygen concentrations in the
organic solvents used for extraction, heptane and NFBME, are a factor of 10 and 20 higher,
respectively [96,97]. The dissolution medium and the extraction solvent were therefore degassed
before use. The dissolved sample relaxation from the oxygen originating from the 1 mL sample is
negligible. However, the oxygen can affect the DNP, and was therefore investigated by comparing
degassed and non-degassed samples.
5.2.2 Methods
The standard water sample consisted of 30 mM TEMPO (2,2,6,6-Tetramethylpiperidine 1-
oxyl) in H2O/glycerol 1:1 (w/w). In addition, corresponding 20 mM TEMPO in water/glycerol and
30 mM TEMPO in H2O/dimethyl sulfoxide-d6 (DMSO-d6) 1:1 (w/w), were prepared. 1100 mg
sample (~1 mL) was filled in the sample vial as described for Study I. The dissolution medium
syringe was filled with 7.60 g (5 mL) nonafluorobutyl methyl ether (NFBME) and 17.72 g (16 mL)
dissolution medium, consisting of D2O with 1 mM calcium disodium ethylenediaminetetraacetic
acid (EDTA) and 9 g/L NaCl. The solvents were degassed in the syringe by bubbling with helium gas
for 10 minutes through an adapter, leading the wet vapor away from the inner tube to prevent ice
blockage when cooled in the magnet.
Figure 12: The two isomers of nonafluorobutyl methyl ether, used to accelerate dissolution and extraction
process.
Samples to be degassed with the freeze-pump-thaw method were exposed to 3 cycles of
freezing, vacuum and melting. The fluid path was sealed off to prevent condensation of moist air,
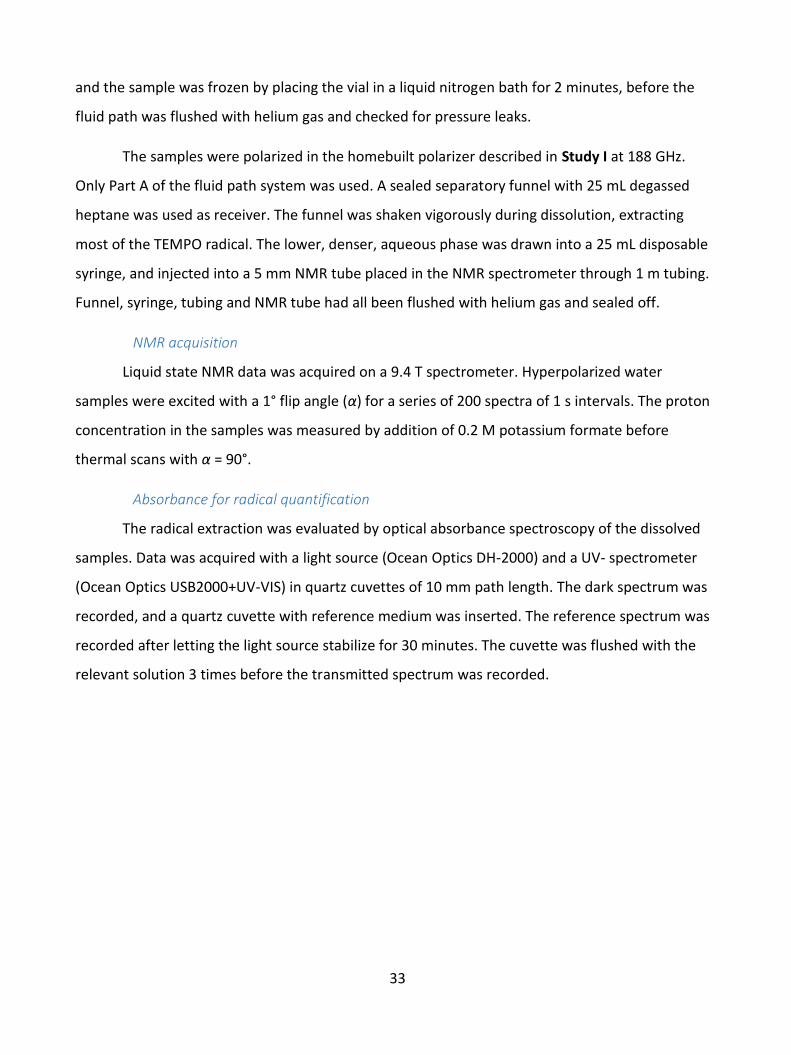
33
and the sample was frozen by placing the vial in a liquid nitrogen bath for 2 minutes, before the
fluid path was flushed with helium gas and checked for pressure leaks.
The samples were polarized in the homebuilt polarizer described in Study I at 188 GHz.
Only Part A of the fluid path system was used. A sealed separatory funnel with 25 mL degassed
heptane was used as receiver. The funnel was shaken vigorously during dissolution, extracting
most of the TEMPO radical. The lower, denser, aqueous phase was drawn into a 25 mL disposable
syringe, and injected into a 5 mm NMR tube placed in the NMR spectrometer through 1 m tubing.
Funnel, syringe, tubing and NMR tube had all been flushed with helium gas and sealed off.
NMR acquisition
Liquid state NMR data was acquired on a 9.4 T spectrometer. Hyperpolarized water
samples were excited with a 1° flip angle (α) for a series of 200 spectra of 1 s intervals. The proton
concentration in the samples was measured by addition of 0.2 M potassium formate before
thermal scans with α = 90°.
Absorbance for radical quantification
The radical extraction was evaluated by optical absorbance spectroscopy of the dissolved
samples. Data was acquired with a light source (Ocean Optics DH-2000) and a UV- spectrometer
(Ocean Optics USB2000+UV-VIS) in quartz cuvettes of 10 mm path length. The dark spectrum was
recorded, and a quartz cuvette with reference medium was inserted. The reference spectrum was
recorded after letting the light source stabilize for 30 minutes. The cuvette was flushed with the
relevant solution 3 times before the transmitted spectrum was recorded.
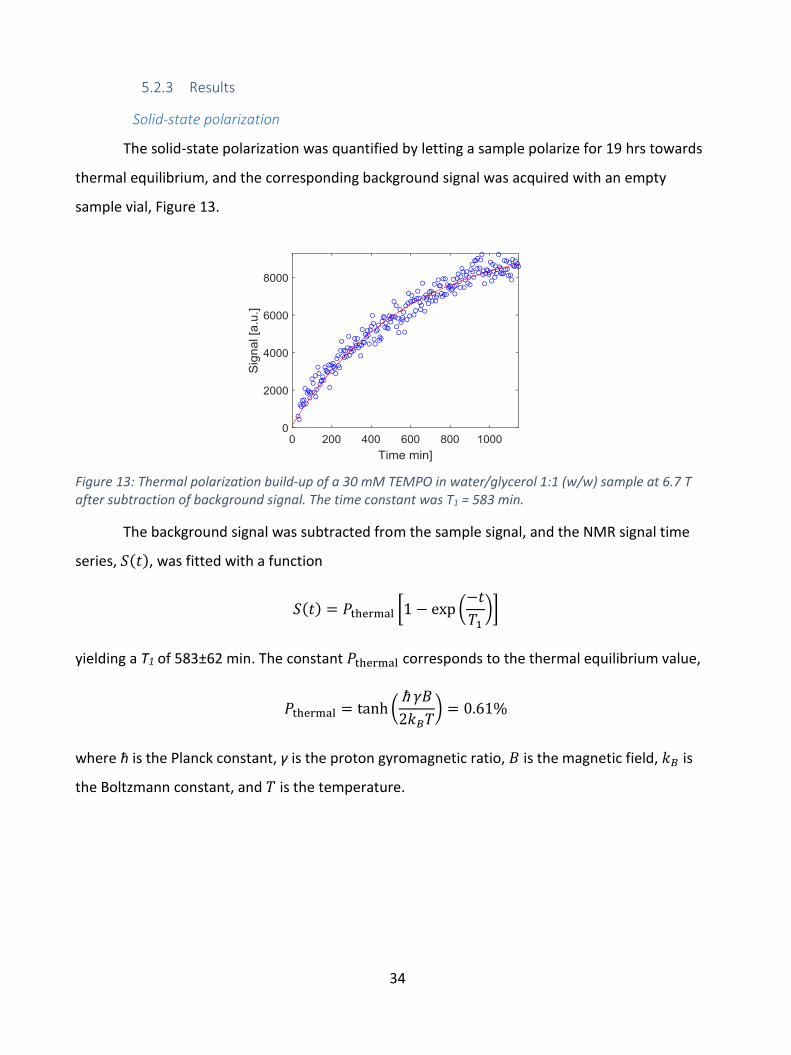
34
5.2.3 Results
Solid-state polarization
The solid-state polarization was quantified by letting a sample polarize for 19 hrs towards
thermal equilibrium, and the corresponding background signal was acquired with an empty
sample vial, Figure 13.
Figure 13: Thermal polarization build-up of a 30 mM TEMPO in water/glycerol 1:1 (w/w) sample at 6.7 T after subtraction of background signal. The time constant was T1 = 583 min.
The background signal was subtracted from the sample signal, and the NMR signal time
series, 𝑆(𝑡), was fitted with a function
𝑆(𝑡) = 𝑃thermal [1 − exp (−𝑡
𝑇1)]
yielding a T1 of 583±62 min. The constant 𝑃thermal corresponds to the thermal equilibrium value,
𝑃thermal = tanh (ħ 𝛾𝐵
2𝑘𝐵𝑇) = 0.61%
where ħ is the Planck constant, γ is the proton gyromagnetic ratio, 𝐵 is the magnetic field, 𝑘𝐵 is
the Boltzmann constant, and 𝑇 is the temperature.
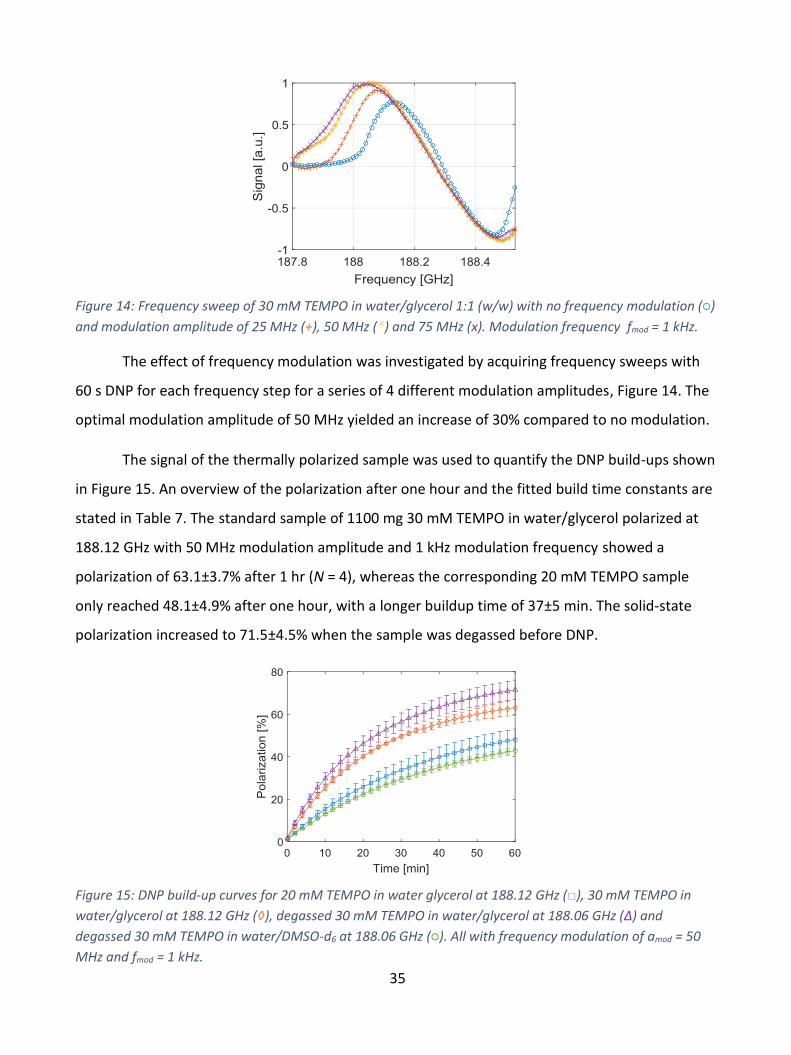
35
Figure 14: Frequency sweep of 30 mM TEMPO in water/glycerol 1:1 (w/w) with no frequency modulation (○)
and modulation amplitude of 25 MHz (+), 50 MHz (*) and 75 MHz (x). Modulation frequency fmod = 1 kHz.
The effect of frequency modulation was investigated by acquiring frequency sweeps with
60 s DNP for each frequency step for a series of 4 different modulation amplitudes, Figure 14. The
optimal modulation amplitude of 50 MHz yielded an increase of 30% compared to no modulation.
The signal of the thermally polarized sample was used to quantify the DNP build-ups shown
in Figure 15. An overview of the polarization after one hour and the fitted build time constants are
stated in Table 7. The standard sample of 1100 mg 30 mM TEMPO in water/glycerol polarized at
188.12 GHz with 50 MHz modulation amplitude and 1 kHz modulation frequency showed a
polarization of 63.1±3.7% after 1 hr (N = 4), whereas the corresponding 20 mM TEMPO sample
only reached 48.1±4.9% after one hour, with a longer buildup time of 37±5 min. The solid-state
polarization increased to 71.5±4.5% when the sample was degassed before DNP.
Figure 15: DNP build-up curves for 20 mM TEMPO in water glycerol at 188.12 GHz (□), 30 mM TEMPO in
water/glycerol at 188.12 GHz (◊), degassed 30 mM TEMPO in water/glycerol at 188.06 GHz (Δ) and
degassed 30 mM TEMPO in water/DMSO-d6 at 188.06 GHz (○). All with frequency modulation of amod = 50
MHz and fmod = 1 kHz.

36
Experiment N P(1 hr) [%] DNP time const.
20 mM TEMPO in water/glycerol 6 48.1 ± 4.9 37 ± 5 min
30 mM TEMPO in water/glycerol 4 63.1 ± 3.7 24 ± 4 min
Degassed 30 mM TEMPO in water/glycerol 5 71.5 ± 4.5 23 ± 2 min
Degassed 30 mM TEMPO in water/DMSO-d6 3 42.8 ± 1.7 41 ± 2 min
Table 7: DNP results for various sample compositions and polarization parameters.
Liquid state polarization
The dissolution resulted in 16±1 mL (N = 8) hyperpolarized water with a temperature of
50±2 °C (N = 6). The free induction decay (FID) of the first hyperpolarized signal decays rapidly due
to radiation damping (Figure 16a). The time constant of the FID fit was 0.25 ms, implying a
linewidth of more than 1200 Hz due to radiation damping. The integral of each acquisition is
shown in Figure 16b. The polarization was measured by comparing the first signal to the thermal
signal. On average, the standard experiments of 30 mM TEMPO in water/glycerol 1:1 (w/w)
showed a polarization of 7.8±3.3 %, and the data were fitted to a T1 of 17.0±0.9 s (N = 6). A
validation experiment where the fully relaxed sample was introduced into the 9.4 T magnet 5 min
later, yielded consistent T1 of 16.6 s, Figure 16b.
The results of the dissolutions are shown in Table 8.
a) b)
Figure 16: a) FID of first hyperpolarized signal fitted with a decaying exponential function b) Normalized NMR signal of hyperpolarized 30 mM TEMPO in water/glycerol 1:1 (w/w) sample (○) and build-up of relaxed sample at 9.4 T to validate T1 (□). The signal from the first point was 3761 times that at thermal equilibrium. The time constant for hyperpolarized relaxation was 17.0 s, whereas the validation measurement of thermal build-up was T1 = 16.6 s.
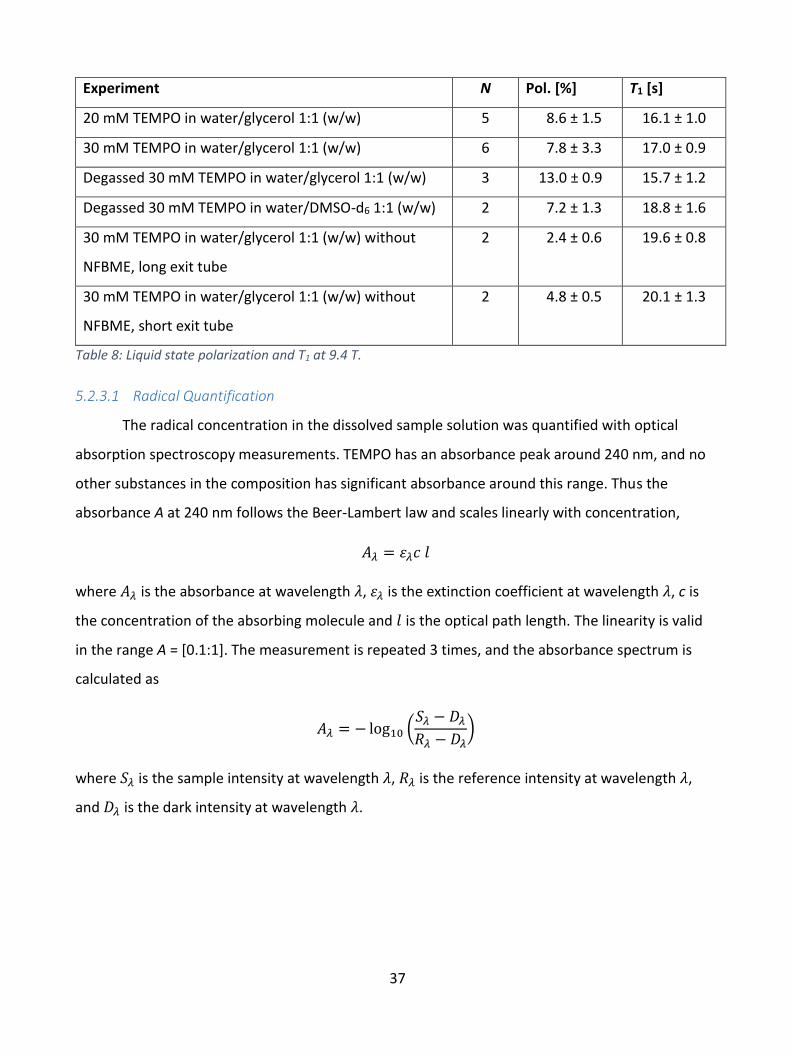
37
Experiment N Pol. [%] T1 [s]
20 mM TEMPO in water/glycerol 1:1 (w/w) 5 8.6 ± 1.5 16.1 ± 1.0
30 mM TEMPO in water/glycerol 1:1 (w/w) 6 7.8 ± 3.3 17.0 ± 0.9
Degassed 30 mM TEMPO in water/glycerol 1:1 (w/w) 3 13.0 ± 0.9 15.7 ± 1.2
Degassed 30 mM TEMPO in water/DMSO-d6 1:1 (w/w) 2 7.2 ± 1.3 18.8 ± 1.6
30 mM TEMPO in water/glycerol 1:1 (w/w) without
NFBME, long exit tube
2 2.4 ± 0.6 19.6 ± 0.8
30 mM TEMPO in water/glycerol 1:1 (w/w) without
NFBME, short exit tube
2 4.8 ± 0.5 20.1 ± 1.3
Table 8: Liquid state polarization and T1 at 9.4 T.
5.2.3.1 Radical Quantification
The radical concentration in the dissolved sample solution was quantified with optical
absorption spectroscopy measurements. TEMPO has an absorbance peak around 240 nm, and no
other substances in the composition has significant absorbance around this range. Thus the
absorbance A at 240 nm follows the Beer-Lambert law and scales linearly with concentration,
𝐴𝜆 = 𝜀𝜆𝑐 𝑙
where 𝐴𝜆 is the absorbance at wavelength 𝜆, 𝜀𝜆 is the extinction coefficient at wavelength 𝜆, c is
the concentration of the absorbing molecule and 𝑙 is the optical path length. The linearity is valid
in the range A = [0.1:1]. The measurement is repeated 3 times, and the absorbance spectrum is
calculated as
𝐴𝜆 = − log10 (𝑆𝜆 − 𝐷𝜆
𝑅𝜆 − 𝐷𝜆)
where 𝑆𝜆 is the sample intensity at wavelength 𝜆, 𝑅𝜆 is the reference intensity at wavelength 𝜆,
and 𝐷𝜆 is the dark intensity at wavelength 𝜆.
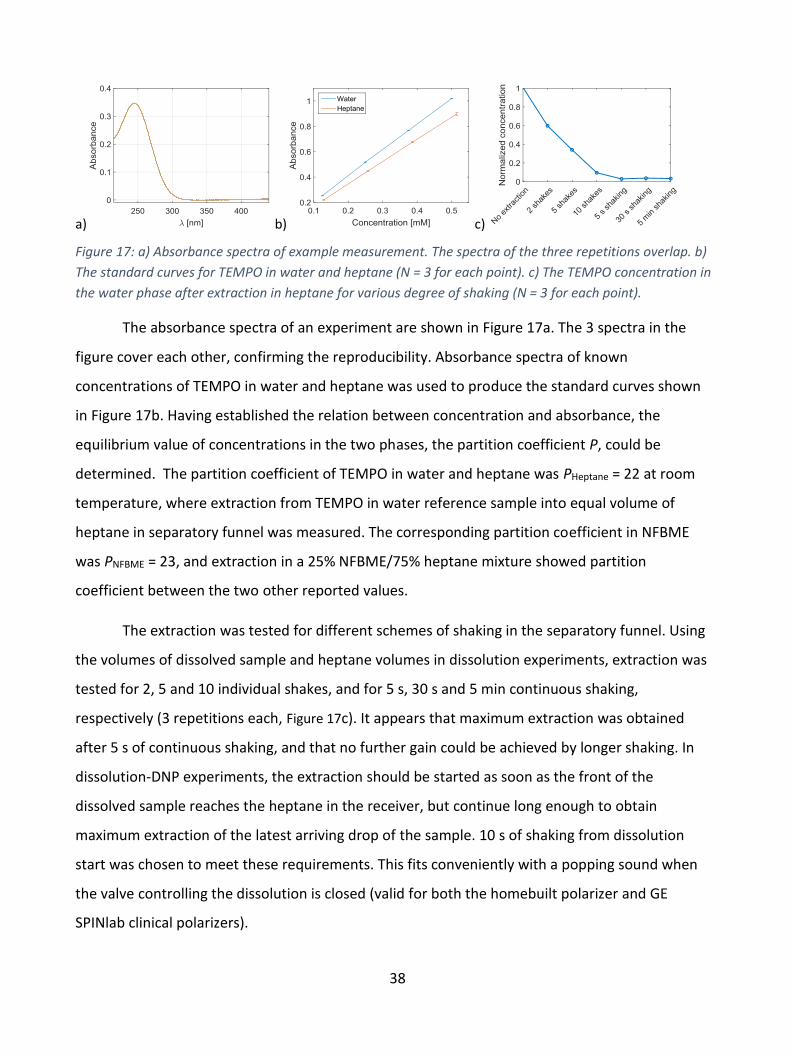
38
a) b) c)
Figure 17: a) Absorbance spectra of example measurement. The spectra of the three repetitions overlap. b)
The standard curves for TEMPO in water and heptane (N = 3 for each point). c) The TEMPO concentration in
the water phase after extraction in heptane for various degree of shaking (N = 3 for each point).
The absorbance spectra of an experiment are shown in Figure 17a. The 3 spectra in the
figure cover each other, confirming the reproducibility. Absorbance spectra of known
concentrations of TEMPO in water and heptane was used to produce the standard curves shown
in Figure 17b. Having established the relation between concentration and absorbance, the
equilibrium value of concentrations in the two phases, the partition coefficient P, could be
determined. The partition coefficient of TEMPO in water and heptane was PHeptane = 22 at room
temperature, where extraction from TEMPO in water reference sample into equal volume of
heptane in separatory funnel was measured. The corresponding partition coefficient in NFBME
was PNFBME = 23, and extraction in a 25% NFBME/75% heptane mixture showed partition
coefficient between the two other reported values.
The extraction was tested for different schemes of shaking in the separatory funnel. Using
the volumes of dissolved sample and heptane volumes in dissolution experiments, extraction was
tested for 2, 5 and 10 individual shakes, and for 5 s, 30 s and 5 min continuous shaking,
respectively (3 repetitions each, Figure 17c). It appears that maximum extraction was obtained
after 5 s of continuous shaking, and that no further gain could be achieved by longer shaking. In
dissolution-DNP experiments, the extraction should be started as soon as the front of the
dissolved sample reaches the heptane in the receiver, but continue long enough to obtain
maximum extraction of the latest arriving drop of the sample. 10 s of shaking from dissolution
start was chosen to meet these requirements. This fits conveniently with a popping sound when
the valve controlling the dissolution is closed (valid for both the homebuilt polarizer and GE
SPINlab clinical polarizers).
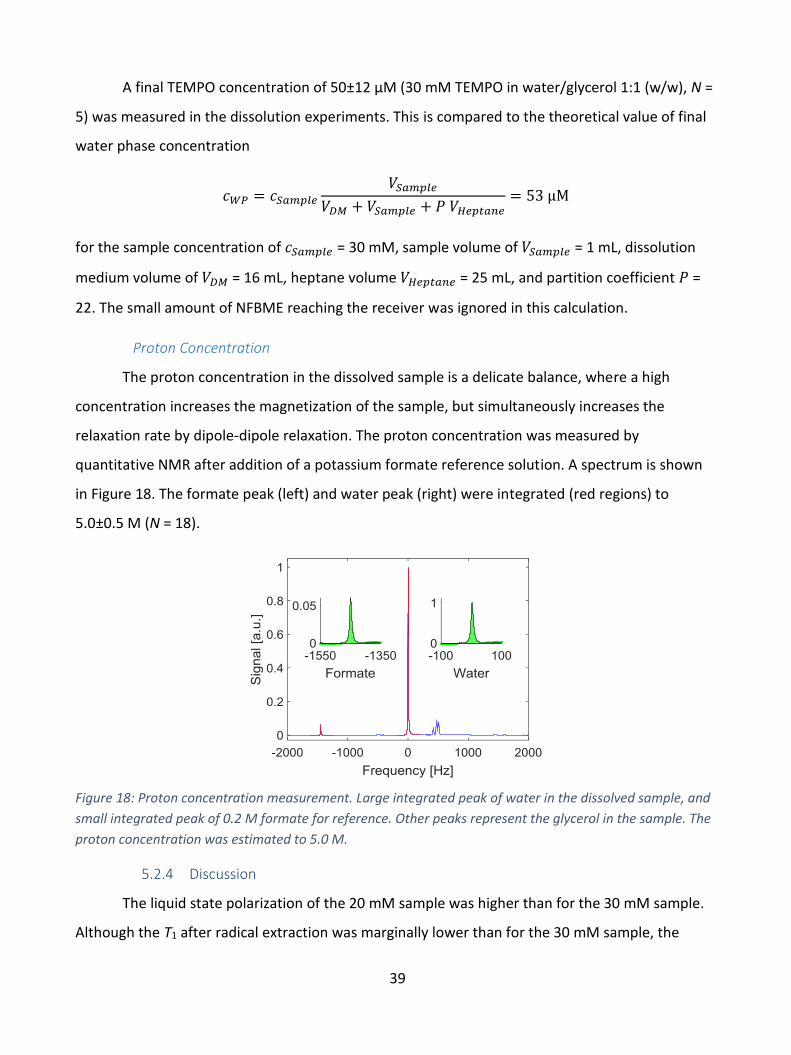
39
A final TEMPO concentration of 50±12 µM (30 mM TEMPO in water/glycerol 1:1 (w/w), N =
5) was measured in the dissolution experiments. This is compared to the theoretical value of final
water phase concentration
𝑐𝑊𝑃 = 𝑐𝑆𝑎𝑚𝑝𝑙𝑒
𝑉𝑆𝑎𝑚𝑝𝑙𝑒
𝑉𝐷𝑀 + 𝑉𝑆𝑎𝑚𝑝𝑙𝑒 + 𝑃 𝑉𝐻𝑒𝑝𝑡𝑎𝑛𝑒= 53 µM
for the sample concentration of 𝑐𝑆𝑎𝑚𝑝𝑙𝑒 = 30 mM, sample volume of 𝑉𝑆𝑎𝑚𝑝𝑙𝑒 = 1 mL, dissolution
medium volume of 𝑉𝐷𝑀 = 16 mL, heptane volume 𝑉𝐻𝑒𝑝𝑡𝑎𝑛𝑒 = 25 mL, and partition coefficient 𝑃 =
22. The small amount of NFBME reaching the receiver was ignored in this calculation.
Proton Concentration
The proton concentration in the dissolved sample is a delicate balance, where a high
concentration increases the magnetization of the sample, but simultaneously increases the
relaxation rate by dipole-dipole relaxation. The proton concentration was measured by
quantitative NMR after addition of a potassium formate reference solution. A spectrum is shown
in Figure 18. The formate peak (left) and water peak (right) were integrated (red regions) to
5.0±0.5 M (N = 18).
Figure 18: Proton concentration measurement. Large integrated peak of water in the dissolved sample, and
small integrated peak of 0.2 M formate for reference. Other peaks represent the glycerol in the sample. The
proton concentration was estimated to 5.0 M.
5.2.4 Discussion
The liquid state polarization of the 20 mM sample was higher than for the 30 mM sample.
Although the T1 after radical extraction was marginally lower than for the 30 mM sample, the
40
relaxation in the important time window of 1-2 s from dissolution of the sample to extraction of
the radical could be the explanation. Yet, it should be noted that the differences in polarization
and T1 are within the uncertainty range of the measurements, where only five 20 mM sample
dissolutions and six 30 mM sample dissolutions were conducted.
The NFBME was added to accelerate the dissolution process, so that the time from sample
melting to dilution and radical extraction was shortened, and the relaxation was reduced. The
volume of NFBME was tested with volumes of 5, 8 and 11 mL, where the lower volume yielded the
most controlled and efficient dissolution, and highest polarization in the liquid state. The effect of
the NFBME was examined by replacing it with additional dissolution medium. The polarization of
the dissolved sample decreased to 4.8±0.5%. The main drawback of using NFBME is the weakening
of the otherwise chemically stable polyphenylsulphone, which the fluid path is made of. Extended
heating time with fluid path exposure to NFBME during polarization was observed to cause
bursting dissolution medium syringes in several occasions. Other nonpolar solvents were tested to
replace the NFBME. 1-Octanol stressed the syringes even more than NFBME and was discarded.
Another fluorinated, organic solvent (3M™ Novec™ HFE-7500 Engineered fluid) with boiling point
of 130 °C and density similar to NFBME (ρ = 1.559 g/mL) yielded a decrease of 35% in the observed
polarization in dissolved state in comparison, indicating that the driving force of the superheated
NFBME is important for quick extraction of the radical (identical solvent volumes and parameters,
3 repetitions each).
It was determined that the final radical concentration of 50 µM matched the theoretical
value for the given solvent volumes in equilibrium. Hence, the 10 s shaking may be more than
needed, and a few seconds may be saved without affecting the relaxation time. As the maximum
possible radical extraction has been achieved with the applied shaking scheme, further extraction
would require increased heptane volume. In this case, heated heptane would be required to
conserve a high sample temperature for relaxation considerations.
An important feature for the final sample polarization is the length of the exit tubing. The
standard exit tubes are longer than 2 m to fit the clinical polarizers and reach the QC module. For
hyperpolarized 13C compounds with long T1, the long exit tube transfer time is not a problem.
However, for hyperpolarized water with short T1 and need for rapid dilution and radical extraction,

41
the transfer time of the concentrated, radical containing sample is crucial, and the cooling of long
tubes should be minimized. The experiments showed that the final polarization was halved for
standard exit tubes, compared to 50 cm exit tubes.
5.2.5 Conclusions
The method succeeded in producing large volumes, 16 mL, of hyperpolarized water
suitable for large animal experiments. The sample was polarized to 71.5% for the most efficient
sample composition and optimized frequency modulation. The liquid state polarization was 13.0%,
indicating that most polarization is lost during dissolution. This is unavoidable, but the dissolution
and radical extraction may be further optimized to provide injectable samples of higher
polarization.
A standard deviation of more than 40% in liquid state polarization was experienced for
some experiments. The dissolution in a two-phase system of D2O and organic solvents yielded
rapid radical extraction of 97.2%±0.7%, but the manual shaking may be the main contributor to
the irreproducibility. Thus, an automated extraction scheme or a radical filtering system may be
beneficial.
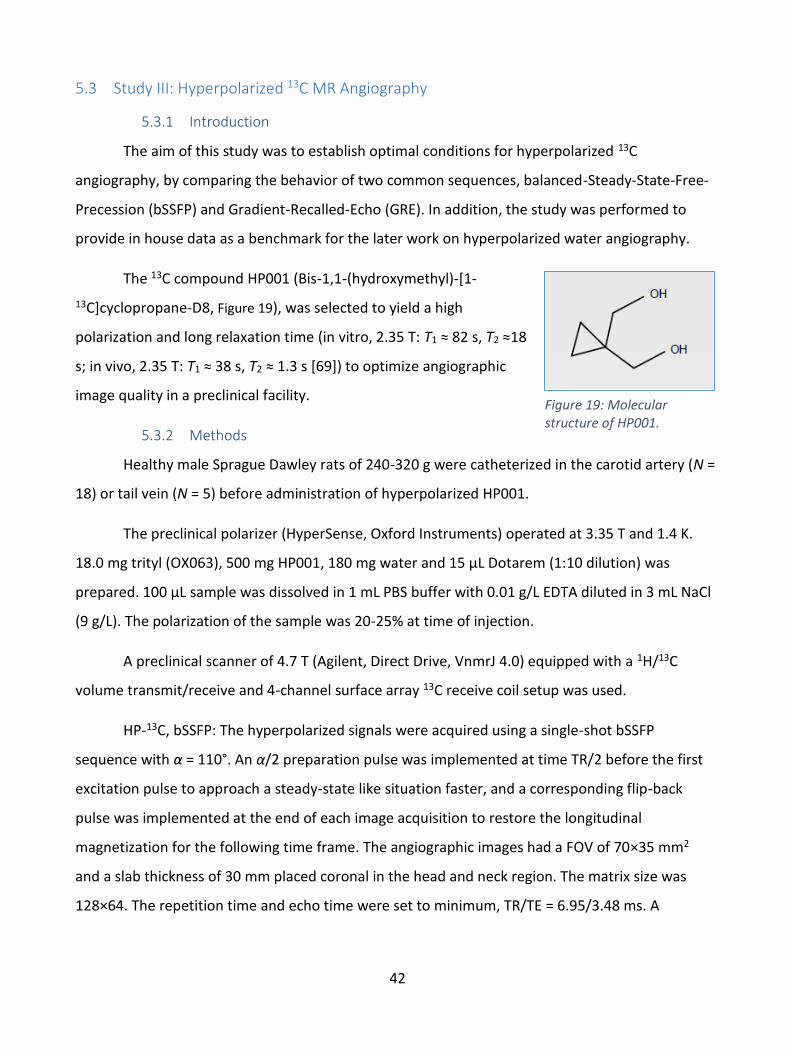
42
5.3 Study III: Hyperpolarized 13C MR Angiography
5.3.1 Introduction
The aim of this study was to establish optimal conditions for hyperpolarized 13C
angiography, by comparing the behavior of two common sequences, balanced-Steady-State-Free-
Precession (bSSFP) and Gradient-Recalled-Echo (GRE). In addition, the study was performed to
provide in house data as a benchmark for the later work on hyperpolarized water angiography.
The 13C compound HP001 (Bis-1,1-(hydroxymethyl)-[1-
13C]cyclopropane-D8, Figure 19), was selected to yield a high
polarization and long relaxation time (in vitro, 2.35 T: T1 ≈ 82 s, T2 ≈18
s; in vivo, 2.35 T: T1 ≈ 38 s, T2 ≈ 1.3 s [69]) to optimize angiographic
image quality in a preclinical facility.
5.3.2 Methods
Healthy male Sprague Dawley rats of 240-320 g were catheterized in the carotid artery (N =
18) or tail vein (N = 5) before administration of hyperpolarized HP001.
The preclinical polarizer (HyperSense, Oxford Instruments) operated at 3.35 T and 1.4 K.
18.0 mg trityl (OX063), 500 mg HP001, 180 mg water and 15 µL Dotarem (1:10 dilution) was
prepared. 100 µL sample was dissolved in 1 mL PBS buffer with 0.01 g/L EDTA diluted in 3 mL NaCl
(9 g/L). The polarization of the sample was 20-25% at time of injection.
A preclinical scanner of 4.7 T (Agilent, Direct Drive, VnmrJ 4.0) equipped with a 1H/13C
volume transmit/receive and 4-channel surface array 13C receive coil setup was used.
HP-13C, bSSFP: The hyperpolarized signals were acquired using a single-shot bSSFP
sequence with α = 110°. An α/2 preparation pulse was implemented at time TR/2 before the first
excitation pulse to approach a steady-state like situation faster, and a corresponding flip-back
pulse was implemented at the end of each image acquisition to restore the longitudinal
magnetization for the following time frame. The angiographic images had a FOV of 70×35 mm2
and a slab thickness of 30 mm placed coronal in the head and neck region. The matrix size was
128×64. The repetition time and echo time were set to minimum, TR/TE = 6.95/3.48 ms. A
Figure 19: Molecular structure of HP001.

43
bandwidth of 50 kHz yielded a total image acquisition of 450 ms for each image. The sequence was
started when the solution had been fully injected to capture the maximum possible signal.
HP-13C-MRA, GRE: The GRE sequence was applied with an FOV of 70×35 mm2, a slab
thickness of 20 mm and with matrix size 256×128. The pulse length was 2 ms and the repetition
and echo times were TR/TE = 10.16/5.10 ms. The total acquisition time for an image was 1300 ms
with α = 5° and imaging was repeated over 30 time frames. Acquisition was started when injection
was initiated to capture the maximum signal strength.
1H MRA: Proton angiographic images were acquired with a 1H quadrature coil with inner
diameter of 35 mm. A 3D GRE sequence with TR/TE = 90/2.47 ms, α = 40°, FOV of 30×35×20 mm3,
matrix size 256×256×64 was used after an intravenous injection of 50 µL Clariscan™. The total
acquisition time was 25 minutes.
5.3.3 Results
A gradient echo (GRE) sequence of α = 5° was determined as optimal for carotid artery
injections, producing images of the right vascular arterial and venous network (Figure 20, left). 18
injections in 10 animals yielded SNR of 17.6±4.5. The GRE sequence was not efficient for
intravenous injections, where the hyperpolarized agent is diluted in the vasculature before
reaching the cerebral network, yielding SNR <10. A bSSFP sequence proved more useful for
intravenous injection, where the venous structure of the rat head appeared, and larger veins could
be identified (Figure 20, center). 5 injections in 4 different animals yielded SNR of 31.3±20.0. The
sequence was optimized on a thermal 13C phantom, finding α = 110° the optimum. This was
confirmed by initial tests with intravenous injections of hyperpolarized HP001 in the tail vein
(Figure 21). A 128×128 matrix with FOV = 60×60 mm2 was used in these experiments.

44
Figure 20: Rat cerebral angiography after hyperpolarized injection in the carotid artery, imaged with a GRE sequence (left) and tail vein imaged with a bSSFP sequence (center). The images are coronal planes, with the brain in the center and the eyes underneath, and the nose in the bottom of the FOV. The right pane shows an anatomical spin echo 1H image for navigation.
Figure 21: Time series of bSSFP imaging of intravenous injections of hyperpolarized HP001. The image quality and SNR was highest for α = 110° (top row), lower for α = 60° (middle row), and further decreased for α = 30° (bottom row). These images were acquired in a 128×128 matrix with FOV = 60×60 mm2.
45
5.3.4 Discussion
It was unclear why the bSSFP sequence was unsuccessful for imaging of the intra-arterial
injections. The sequence optimally would produce images with higher signal, and for the minimal
background signal, higher CNR. However, the images were unusable due to the artefacts. The
artefacts were believed to origin from movements of the arteries, which could be either from
mechanical impacts from the catheter, or from physiological reactions.
The hyperpolarized 13C MR angiography study was designed to be a precursor for
hyperpolarized 1H coronary angiography in rats, which could later be translated into a clinical
setup with large animals. However, the study was complicated for several reasons. Working in
small animals with fine vascular system requires high spatial resolution. In addition, the
physiological dynamics are faster than in large animals, challenging the temporal measurements
such as flow and diffusion.
Furthermore, issues of a preclinical scanner without modern imaging tools and with
challenging artefacts in many images, were the main arguments for following another path for the
hyperpolarized water studies. It was determined to design the 1H hyperpolarization methodology
for doses for large animals, and applicable to the currently existing polarizers at clinical facilities.
5.3.5 Conclusion
The bSSFP sequence was useful for intravenous injections, where SNR of 31.3±20 was
observed with 0.55×0.55 mm2 pixel size, although the large standard deviation indicated that the
method yielded unstable results. The gradient echo sequence yielded SNR <10 with intravenous
injections. Comparing the results of the two sequences for intravenous injections, the bSSFP would
be preferred for achieving high signal for intra-arterial injections. However, the bSSFP sequence
proved unsuitable for intra-arterial injections, where artefacts prevented useful images.
Angiographies of the right carotid arterial network of rats were acquired with a gradient
echo sequence at 4.7 T with resolution of 0.27×0.27 mm2 pixel size, and SNR of 17.6±4.5 resulting
in a high image quality.
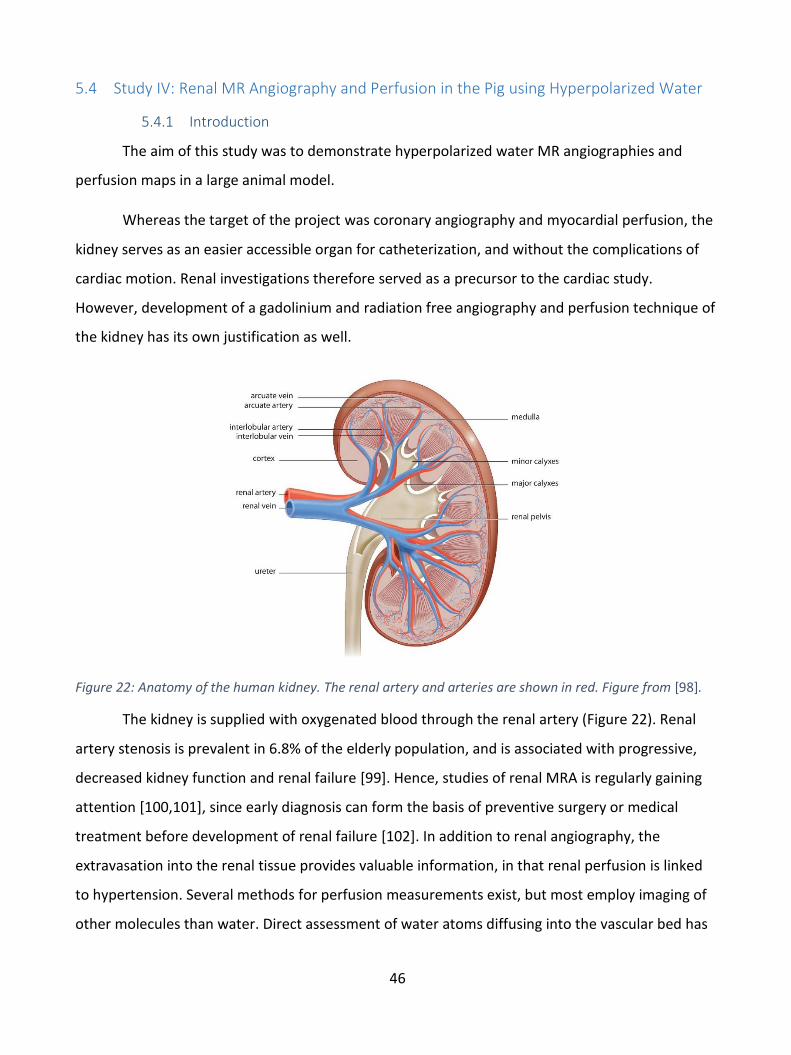
46
5.4 Study IV: Renal MR Angiography and Perfusion in the Pig using Hyperpolarized Water
5.4.1 Introduction
The aim of this study was to demonstrate hyperpolarized water MR angiographies and
perfusion maps in a large animal model.
Whereas the target of the project was coronary angiography and myocardial perfusion, the
kidney serves as an easier accessible organ for catheterization, and without the complications of
cardiac motion. Renal investigations therefore served as a precursor to the cardiac study.
However, development of a gadolinium and radiation free angiography and perfusion technique of
the kidney has its own justification as well.
Figure 22: Anatomy of the human kidney. The renal artery and arteries are shown in red. Figure from [98].
The kidney is supplied with oxygenated blood through the renal artery (Figure 22). Renal
artery stenosis is prevalent in 6.8% of the elderly population, and is associated with progressive,
decreased kidney function and renal failure [99]. Hence, studies of renal MRA is regularly gaining
attention [100,101], since early diagnosis can form the basis of preventive surgery or medical
treatment before development of renal failure [102]. In addition to renal angiography, the
extravasation into the renal tissue provides valuable information, in that renal perfusion is linked
to hypertension. Several methods for perfusion measurements exist, but most employ imaging of
other molecules than water. Direct assessment of water atoms diffusing into the vascular bed has

47
been asked for, and suggested by H215O PET imaging [103,104], again with the exposure to ionizing
radiation. Hyperpolarized water as a perfusion marker could solve both of these issues.
5.4.2 Methods
Hyperpolarization
The 30 mM TEMPO in H2O/glycerol 1:1 (w/w) sample was prepared as described for Study
II. Due to bursting of the dissolution syringes during extended time of heating while exposure to
organic solvents, the NFBME was left out and replaced by additional dissolution medium to a total
of 31.01 g (28 mL). The fluid path was prepared with sample, dissolution medium and heptane as
described for Study I and Study II. A 50 cm exit tube was used.
The sample was polarized in a SPINlab for one hour. Since the SPINlab only has 13C
channels installed, the electron resonance frequency was determined from a 13C sample.
Animals
Healthy 30 kg female Danish domestic pigs were sedated and anesthetized before
catheterization of the main renal artery for administration of 12-15 mL hyperpolarized water. The
catheter was placed using fluoroscopy (Figure 23).
Figure 23: Renal arterial tree imaged by fluoroscopy during insertion of catheter.
48
Imaging
Hyperpolarized water angiographies in pigs and phantom scans were acquired on a 3 T
scanner (HDx, GE) with an 8-channel cardiac array receiver coil. Phantom experiments were
performed by placing the filled sample syringe next to a saline filled syringe in the scanner, before
acquisition with a gradient echo sequence of α = 1°, matrix size 128×128, field-of-view, FOV = (24
mm)2 in a slab of 40 mm with TR = 3 ms, TE = 0.784 ms. The acquisition time of each frame was
450 ms, and images were acquired with a time delay of one second.
Axial and coronal images covering the kidneys of the pig were acquired to allow for
planning of the angiography slab for hyperpolarized water imaging. The sequence was as follows:
a 3D T1 weighted sequence with a standard steady-state free precession sequence (TE = 1.1 ms,
TR = 2.7 ms, flip angle α = 35°, image matrix 256×256, FOV = 340x340 mm2, in-plane resolution 1.3
mm, slice thickness 3 mm).
Angiographies were acquired in the coronal plane of the left kidney. Following the
conclusions of Study III, a gradient echo sequence gave high signal and was robust towards
artefacts for intra-arterial injections. Hence, a gradient echo sequence with α = 5°, slice thickness
40 mm, TR = 3.4 ms, TE = 0.984 ms, 256×256 matrix, FOV = 140×140 mm2 was used. The
acquisition time was 870 ms. The Gd-perfusion sequence was executed with the following
parameters: spoiled gradient echo, inversion time = 850 ms, α = 10°, slice thickness 50 mm, TR = 2
s, TE = 1.4 ms, 128×128 matrix, FOV = 290×290 mm2.
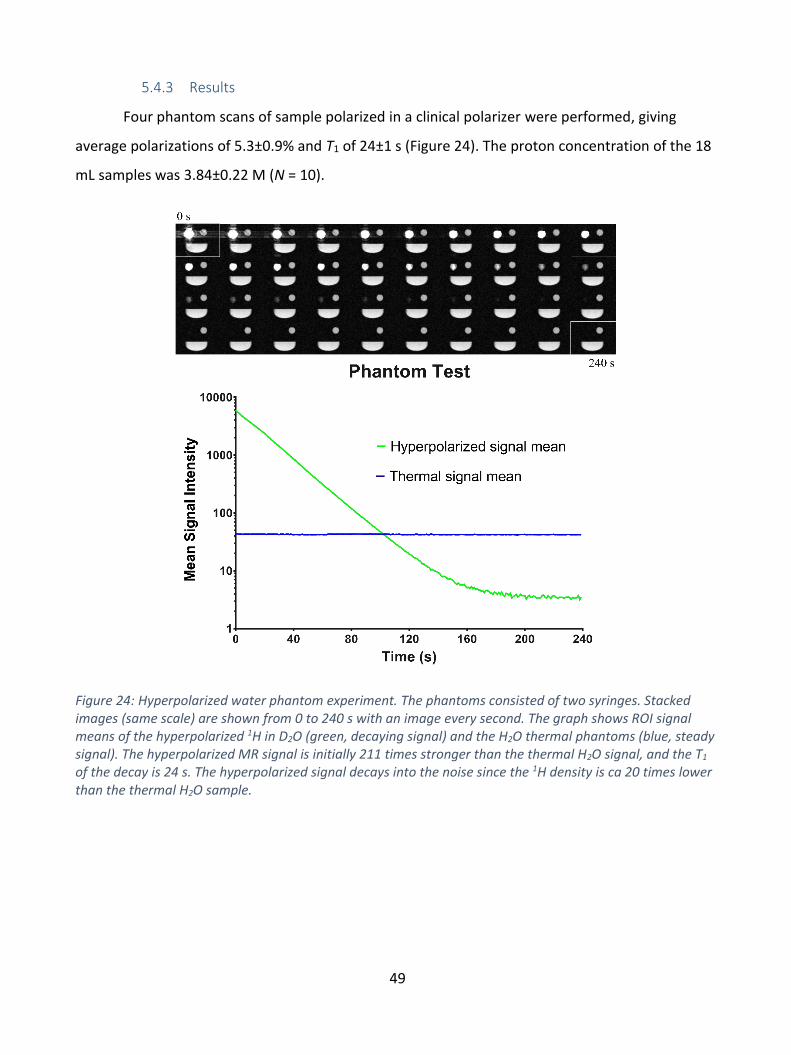
49
5.4.3 Results
Four phantom scans of sample polarized in a clinical polarizer were performed, giving
average polarizations of 5.3±0.9% and T1 of 24±1 s (Figure 24). The proton concentration of the 18
mL samples was 3.84±0.22 M (N = 10).
Figure 24: Hyperpolarized water phantom experiment. The phantoms consisted of two syringes. Stacked images (same scale) are shown from 0 to 240 s with an image every second. The graph shows ROI signal means of the hyperpolarized 1H in D2O (green, decaying signal) and the H2O thermal phantoms (blue, steady signal). The hyperpolarized MR signal is initially 211 times stronger than the thermal H2O signal, and the T1 of the decay is 24 s. The hyperpolarized signal decays into the noise since the 1H density is ca 20 times lower than the thermal H2O sample.
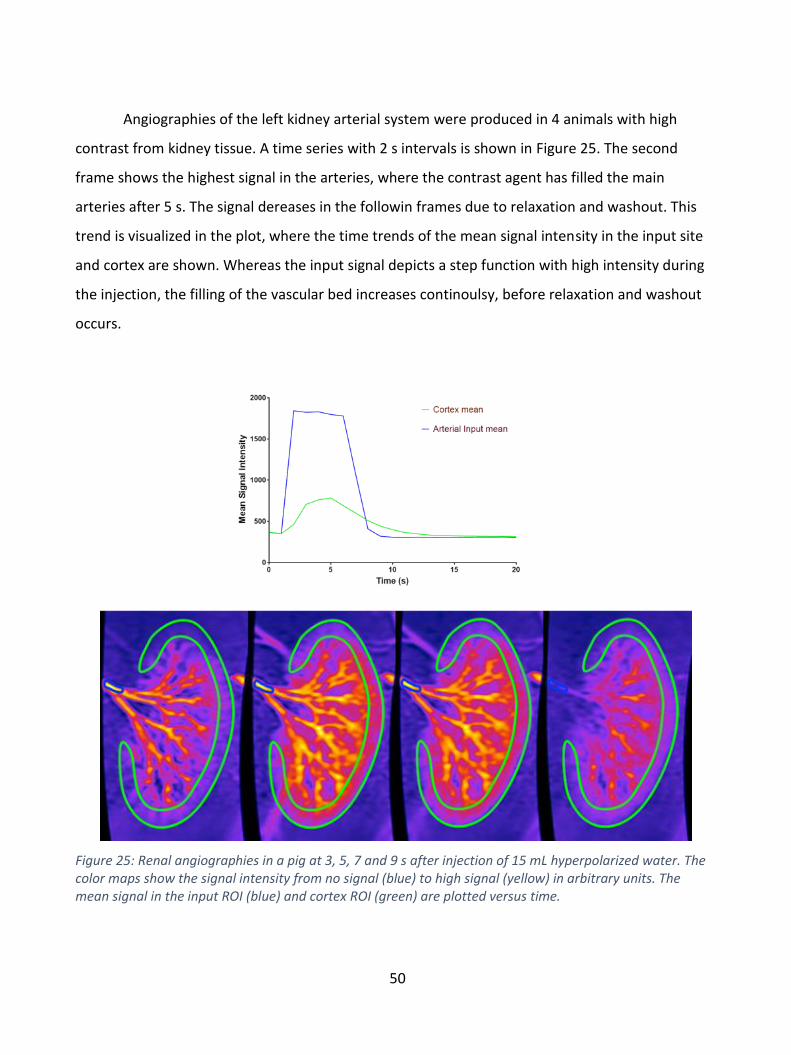
50
Angiographies of the left kidney arterial system were produced in 4 animals with high
contrast from kidney tissue. A time series with 2 s intervals is shown in Figure 25. The second
frame shows the highest signal in the arteries, where the contrast agent has filled the main
arteries after 5 s. The signal dereases in the followin frames due to relaxation and washout. This
trend is visualized in the plot, where the time trends of the mean signal intensity in the input site
and cortex are shown. Whereas the input signal depicts a step function with high intensity during
the injection, the filling of the vascular bed increases continoulsy, before relaxation and washout
occurs.
Figure 25: Renal angiographies in a pig at 3, 5, 7 and 9 s after injection of 15 mL hyperpolarized water. The color maps show the signal intensity from no signal (blue) to high signal (yellow) in arbitrary units. The mean signal in the input ROI (blue) and cortex ROI (green) are plotted versus time.

51
The perfusion maps derived from the time series are shown in Figure 26. The average
perfusion in the cortex was 504±123 mL/100 mL/min (green circumference), in agreement with
Gd-T1-DCE analysis of 450±57.3 mL/100 mL/min (N = 2), and values reported in the literature.
Figure 26: Perfusion maps of the kidney of four individual pigs after injection of 15 mL hyperpolarized water. The time series of Figure 25 is the data used for frame C.
5.4.4 Discussion
Hyperpolarized water MR angiography has been demonstrated in the pig kidney. The
dynamics of the time series was used to produce perfusion maps, which provided perfusion values
comparable to the standard Gd-T1-DCE method. The study opens for direct measurement of water
in the tissue, instead of tracing perfusion of e.g. gadolinium complexes with other perfusion
characteristics. In addition, the method saves the burden of NFS related complications from Gd
based contrast agents.
During injection and mixing with the blood in the arteries, the relaxation time of the
protons is reduced to around 1.6 s, the T1 of blood at 3 T [83]. This is important for the perfusion
analysis, and should be validated experimentally, and taken into account in a prospective
automated perfusion data analysis.
The main drawback is the need for renal catheterization, an invasive procedure. However,
avoiding traditional contrast agents or, alternatively, radiation burden from CT scan may justify
this. Comparing to state-of-the-art renal MR angiography of in-plane resolution 0.8×0.8 mm2
[105,106], the presented method provides 0.55×0.55 mm2 resolution without the burden of

52
gadolinium-based contrast agent, which is problematic for kidney patients in particular. Whereas
conventional MRA may be a suitable screening tool for renal artery stenosis detection, the
increased resolution of hyperpolarized water MRA may also be feasible for stenosis grading.
The protocol for hyperpolarized water was developed on a system, where several
parameters could be controlled individually. However, using the SPINlab, the hyperpolarization
process is automated. As a consequence, the dissolution syringes are pressurized and heated
during the entire polarization. Even though the pressure and temperature in the homebuilt system
mimicked those of the SPINlab, the extended heating time resulted in several breakings of the
syringes. The breaking is problematic in terms of losing the sample, but can also result in damage
of the polarizer and person damage from squirting of hot solvents. Thus, it was necessary to
replace the NFBME in the syringe with additional dissolution medium. This may be the main
reason for the lower polarization than that of the homebuilt polarizer. Other relevance differences
between the two systems are the field strength (5 T of SPINlab vs. 6.7 T of the Magnex),
temperature (0.8 K of SPINlab vs. 1.2 K of the Magnex), and the absence of frequency modulation
on the SPINlab.
The SPINlab is designed for application of the full fluid path system, where Part A is
connected to part B through an almost 2 m exit tube (see Figure 11). The system is closed off
during polarization and dissolution. However, as determined in Study II, shortening of the exit
tube is important to achieve high polarization. Thus, it was necessary to remove the protective
Plexiglas plate, and run the short exit tube directly out through the window (Figure 11).
5.4.5 Conclusion
MR angiography in large animals using hyperpolarized water was demonstrated feasible for
the first time. The method yielded reproducible results in 4 different animals, and the derived
perfusion maps gave values corresponding to those of conventional methods. The protocol for
hyperpolarized water developed in Study II was transferable to a clinical environment, although
substantial loss in polarization was observed for the SPINlab experiments.
53
5.5 Study V: Dynamic Coronary MR Angiography in the Pig using Hyperpolarized Water
5.5.1 Introduction
Cardiovascular magnetic resonance imaging is an efficient tool for radiation free diagnosis
of cardiac diseases, and is routinely used in clinical praxis. However, coronary magnetic resonance
angiography is troublesome due to the fine structure of the coronary arterial network, and the
cardiac and respiratory motion. Thus, coronary MRA remains an unresolved challenge for cardiac
disease diagnosis.
The aim of this study was to demonstrate that hyperpolarized water can be used as a
contrast agent to obtain coronary angiographies in a large animal model. The major challenge was
the heart beating, where sampling within the diastole is required to avoid motion artefacts, and
thus to acquire adequate signal to obtain a satisfactory resolution within less than a cardiac cycle.
The method provides direct tracing of water molecules, contrary to established techniques
which measures perfusion of radioactive nuclei, iodine contrast, or MR relaxation compounds.
5.5.2 Methods
The 1 mL 30 mM TEMPO in water/glycerol 1:1 (w/w) sample was prepared as described in
Study II and filled in the fluid path using the method developed in Study I. The sample was
polarized as described in Study IV.
Images were acquired in a tilted plane covering the LAD with equipment and parameters as
in Study IV. A gradient echo sequence of matrix size 256×256 and FOV = 140×140 mm2 yielded
isotropic resolution of 0.55 mm. The acquisition time was 870 ms.
Animals
Healthy 30 kg female Danish domestic pigs were sedated and anesthetized before
catheterization of the coronary artery (N = 3), for administration of 15 mL hyperpolarized water.
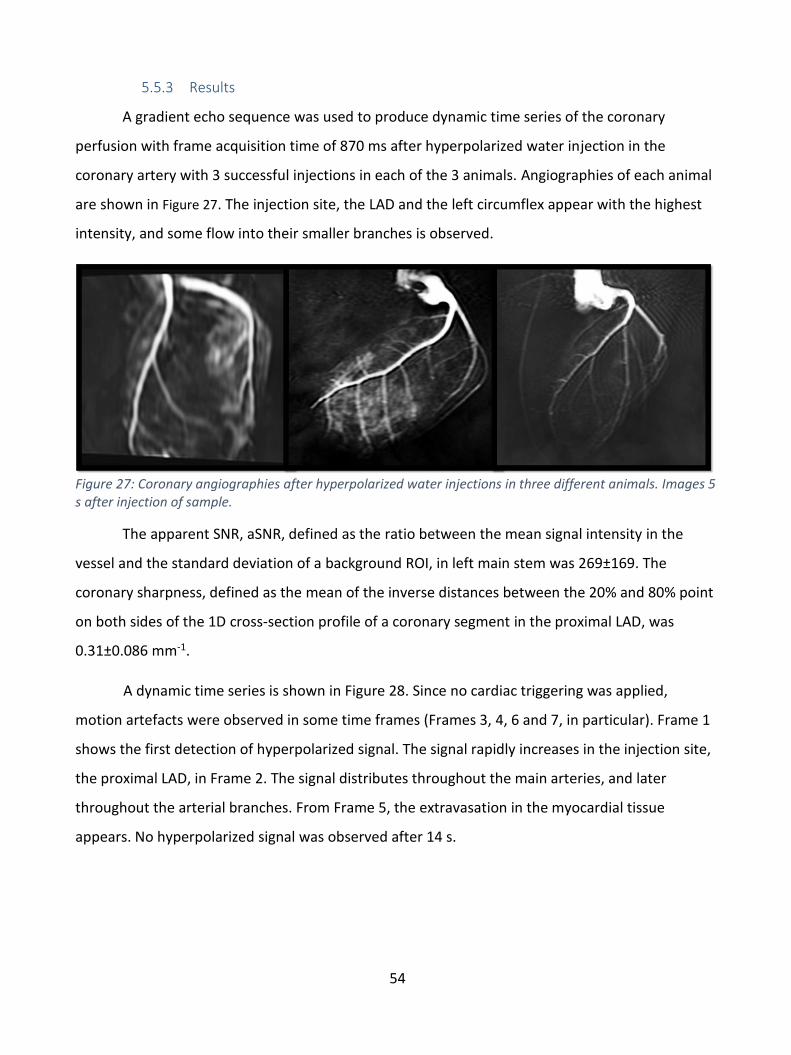
54
5.5.3 Results
A gradient echo sequence was used to produce dynamic time series of the coronary
perfusion with frame acquisition time of 870 ms after hyperpolarized water injection in the
coronary artery with 3 successful injections in each of the 3 animals. Angiographies of each animal
are shown in Figure 27. The injection site, the LAD and the left circumflex appear with the highest
intensity, and some flow into their smaller branches is observed.
Figure 27: Coronary angiographies after hyperpolarized water injections in three different animals. Images 5 s after injection of sample.
The apparent SNR, aSNR, defined as the ratio between the mean signal intensity in the
vessel and the standard deviation of a background ROI, in left main stem was 269±169. The
coronary sharpness, defined as the mean of the inverse distances between the 20% and 80% point
on both sides of the 1D cross-section profile of a coronary segment in the proximal LAD, was
0.31±0.086 mm-1.
A dynamic time series is shown in Figure 28. Since no cardiac triggering was applied,
motion artefacts were observed in some time frames (Frames 3, 4, 6 and 7, in particular). Frame 1
shows the first detection of hyperpolarized signal. The signal rapidly increases in the injection site,
the proximal LAD, in Frame 2. The signal distributes throughout the main arteries, and later
throughout the arterial branches. From Frame 5, the extravasation in the myocardial tissue
appears. No hyperpolarized signal was observed after 14 s.
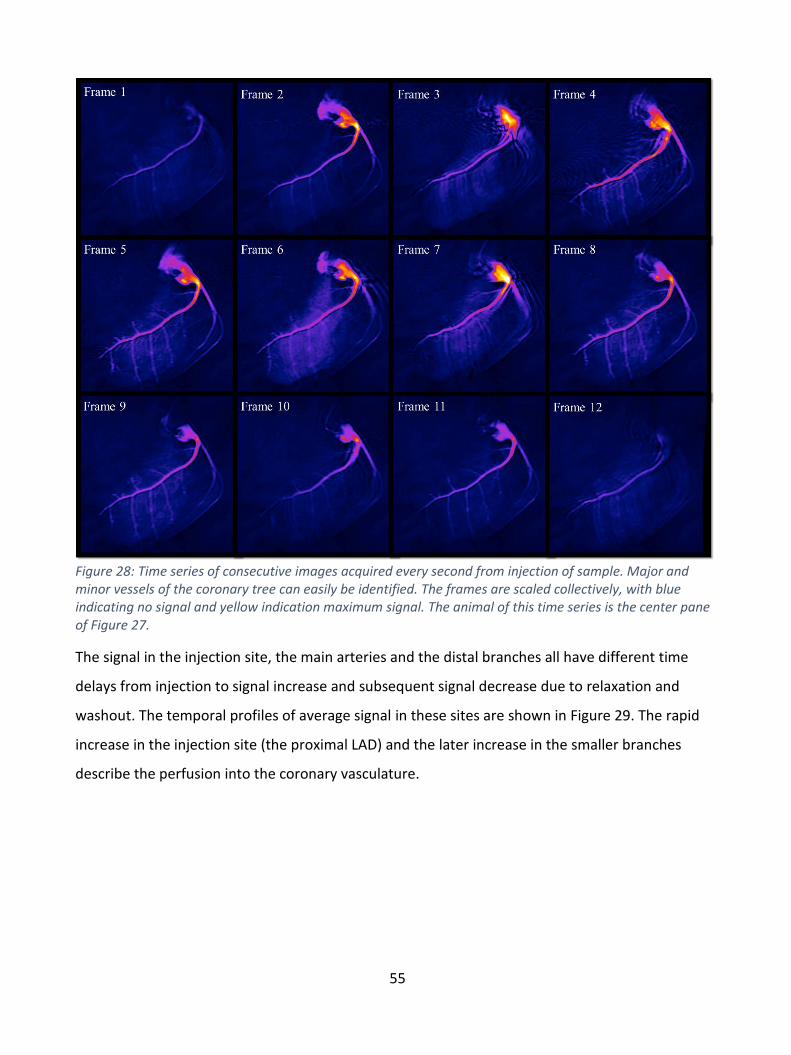
55
Figure 28: Time series of consecutive images acquired every second from injection of sample. Major and minor vessels of the coronary tree can easily be identified. The frames are scaled collectively, with blue indicating no signal and yellow indication maximum signal. The animal of this time series is the center pane of Figure 27.
The signal in the injection site, the main arteries and the distal branches all have different time
delays from injection to signal increase and subsequent signal decrease due to relaxation and
washout. The temporal profiles of average signal in these sites are shown in Figure 29. The rapid
increase in the injection site (the proximal LAD) and the later increase in the smaller branches
describe the perfusion into the coronary vasculature.
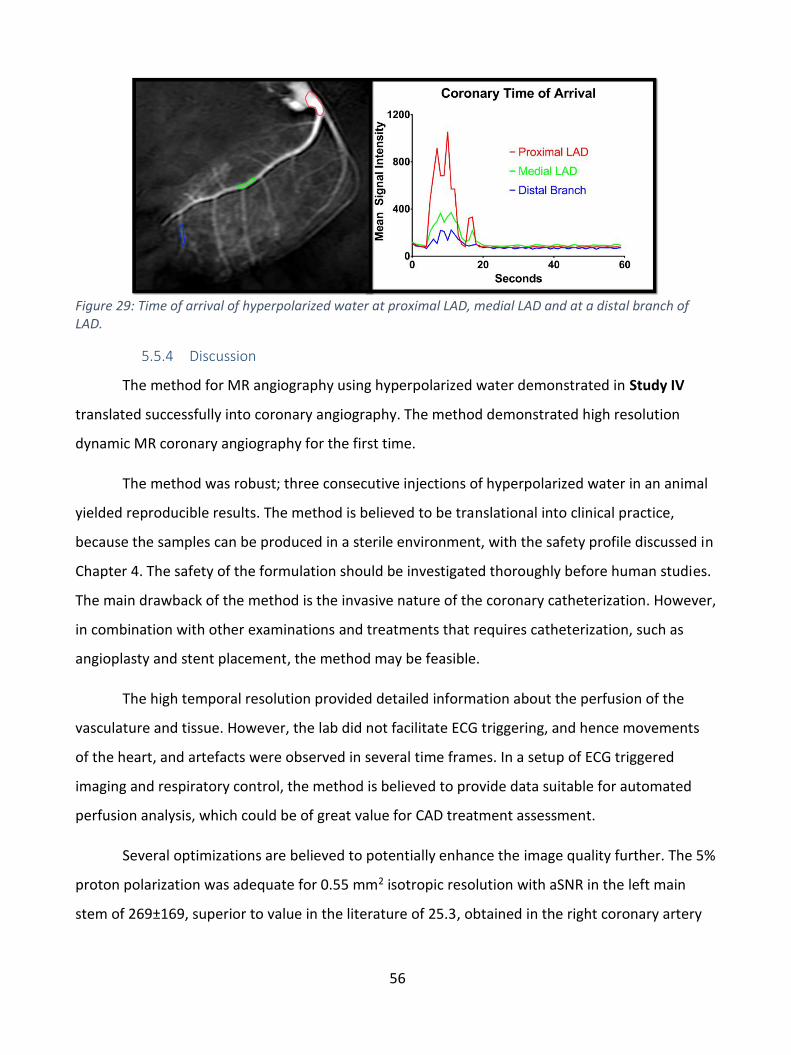
56
Figure 29: Time of arrival of hyperpolarized water at proximal LAD, medial LAD and at a distal branch of LAD.
5.5.4 Discussion
The method for MR angiography using hyperpolarized water demonstrated in Study IV
translated successfully into coronary angiography. The method demonstrated high resolution
dynamic MR coronary angiography for the first time.
The method was robust; three consecutive injections of hyperpolarized water in an animal
yielded reproducible results. The method is believed to be translational into clinical practice,
because the samples can be produced in a sterile environment, with the safety profile discussed in
Chapter 4. The safety of the formulation should be investigated thoroughly before human studies.
The main drawback of the method is the invasive nature of the coronary catheterization. However,
in combination with other examinations and treatments that requires catheterization, such as
angioplasty and stent placement, the method may be feasible.
The high temporal resolution provided detailed information about the perfusion of the
vasculature and tissue. However, the lab did not facilitate ECG triggering, and hence movements
of the heart, and artefacts were observed in several time frames. In a setup of ECG triggered
imaging and respiratory control, the method is believed to provide data suitable for automated
perfusion analysis, which could be of great value for CAD treatment assessment.
Several optimizations are believed to potentially enhance the image quality further. The 5%
proton polarization was adequate for 0.55 mm2 isotropic resolution with aSNR in the left main
stem of 269±169, superior to value in the literature of 25.3, obtained in the right coronary artery

57
of humans with Gd enhanced MRI [31]. The large standard deviation is believed to be a result of
the different positioning of the 3 animals.
By enhancing the solid-state polarization, optimizing the dissolution and extending the
relaxation time, a potential 50% polarization could improve the image quality dramatically. In
combination with a clinical setup suited for cardiac images, the method could provide
angiographies matching the resolution of CTA, and cardiac perfusion analysis with the advantages
of direct water perfusion measurement and avoidance of ionizing radiation and toxic contrast
agents.
5.5.5 Conclusion
The main finding of this study was the feasibility of coronary MR angiography using
hyperpolarized water. Images were acquired in less than 1 s, allowing for cardiac triggering, and
providing detailed information about the extravasation into the myocardial tissue. It was
demonstrated, that the aSNR, and with that, image quality, was superior to that of other coronary
MR angiographic methods. The method can be improved in several ways, to provide state-of-the-
art perfusion data of the myocardium.
58
6 Discussion
This chapter discusses the main findings and their relevance, and recommendations for
future research is presented. The largest obstacles for clinical translation are discussed. The main
purpose of this project was to investigate if hyperpolarized water could be applied as an MRI
contrast agent for coronary angiography and perfusion measurements in large animal models.
The major challenge is the fast relaxation of the polarization of the water protons, which
has led to a skepticism for the application of hyperpolarized water for angiography and perfusion
imaging [107]. Overhauser enhanced water provides low magnetization and short T1 [107]. Water
polarization by parahydrogen has been proposed [108], but without success so far. The advantage
of d-DNP, and the method proposed in this thesis, is the dilution of the protons in D2O to achieve a
long T1 before injection, and the high polarization achievable by DNP.
The solid-state 1H polarization obtained in this study was 70% in good agreement with
literature under similar experimental conditions (6.7 T and 1 K). Higher proton polarization has
been reported for similar polarizer conditions, up to 90%, but for samples with lower proton
density to reduce the heat capacity of the proton spin bath. It could be investigated if lower
proton density, e.g. by deuteration of the glycerol (glycerol-d5 or glycerol-d8) would lead to higher
polarization. However, further reduction of the proton density would increase the required sample
size beyond practical for a clinical/large animal dose. In this thesis, a 1 mL sample was polarized to
produce 15 mL of hyperpolarized solution. The fluid path would in principle accommodate up to 2
mL of solid sample, but further than that would require major hardware modifications.
The DNP build-up time constant was typically more than 30 min, and limited by the
available microwave power. However, final polarization was fully saturated, and microwave
frequency modulation was found to be very efficient in overcoming the inhomogeneous
broadening of the nitroxide EPR line at high magnetic field. Microwave frequency modulation is
particular preferable to increase electron-electron dipolar couplings in this context, compared to
increasing the nitroxide concentration (leading to relaxation losses in dissolution and liquid state).
Reduction of the microwave attenuation of the waveguide transmission system or exchanging the
microwave source with a higher power source is feasible, and could improve the throughput of d-
DNP by shortening the build-up time. It was found that degassing the solid sample leads to
59
significant improvement of the DNP efficiency. This is consistent with literature, and is explained
by the increased relaxation times of the nitroxide when molecular oxygen is removed. The
shortening of the nitroxide relaxation times by oxygen cannot be overcome by increased
microwave power. It was verified that the degassing did not lead to an increase of the T1 of the
protons after dissolution, i.e. it is not an effect of insufficient degassing of the final product. The
degassing of the solid sample was omitted in preclinical studies with the SPINlab due to practical
limitations at the hospital site.
There are recent developments within the field of d-DNP that can further advance the
method. It has been demonstrated that non-persistent radicals can be created by photo induction
of 13C-labelled pyruvic acid [109,110]. UV radicals generated from pyruvic acid in water [109] could
be thermally annihilated and radical free solutions could be obtained. In [111], 70% proton
polarization in the solid state in water/pyruvic acid 1:1 (v/v) was demonstrated. Liquid state
proton polarization has not yet been demonstrated by this method, but it would eliminate the
need for radical extraction and hence eliminate the heptane. Lower losses in dissolution and
longer T1 may also be expected with this method since the paramagnetic centers are eliminated in
the solid state prior to dissolution. Hirsh et al. demonstrated that a brute force polarized sample
(without paramagnetic centers) could conserve polarization during a 10 min. transfer from
polarizing site to imaging site by keeping it in the solid state and only dissolve immediately before
imaging [112]. This may also open up new perspectives for hyperpolarized water, even though the
solid-state T1 of protons should be significantly shorter than for 13C. Finally, parawater has been a
“hot topic” in magnetic resonance for the past many years [108]. So far, no one has succeeded,
but a long-lived singlet state would open up for intravenous administration and more reliable
perfusion and angiography. Another, possibly more likely, way of maintaining the magnetization
for longer, would be to encapsulate the hyperpolarized water in liposomes or similar, to prevent
the dilution with blood and shortening of T1.
The fluorinated solvent proposed to accelerate the dissolution process resulted in a large
enhancement of the liquid state polarization, but failed the translation into preclinical use. The
reason was that the heating time could not be controlled manually on the SPINlab, and syringes
burst from the extensive exposure to the solvent under high temperature and pressure. The
dissolution acceleration was omitted from the protocol for imaging experiments, and a substantial
60
part of polarization was lost when the fluorinated solvent was compensated by increasing the
amount of D2O in the dissolution syringe. Other methods for dissolution acceleration could be
desirable for further enhancement of the polarization. In particular, if even larger samples are
used. The two-phase extraction system was optimized to ensure almost complete extraction of the
nitroxide. However, it may be further improved by increasing the heptane volume, which would
require heating of the heptane to retain long relaxation time. An alternative for extraction of the
radical, could be implementation of an inline filter (solid-phase extraction) in the exit tube, or
acidic precipitation for radicals such as 4-carboxy-TEMPO. The solid-phase-extraction was not
attempted, and could lead to significant proton relaxation. It is, however, recommended to
investigate this method in further studies. Precipitation of the nitroxide could be challenging, since
even the protonated 4-carboxy-TEMPO has water solubility. The two-phase extraction could be
optimized by an automated stirring system, which could also eliminate the variability of manual
shaking as well as reduce the transfer time.
An automated injection system could control the injection rate of the hyperpolarized
product into the animal. This could also ensure that no heptane droplets were injected (by proper
quality control), which would be critical for clinical translation. The delivery to the patient has to
be as fast and efficient as possible. In this thesis, it is shown that a manual transfer can be done in
approx. 25 s. This is longer than the approx. 20 s T1 of the formulation, and accounts for most of
the loss from solid state (P = 70%) to time of measurement in the liquid state (P = 13%). An
automated transfer and injection system may potentially reduce the transfer time to 10 s as
shown in [65], and thereby increase the polarization by a factor two.
In this project, it was demonstrated that the technique can be applied for perfusion
measurements in the pig kidney, and that the obtained perfusion values are in agreement with
existing literature based on DCE-MRI. This demonstrates that despite the short T1 of the
hyperpolarized proton signal, reliable perfusion values can be calculated by standard dynamic
contrast enhanced models. Furthermore, it was demonstrated that the dynamic coronary MR
angiography time series could be acquired using hyperpolarized water; something that that no
other method has provided. The 5% proton polarization was adequate for 0.55 mm2 in plane
resolution with aSNR in the left main stem of 269, superior to reported clinical numbers of
typically 25 in the right coronary artery with Gd enhanced MRI. Although other works have

61
demonstrated that hyperpolarized water could be applied for angiography in rats [78,113], the
technique has here been translated into a clinical setup, producing large sample volumes in clinical
polarizers for large animal imaging. Some artefacts and tissue movement were observed in the
coronary angiography time series. Implementation of cardiac and respiratory triggering could
eliminate these and is straight forward, and thus may enable perfusion measurements of the
cardiac tissue as well as higher quality angiograms. Optimally, this would be in a new, state-of-the-
art clinical MRI setup suited for cardiac imaging, including an MRI system with cardiac package,
suitable heart array coils, and optimized sequences for 3D coverage of the heart.
The method was also tested for cerebral angiography in the pig [114]. Although great
established techniques for cerebral angiography already exist [115], the direct perfusion
measurement from hyperpolarized water may offer new insight into cerebral cardiovascular
disease and its diagnosis. Since water crosses readily the blood-brain-barrier (BBB), it is an “ideal”
contrast agent for investigating changes in the permeability of the BBB and water dynamics, e.g. in
patients after a stroke.
Catheterization of the coronary arteries is an invasive technique that is only used in
patients with severe cardiovascular disease. However, as previously mentioned, the annual
number of arterial catheterizations amounts to millions worldwide. A major step forward would
be if new methods of hyperpolarization could provide higher polarization and longer relaxation
time, which opens for intravenous injection, without the risk of occluding the coronary vessels or
other morbidity associated with catheterization.
With the fluid path filling method presented in Study I, a sterile contrast agent can be
provided using the SPINlab technology. This will enable human studies if sufficient safety profile
can be documented for the formulation. A more controlled radical extraction method than the
manual separatory funnel shaking can provide more efficient and reproducible extraction, as well
as validation of a heptane free, injectable sample suitable for humans.
The term Hyperpolarized water may be misleading. The 0.5 mL H2O sample is dissolved in
16 mL D2O. The protons and deuterons exchange rapidly, and will reach an equilibrium distribution
long before injection. Assuming a statistical distribution, and ignoring the exchangeable protons of
the glycerol, the injected sample will be composed of 0.1% H2O, 5.9% HDO and 94% D2O. The final
62
low radical concentration and the amount of deuterium are of some concern for human usage
[116]. However, based on the existing literature safety data, the 0.5 g deuterium per kg body
weight used in the pig experiments is not far from the typical 0.2 g/kg dose, given with the water
double labelling method. In the studies presented here, multiple injections were given in the same
animal with no observed adverse events. The toxicology of the formulation should be investigated
carefully before clinical research can be initiated. However, it is our opinion that further
development of the method will lead to significant changes to the formulation. Thus, formal safety
studies would be premature at this stage.
63
7 Conclusion
In this thesis work, it has been demonstrated that hyperpolarized water can be applied for
coronary angiography in a large animal model, and shows potential for myocardial perfusion
measurements.
A technique for preparation and hyperpolarization of large volumes of water was presented
and optimized. Solid-state polarization >70% was achieved with frequency modulated microwaves,
and a fluid path was used for efficient dissolution to reach a signal enhancement of 4,000 times
above thermal equilibrium, corresponding to a liquid state polarization of 13%, with T1 of 16 s. A
radical extraction system was designed, demonstrating removal of 97% of the nitroxide used for
DNP. The properties of the sample were suitable for preclinical experiments, although it is
believed that they could be further optimized to achieve even higher liquid state polarization.
The hyperpolarization method was implemented in a preclinical setup based on the SPINlab
technology. This, in principle, allows clinical translation of the method. Liquid state polarization of
5.3% with T1 of 24 s was obtained. The lower polarization in these experiments was due to
omitting the degassing of the solid sample, and the less efficient dissolution without the
fluorinated solvent.
First, renal angiography and perfusion was demonstrated. It was concluded that high
resolution, 0.55 mm isotropic, was obtainable, and that the image time series could be applied to
derive perfusion measurements in agreement with values reported in the literature.
The central result of the project was the realization of dynamic coronary MR angiography in
large animals, something that has not been achieved before. The images are considered to have
diagnostic quality, and the dynamics in the time series is believed to be suitable for perfusion
measurements, when obstacles such as cardiac triggering can be realized.
The results may impact the field of CAD diagnosis and treatment assessment, as it potentially
provides complementary parts to a full MR cardiac package, where both pre- and post-surgical
examinations can be achieved with high accuracy and low safety profile.
A novel method for filling of fluid paths for hyperpolarized samples was developed and tested.
A filling tube inserted through the inner tube enabled reuse of the fluid path, and facilitated
64
reproducible sample sizes and control parameters with standard deviations 3–10 times smaller
than the acceptance criteria intervals in clinical studies. The method is useful in experiments using
the fluid path technology, and was an important element in the later preclinical studies.
65
Bibliography
[1] World Health Organization, Cardiovascular Diseases Fact Sheet, (2016).
http://www.who.int/mediacentre/factsheets/fs317/en/ (accessed November 14, 2016).
[2] M.J. Albers, R. Bok, A.P. Chen, C.H. Cunningham, M.L. Zierhut, V.Y. Zhang, S.J. Kohler, J. Tropp, R.E.
Hurd, Y.F. Yen, S.J. Nelson, D.B. Vigneron, J. Kurhanewicz, Hyperpolarized 13C lactate, pyruvate, and
alanine: Noninvasive biomarkers for prostate cancer detection and grading, Cancer Res. 68 (2008)
8607–8615. doi:10.1158/0008-5472.CAN-08-0749.
[3] S.J. Nelson, J. Kurhanewicz, D.B. Vigneron, P.E.Z. Larson, A.L. Harzstark, M. Ferrone, M. Van
Criekinge, J.W. Chang, R. Bok, I. Park, G. Reed, L. Carvajal, E.J. Small, P. Munster, V.K. Weinberg, J.H.
Ardenkjaer-larsen, A.P. Chen, R.E. Hurd, L. Odegardstuen, F.J. Robb, J. Tropp, J. a Murray, Metabolic
Imaging of Patients with Prostate Cancer Using Hyperpolarized [1- 13 C]Pyruvate, Sci. Transl. Med. 5
(2013) 198ra108. doi:10.1126/scitranslmed.3006070.
[4] C.H. Cunningham, J.Y. Lau, A.P. Chen, B.J. Geraghty, W.J. Perks, I. Roifman, G.A. Wright, K.A.
Connelly, Hyperpolarized 13 C Metabolic MRI of the Human Heart: Initial Experience, Circ. Res. In
press (2016). doi:10.1161/CIRCRESAHA.116.309769.
[5] A. Berrington de González, M. Mahesh, Projected Cancer Risks From Computed Tomographic Scans
Performed in the United States in 2007, Arch Intern Med. 169 (2009) 2071–7.
doi:10.1001/archinternmed.2009.440.
[6] A.S. Go, D. Mozaffarian, V.L. Roger, E.J. Benjamin, J.D. Berry, M.J. Blaha, S. Dai, E.S. Ford, C.S. Fox, S.
Franco, H.J. Fullerton, C. Gillespie, S.M. Hailpern, J.A. Heit, V.J. Howard, M.D. Huffman, S.E. Judd,
B.M. Kissela, S.J. Kittner, D.T. Lackland, J.H. Lichtman, L.D. Lisabeth, R.H. Mackey, D.J. Magid, G.M.
Marcus, A. Marelli, D.B. Matchar, D.K. McGuire, E.R. Mohler, C.S. Moy, M.E. Mussolino, R.W.
Neumar, G. Nichol, D.K. Pandey, N.P. Paynter, M.J. Reeves, P.D. Sorlie, J. Stein, A. Towfighi, T.N.
Turan, S.S. Virani, N.D. Wong, D. Woo, M.B. Turner, Heart Disease and Stroke Statistics--2014
Update: A Report From the American Heart Association, 2014.
doi:10.1161/01.cir.0000441139.02102.80.
[7] U. Hoffmann, M. Ferencik, R.C. Cury, A.J. Pena, Coronary CT Angiography, J. Nucl. Med. 47 (2006)
797–806. doi:10.1148/radiol.2441052145.
[8] K.C. Leung, C.J. Martin, Effective doses for coronary angiography, Br. J. Radiol. 69 (1996) 426–431.
[9] K. Vijayalakshmi, D. Kelly, C.-L. Chapple, D. Williams, R. Wright, M.J. Stewart, J. a Hall, A. Sutton, A.
66
Davies, J. Haywood, M. a de Belder, Cardiac catheterisation: radiation doses and lifetime risk of
malignancy., Heart. 93 (2007) 370–371. doi:10.1136/hrt.2006.098731.
[10] A.J. Einstein, K.W. Moser, R.C. Thompson, M.D. Cerqueira, M.J. Henzlova, Radiation dose to patients
from cardiac diagnostic imaging, Circulation. 116 (2007) 1290–1305.
doi:10.1161/CIRCULATIONAHA.107.688101.
[11] K.K. Kumamaru, B.E. Hoppel, R.T. Mather, F.J. Rybicki, CT Angiography: Current Technology and
Clinical Use, Radiol Clin North Am. 48 (2010) 213–235. doi:10.1016/j.rcl.2010.02.006.CT.
[12] L.W. Goldman, Principles of CT: multislice CT., J. Nucl. Med. Technol. 36 (2008) 57-68-76.
doi:10.2967/jnmt.107.044826.
[13] J. Hausleiter, T. Meyer, F. Hermann, M. Hadamitzky, M. Krebs, T.C. Gerber, C. McCollough, S.
Martinoff, A. Kastrati, A. Schömig, S. Achenbach, Estimated radiation dose associated with cardiac
CT angiography, JAMA. 301 (2009) 500–507. doi:10.1001/jama.2009.54.
[14] S.E. Nissen, J.C. Gurley, C.L. Grines, D.C. Booth, R. Mcclure, M. Berk, C. Fischer, A.N. Demaria,
Intravascular Ultrasound Assessment of Lumen Size and Wall Morphology in Normal Subjects and
Patients With Coronary Artery Disease, Circulation. 84 (1991) 1087–1099.
[15] P. Schoenhagen, S. Nissen, Understanding coronary artery disease: tomographic imaging with
intravascular ultrasound, Heart. 88 (2002) 91–96. doi:10.1136/heart.88.1.91.
[16] G. Montalescot, U. Sechtem, S. Achenbach, ..., 2013 ESC guidelines on the management of stable
coronary artery disease, Eur. Heart J. 34 (2013) 2949–3003. doi:10.1093/eurheartj/eht296.
[17] B. a Herzog, J.P. Greenwood, S. Plein, M. Motwani, A. Kidambi, A. Uddin, MR Imaging of Cardiac
Tumors and Masses : A Review of Methods, Radiographics. 268 (2013) 26–46.
doi:10.1148/radiol.13121239/-/DC1.
[18] S. Srinivasan, D.B. Ennis, Optimal flip angle for high contrast balanced SSFP cardiac cine imaging,
Magn. Reson. Med. 73 (2015) 1095–1103. doi:10.1002/mrm.25228.
[19] T. Grobner, Gadolinium – a specific trigger for the development of nephrogenic brosing dermopathy
and nephrogenic systemic brosis?, Nephrol Dial Transpl. 21 (2006) 1104–1108.
doi:10.1093/ndt/gfk062.
[20] W.A. High, R.A. Ayers, J. Chandler, G. Zito, S.E. Cowper, Gadolinium is detectable within the tissue of
patients with nephrogenic systemic fibrosis, J. Am. Acad. Dermatol. 56 (2007) 21–26.
67
doi:10.1016/j.jaad.2006.10.047.
[21] D.G. Nishimura, Time-of-flight MR angiography, Magn. Reson. Med. 14 (1990) 194–201.
doi:10.1002/mrm.1910140206.
[22] T. Reese, D. Bochelen, A. Sauter, N. Beckmann, M. Rudin, Magnetic resonance angiography of the
rat cerebrovascular system without the use of contrast agents, NMR Biomed. 12 (1999) 189–196.
doi:10.1002/(SICI)1099-1492(199906)12:4<189::AID-NBM557>3.0.CO;2-O.
[23] M. Miyazaki, M. Akahane, Non-contrast enhanced MR angiography: Established techniques, J. Magn.
Reson. Imaging. 35 (2012) 1–19. doi:10.1002/jmri.22789.
[24] S. Kinner, S. Maderwald, N. Parohl, J. Albert, C. Corot, P. Robert, J. Barkhausen, F.M. Vogt, Contrast-
enhanced magnetic resonance angiography in rabbits: evaluation of the gadolinium-based agent
p846 and the iron-based blood pool agent p904 in comparison with gadoterate meglumine., Invest.
Radiol. 46 (2011) 524–529. doi:10.1097/RLI.0b013e31821ae21f.
[25] S.J. Riederer, C.R. Haider, E. a. Borisch, P.T. Weavers, P.M. Young, Recent advances in 3D time-
resolved contrast-enhanced MR angiography, J. Magn. Reson. Imaging. 42 (2015) 3–22.
doi:10.1002/jmri.24880.
[26] N.O. Addy, R.R. Ingle, H.H. Wu, B.S. Hu, D.G. Nishimura, High-resolution variable-density 3D cones
coronary MRA, Magn. Reson. Med. 74 (2015) 614–621. doi:10.1002/mrm.25803.
[27] A.M. Gharib, K.Z. Abd-Elmoniem, V.B. Ho, E. Födi, D. a Herzka, J. Ohayon, M. Stuber, R.I. Pettigrew,
The Feasibility of 350 μm Spatial Resolution Coronary Magnetic Resonance Angiography at 3 T in
Humans., Invest. Radiol. 47 (2012) 339–45. doi:10.1097/RLI.0b013e3182479ec4.
[28] S. Kato, K. Kitagawa, N. Ishida, M. Ishida, M. Nagata, Y. Ichikawa, K. Katahira, Y. Matsumoto, K. Seo,
R. Ochiai, Y. Kobayashi, H. Sakuma, Assessment of Coronary Artery Disease Using Magnetic
Resonance Coronary Angiography, J. Am. Coll. Cardiol. 56 (2010) 983–991.
doi:10.1016/j.jacc.2010.01.071.
[29] D. Piccini, P. Monney, C. Sierro, T. Rutz, A. Littmann, Respiratory Self-navigated Postcontrast Whole-
Heart Coronary MR Angiography: Initial Experience in Patients, Radiology. 270 (2014) 378–386.
[30] M. Henningsson, T. Hussain, M.S. Vieira, G.F. Greil, J. Smink, G. v. Ensbergen, G. Beck, R.M. Botnar,
Whole-heart coronary MR angiography using image-based navigation for the detection of coronary
anomalies in adult patients with congenital heart disease, J. Magn. Reson. Imaging. 43 (2016) 947–
955. doi:10.1002/jmri.25058.
68
[31] M.A. Ahlman, F.S. Raman, J. Pang, F. Zemrak, V. Sandfort, S.R. Penzak, Z. Fan, S. Liu, D. Li, D.A.
Bluemke, Part 2 – Coronary angiography with gadofosveset trisodium: a prospective intra-subject
comparison for dose optimization for 100 % efficiency imaging, BMC Cardiovasc. Disord. 16 (2016)
58. doi:10.1186/s12872-015-0152-8.
[32] C.E. Rochitte, R.T. George, M.Y. Chen, A. Arbab-Zadeh, M. Dewey, J.M. Miller, H. Niinuma, K.
Yoshioka, K. Kitagawa, S. Nakamori, R. Laham, A.L. Vavere, R.J. Cerci, V.C. Mehra, C. Nomura, K.F.
Kofoed, M. Jinzaki, S. Kuribayashi, A. de Roos, M. Laule, S.Y. Tan, J. Hoe, N. Paul, F.J. Rybicki, J.A.
Brinker, A.E. Arai, C. Cox, M.E. Clouse, M.F. Di Carli, J.A.C. Lima, Computed tomography angiography
and perfusion to assess coronary artery stenosis causing perfusion defects by single photon emission
computed tomography: the CORE320 study, Eur. Heart J. 35 (2014) 1120–1130.
doi:10.1093/eurheartj/eht488.
[33] R.T. George, A. Arbab-zadeh, R.J. Cerci, A.L. Vavere, M. Dewey, C.E. Rochitte, A.E. Arai, N. Paul, J.
Frank, A.C. Lardo, M.E. Clouse, J. a C. Lima, Diagnostic Performance of Combined Noninvasive
Coronary Angiography and Myocardial Perfusion Imaging Using 320- MDCT: The CT Angiography and
Perfusion Methods of the CORE320 Multicenter Multinational Diagnostic Study, Am J Roentgenol.
197 (2011) 829–837. doi:10.2214/AJR.10.5689.
[34] H. Sakuma, Coronary CT versus MR angiography: the role of MR angiography., Radiology. 258 (2011)
340–349. doi:10.1148/radiol.10100116.
[35] C.M. Kramer, J. Narula, Atherosclerotic Plaque Imaging: The Last Frontier for Cardiac Magnetic
Resonance, JACC Cardiovasc. Imaging. 2 (2009) 916–918. doi:10.1016/j.jcmg.2009.05.002.
[36] W.I. Tseng, M.M. Su, Y.E. Tseng, Introduction to Cardiovascular Magnetic Resonance: Technical
Principles and Clinical Applications, (2016) 129–144. doi:10.6515/ACS20150616A.
[37] M. Essig, M.S. Shiroishi, T.B. Nguyen, M. Saake, J.P. M., D. Enterline, N. Anzalone, A. Dörfler, À.
Rovira, M. Wintermark, M. Law, Perfusion MRI: The Five Most Frequently Asked Technical
Questions, AJR Am J Roentgenol. 200 (2013) 24–34. doi:10.2214/AJR.12.9543.Perfusion.
[38] T. Techasith, R.C. Cury, Stress myocardial ct perfusion: An update and future perspective, JACC
Cardiovasc. Imaging. 4 (2011) 905–916. doi:10.1016/j.jcmg.2011.04.017.
[39] J. Singh, A. Daftary, Iodinated contrast media and their adverse reactions., J. Nucl. Med. Technol. 36
(2008) 69-74-77. doi:10.2967/jnmt.107.047621.
[40] A. Abidov, A. Rozanski, L. Shaw, J. Min, R. Hachamovitch, X. Kang, D. Berman, G. Germano, S. Hayes,
69
J. Friedman, L. Thomson, P. Slomka, SPECT/PET myocardial perfusion imaging versus coronary CT
angiography in patients with known or suspected CAD, Q. J. Nucl. Med. Mol. Imaging. 54 (2010)
177–200.
[41] A. Flotats, P.E. Bravo, K. Fukushima, M.A. Chaudhry, J. Merrill, F.M. Bengel, 82Rb PET myocardial
perfusion imaging is superior to 99mTc-labelled agent SPECT in patients with known or suspected
coronary artery disease, Eur. J. Nucl. Med. Mol. Imaging. 39 (2012) 1233–1239. doi:10.1007/s00259-
012-2140-x.
[42] P. Herscovitch, J. Markham, M.E. Raichle, Brain Blood Flow Measured with Intravenous H215O.: I.
Theory and Error Analysis, J Nucl Med. 24 (1983) 782–789.
[43] M.E. Raichle, W.R.W. Martin, P. Herscovltch, M.A. Mintun, J. Markham, Brain Blood Flow Measured
with Intravenous H215O.: II. Implementation and Validation, J Nucl Med. 24 (1983).
[44] J. Maddahi, R.R.S. Packard, Cardiac PET perfusion tracers: Current status and future directions,
Semin. Nucl. Med. 44 (2014) 333–343. doi:10.1053/j.semnuclmed.2014.06.011.
[45] X.-H. Zhu, Y. Zhang, H. Wiesner, K. Ugurbil, W. Chen, In vivo measurement of CBF using 17 O NMR
signal of metabolically produced H217 O as a perfusion tracer, Magn. Reson. Med. 70 (2013) 309–
314. doi:10.1002/mrm.24469.
[46] M. Levitt, Spin Dynamics, 2nd ed., John Wiley & Sons, 2008.
[47] J.H. Ardenkjaer-Larsen, B. Fridlund, A. Gram, G. Hansson, L. Hansson, M.H. Lerche, R. Servin, M.
Thaning, K. Golman, Increase in signal-to-noise ratio of > 10,000 times in liquid-state NMR., Proc.
Natl. Acad. Sci. U. S. A. 100 (2003) 10158–10163. doi:10.1073/pnas.1733835100.
[48] A.W. Overhauser, Polarization of Nuclei in Metals, Phys. Rev. 92 (1953) 411–415.
[49] T.R. Carver, C.P. Slichter, Polarization of nuclear spins in metals, Phys. Rev. 92 (1953) 212–213.
doi:10.1103/PhysRev.92.212.2.
[50] T.R. Carver, C.P. Slichter, Experimental verification of the overhauser nuclear polarization effect,
Phys. Rev. 102 (1956) 975–980. doi:10.1103/PhysRev.102.975.
[51] A. Abragam, Overhauser effect in nonmetals, Phys. Rev. 98 (1955) 1729–1735.
doi:10.1103/PhysRev.98.1729.
[52] C.D. Jeffries, Polarization of nuclei by resonance saturation in paramagnetic crystals, Phys. Rev. 106
(1957) 164–165. doi:10.1103/PhysRev.106.164.
70
[53] W.T. Wenckebach, The solid effect, Appl. Magn. Reson. 34 (2008) 227–235. doi:10.1007/s00723-
008-0121-9.
[54] A. Abragam, M. Goldman, Principles of dynamic nuclear polarisation, Reports Prog. Phys. 41 (1978)
395–467. doi:10.1088/0034-4885/41/3/002.
[55] T. Wenckebach, Essentials of Dynamic Nuclear Polarization, Spindrift Publications, 2016.
[56] V.A. Atsarkin, A. V. Kessenikh, Dynamic Nuclear Polarization in Solids: The Birth and Development of
the Many-Particle Concept, Appl. Magn. Reson. 43 (2012) 7–19. doi:10.1007/s00723-012-0328-7.
[57] K.R. Thurber, W.-M. Yau, R. Tycko, Low-temperature dynamic nuclear polarization at 9.4 T with a 30
mW microwave source., J. Magn. Reson. 204 (2010) 303–13. doi:10.1016/j.jmr.2010.03.016.
[58] Y. Hovav, A. Feintuch, S. Vega, D. Goldfarb, Dynamic nuclear polarization using frequency
modulation at 3.34 T, J. Magn. Reson. 238 (2014) 94–105. doi:10.1016/j.jmr.2013.10.025.
[59] A. Bornet, J. Milani, B. Vuichoud, A.J. Perez Linde, G. Bodenhausen, S. Jannin, Microwave Frequency
Modulation to Enhance Dissolution Dynamic Nuclear Polarization, Chem. Phys. Lett. 602 (2014) 63–
67. doi:10.1016/j.cplett.2014.04.013.
[60] S. Jannin, A. Bornet, R. Melzi, G. Bodenhausen, High field dynamic nuclear polarization at 6.7T:
Carbon-13 polarization above 70% within 20min, Chem. Phys. Lett. 549 (2012) 99–102.
doi:10.1016/j.cplett.2012.08.017.
[61] G. Olsen, E. Markhasin, O. Szekely, C. Bretschneider, L. Frydman, Optimizing water hyperpolarization
and dissolution for sensitivity-enhanced 2D biomolecular NMR, J. Magn. Reson. 264 (2016) 49–58.
doi:10.1016/j.jmr.2016.01.005.
[62] B. Lama, J.H.P. Collins, D. Downes, A.N. Smith, J.R. Long, Expeditious dissolution dynamic nuclear
polarization without glassing agents, NMR Biomed. 29 (2016) 226–231. doi:10.1002/nbm.3473.
[63] J. Wolber, F. Ellner, B. Fridlund, a. Gram, H. Jóhannesson, G. Hansson, L.H. Hansson, M.H. Lerche, S.
Månsson, R. Servin, M. Thaning, K. Golman, J.H. Ardenkjær-Larsen, Generating highly polarized
nuclear spins in solution using dynamic nuclear polarization, Nucl. Instruments Methods Phys. Res.
Sect. A Accel. Spectrometers, Detect. Assoc. Equip. 526 (2004) 173–181.
doi:10.1016/j.nima.2004.03.171.
[64] S. Bowen, C. Hilty, Time-resolved dynamic nuclear polarization enhanced NMR spectroscopy,
Angew. Chemie - Int. Ed. 47 (2008) 5235–5237. doi:10.1002/anie.200801492.
71
[65] T. Cheng, M. Mishkovsky, J. a M. Bastiaansen, O. Ouari, P. Hautle, P. Tordo, B. Van Den Brandt, A.
Comment, Automated transfer and injection of hyperpolarized molecules with polarization
measurement prior to in vivo NMR, NMR Biomed. 26 (2013) 1582–1588. doi:10.1002/nbm.2993.
[66] H. Shang, T. Skloss, C. von Morze, L. Carvajal, M. Van Criekinge, E. Milshteyn, P.E.Z. Larson, R.E.
Hurd, D.B. Vigneron, Handheld electromagnet carrier for transfer of hyperpolarized carbon-13
samples, Magn. Reson. Med. 922 (2015) 917–922. doi:10.1002/mrm.25657.
[67] J. Milani, B. Vuichoud, A. Bornet, P. Miéville, R. Mottier, S. Jannin, G. Bodenhausen, A magnetic
tunnel to shelter hyperpolarized fluids, Rev. Sci. Instrum. 86 (2015). doi:10.1063/1.4908196.
[68] K. Golman, O. Axelsson, H. Jóhannesson, S. Månsson, C. Olofsson, J.S. Petersson, Parahydrogen-
induced polarization in imaging: Subsecond 13C angiography, Magn. Reson. Med. 46 (2001) 1–5.
doi:10.1002/mrm.1152.
[69] J. Svensson, S. Månsson, E. Johansson, J.S. Petersson, L.E. Olsson, Hyperpolarized 13C MR
angiography using trueFISP, Magn. Reson. Med. 50 (2003) 256–262. doi:10.1002/mrm.10530.
[70] L.E. Olsson, C.M. Chai, O. Axelsson, M. Karlsson, K. Golman, J.S. Petersson, MR coronary angiography
in pigs with intraarterial injections of a hyperpolarized 13C substance, Magn. Reson. Med. 55 (2006)
731–737. doi:10.1002/mrm.20847.
[71] E. Johansson, S. Månsson, R. Wirestam, J. Svensson, J.S. Petersson, K. Golman, F. Ståhlberg, Cerebral
Perfusion Assessment by Bolus Tracking Using Hyperpolarized 13C, Magn. Reson. Med. 51 (2004)
464–472. doi:10.1002/mrm.20013.
[72] A.K. Grant, E. Vinogradov, X. Wang, R.E. Lenkinski, D.C. Alsop, Perfusion imaging with a freely
diffusible hyperpolarized contrast agent, Magn. Reson. Med. 66 (2011) 746–755.
doi:10.1002/mrm.22860.
[73] C. Von Morze, P.E.Z. Larson, S. Hu, H. a I. Yoshihara, R. a. Bok, A. Goga, J.H. Ardenkjaer-Larsen, D.B.
Vigneron, Investigating tumor perfusion and metabolism using multiple hyperpolarized 13C
compounds: HP001, pyruvate and urea, Magn. Reson. Imaging. 30 (2012) 305–311.
doi:10.1016/j.mri.2011.09.026.
[74] I. Park, C. von Morze, J.M. Lupo, J.H. Ardenkjaer-Larsen, A. Kadambi, D.B. Vigneron, S.J. Nelson,
Investigating tumor perfusion by hyperpolarized 13C MRI with comparison to conventional
gadolinium contrast-enhanced MRI and pathology in orthotopic human GBM xenografts, Magn.
Reson. Med. (2016). doi:10.1002/mrm.26155.
72
[75] A.Z. Lau, J.J. Miller, M.D. Robson, D.J. Tyler, Cardiac perfusion imaging using hyperpolarized 13 c
urea using flow sensitizing gradients, Magn. Reson. Med. 75 (2016) 1474–1483.
doi:10.1002/mrm.25713.
[76] J.T. Anderson, W. A.; Arnold, Proton Relaxation Times in H2O-D2O Mixtures, Phys. Rev. 101 (1956)
511–512. doi:10.1103/PhysRev.101.511.
[77] H.Y. Simpson, J. H.; Carr, Diffusion and Nuclear Spin Relaxation in Water, Phys. Rev. 111 (1958)
1201–1202. doi:10.1103/PhysRev.111.1201.
[78] J.H. Ardenkjaer-Larsen, C. Laustsen, S. Bowen, R. Rizi, Hyperpolarized H2O MR angiography, Magn.
Reson. Med. 71 (2014) 50–56. doi:10.1002/mrm.25033.
[79] N. Nestle, T. Baumann, R. Niessner, Oxygen determination in oxygen-supersaturated drinking waters
by NMR relaxometry, Water Res. 37 (2003) 3361–3366. doi:10.1016/S0043-1354(03)00211-2.
[80] P. Höfer, G. Parigi, C. Luchinat, P. Carl, G. Guthausen, M. Reese, T. Carlomagno, C. Griesinger, M.
Bennati, Field dependent dynamic nuclear polarization with radicals in aqueous solution, J. Am.
Chem. Soc. 130 (2008) 3254–3255. doi:10.1021/ja0783207.
[81] P. Miéville, P. Ahuja, R. Sarkar, S. Jannin, P.R. Vasos, S. Gerber-Lemaire, M. Mishkovsky, A.
Comment, R. Gruetter, O. Ouari, P. Tordo, G. Bodenhausen, Scavenging free radicals to preserve
enhancement and extend relaxation times in NMR using dynamic nuclear polarization, Angew.
Chemie - Int. Ed. 49 (2010) 6182–6185. doi:10.1002/anie.201000934.
[82] T. Harris, O. Szekely, L. Frydman, On the potential of Hyperpolarized Water in Biomolecular NMR
Studies, J. Phys. Chem. B. 118 (2014) 3281–3290. doi:10.1021/jp4102916.
[83] X. Zhang, E.T. Petersen, E. Ghariq, J.B. De Vis, A.G. Webb, W.M. Teeuwisse, J. Hendrikse, M.J.P. Van
Osch, In vivo blood T1 measurements at 1.5 T, 3 T, and 7 T, Magn. Reson. Med. 70 (2013) 1082–
1086. doi:10.1002/mrm.24550.
[84] Q. Chappuis, J. Milani, B. Vuichoud, A. Bornet, A.D. Gossert, G. Bodenhausen, S. Jannin,
Hyperpolarized Water to Study Protein–Ligand Interactions, J. Phys. Chem. Lett. 6 (2015) 1674–
1678. doi:10.1021/acs.jpclett.5b00403.
[85] J. Besjakov, L. Baath, A.N. Oksendal, T. Almen, Reduced Risk of Ventricular Fibrillation by Balancing
Sodium, Calcium, Potassium and Magnesium Added to Nonionic Contrast Media: An Investigation in
the Isolated Rabbit Heart, Acta Radiol. 34 (1993) 246–251. doi:10.1177/028418519303400309.
73
[86] NIH, TOXNET, Toxicology Data Network, U.S. Natl. Libr. Med. (n.d.). https://toxnet.nlm.nih.gov/cgi-
bin/sis/search/a?dbs+hsdb:@term+@DOCNO+90 (accessed November 21, 2016).
[87] J. Emsley, The Elements, 3rd ed., Clarendon Press, Oxford, 1998.
[88] D.J. Kushner, a Baker, T.G. Dunstall, Pharmacological uses and perspectives of heavy water and
deuterated compounds., Can. J. Physiol. Pharmacol. 77 (1999) 79–88. doi:10.1139/y99-005.
[89] J.F. Thomson, Physiological Effects of D2O in Mammals, Ann. N. Y. Acad. Sci. 84 (1960) 736–744.
doi:10.1111/j.1749-6632.1960.tb39105.x.
[90] J.R. Speakman, Doubly Labelled Water: Theory and Practice, Springer US, 1997.
[91] B. Scheer, A. Perel, U.J. Pfeiffer, Clinical review: complications and risk factors of peripheral arterial
catheters used for haemodynamic monitoring in anaesthesia and intensive care medicine, Crit Care.
6 (2002) 199–204. doi:10.1186/cc1489.
[92] S. Windecker, B.J. Meyer, T. Bonzel, J. Fabian, G. Heyndrickx, M.C. Morice, V. Mu, F. Piscione, M.
Rothman, W. Wijns, M. Van Den Brand, Working Group Report: Interventional cardiology in Europe
1995, 20 (1999) 484–495.
[93] J.H. Ardenkjaer-Larsen, A.M. Leach, N. Clarke, J. Urbahn, D. Anderson, T.W. Skloss, Dynamic nuclear
polarization polarizer for sterile use intent, NMR Biomed. 24 (2011) 927–932.
doi:10.1002/nbm.1682.
[94] A. Comment, J. Rentsch, F. Kurdzesau, S. Jannin, K. Uffmann, R.B. van Heeswijk, P. Hautle, J.A.
Konter, B. van den Brandt, J.J. van der Klink, Producing over 100 ml of highly concentrated
hyperpolarized solution by means of dissolution DNP, J. Magn. Reson. 194 (2008) 152–155.
doi:10.1016/j.jmr.2008.06.003.
[95] S. Bowen, J.H. Ardenkjaer-Larsen, Enhanced performance large volume dissolution-DNP, J. Magn.
Reson. 240 (2014) 90–94. doi:10.1016/j.jmr.2014.01.009.
[96] R. Battino, T.R. Rettich, T. Tominaga, The Solubility of Oxygen and Ozone in Liquids, J. Phys. Chem.
Ref. Data. 12 (1983) 163–178. doi:10.1063/1.555680.
[97] Michael G. Costello, R.M. Flynn, J.G. Owens, 3M Company, Fluoroethers and Fluoroaminies, Kirk-
Othmer Encyclopedia of Chemical Technology, 5th ed., John Wiley & Sons, 2005.
doi:10.1002/0471238961.
[98] Human Anatomy Diagram, The Anatomy of Kidney, With Leslie Samuel, (n.d.). http://anatomy-
74
bodychart.us/anatomy-of-kidney/anatomy-of-kidney-the-anatomy-of-a-kidney-interactive-biology-
with-leslie-samuel/ (accessed November 20, 2016).
[99] K.J. Hansen, M.S. Edwards, T.E. Craven, G.S. Cherr, S.A. Jackson, R.G. Appel, G.L. Burke, R.H. Dean,
Prevalence of renovascular disease in the elderly: A population-based study, J. Vasc. Surg. 36 (2002)
443–451. doi:10.1067/mva.2002.127351.
[100] K.L. Wright, G.R. Lee, P. Ehses, M.A. Griswold, V. Gulani, N. Seiberlich, Three-dimensional through-
time radial GRAPPA for renal MR angiography, J. Magn. Reson. Imaging. 40 (2014) 864–874.
doi:10.1002/jmri.24439.
[101] C. Sebastià, A.D. Sotomayor, B. Paño, R. Salvador, M. Burrel, A. Botey, C. Nicolau, Accuracy of
unenhanced magnetic resonance angiography for the assessment of renal artery stenosis, Eur. J.
Radiol. Open. 3 (2016) 200–206. doi:10.1016/j.ejro.2016.07.003.
[102] K. Jamerson, W. Henrich, D.M. Reid, D.J. Cohen, A.H. Matsumoto, M. Steffes, M.R. Jaff, M.R. Prince,
D. Ph, E.F. Lewis, K.R. Tuttle, J.I. Shapiro, J.H. Rundback, J.M. Massaro, R.B.D. Agostino, Stenting and
Medical Therapy for Atherosclerotic Renal-Artery Stenosis, New Engl. J. Med. 370 (2013) 1–10.
doi:10.1056/NEJMoa1310753.
[103] S.R. Bergmann, P. Herrero, J. Markham, C.J. Weinheimer, M. Norine, Noninvasive Quantitation of
Myocardial Blood Flow in Human Subjects With Oxygen-15 Labeled Water and Positron Emission
Tomography, J. Am. Coll. Cardiol. 14 (1989) 639–652. doi:10.1016/0735-1097(89)90105-8.
[104] A.J. de Langen, V.E.M. van den Boogaart, J.T. Marcus, M. Lubberink, Use of H2(15)O-PET and DCE-
MRI to measure tumor blood flow., Oncologist. 13 (2008) 631–644. doi:10.1634/theoncologist.2007-
0235.
[105] S.O. Schoenberg, J. Rieger, C.H. Weber, H.J. Michaely, T. Waggershauser, C. Ittrich, O. Dietrich, M.F.
Reiser, High-Spatial-Resolution MR Angiography of Renal Arteries with Integrated Parallel
Acquisitions: Comparison with Digital Subtraction Angiography and US, Radiology. 235 (2005) 687–
698.
[106] U.I. Attenberger, J.N. Morelli, S.O. Schoenberg, H.J. Michaely, Assessment of the kidneys: magnetic
resonance angiography, perfusion and diffusion., J. Cardiovasc. Magn. Reson. 13 (2011).
doi:10.1186/1532-429X-13-70.
[107] P. Mark D. Lingwood, B. Ting Ann Siaw, P. Napapon Sailasuta, M. Osama A. Abulseoud, M. Henry R.
Chan, M. Brian D. Ross, P. Pratip Bhattacharya, P. Songi Han, Hyperpolarized Water as an MR
75
Imaging Contrast Agent: Feasibility of in Vivo Imaging in a Rat Model, Radiology. 265 (2012) 418–
425. doi:10.1148/radiol.12111804.
[108] D. Mammoli, N. Salvi, J. Milani, R. Buratto, A. Bornet, A.A. Sehgal, E. Canet, P. Pelupessy, D.
Carnevale, S. Jannin, G. Bodenhausen, Challenges of preparing, preserving and detecting para-water
in bulk: overcoming proton exchange and other hurdles., Phys. Chem. Chem. Phys. (2015) 26819–
26827. doi:10.1039/C5CP03350K.
[109] T.R. Eichhorn, Y. Takado, N. Salameh, A. Capozzi, T. Cheng, J.-N. Hyacinthe, M. Mishkovsky, C.
Roussel, A. Comment, Hyperpolarization without persistent radicals for in vivo real-time metabolic
imaging., Proc. Natl. Acad. Sci. U.S.A. 110 (2013) 18064–9. doi:10.1073/pnas.1314928110.
[110] A. Capozzi, J.-N. Hyacinthe, T. Cheng, T.R. Eichhorn, G. Boero, C. Roussel, J.J. van der Klink, A.
Comment, Photoinduced Nonpersistent Radicals as Polarizing Agents for X-Nuclei Dissolution
Dynamic Nuclear Polarization, J. Phys. Chem. C. 119 (2015) 22632–22639.
doi:10.1021/acs.jpcc.5b07315.
[111] A. Capozzi, Methods to hyperpolarize nuclear spins via dissolution and sublimation DNP at high
magnetic field, École Polytechnique Fédérale de Lausanne, 2016.
[112] M.L. Hirsch, B.A. Smith, M. Mattingly, A.G. Goloshevsky, M. Rosay, J.G. Kempf, Transport and
imaging of brute-force 13C hyperpolarization, J. Magn. Reson. 261 (2015) 87–94.
doi:10.1016/j.jmr.2015.09.017.
[113] E.R. McCarney, B.D. Armstrong, M.D. Lingwood, S. Han, Hyperpolarized water as an authentic
magnetic resonance imaging contrast agent., Proc. Natl. Acad. Sci. U. S. A. 104 (2007) 1754–1759.
doi:10.1073/pnas.0610540104.
[114] E.S.S. Hansen, K.W. Lipsø, R. Stilling, C. Laustsen, J.H. Ardenkjær-larsen, Hyperpolarized Water
Perfusion in the Porcine Brain – a Pilot Study, in: ISMRM 25st Annu. Meet. Exhib. Submitt. Abstr.,
Honolulu, USA, 2017.
[115] M.E. MacDonald, R. Frayne, Cerebrovascular MRI: a review of state-of-the-art approaches, methods
and techniques, NMR Biomed. 28 (2015) 767–91. doi:10.1002/nbm.3322.
[116] C. Ewy, E. Babcock, J. Ackerman, Deuterium nuclear magnetic resonance spin-imagin of D2O: A
potential exogenous MRI label, Magn. Reson. Imaging. 4 (1986) 407–411.

76
Appendix: Article Collection
The peer reviewed journals papers are presented on the following pages.
Papers I-IV have all been published, although Paper I only in an unformatted edition at time of
writing. Paper V is a late stage manuscript in preparation for submission.

77
Paper I

78
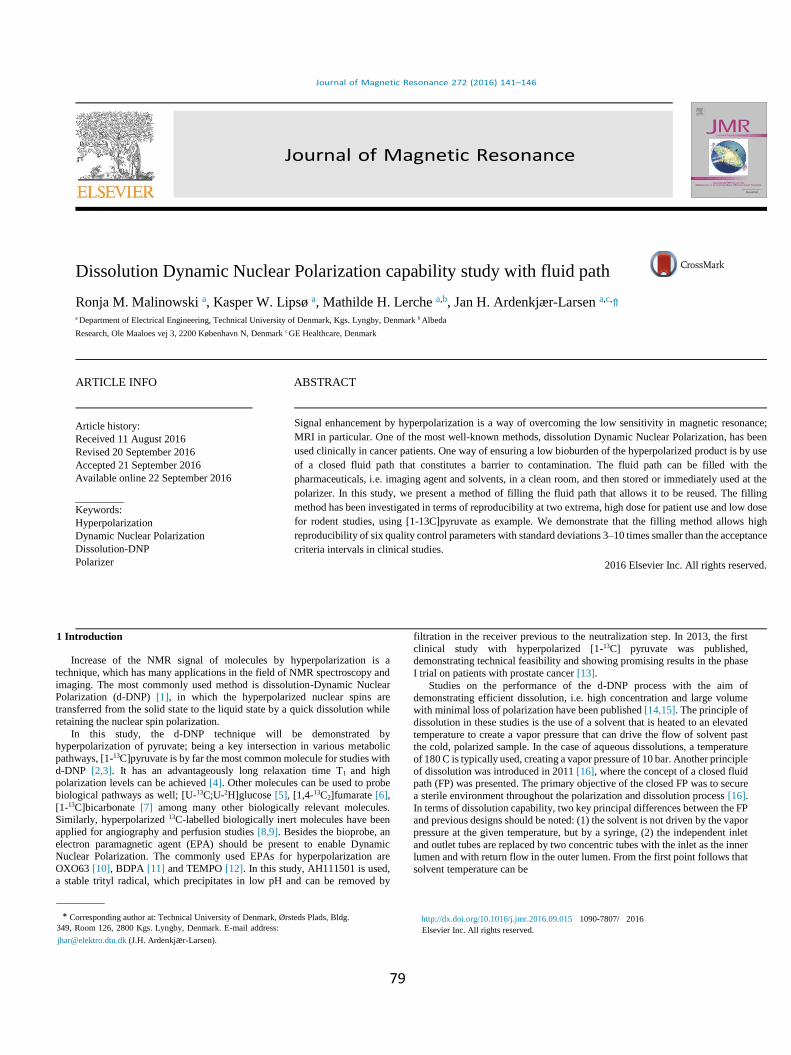
79
Dissolution Dynamic Nuclear Polarization capability study with fluid path
Ronja M. Malinowski a, Kasper W. Lipsø a, Mathilde H. Lerche a,b, Jan H. Ardenkjær-Larsen a,c,⇑
a Department of Electrical Engineering, Technical University of Denmark, Kgs. Lyngby, Denmark b Albeda
Research, Ole Maaloes vej 3, 2200 København N, Denmark c GE Healthcare, Denmark
ARTICLE INFO ABSTRACT
1 Introduction
Increase of the NMR signal of molecules by hyperpolarization is a
technique, which has many applications in the field of NMR spectroscopy and
imaging. The most commonly used method is dissolution-Dynamic Nuclear Polarization (d-DNP) [1], in which the hyperpolarized nuclear spins are
transferred from the solid state to the liquid state by a quick dissolution while
retaining the nuclear spin polarization.
In this study, the d-DNP technique will be demonstrated by hyperpolarization of pyruvate; being a key intersection in various metabolic
pathways, [1-13C]pyruvate is by far the most common molecule for studies with
d-DNP [2,3]. It has an advantageously long relaxation time T1 and high polarization levels can be achieved [4]. Other molecules can be used to probe
biological pathways as well; [U-13C;U-2H]glucose [5], [1,4-13C2]fumarate [6],
[1-13C]bicarbonate [7] among many other biologically relevant molecules. Similarly, hyperpolarized 13C-labelled biologically inert molecules have been
applied for angiography and perfusion studies [8,9]. Besides the bioprobe, an
electron paramagnetic agent (EPA) should be present to enable Dynamic Nuclear Polarization. The commonly used EPAs for hyperpolarization are
OXO63 [10], BDPA [11] and TEMPO [12]. In this study, AH111501 is used,
a stable trityl radical, which precipitates in low pH and can be removed by
filtration in the receiver previous to the neutralization step. In 2013, the first
clinical study with hyperpolarized [1-13C] pyruvate was published, demonstrating technical feasibility and showing promising results in the phase
I trial on patients with prostate cancer [13].
Studies on the performance of the d-DNP process with the aim of
demonstrating efficient dissolution, i.e. high concentration and large volume with minimal loss of polarization have been published [14,15]. The principle of
dissolution in these studies is the use of a solvent that is heated to an elevated
temperature to create a vapor pressure that can drive the flow of solvent past the cold, polarized sample. In the case of aqueous dissolutions, a temperature
of 180 C is typically used, creating a vapor pressure of 10 bar. Another principle
of dissolution was introduced in 2011 [16], where the concept of a closed fluid path (FP) was presented. The primary objective of the closed FP was to secure
a sterile environment throughout the polarization and dissolution process [16].
In terms of dissolution capability, two key principal differences between the FP and previous designs should be noted: (1) the solvent is not driven by the vapor
pressure at the given temperature, but by a syringe, (2) the independent inlet
and outlet tubes are replaced by two concentric tubes with the inlet as the inner lumen and with return flow in the outer lumen. From the first point follows that
solvent temperature can be
* Corresponding author at: Technical University of Denmark, Ørsteds Plads, Bldg. 349, Room 126, 2800 Kgs. Lyngby, Denmark. E-mail address:
[email protected] (J.H. Ardenkjær-Larsen).
http://dx.doi.org/10.1016/j.jmr.2016.09.015 1090-7807/ 2016
Elsevier Inc. All rights reserved.
Article history:
Received 11 August 2016
Revised 20 September 2016
Accepted 21 September 2016
Available online 22 September 2016
Keywords:
Hyperpolarization
Dynamic Nuclear Polarization
Dissolution-DNP
Polarizer
Signal enhancement by hyperpolarization is a way of overcoming the low sensitivity in magnetic resonance;
MRI in particular. One of the most well-known methods, dissolution Dynamic Nuclear Polarization, has been
used clinically in cancer patients. One way of ensuring a low bioburden of the hyperpolarized product is by use
of a closed fluid path that constitutes a barrier to contamination. The fluid path can be filled with the
pharmaceuticals, i.e. imaging agent and solvents, in a clean room, and then stored or immediately used at the
polarizer. In this study, we present a method of filling the fluid path that allows it to be reused. The filling
method has been investigated in terms of reproducibility at two extrema, high dose for patient use and low dose
for rodent studies, using [1-13C]pyruvate as example. We demonstrate that the filling method allows high
reproducibility of six quality control parameters with standard deviations 3–10 times smaller than the acceptance
criteria intervals in clinical studies.
2016 Elsevier Inc. All rights reserved.

80
controlled independently of solvent flow rate. In [17] it was shown that
a syringe and solvent temperature of 130 C and piston drive pressure
of 16 bar was optimal for the dissolution. These conditions are extreme
for most plastic materials, but is tolerated by e.g. polyphenylsulfones
or polyetheretherketones. The second point is expected to affect
dissolution efficiency, but was introduced to facilitate a dynamic seal
that allows sample introduction into the cryostat through an air lock
without raising the pressure of the 1 K sample space to atmospheric
pressure. The FP consists of two major parts: part A, which contains
sample and solvent, and allows the hyperpolarized solution to leave the
polarizer through an open ended tube, and part B, that consists of a
receiver connecting to the exit tube of part A, allowing non-contact
quality control of the dissolved product. Part B also includes a filter
that removes the EPA in-line with the dissolution process. The EPA
precipitates in aqueous solution at acidic pH and can be removed
effectively by mechanical filtration.
The objective of this work was to study the dissolution capability
of the FP for two different sample sizes of [1-13C]pyruvic acid. (1) A
sample of 1.47 g, producing a human dose, dissolved in dissolution
medium (DM) and neutralized with Neutralization Medium (NM) to a
target concentration of 250 mM [1-13C]pyruvate using the SPINlab
polarizer and quality control system (involving FP part A and B). (2)
A sample of 40 mg, producing a small animal dose, dissolved in DM
to a target concentration of 80 mM, using a home-built polarizer
involving only part A of the FP.
2 Materials and methods
2.1 Polarizer
Large samples were polarized on a SPINlab (GE Healthcare), Fig.
1, operating at 5 T and 0.85 K. Small samples were polarized on a home
built polarizer [1] operating at 6.7 T and 1.1–1.2 K modified to
accommodate the fluid path dissolution system.
2.2 Sample
[1-13C]pyruvic acid (PA) (GE Healthcare, Norway) containing 15
mM AH111501 (EPA), 94.9% purity (GE Healthcare, USA).
2.3 Dissolution medium (DM)
Large sample: Ultra pure water (CHROMASOLVPlus HPLC
grade, Sigma Aldrich) with 0.1 g/L ethylenediaminetetraacetic acid
disodium salt dihydrate (EDTA) (VWR).
Small sample: 0.2 M tris-hydroxymethyl aminomethane (TRIS
base) (VWR) with 0.1 g/L EDTA.
2.4 Neutralization Medium (NM)
Large samples: 0.72 M NaOH (MERCK), 0.4 M TRIS base, 0.1
g/L EDTA.
Small sample: NaOH (10 M).
2.5 Fluid path (FP)
The FP (type 1293, GE Healthcare, USA) used for this study is
shown in Fig. 1. Part A of the fluid path consists of a vial which can
hold up to 2 mL of sample, the dynamic seal that allows the tubing
to move inside the polarizer under vacuum, the co-axial tubing for
DM inlet and outlet, the valve that opens the inlet and outlet
simultaneously and the dissolution syringe that can hold up to 60
mL of solvent. Fig. 2B and C shows the vial with the position of the
inner tube. The inner tube has a nozzle to provide a more efficient
dissolution as demonstrated in [15,17]. Part B of the FP, Fig. 1,
consists of the transfer tube, the EPA filter, receiver vessel with
quality control (QC) appendage, the sterile assurance filter and a
Medrad 65 mL MR syringe (Bayer, Denmark). On first use of the
FP, the vial was attached to the outer tube by the use
Fig. 1. (A) SPINlab polarizer. The polarizer operates at 5 T and 0.9 K [16]. The polarizer has four independent channels that allow simultaneous polarization of up to four samples (fluid
paths). The QC module (cylindrical black unit) is seen to the right of the photo below the touch screen. (B) Fluid Path (FP). Part A: (1) vial, (2) dynamic seal, (3) co-axial tube, (4)
valve, (5) dissolution syringe. Part B: (6) transfer tube, (7) EPA filter, (8) receiver vessel, (9) QC appendage, (10) sterile assurance filter, (11) Medrad 65 mL MR syringe. Part A loads
into the polarizer (behind the sliding door). The vial is inserted into one of the four airlock and the dissolution syringe is inserted into the corresponding heater-pressure module. After
some pump-flush cycles, the airlock gate-valve will open and the vial can be pushed through the dynamic seal to the 0.9 K sample space. Part B is initially loaded into the corresponding
warmer module seen to the lower right in (A). Shortly before dissolution part B is moved from the warmer to the QC module.
142 R.M. Malinowski et al. /Journal of Magnetic Resonance 272 (2016) 141–146
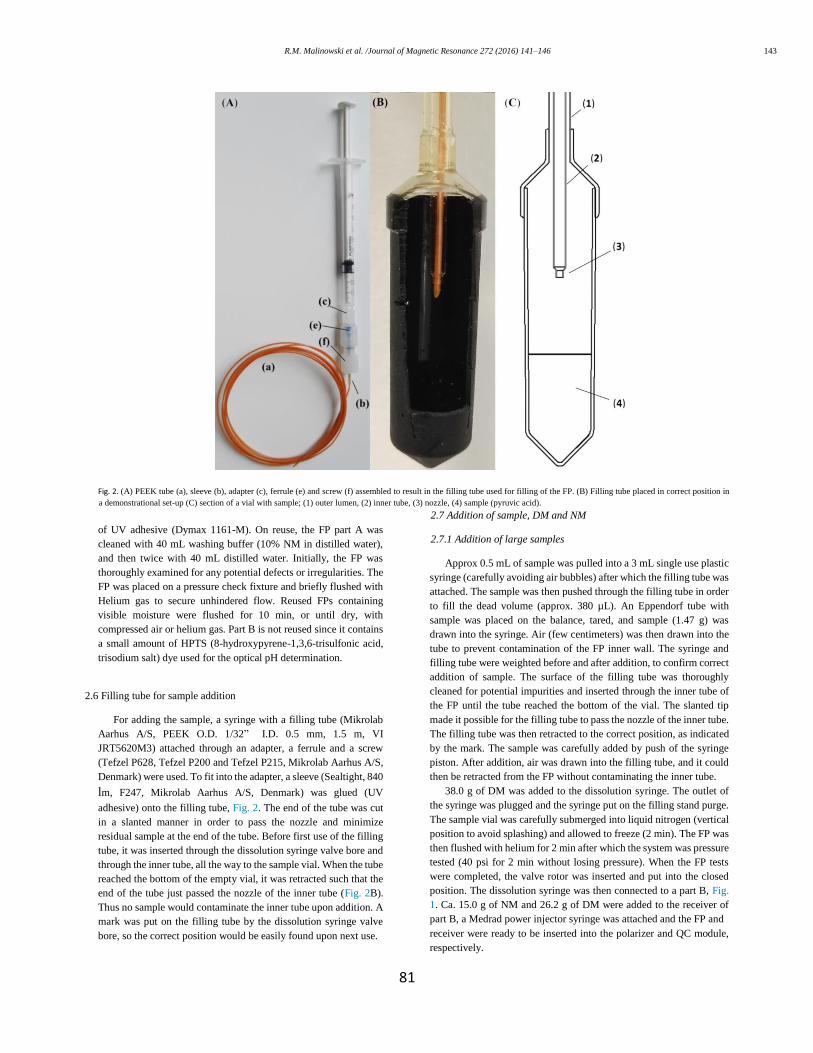
81
Fig. 2. (A) PEEK tube (a), sleeve (b), adapter (c), ferrule (e) and screw (f) assembled to result in the filling tube used for filling of the FP. (B) Filling tube placed in correct position in
a demonstrational set-up (C) section of a vial with sample; (1) outer lumen, (2) inner tube, (3) nozzle, (4) sample (pyruvic acid).
of UV adhesive (Dymax 1161-M). On reuse, the FP part A was
cleaned with 40 mL washing buffer (10% NM in distilled water),
and then twice with 40 mL distilled water. Initially, the FP was
thoroughly examined for any potential defects or irregularities. The
FP was placed on a pressure check fixture and briefly flushed with
Helium gas to secure unhindered flow. Reused FPs containing
visible moisture were flushed for 10 min, or until dry, with
compressed air or helium gas. Part B is not reused since it contains
a small amount of HPTS (8-hydroxypyrene-1,3,6-trisulfonic acid,
trisodium salt) dye used for the optical pH determination.
2.6 Filling tube for sample addition
For adding the sample, a syringe with a filling tube (Mikrolab
Aarhus A/S, PEEK O.D. 1/32” I.D. 0.5 mm, 1.5 m, VI
JRT5620M3) attached through an adapter, a ferrule and a screw
(Tefzel P628, Tefzel P200 and Tefzel P215, Mikrolab Aarhus A/S,
Denmark) were used. To fit into the adapter, a sleeve (Sealtight, 840
lm, F247, Mikrolab Aarhus A/S, Denmark) was glued (UV
adhesive) onto the filling tube, Fig. 2. The end of the tube was cut
in a slanted manner in order to pass the nozzle and minimize
residual sample at the end of the tube. Before first use of the filling
tube, it was inserted through the dissolution syringe valve bore and
through the inner tube, all the way to the sample vial. When the tube
reached the bottom of the empty vial, it was retracted such that the
end of the tube just passed the nozzle of the inner tube (Fig. 2B).
Thus no sample would contaminate the inner tube upon addition. A
mark was put on the filling tube by the dissolution syringe valve
bore, so the correct position would be easily found upon next use.
2.7 Addition of sample, DM and NM
2.7.1 Addition of large samples
Approx 0.5 mL of sample was pulled into a 3 mL single use plastic
syringe (carefully avoiding air bubbles) after which the filling tube was
attached. The sample was then pushed through the filling tube in order
to fill the dead volume (approx. 380 µL). An Eppendorf tube with
sample was placed on the balance, tared, and sample (1.47 g) was
drawn into the syringe. Air (few centimeters) was then drawn into the
tube to prevent contamination of the FP inner wall. The syringe and
filling tube were weighted before and after addition, to confirm correct
addition of sample. The surface of the filling tube was thoroughly
cleaned for potential impurities and inserted through the inner tube of
the FP until the tube reached the bottom of the vial. The slanted tip
made it possible for the filling tube to pass the nozzle of the inner tube.
The filling tube was then retracted to the correct position, as indicated
by the mark. The sample was carefully added by push of the syringe
piston. After addition, air was drawn into the filling tube, and it could
then be retracted from the FP without contaminating the inner tube.
38.0 g of DM was added to the dissolution syringe. The outlet of
the syringe was plugged and the syringe put on the filling stand purge.
The sample vial was carefully submerged into liquid nitrogen (vertical
position to avoid splashing) and allowed to freeze (2 min). The FP was
then flushed with helium for 2 min after which the system was pressure
tested (40 psi for 2 min without losing pressure). When the FP tests
were completed, the valve rotor was inserted and put into the closed
position. The dissolution syringe was then connected to a part B, Fig.
1. Ca. 15.0 g of NM and 26.2 g of DM were added to the receiver of
part B, a Medrad power injector syringe was attached and the FP and
receiver were ready to be inserted into the polarizer and QC module,
respectively.
R.M. Malinowski et al. /Journal of Magnetic Resonance 272 (2016) 141–146 143

82
2.7.2. Addition of small samples
The filling tube was cleaned, dried and attached to a 1 mL syringe.
Sample (40 µL) was placed in an Eppendorf tube, and drawn into the
filling tube as a bolus, followed by ca. 10 cm air (Supplementary data
Video 1). The filling tube was carefully inserted into the FP and pushed
to the bottom of the vial. It was then retracted 0.5 cm. The syringe was
removed, and helium was flushed through the filling tube (10 psi, 2
min) (Supplementary data Video 2). The filling tube was then removed
from the FP. 13.3 g of DM and 138 µL NM were then added to the
dissolution syringe. The FP was pressure tested as described for large
samples. A short exit tube was attached (50 cm) and the FP was ready
for being inserted into the polarizer. An empty 50 mL Falcon tube was
used as a receiver for small samples.
2.8. SPINlab QC (online measurements; large sample only)
The QC module measures six parameters by methods that are non-
contact with the product. The syringe valve is open for 10 s during the
dissolution. The dissolution takes approx. 6 s. 5 s after the syringe valve
closes, a part of the hyperpolarized sample is allowed to flow through
a series of cavities by opening a valve in the bottom of the receiver.
The QC parameters are measured in approx. 15 s, which means that the
product (in the Medrad syringe) is released approx. 30 s after the
dissolution is initiated. Pyruvate concentration is determined by
absorbance at 360 nm, EPA concentration is determined by absorbance
at 470 nm, pH is determined by ratio metric absorbance at 405 and 450
nm for a hydroxypyrene-1,3,6-trisulfonic acid (HPTS) dye in one of
the cavities, polarization is measured by NMR and corrected for
relaxation, temperature is measured by IR on the receiver and volume
is a capacitance threshold sensor on the Medrad syringe. The QC
module was calibrated prior to the experiments. Pyruvate
concentration, EPA concentration and pH all required measurement of
a dark, blank and several calibrants (GE Healthcare, USA) according
to manufacturer’s instructions. Polarization and flip angle calibration
were performed by the use of a 13C reference sample (13C3glycerol
doped to shorten T1, QC daily check sample, GE Healthcare, USA)
according to manufacturer’s instructions. Temperature was calibrated
by the use of a receiver filled with water of known temperature.
2.9. Offline measurements
pH: LAQUA pH/ION meter F-72 (HORIBA) with pH electrode DJ
113662-1385 (VWR) or Knick Portamess pH-meter 913 with pH
electrode Hamilton mini electrode (KLC). Polarization: measured on a
400 MHz NMR (Agilent Technologies, USA). Acquisition parameters:
3 flip angle every 2 s, starting approx. 10 s post dissolution. The
thermal signal was acquired by adding Omniscan (15 lL) to reduce T1
to <1 s. 2000 averages with repetition delay 0.5 s, 3 flip angle. Software
for analysis: MestReNova 10.0 and MATLAB R2015a, by which
polarization and T1 were calculated. PA concentration: For large
samples the concentration was measured by quantitative NMR.
Sample: sample from receiver (450 µL), [13C]urea (15 µL, 400 mM),
D2O (100 µL) and Omniscan (15 µL). Acquisition parameters: 90 flip
angle, repetition delay 1.5 s. Software for analysis: TopSpin 3.2. For
small samples the concentration was measured by absorbance on a
BioTek EPOCH 2 microplate reader (Holm & Halby, Brøndby,
Denmark) at wavelength 360 nm. Temperature was measured by the
use of thermometers of type OMEGA HH804U Thermometer or Testo
110, AG Germany. EPA concentration: measured by absorbance at 465
nm (EPOCH plate reader with 10 mm cell). Output volumes were
measured by weighing
an empty Falcon tube before and after dissolution (Discovery Ohaus
balance).
3. Results
3.1. Large samples
Eleven experiments were performed using four FP. The samples
were polarized for 2.5 h on average to more than 90% of maximum
polarization, followed by dissolution. The data from the QC module
have been compared to offline measurements of the respective
samples, Table 1. To secure a physiological acceptable pH, the NM
in the receiver was adjusted accordingly to the amount of PA added
(PA/NaOH ratio 1.6), which was in the range of 13.9– 14.6 g. The
target concentration in the case of large samples was 250 mM,
which mimics a human dose.
3.2. Small samples
To demonstrate filling of small samples, seven experiments
were performed, Table 2, using the same four FP as in the large
sample study. The experiments were designed to mimic a target
concentration, suitable for small animal dose (80 mM). Polarization
measurements were made for four of these.
4. Discussion
The study shows that the new filling method of the FP can be
performed in a reproducible manner, validated by QC parameters
from the SPINlab and offline measurements. The method is robust
with small relative standard deviations. We have demonstrated two
extreme conditions; filling of large samples mimicking a human
clinical dose, and small samples suited for small animal studies.
For the human dose, base is added to the receiver, in order for the
radical to precipitate and be filtered off before entering the receiver.
Table 1
Results from dissolutions compared to the respective off-line measurements (n =11)
*The NMR flip angle was incorrectly calibrated in the first experiments leading to
saturation of the receiver and incorrect estimation of the polarization.
144 R.M. Malinowski et al. /Journal of Magnetic Resonance 272 (2016) 141–146
Average Standard
deviation Relative STD (%)
PA/EPA added (g) 1.47 0.02 1.4
DM in syringe (g) 38.0 0.1 DM in receiver (g) 25.8 0.3 1.0
NM in receiver (g) 14.3 0.2 1.4
PA/NaOH mol ratio 1.6 0.002 0.1
Online results Pyruvate conc. (mM)
246 19 7.7 pH 7.71 0.17 2.2 EPA conc. (µM) 1.17 0.28 24
Temperature (C) 32.0 1.3 4.0
Volume (mL) >40 mL Polarization (%) 34.2 2.9 (n = 3)* 8.5
Offline results Pyruvate conc. (mM)
247
8.3 pH 7.75 0.15 1.9 EPA conc. (µM) 0.68 0.21 31
Volume (mL) (product in Medrad
syringe) 44.2 1.0 2.3
Temperature (C) 31.7 0.5 1.6
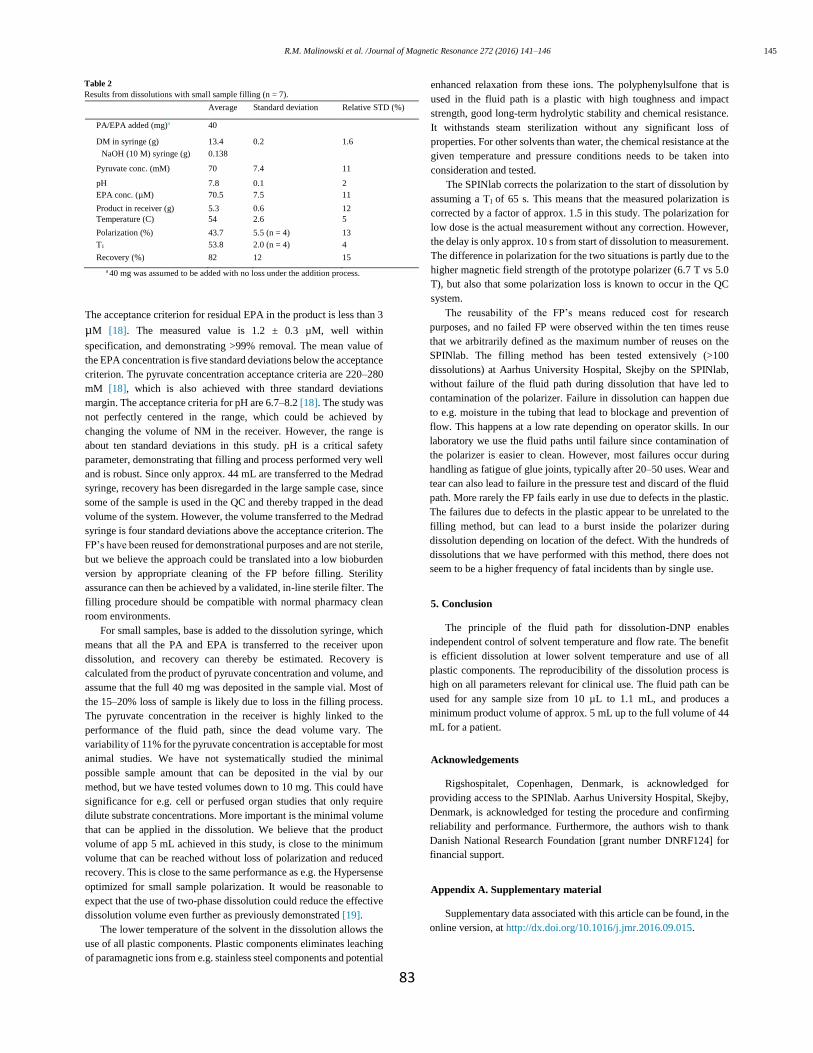
83
Table 2 Results from dissolutions with small sample filling (n = 7).
Average Standard deviation Relative STD (%)
PA/EPA added (mg)a 40
DM in syringe (g) 13.4 0.2 1.6 NaOH (10 M) syringe (g) 0.138
Pyruvate conc. (mM) 70 7.4 11
pH 7.8 0.1 2 EPA conc. (µM) 70.5 7.5 11
Product in receiver (g) 5.3 0.6 12 Temperature (C) 54 2.6 5
Polarization (%) 43.7 5.5 (n = 4) 13 T1 53.8 2.0 (n = 4) 4
Recovery (%) 82 12 15
a 40 mg was assumed to be added with no loss under the addition process.
The acceptance criterion for residual EPA in the product is less than 3
µM [18]. The measured value is 1.2 ± 0.3 µM, well within
specification, and demonstrating >99% removal. The mean value of
the EPA concentration is five standard deviations below the acceptance
criterion. The pyruvate concentration acceptance criteria are 220–280
mM [18], which is also achieved with three standard deviations
margin. The acceptance criteria for pH are 6.7–8.2 [18]. The study was
not perfectly centered in the range, which could be achieved by
changing the volume of NM in the receiver. However, the range is
about ten standard deviations in this study. pH is a critical safety
parameter, demonstrating that filling and process performed very well
and is robust. Since only approx. 44 mL are transferred to the Medrad
syringe, recovery has been disregarded in the large sample case, since
some of the sample is used in the QC and thereby trapped in the dead
volume of the system. However, the volume transferred to the Medrad
syringe is four standard deviations above the acceptance criterion. The
FP’s have been reused for demonstrational purposes and are not sterile,
but we believe the approach could be translated into a low bioburden
version by appropriate cleaning of the FP before filling. Sterility
assurance can then be achieved by a validated, in-line sterile filter. The
filling procedure should be compatible with normal pharmacy clean
room environments.
For small samples, base is added to the dissolution syringe, which
means that all the PA and EPA is transferred to the receiver upon
dissolution, and recovery can thereby be estimated. Recovery is
calculated from the product of pyruvate concentration and volume, and
assume that the full 40 mg was deposited in the sample vial. Most of
the 15–20% loss of sample is likely due to loss in the filling process.
The pyruvate concentration in the receiver is highly linked to the
performance of the fluid path, since the dead volume vary. The
variability of 11% for the pyruvate concentration is acceptable for most
animal studies. We have not systematically studied the minimal
possible sample amount that can be deposited in the vial by our
method, but we have tested volumes down to 10 mg. This could have
significance for e.g. cell or perfused organ studies that only require
dilute substrate concentrations. More important is the minimal volume
that can be applied in the dissolution. We believe that the product
volume of app 5 mL achieved in this study, is close to the minimum
volume that can be reached without loss of polarization and reduced
recovery. This is close to the same performance as e.g. the Hypersense
optimized for small sample polarization. It would be reasonable to
expect that the use of two-phase dissolution could reduce the effective
dissolution volume even further as previously demonstrated [19].
The lower temperature of the solvent in the dissolution allows the
use of all plastic components. Plastic components eliminates leaching
of paramagnetic ions from e.g. stainless steel components and potential
enhanced relaxation from these ions. The polyphenylsulfone that is
used in the fluid path is a plastic with high toughness and impact
strength, good long-term hydrolytic stability and chemical resistance.
It withstands steam sterilization without any significant loss of
properties. For other solvents than water, the chemical resistance at the
given temperature and pressure conditions needs to be taken into
consideration and tested.
The SPINlab corrects the polarization to the start of dissolution by
assuming a T1 of 65 s. This means that the measured polarization is
corrected by a factor of approx. 1.5 in this study. The polarization for
low dose is the actual measurement without any correction. However,
the delay is only approx. 10 s from start of dissolution to measurement.
The difference in polarization for the two situations is partly due to the
higher magnetic field strength of the prototype polarizer (6.7 T vs 5.0
T), but also that some polarization loss is known to occur in the QC
system.
The reusability of the FP’s means reduced cost for research
purposes, and no failed FP were observed within the ten times reuse
that we arbitrarily defined as the maximum number of reuses on the
SPINlab. The filling method has been tested extensively (>100
dissolutions) at Aarhus University Hospital, Skejby on the SPINlab,
without failure of the fluid path during dissolution that have led to
contamination of the polarizer. Failure in dissolution can happen due
to e.g. moisture in the tubing that lead to blockage and prevention of
flow. This happens at a low rate depending on operator skills. In our
laboratory we use the fluid paths until failure since contamination of
the polarizer is easier to clean. However, most failures occur during
handling as fatigue of glue joints, typically after 20–50 uses. Wear and
tear can also lead to failure in the pressure test and discard of the fluid
path. More rarely the FP fails early in use due to defects in the plastic.
The failures due to defects in the plastic appear to be unrelated to the
filling method, but can lead to a burst inside the polarizer during
dissolution depending on location of the defect. With the hundreds of
dissolutions that we have performed with this method, there does not
seem to be a higher frequency of fatal incidents than by single use.
5. Conclusion
The principle of the fluid path for dissolution-DNP enables
independent control of solvent temperature and flow rate. The benefit
is efficient dissolution at lower solvent temperature and use of all
plastic components. The reproducibility of the dissolution process is
high on all parameters relevant for clinical use. The fluid path can be
used for any sample size from 10 µL to 1.1 mL, and produces a
minimum product volume of approx. 5 mL up to the full volume of 44
mL for a patient.
Acknowledgements
Rigshospitalet, Copenhagen, Denmark, is acknowledged for
providing access to the SPINlab. Aarhus University Hospital, Skejby,
Denmark, is acknowledged for testing the procedure and confirming
reliability and performance. Furthermore, the authors wish to thank
Danish National Research Foundation [grant number DNRF124] for
financial support.
Appendix A. Supplementary material
Supplementary data associated with this article can be found, in the
online version, at http://dx.doi.org/10.1016/j.jmr.2016.09.015.
R.M. Malinowski et al. /Journal of Magnetic Resonance 272 (2016) 141–146 145
84
References
[1] J.H. Ardenkjær-Larsen, B. Frindlund, A. Gram, G. Hansson, L. Hansson, M.H.
Lerche, R. Servin, M. Thaning, K. Golman, Increase in signal-to-noise ratio of
>10,000 times in liquid state NMR, PNAS 100 (18) (2003) 10158–10163. [2] S. Kohler, Y. Yen, J. Wolber, A. Chen, M. Albers, R. Bok, V. Zhang, J. Tropp,
S. Nelson, D. Vigneron, J. Kurhanewicz, R. Hurd, In vivo 13 carbon metabolic
imaging at 3 T with hyperpolarized 13C-1-pyruvate, Magn. Reson. Med. 58
(2007) 65–69. [3] H. Gutte, A.E. Hansen, H.H. Johannesen, A.E. Clemmensen, J.H.
ArdenkjærLarsen, C.H. Nielsen, K. Andreas, The use of dynamic nuclear
polarization (13) C-pyruvate MRS in cancer, Am. J. Nucl. Med. Mol. Imaging
5 (2015) 548–560. [4] K. Golman, R. in’t Zandt, M. Lerche, R. Pehrson, J.H. Ardenkjaer-Larsen,
Metabolic imaging by hyperpolarized 13C magnetic resonance imaging for in
vivo tumor diagnosis, Cancer Res. 66 (22) (2006) 10855–10860. [5] S. Meier, P.R. Jensen, J.Ø. Duus, Real-time detection of central carbon
metabolism in living Escherichia coli and its response to perturbations, FEBS
Lett. 585 (2011) 3133–3138. [6] F.A. Gallagher, M.I. Kettunen, D.-E. Hu, P.R. Jensen, R. in’t Zandt, M.
Karlsson, A. Gisselsson, S.K. Nelson, T.H. Witney, S.E. Bohndiek, G. Hansson,
T. Peitersen, M. H. Lerche, K.M. Brindle, Production of hyperpolarized [1,4-13C2]malate from [1,4-13C2]fumarate is a marker of cell necrosis and treatment
response in tumors, PNAS 106 (47) (2009) 19801–19806. [7] F.A. Gallagher, M.I. Kettunen, K.M. Brindle, Imaging pH with hyperpolarized
13C, NMR Biomed. 24 (2011) 1006–1015. [8] C. von Morze, P.E. Larson, S. Hu, H.A. Yoshihara, R.A. Bok, A. Goga, J.H.
Ardenkjær-Larsen, D.B. Vigneron, Investigating tumor perfusion and
metabolism using multiple hyperpolarized 13C compounds: HP001, pyruvate
and urea, Magn. Reson. Imaging 30 (2012) 305–311. [9] K.W. Lipsø, P. Magnusson, J.H. Ardenkjær-Larsen, Hyperpolarized 13C MR
angiography, Curr. Pharm. Des. 22 (2016) 90–95. [10] J. Ardenkjaer-Larsen, S. Macholl, H. Jóhanneson, Dynamic nuclear polarization
with trityls at 1.2 K, Appl. Magn. Reson. 34 (2008) 509–522. [11] L. Lumata, S.J. Ratnakar, A. Jindal, M. Merritt, A. Comment, C. Malloy, A.D.
Sherry, Z. Kovacs, BDPA: an efficient polarizing agent for fast dissolution
dynamic nuclear polarization NMR spectroscopy, Chem. Eur. J. 17 (2011)
10825–10827. [12] B.v.d. Brandt, E. Bunyatova, P. Hautle, J. Konter, DNP with the free radicals
deuterated TEMPO and deuterated oxo-TEMPO, Nucl. Instrum. Meth. A 526
(2004) 53–55. [13] S.J. Nelson, J. Kurhanewicz, D.B. Vigneron, P.E.Z. Larson, A.L. Harzstark, M.
Ferrone, M. van Criekinge, J.W. Chang, R. Bok, I. Park, G. Reed, V.K.
Weinberg, J. H. Ardenkjær-Larsen, A.P. Chen, R.E. Hurd, L.-I. Odegardstuen,
F.J. Robb, J. Tropp, J.A. Murray, Metabolic imaging of patients with prostate
cancer using hyperpolarized [1-13C]pyruvate, Sci. Transl. Med. 5 (198) (2013)
1–11. [14] A. Comment, J. Rentsch, F. Kurdzesau, S. Jannin, K. Uffmann, R. van Heeswijk,
P. Hautle, J. Konter, B. van den Brandt, J. van der Klink, Producing over 100
ml of highly concentrated hyperpolarized solution by means of dissolution DNP,
J. Magn. Reson. 194 (2008) 152–155. [15] S. Bowen, J.H. Ardenkjaer-Larsen, Enhanced performance large volume
dissolution-DNP, J. Magn. Reson. 240 (2014) 90–94. [16] J.H. Ardenkjær-Larsen, A.M. Leach, N. Clarke, J. Urbahn, D. Anderson, T.W.
Skloss, Dynamic nuclear polarization polarizer for sterile use intent, NMR
Biomed. 24 (2011) 927–932.
[17] J. Jain, S. Dey, L. Muralidharan, A.M. Leach, J.H. Ardenkjær-Larsen, Jet
impingement melting with vaporization: a numerical study, in: ASME Heat
Transfer Summer Conference, Jacksonville, Florida, 2008. [18] ‘‘Hyperpolarized [13C] Pyruvate Documentation Page,” National Cancer
Institute – the National Institute of Health, (Online), Available: <http://
imaging.cancer.gov/programsandresources/cancer-tracer-
synthesisresources/hyperpolarized-C13-pyruvate-documentation> (accessed
28.06.2016). [19] T. Harris, C. Bretschneider, L. Frydman, Dissolution DNP NMR with solvent
mixtures: substrate concentration and radical extraction, J. Magn. Reson. 211
(2011) 96–100, http://dx.doi.org/10.1016/j.jmr.2011.04.001.
146 R.M. Malinowski et al. /Journal of Magnetic Resonance 272 (2016) 141–146

85
Paper II

86
87
Journal of Magnetic Resonance
Large dose hyperpolarized water with dissolution-DNP at high
magnetic field
Kasper Wigh Lipsø1, Sean Bowen1, Oleksandr Rybalko1 and Jan Henrik Ardenkjær-Larsen1,2
1Department of Electrical Engineering, Technical University of Denmark, Kgs. Lyngby, Denmark.
2GE Healthcare, Brøndby, Denmark.
In Press, Accepted Manuscript
Available online 18 November 2016
_________________________________________________________________________________
Abstract
We demonstrate a method for the preparation of hyperpolarized water by dissolution Dynamic
Nuclear Polarization at high magnetic field. Protons were polarized at 6.7 T and 1.1 K to >70% with
frequency modulated microwave irradiation at 188 GHz. 97.2 ± 0.7% of the radical was extracted
from the sample in the dissolution in a two-phase system. 16 ± 1 mL of 5.0 M 1H in D2O with a
polarization of 13.0 ± 0.9% in the liquid state was obtained, corresponding to an enhancement
factor of 4,000 ± 300 compared to the thermal equilibrium at 9.4 T and 293 K. A longitudinal
relaxation time constant of 16 ± 1 s was measured.
The sample was polarized and dissolved in a fluid path compatible with clinical polarizers. The
volume of hyperpolarized water produced by this method enables angiography and perfusion
measurements in large animals, as well as NMR experiments for studies of e.g. proton exchange
and polarization transfer to other nuclei.
Keywords: hyperpolarized water; dissolution-DNP; hyperpolarization
_________________________________________________________________________________
Corresponding author and Reprint info: Jan Henrik Ardenkjær-Larsen, DTU Electrical Engineering,
Ørsteds Plads, Building 349, room 126, 2800 Kgs. Lyngby, Denmark. Tel (0045) 4525 3918. E-mail:
Grant support: This work was supported by the Danish Research Council [grant number 12-
127232] and the Danish National Research Foundation [grant number DNRF124].
The authors confirm that this article content has no conflict of interest.

88
Graphical Abstract
Highlights:
16 mL of 5.0 M 1H in D2O is hyperpolarized to 13% with a T1 of 16 s.
Solid state polarization of 71.5% at 6.7 T with a time constant of 23 min using dynamic
nuclear polarization with frequency modulation.
Dissolution in a two-phase system of D2O and organic solvents yields rapid radical
extraction of 97.2% ± 0.7%.
89
Introduction
NMR is an important analytical tool for e.g. structure analysis, chemical quantification, and investigation of
biochemical pathways. Similarly, MRI is a valuable and safe diagnostic tool in medical applications. However,
both techniques share a key weakness – poor sensitivity caused by low polarization of nuclear spins.
Through the use of hyperpolarization, the signal can be enhanced by several orders of magnitude; leading
directly to an increase in sensitivity. This increase in signal obviates the need for time-consuming signal
averaging, permitting real-time experiments with unprecedented time resolution. An especially promising
application of this capability is the study of chemical and biochemical reactions both in vitro and in vivo.
The field of dissolution-Dynamic Nuclear Polarization (d-DNP) has developed rapidly since the first
demonstration in 2003 [1]. The main focus has been on hyperpolarization of 13C nuclei for metabolic
imaging, where preclinical studies of hyperpolarized 13C labelled pyruvic acid was injected for
characterization of cancer [2–4] or other metabolic diseases in animal models [5,6]. Hyperpolarization has
also been used for angiographic and perfusion imaging [7–9] with agents that are not metabolically active.
Concurrently, hyperpolarized 13C has been applied for signal enhancement in NMR experiments, such as
kinetic studies of metabolism [10–12] or structure analysis of biochemical compounds [13,14].
In recent years, the interest in hyperpolarization of protons diluted in heavy water has increased [15,16].
Due to the high gyromagnetic ratio of the proton and the high proton concentration in water, the
achievable magnetization may exceed what is possible with hyperpolarized 13C or other nuclei.
Furthermore, hyperpolarized proton imaging is facilitated by already existing MRI coils and sequences, in
contrast to hyperpolarized 13C that requires non-standard equipment. In one approach, water, polarized by
the Overhauser effect at 0.35 T, was applied for MRI [17,18]. However, the Overhauser effect typically
achieves an enhancement of 100 times at 0.35 T for pure water, corresponding to a polarization of only
0.001%. Secondly, the short T1 of pure water, 3.6 s, limits the available time window significantly. Both of
these limitations can be overcome by d-DNP. A 3.35 T HyperSense polarizer was used to produce
angiographic images in the rat venous system and head with 1H polarization of 3.5% and 1H concentration of
3.9 M [19], and hyperpolarized water has been used for signal enhancement in NMR experiments [20,21].
Hyperpolarized protons have been applied to enhance the inherent low sensitivity of larger biomolecules,
and proton exchange has facilitated increased sensitivity leading to large reduction in scan time [22], or to
accommodate studies of protein-ligand interactions for drug discovery [23]. Polarization, dissolution and
radical extraction for water/DMSO-d6 samples was shown to give polarization of approximately 25% and T1
> 40 s [24]. 6% proton polarization and T1 of >36 s has been demonstrated by attaching nitroxide radicals to
polymer-based backbones that could be filtered out at dissolution [25].

90
In this work we study the hyperpolarization of 1H in D2O with d-DNP at 6.7 T and 1.2 K using the fluid path of
[26]. The aim of the study was to investigate the polarization and dissolution at these experimental
conditions.
Theory
DNP relies on the presence of electron spins, from which polarization is transferred to nuclear spins by
microwave (MW) irradiation. An increase in performance has recently been demonstrated when the MW
field is frequency modulated [27,28]. The unpaired electron spins are typically added to the system in the
form of stable organic radicals such as nitroxides or trityls. Paramagnetic species, such as radicals, efficiently
promote nuclear spin relaxation, yet they are a key requirement in the DNP process. A key challenge in
dissolution-DNP is supplying sufficient paramagnetic agent to perform DNP, without negatively influencing
the relaxation properties of the sample after dissolution. This trade-off is more pronounced due to the high
gyromagnetic ratio of 1H that renders it more susceptible to paramagnetic relaxation. Hence, the radical
should be segregated from the nuclei upon serving its purpose.
Nitroxides are well suited for DNP of protons due to their broad electron paramagnetic resonance (EPR)
lines [29]. With a reported relaxation rate contribution of 0.55 s-1 mM-1 at 25 °C in low field [30], the
dissolved sample would lose the enhanced polarization in a few seconds with the radical present. Thus,
radical extraction is a crucial element for achieving long T1 and, ultimately, high polarization after the
dissolution and transfer process. Small animal angiography with hyperpolarized water has been
demonstrated in a 3.35 T polarizer [19], where the radical induced relaxation was eliminated by scavenging
with ascorbic acid, as demonstrated earlier in [31]. However, the ascorbic acid needs to be hundreds of mM
to quench the radical effectively, and the quenching process takes a significant amount of time, during
which relaxation occurs. Furthermore, the ascorbic acid undergoes thermal degradation that leads to
browning during the solvent heating process, complicating the process further. Hence, we describe a system
where the nonpolar nitroxide radical is rapidly extracted into an organic phase immediately after
dissolution, as previously demonstrated in [32].
In addition, the T1 is sensitive to the proton concentration. A high proton concentration will enhance the
final magnetization, but will concurrently increase the dipolar relaxation between proton nuclei, and thus
cause faster relaxation. A proton concentration of 5.0 M is determined to achieve a high signal in the
injectable sample, giving rise to a relaxation rate contribution of less than 0.04 s-1 at 21.5 °C [33]. A final
relaxation contributor is the temperature, where a warmer sample will have higher proton diffusivity, and
thus retain polarization longer, within the relevant temperature range [34].
91
Rapid dissolution and radical extraction are crucial for maintaining a high solution state polarization. We
accelerate the dissolution by addition of Nonafluorobutyl methyl ether (NFBME) with boiling point of 60 °C
and density ρ = 1.529 g/mL to the dissolution medium syringe. The low boiling point results in a high
pressure to drive the flow in the fluid path, and the density ensures that the sample will be dissolved and
diluted in D2O rapidly, and that the denser NFBME will follow, due to the vertically aligned, upwards facing
syringe. Another feature of addition of an immiscible solvent in the dissolution medium syringe is reduction
of variation in the volume reaching the sample, because all dissolution medium is flushed out of the tubes,
while the dead volume consists of the organic solvent only.
The oxygen in the system originating from air in the fluid path and dissolved in the solvents contributes to
the relaxation rate with 0.0094 L/mg/s [35]. The concentration of dissolved oxygen in air saturated water at
25 °C is around 8.6 mg/L, which leads to a relaxation rate contribution of 0.081 s-1. The corresponding
oxygen concentrations in heptane and NFBME, are a factor of 10 and 20 higher, respectively [36,37]. The
system thus requires degassing of the solvents, as well as flushing of the entire fluid path and receiver
system with inert gas.
Radiation damping: The precession of the transverse magnetization of the protons after excitation induces a
current in the NMR coil that contributes to restoring the magnetization to the longitudinal direction.
Considering the large magnetization of hyperpolarized water protons, this mechanism will have a significant
effect on the transverse relaxation rate. In addition to the magnetization, the contribution to the reduced
time constant of the free-induction-decay (FID) is affected by parameters such as the Q-factor and the filling
factor of the coil [38], or it can be treated by the reciprocity principle [39]. The observable transverse
relaxation time 𝑇2𝑜𝑏𝑠 is given by
1
𝑇2𝑜𝑏𝑠 =
1
𝑇2∗ +
1
𝜏𝑅𝐷, where 𝑇2
∗ is the time constant of the FID in the absence of
radiation damping (typically due to field inhomogeneity) and τRD is the radiation damping time constant. We
show that the radiation time constant, τRD, can be used as a measure of polarization, with a series of
concentration dependent, thermally polarized radiation damping time constants as reference. The method
complements quantification of polarization by comparison of integrals for spectra that are hyperpolarized
and at thermal equilibrium.
Methods
DNP: All experiments were performed using a homebuilt DNP polarizer (6.7 T magnet from Magnex, Oxford,
UK) with a flow-type variable temperature insert. The DNP probe was conceptually based on the idea
introduced in 2003 [1]. Microwaves were provided by a microwave source VCOM-10/94-WPT (ELVA-1, St.
Petersburg, Russia) and a 200X2R4 frequency doubler (VDI, Charlottesville, VA, USA), which provided an
92
output power of 55 mW at 188 GHz. The source had a tuning range of ±0.6 GHz. The output power after
transmission through the 800 mm circular waveguide and the microwave window [40] was measured to 5 ±
1 mW using a horn and an Ericsson power meter (VDI, Charlottesville, VA, USA). Solid state NMR was
performed with a saddle coil formed around a polytetrafluoroethylene (PTFE) former connected to a
nonmagnetic coaxial cable (type Stainless Steel 304/Beryllium Copper, SCB Service and Consulting, Neuss,
Germany) and a tune and match box. NMR measurements were performed with a Varian INOVA console
(Palo Alto, CA, USA). The polarizer was fitted with a heater-pressure module, airlock and insertion module
to allow use of the fluid path (both described in [26]). The microwave frequency was sinusoidally swept with
a rate of fmod and amplitude amod. The samples were polarized for 60 min.
Solid state NMR: The build-up of polarization was monitored by acquisition of NMR spectra every 120 s
from initiation of MW irradiation. A pulse of 1 µs at 2.7 W corresponding to a flip angle of approximately
0.3° was used for excitation, and 1024 complex points with a spectral width of 5 MHz were acquired. Short
MW frequency sweeps were measured with the same parameters, except only with 60 s between each MW
frequency step and increased receiver gain. The magnetization was saturated before each MW frequency
step by a train of 3000 pulses of 30° flip angle. Long MW frequency sweeps were monitored for one hour at
each MW frequency. The NMR signal was destroyed by a train of saturating pulses before each build-up
(MW frequency), and then measured every 120 s. Similar for long MW power sweeps. The build-up curve
for each MW frequency or power setting was fitted to a mono-exponential function to obtain asymptotic
value and time constant. Polarization was quantified by allowing a 30 mM water/glycerol sample to polarize
towards thermal equilibrium in the magnetic field at 1.12 K over 19 h, and fitting of the build-up curve of
spectra acquired every 300 s. The background signal from the DNP probe was measured with an empty
sample cup and subtracted from the data to determine the thermal signal from the sample. 100 kHz
exponential line broadening was applied to the data, which were analyzed in MATLAB (Mathworks, Natick,
MA, USA).
Sample preparation: Solutions of 20 and 30 mM TEMPO (2,2,6,6-Tetramethylpiperidine 1-oxyl, 98%, Sigma
Aldrich, Denmark) in H2O/glycerol (both Sigma Aldrich, Denmark) 1:1 (w/w), and 30 mM TEMPO in
H2O/DMSO-d6 (Dimethyl sulfoxide-d6, Sigma Aldrich, Denmark) 1:1 (w/w), was prepared. Dissolution
medium consisted of D2O (99.90%, Euriso-top, Saint-Aubin, France) with 1 mM calcium disodium
ethylenediaminetetraacetic acid (EDTA) and 9 g/L NaCl. Sodium chloride was added to provide an isotonic
solution.
Fluid path filling: The fluid path consists of a syringe, two concentric tubes leading to a sample vial and an
exit tube. The dissolution medium is heated in the syringe, and transferred via the inner tube to the sample
93
vial for dissolution of the sample, before being flushed back to the syringe via the outer lumen and a three-
way valve. The exit tube leads the dissolved sample from the syringe valve to a receiver.
The 1100 mg (~1 mL) sample was injected into the sample vial by the large sample filling method introduced
in [41]. This procedure resulted in actual sample mass of 1099.8 ±12.6 mg (N = 5). 7.6 g (5 mL) NFBME
(≥99%, Sigma Aldrich, Denmark) and 17.72 g (16 mL) dissolution medium was filled in the syringe and
degassed by bubbling with helium gas for 10 minutes by inserting a tube through an adapter that led the
moist gas away from the fluid path openings. In experiments without NFBME, another 12 mL of dissolution
medium was added. The fluid path syringe was closed off before freezing the sample vial in liquid nitrogen
for 2 minutes to avoid cryo pumping of moisture into the fluid path. Samples to be degassed were exposed
to vacuum and sealed off before melting and sonicating the sample vial. The sample was frozen again; the
cycle was repeated three times (freeze-pump-thaw). After freezing, the fluid path was flushed with helium
gas for 2 minutes to remove air and provide a helium atmosphere. The sample vial was rapidly transferred
from the liquid nitrogen bath to the polarizer.
Dissolution: The syringe was inserted into a heater/pressure module, where the dissolution medium and
NFBME were heated to a temperature of 130 °C over 30 min at 2.75 bar. The sample was raised 140 mm out
of the helium bath before the dissolution medium syringe three-way valve was switched, releasing the
piston in the syringe driven with 16 bar pressure. The 50 cm outlet tube was inserted into a closed 150 mL
separatory funnel containing 25 mL degassed heptane (≥99%, Sigma Aldrich, Denmark), which was shaken
vigorously during dissolution and a further 10 s. The aqueous phase was drawn into a syringe, and 1.5 mL
was rapidly injected into an injection line entering a 5 mm NMR tube situated in the NMR spectrometer,
which had been flushed with helium gas and sealed before the experiment. The dead volume of the
injection line was 0.6 mL. Temperature was measured with an RTD thermometer (OMEGA HH804U,
Stamford, CT, USA) within 30 s from dissolution.
Liquid state NMR: NMR measurements of the dissolved sample were performed on a 400 MHz
spectrometer (Agilent, Palo Alto, CA). A series of 200 spectra were acquired at 1 s intervals with 31200
points, sweep width of 50 kHz and a 1° flip angle of pulse length 1 µs at approximately 0.4 W. The integral
was measured as the first point in the FID, and the decay was fitted to estimate the radiation damping time
constant. A spectrum of the fully relaxed sample with identical acquisition parameters was measured to
quantify the enhancement factor, and thus polarization. The longitudinal relaxation time constant, T1, was
obtained from the decay of the hyperpolarized signal. The T1 for the same sample was subsequently
confirmed by measuring the NMR signal build-up at 9.4 T when quickly inserting the nonpolarized (earth
field) sample. from the build-up of the magnetization after relaxation outside the magnet. Quantitative
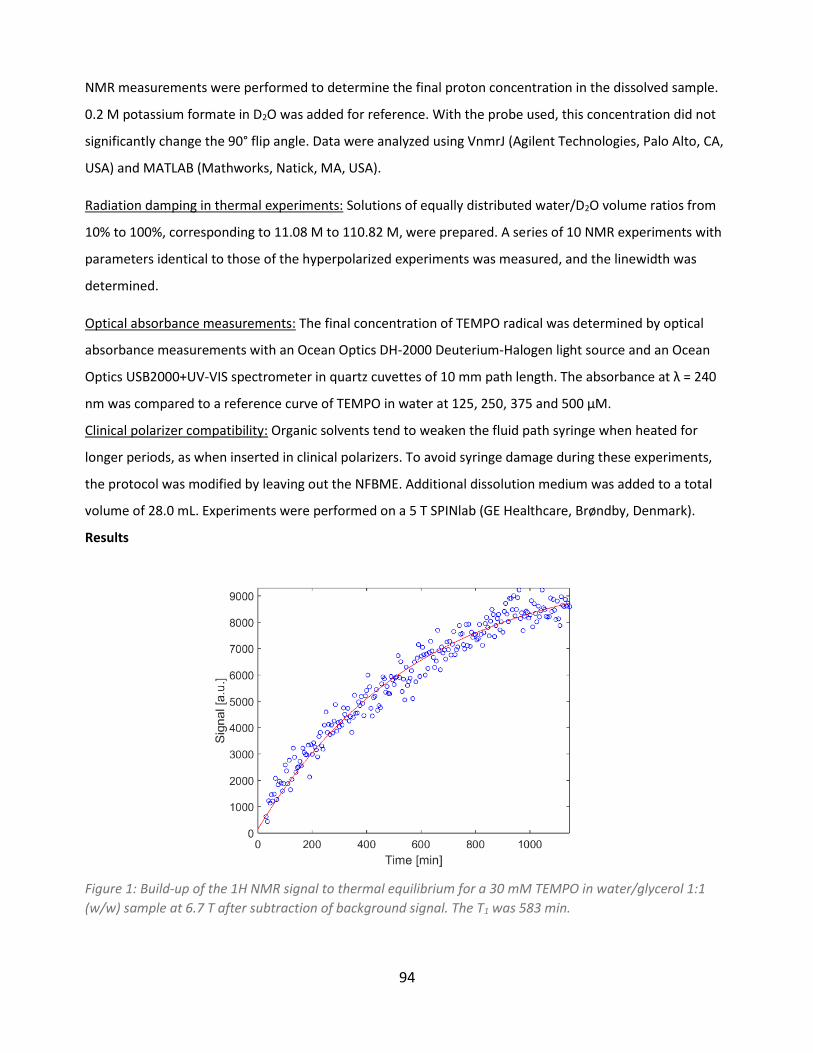
94
NMR measurements were performed to determine the final proton concentration in the dissolved sample.
0.2 M potassium formate in D2O was added for reference. With the probe used, this concentration did not
significantly change the 90° flip angle. Data were analyzed using VnmrJ (Agilent Technologies, Palo Alto, CA,
USA) and MATLAB (Mathworks, Natick, MA, USA).
Radiation damping in thermal experiments: Solutions of equally distributed water/D2O volume ratios from
10% to 100%, corresponding to 11.08 M to 110.82 M, were prepared. A series of 10 NMR experiments with
parameters identical to those of the hyperpolarized experiments was measured, and the linewidth was
determined.
Optical absorbance measurements: The final concentration of TEMPO radical was determined by optical
absorbance measurements with an Ocean Optics DH-2000 Deuterium-Halogen light source and an Ocean
Optics USB2000+UV-VIS spectrometer in quartz cuvettes of 10 mm path length. The absorbance at λ = 240
nm was compared to a reference curve of TEMPO in water at 125, 250, 375 and 500 µM.
Clinical polarizer compatibility: Organic solvents tend to weaken the fluid path syringe when heated for
longer periods, as when inserted in clinical polarizers. To avoid syringe damage during these experiments,
the protocol was modified by leaving out the NFBME. Additional dissolution medium was added to a total
volume of 28.0 mL. Experiments were performed on a 5 T SPINlab (GE Healthcare, Brøndby, Denmark).
Results
Figure 1: Build-up of the 1H NMR signal to thermal equilibrium for a 30 mM TEMPO in water/glycerol 1:1
(w/w) sample at 6.7 T after subtraction of background signal. The T1 was 583 min.
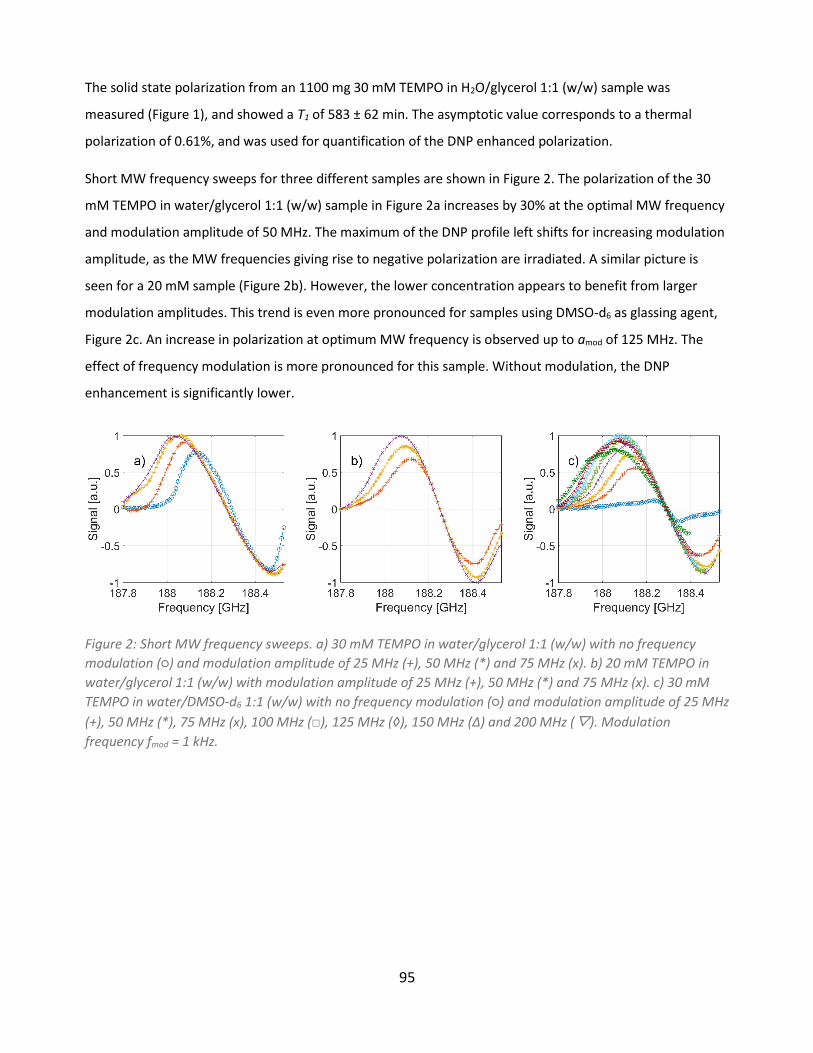
95
The solid state polarization from an 1100 mg 30 mM TEMPO in H2O/glycerol 1:1 (w/w) sample was
measured (Figure 1), and showed a T1 of 583 ± 62 min. The asymptotic value corresponds to a thermal
polarization of 0.61%, and was used for quantification of the DNP enhanced polarization.
Short MW frequency sweeps for three different samples are shown in Figure 2. The polarization of the 30
mM TEMPO in water/glycerol 1:1 (w/w) sample in Figure 2a increases by 30% at the optimal MW frequency
and modulation amplitude of 50 MHz. The maximum of the DNP profile left shifts for increasing modulation
amplitude, as the MW frequencies giving rise to negative polarization are irradiated. A similar picture is
seen for a 20 mM sample (Figure 2b). However, the lower concentration appears to benefit from larger
modulation amplitudes. This trend is even more pronounced for samples using DMSO-d6 as glassing agent,
Figure 2c. An increase in polarization at optimum MW frequency is observed up to amod of 125 MHz. The
effect of frequency modulation is more pronounced for this sample. Without modulation, the DNP
enhancement is significantly lower.
Figure 2: Short MW frequency sweeps. a) 30 mM TEMPO in water/glycerol 1:1 (w/w) with no frequency
modulation (○) and modulation amplitude of 25 MHz (+), 50 MHz (*) and 75 MHz (x). b) 20 mM TEMPO in
water/glycerol 1:1 (w/w) with modulation amplitude of 25 MHz (+), 50 MHz (*) and 75 MHz (x). c) 30 mM
TEMPO in water/DMSO-d6 1:1 (w/w) with no frequency modulation (○) and modulation amplitude of 25 MHz
(+), 50 MHz (*), 75 MHz (x), 100 MHz (□), 125 MHz (◊), 150 MHz (Δ) and 200 MHz (▽). Modulation
frequency fmod = 1 kHz.
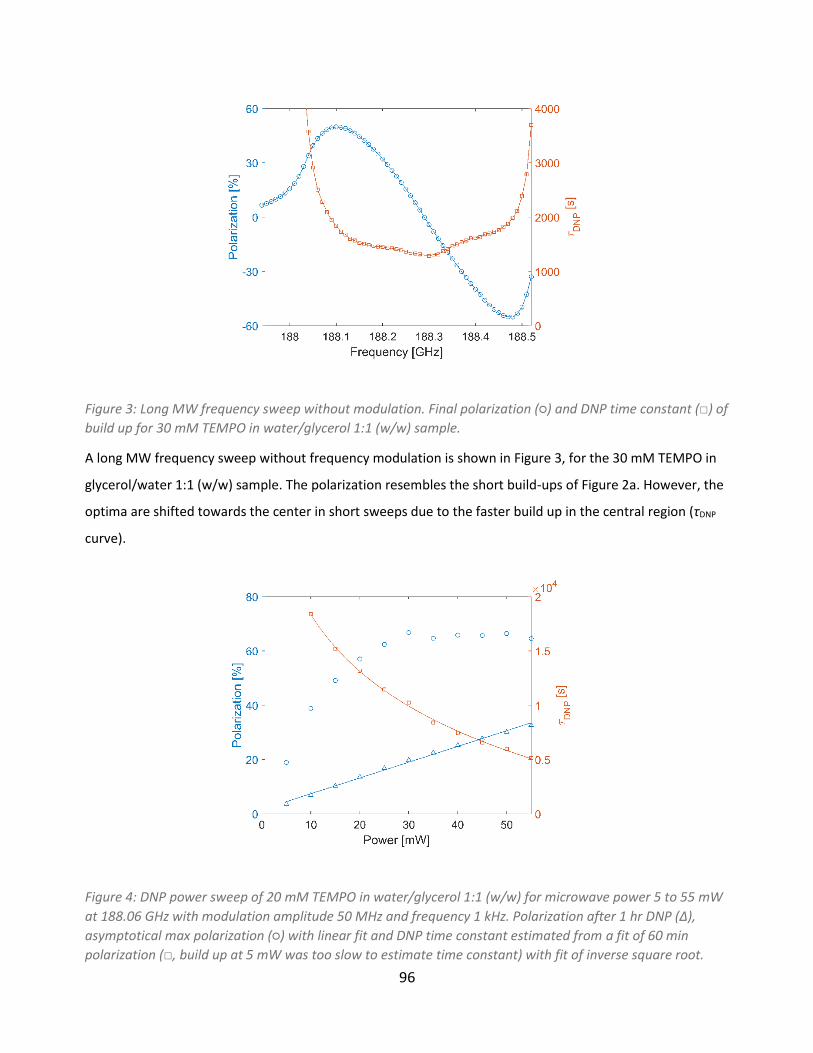
96
Figure 3: Long MW frequency sweep without modulation. Final polarization (○) and DNP time constant (□) of
build up for 30 mM TEMPO in water/glycerol 1:1 (w/w) sample.
A long MW frequency sweep without frequency modulation is shown in Figure 3, for the 30 mM TEMPO in
glycerol/water 1:1 (w/w) sample. The polarization resembles the short build-ups of Figure 2a. However, the
optima are shifted towards the center in short sweeps due to the faster build up in the central region (τDNP
curve).
Figure 4: DNP power sweep of 20 mM TEMPO in water/glycerol 1:1 (w/w) for microwave power 5 to 55 mW
at 188.06 GHz with modulation amplitude 50 MHz and frequency 1 kHz. Polarization after 1 hr DNP (Δ),
asymptotical max polarization (○) with linear fit and DNP time constant estimated from a fit of 60 min
polarization (□, build up at 5 mW was too slow to estimate time constant) with fit of inverse square root.
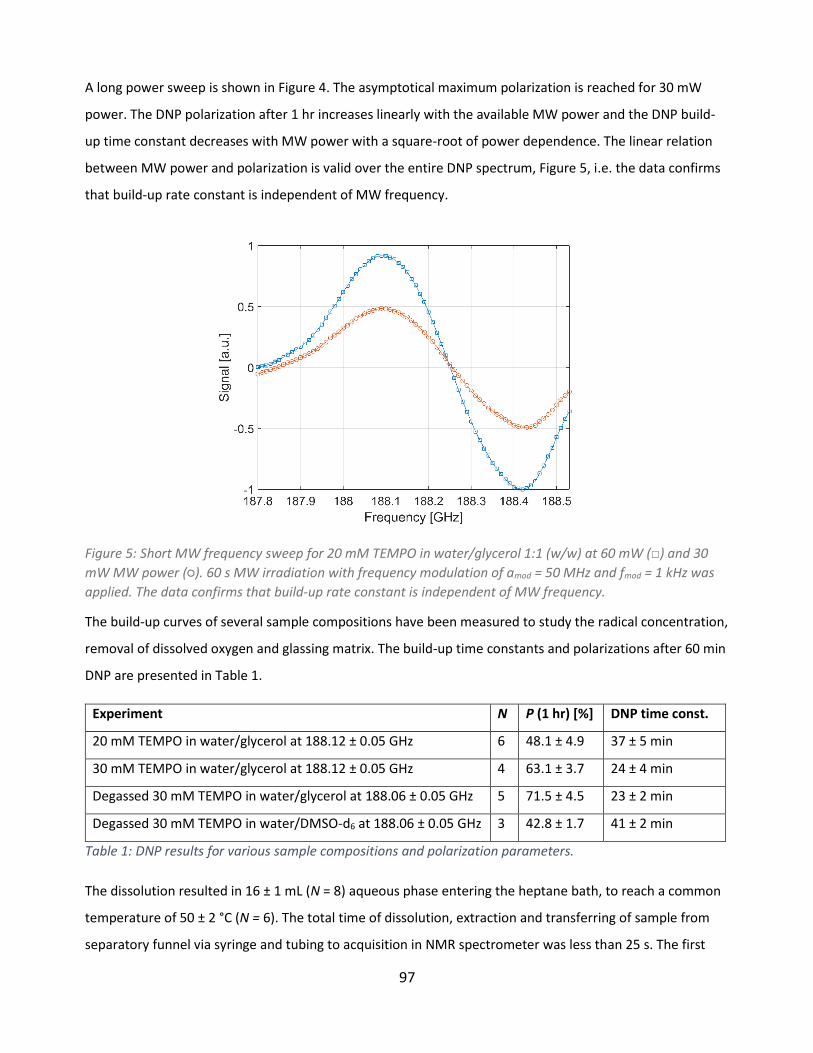
97
A long power sweep is shown in Figure 4. The asymptotical maximum polarization is reached for 30 mW
power. The DNP polarization after 1 hr increases linearly with the available MW power and the DNP build-
up time constant decreases with MW power with a square-root of power dependence. The linear relation
between MW power and polarization is valid over the entire DNP spectrum, Figure 5, i.e. the data confirms
that build-up rate constant is independent of MW frequency.
Figure 5: Short MW frequency sweep for 20 mM TEMPO in water/glycerol 1:1 (w/w) at 60 mW (□) and 30
mW MW power (○). 60 s MW irradiation with frequency modulation of amod = 50 MHz and fmod = 1 kHz was
applied. The data confirms that build-up rate constant is independent of MW frequency.
The build-up curves of several sample compositions have been measured to study the radical concentration,
removal of dissolved oxygen and glassing matrix. The build-up time constants and polarizations after 60 min
DNP are presented in Table 1.
Experiment N P (1 hr) [%] DNP time const.
20 mM TEMPO in water/glycerol at 188.12 ± 0.05 GHz 6 48.1 ± 4.9 37 ± 5 min
30 mM TEMPO in water/glycerol at 188.12 ± 0.05 GHz 4 63.1 ± 3.7 24 ± 4 min
Degassed 30 mM TEMPO in water/glycerol at 188.06 ± 0.05 GHz 5 71.5 ± 4.5 23 ± 2 min
Degassed 30 mM TEMPO in water/DMSO-d6 at 188.06 ± 0.05 GHz 3 42.8 ± 1.7 41 ± 2 min
Table 1: DNP results for various sample compositions and polarization parameters.
The dissolution resulted in 16 ± 1 mL (N = 8) aqueous phase entering the heptane bath, to reach a common
temperature of 50 ± 2 °C (N = 6). The total time of dissolution, extraction and transferring of sample from
separatory funnel via syringe and tubing to acquisition in NMR spectrometer was less than 25 s. The first

98
Figure 6: a) Spectrum of hyperpolarized 30 mM TEMPO in water/glycerol 1:1 (w/w) sample after dissolution.
The small shoulder represents the glycerol protons. 50% linewidth of 1166 Hz. b) Linear regression of
linewidth of thermal spectra from samples of varying H2O:D2O ratio.
spectrum is shown in Figure 6a. The water peak has a line width of 1166 Hz due to the radiation damping
caused by the large magnetization of the sample. The peak of the glycerol aliphatic protons is apparent in
the spectrum, indicating that these protons are hyperpolarized along with the water protons.
In this particular experiment, we achieved an enhancement factor of 3,761 at 9.4 T, corresponding to a
polarization of 12.1%. A signal time series is shown in Figure 7. The estimated T1 after correction for signal
loss from previous excitations is 17.0 s. The relation between linewidth (full with at half maximum, FWHM)
due to radiation damping and water concentration was found to be FWHM(cW) = 0.0691 Hz ⋅ cW + 1.92 Hz,
where cW is the proton concentration in the sample (Figure 6b). Thus, the linewidth of 1,166 Hz corresponds
to an polarization of 11.7%, when corrected for the 111 M proton concentration in water and the 4.6 M
proton concentration in the dissolved sample, in close agreement with the time domain integral estimate.
The thermal signal and T1 was measured by acquiring the NMR signal from the sample as it was introduced
into the 9.4 T magnet, Figure 7. The measurement was done 5 min after dissolution when the sample was
fully relaxated. A consistent T1 of 16.6 s was measured.
The polarizations and T1’s in the liquid state at 9.4 T for several samples are shown in Table 2. The 30 mM
TEMPO in water/glycerol 1:1 (w/w) sample showed large fluctuations in the observed polarization, with an
average of 7.8%. The polarization was significantly lower when the NFBME was omitted, where the standard
fluid path exit tube set-up yielded polarizations below 3%. However, a significant increase in polarization
was achieved when the exit tube was reduced from 210 cm to 50 cm – a setup that requires minor
modifications of a SPINlab. Shortening the exit tube increased the temperature in the dissolved
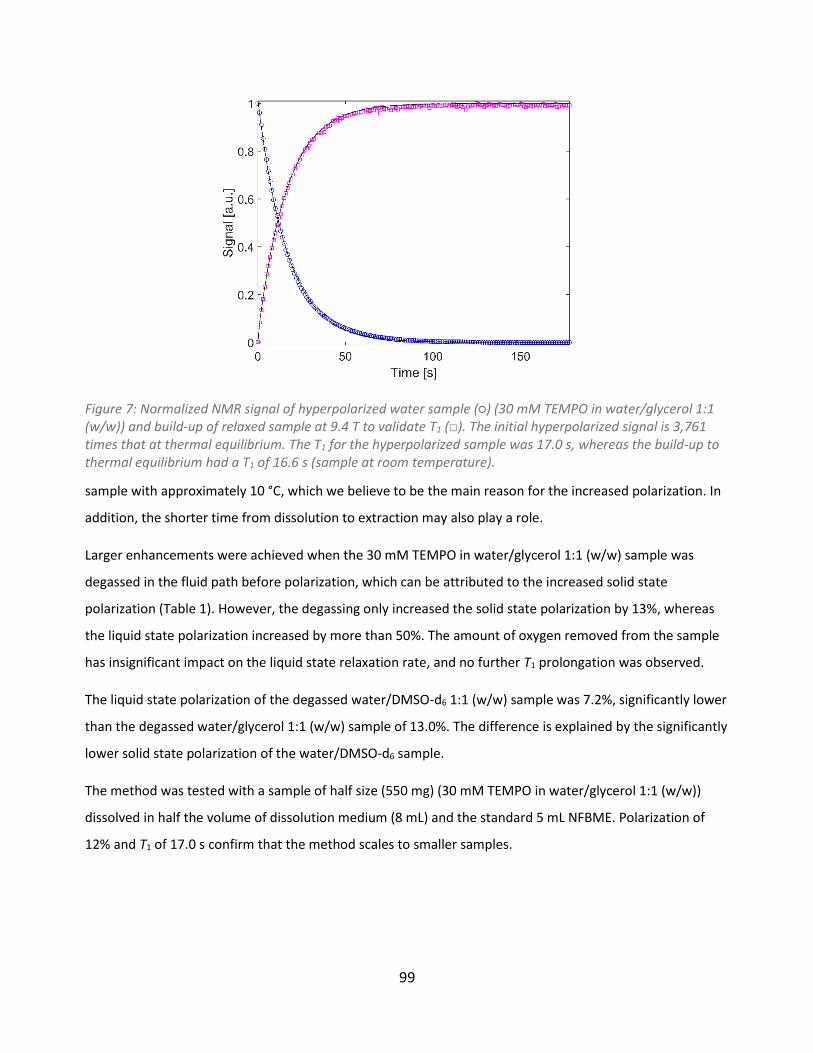
99
Figure 7: Normalized NMR signal of hyperpolarized water sample (○) (30 mM TEMPO in water/glycerol 1:1 (w/w)) and build-up of relaxed sample at 9.4 T to validate T1 (□). The initial hyperpolarized signal is 3,761 times that at thermal equilibrium. The T1 for the hyperpolarized sample was 17.0 s, whereas the build-up to thermal equilibrium had a T1 of 16.6 s (sample at room temperature).
sample with approximately 10 °C, which we believe to be the main reason for the increased polarization. In
addition, the shorter time from dissolution to extraction may also play a role.
Larger enhancements were achieved when the 30 mM TEMPO in water/glycerol 1:1 (w/w) sample was
degassed in the fluid path before polarization, which can be attributed to the increased solid state
polarization (Table 1). However, the degassing only increased the solid state polarization by 13%, whereas
the liquid state polarization increased by more than 50%. The amount of oxygen removed from the sample
has insignificant impact on the liquid state relaxation rate, and no further T1 prolongation was observed.
The liquid state polarization of the degassed water/DMSO-d6 1:1 (w/w) sample was 7.2%, significantly lower
than the degassed water/glycerol 1:1 (w/w) sample of 13.0%. The difference is explained by the significantly
lower solid state polarization of the water/DMSO-d6 sample.
The method was tested with a sample of half size (550 mg) (30 mM TEMPO in water/glycerol 1:1 (w/w))
dissolved in half the volume of dissolution medium (8 mL) and the standard 5 mL NFBME. Polarization of
12% and T1 of 17.0 s confirm that the method scales to smaller samples.
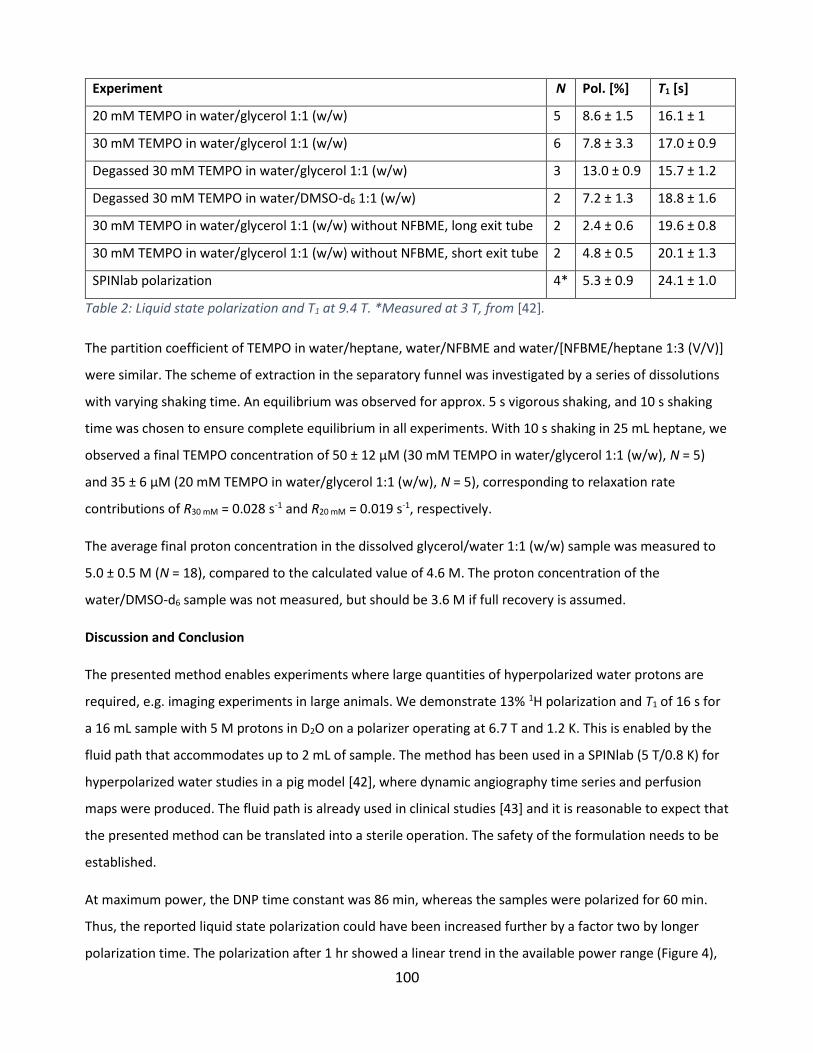
100
Experiment N Pol. [%] T1 [s]
20 mM TEMPO in water/glycerol 1:1 (w/w) 5 8.6 ± 1.5 16.1 ± 1
30 mM TEMPO in water/glycerol 1:1 (w/w) 6 7.8 ± 3.3 17.0 ± 0.9
Degassed 30 mM TEMPO in water/glycerol 1:1 (w/w) 3 13.0 ± 0.9 15.7 ± 1.2
Degassed 30 mM TEMPO in water/DMSO-d6 1:1 (w/w) 2 7.2 ± 1.3 18.8 ± 1.6
30 mM TEMPO in water/glycerol 1:1 (w/w) without NFBME, long exit tube 2 2.4 ± 0.6 19.6 ± 0.8
30 mM TEMPO in water/glycerol 1:1 (w/w) without NFBME, short exit tube 2 4.8 ± 0.5 20.1 ± 1.3
SPINlab polarization 4* 5.3 ± 0.9 24.1 ± 1.0
Table 2: Liquid state polarization and T1 at 9.4 T. *Measured at 3 T, from [42].
The partition coefficient of TEMPO in water/heptane, water/NFBME and water/[NFBME/heptane 1:3 (V/V)]
were similar. The scheme of extraction in the separatory funnel was investigated by a series of dissolutions
with varying shaking time. An equilibrium was observed for approx. 5 s vigorous shaking, and 10 s shaking
time was chosen to ensure complete equilibrium in all experiments. With 10 s shaking in 25 mL heptane, we
observed a final TEMPO concentration of 50 ± 12 µM (30 mM TEMPO in water/glycerol 1:1 (w/w), N = 5)
and 35 ± 6 µM (20 mM TEMPO in water/glycerol 1:1 (w/w), N = 5), corresponding to relaxation rate
contributions of R30 mM = 0.028 s-1 and R20 mM = 0.019 s-1, respectively.
The average final proton concentration in the dissolved glycerol/water 1:1 (w/w) sample was measured to
5.0 ± 0.5 M (N = 18), compared to the calculated value of 4.6 M. The proton concentration of the
water/DMSO-d6 sample was not measured, but should be 3.6 M if full recovery is assumed.
Discussion and Conclusion
The presented method enables experiments where large quantities of hyperpolarized water protons are
required, e.g. imaging experiments in large animals. We demonstrate 13% 1H polarization and T1 of 16 s for
a 16 mL sample with 5 M protons in D2O on a polarizer operating at 6.7 T and 1.2 K. This is enabled by the
fluid path that accommodates up to 2 mL of sample. The method has been used in a SPINlab (5 T/0.8 K) for
hyperpolarized water studies in a pig model [42], where dynamic angiography time series and perfusion
maps were produced. The fluid path is already used in clinical studies [43] and it is reasonable to expect that
the presented method can be translated into a sterile operation. The safety of the formulation needs to be
established.
At maximum power, the DNP time constant was 86 min, whereas the samples were polarized for 60 min.
Thus, the reported liquid state polarization could have been increased further by a factor two by longer
polarization time. The polarization after 1 hr showed a linear trend in the available power range (Figure 4),
101
indicating that higher polarization after 1 hr could be realized by increasing the microwave power above 55
mW through a shortening of the build-up time constant. The build-up time constant follows an inverse
square-root of microwave power dependence, i.e. is inversely proportional to the microwave B1 field. This is
the expected dependence of the rate constant for both the solid-effect and thermal mixing [44]. The MW
power at the entry to the cavity was measured to be approx. 5 mW, but since we do not have details about
the power distribution within the cavity, all data has been referenced to the source output power.
The MW frequency modulation increased DNP efficiency for all tested samples. The 20 mM water/glycerol
1:1 (w/w) sample was tested for modulation amplitude of 25, 50, and 75 MHz, respectively, and 50 MHz
gave the largest DNP gain. 75 MHz modulation amplitude was the optimal of the three for 30 mM
water/glycerol 1:1 (w/w) sample, whereas the 30 mM water/DMSO-d6 1:1 (w/w) sample polarized most
efficiently at 125 MHz. Thus, both sample composition and radical concentration affect the frequency
modulation performance. The modulation of the MW frequency is beneficial due to the inhomogeneous
nature of the nitroxide EPR line at high magnetic field that restricts spectral diffusion. The inhomogeneity of
the EPR line could probably have been overcome by increasing the nitroxide concentration further, but this
may lead to shortening of T1 in the liquid state and/or further loss in the dissolution.
Optimal MW frequencies were determined for several sample compositions at 6.7 T. Polarizers at other
field strengths have other DNP frequency profiles, where optimal frequency modulation parameters are
shifted. For polarizers without 1H detection, the 13C frequency sweeps can be used for localization of
optimum EPR frequencies, and applied to protons due to the broad linewidth of the nitroxide radical. This is
in principle how the SPINlab experiments were performed.
We have demonstrated that large volumes of hyperpolarized water can be produced with the fluid path
technology. The 30 mM water/glycerol 1:1 (w/w) sample polarized 30% better than the corresponding 20
mM sample, whereas the dissolved state polarization was 10% higher for the 20 mM sample. The lower
radical concentration in the dissolved state is the obvious reason. Degassing of the sample only increased
the solid state polarization by 13%, but increased liquid state polarization by 51%. This is in good agreement
with [24] where an approx. 50% increase of the liquid state enhancement is observed after degassing.
Some liquid state polarization measurements showed large deviations. Only small variance in the solid state
polarization was observed, which means that the dissolution process, extraction and sample transfer are the
dominating sources of variability. The manual extraction process, where a funnel was shaken by hand, is
inevitably a variable operation. The variation in the transfer time should be a minor contribution if the
measured T1 values are constant during the process. However, the relaxivity of the nitroxide is about the

102
double in low field, and a shorter T1 during the extraction and transfer should be expected. However, a
more systematic variation in performance was also observed over time, possibly due to e.g. variation in
microwave power delivery due to waveguide contamination.
Dissolving the frozen sample in heptane yielded low final polarizations. The low-density heptane places
itself in the top in the dissolution medium syringe, and thus exits first. Thus, the sample was melted without
being diluted until the aqueous phase appeared, causing a loss in polarization from relaxation by the high
radical and proton concentration. Secondly, the fluid path plastic did not tolerate well the heated heptane
and showed tendency of cracking. Instead, NFBME was determined to have TEMPO partition coefficient
similar to that of heptane, and was tested with volume of 5, 8, 11 mL, where the lower volume yielded the
most controlled and efficient dissolution, and highest polarization in the liquid state.
NFBME volumes above 5 mL resulted in uncontrolled dissolution, where the exit tube was blown out of the
receiver or the sample was spurted out of the funnel due to high pressure sample and gas from the exit
tube. An extraction system with a fixed, stirred receiver or application of a filter at the exit tube may allow
larger NFBME volume, resulting in faster, warmer dissolutions. In addition, this would allow larger sample
sizes, so the full potential of the 2 mL vial could be utilized. The water/glassing agent ratio was not
investigated. Smaller glassing agent volume may yield faster sample melting and lower radical concentration
in the dissolved state, but the glassing ability of such sample should be verified first.
The radical removal may be optimized, e.g. by automatization of the extraction, which could also reduce the
variance in the dissolved state polarization. Although radical quenching can be done efficiently, removal is
preferred for in vivo studies and future clinical applications. Thus, filtering, reverse phase or ion exchange
extraction of the radical may prove useful.
We did not observe relaxation times above 40 s, as demonstrated in [24]. We believe that the decrease in
temperature from dissolution to NMR acquisition is the main reason. In [24], the dissolved sample of 52 °C
was transferred in a preheated transfer line into a preheated NMR tube at 60 °C , whereas the 50 °C
dissolved sample of the present study was cooled in the transferring syringe, injection line and NMR tube at
room temperature. Since the aim of our study was to enable in vivo studies, the sample temperature should
be conditioned to 30-35 °C at time of injection. The slightly longer T1 at 3 T support this, as the larger sample
volume used in these experiments will stay at the higher solvent exit temperature of the polarizer during
measurement.
The liquid state NMR signal yielded robust polarization quantification, and the radiation damping time
constant was demonstrated to give consistent measure of polarization.

103
The T1 of the hyperpolarized samples in the liquid state are in the range 15-20 s, with uncertainty of the
temperature and field dependence during transfer. With a dissolution, extraction and transfer time of
approx. 25 s, the relaxation loss amounts to approx. 70% (e-25 s/20 s = 0.3). This explains most of the
polarization loss from the solid state (P=70%) to the liquid state (P=13%), but probably not entirely. Further
optimization and automation of the radical removal and transfer may reduce this loss further, e.g. by
sample injection systems. Similarly, the 1H concentration may be further reduced to prolong T1 for the given
transfer time.
104
Bibliography
[1] J.H. Ardenkjaer-Larsen, B. Fridlund, A. Gram, G. Hansson, L. Hansson, M.H. Lerche, R. Servin, M.
Thaning, K. Golman, Increase in signal-to-noise ratio of > 10,000 times in liquid-state NMR., Proc.
Natl. Acad. Sci. U. S. A. 100 (2003) 10158–10163. doi:10.1073/pnas.1733835100.
[2] S.E. Day, M.I. Kettunen, F.A. Gallagher, D.-E. Hu, M. Lerche, J. Wolber, K. Golman, J.H. Ardenkjaer-
Larsen, K.M. Brindle, Detecting tumor response to treatment using hyperpolarized 13C magnetic
resonance imaging and spectroscopy., Nat. Med. 13 (2007) 1382–1387. doi:10.1038/nm1650.
[3] M.J. Albers, R. Bok, A.P. Chen, C.H. Cunningham, M.L. Zierhut, V.Y. Zhang, S.J. Kohler, J. Tropp, R.E.
Hurd, Y.F. Yen, S.J. Nelson, D.B. Vigneron, J. Kurhanewicz, Hyperpolarized 13C lactate, pyruvate, and
alanine: Noninvasive biomarkers for prostate cancer detection and grading, Cancer Res. 68 (2008)
8607–8615. doi:10.1158/0008-5472.CAN-08-0749.
[4] H. Gutte, A.E. Hansen, H.H. Johannesen, A.E. Clemmensen, J.H. Ardenkjær-Larsen, C. Haagen, A.
Kjær, The use of dynamic nuclear polarization 13 C-pyruvate MRS in cancer, Am. J. Nucl. Med. Mol.
Imaging. 5 (2015) 548–560.
[5] R.E. Hurd, Y.-F. Yen, J. Tropp, A. Pfefferbaum, D.M. Spielman, D. Mayer, Cerebral dynamics and
metabolism of hyperpolarized [1-(13)C]pyruvate using time-resolved MR spectroscopic imaging., J.
Cereb. Blood Flow Metab. 30 (2010) 1734–1741. doi:10.1038/jcbfm.2010.93.
[6] C. Laustsen, K. Lipsø, J.A. Ostergaard, R. Nørregaard, A. Flyvbjerg, M. Pedersen, F. Palm, J.H.
Ardenkjær-Larsen, Insufficient insulin administration to diabetic rats increases substrate utilization
and maintains lactate production in the kidney, Physiol. Rep. 2 (2014) e12233–e12233.
doi:10.14814/phy2.12233.
[7] L.E. Olsson, C.M. Chai, O. Axelsson, M. Karlsson, K. Golman, J.S. Petersson, MR coronary angiography
in pigs with intraarterial injections of a hyperpolarized 13C substance, Magn. Reson. Med. 55 (2006)
731–737. doi:10.1002/mrm.20847.
[8] K. Golman, J.H. Ardenkjær-Larsen, J. Svensson, O. Axelsson, G. Hansson, L. Hansson, H. Jóhannesson,
I. Leunbach, S. Månsson, J.S. Petersson, G. Pettersson, R. Servin, L.-G. Wistrand, 13C-Angiography,
Acad. Radiol. 9 (2002) 507–510. doi:10.1016/S1076-6332(03)80278-7.
[9] K.W. Lipsø, P. Magnusson, J.H. Ardenkjær-Larsen, Hyperpolarized 13 C MR Angiography, Curr. Pharm.
Des. 22 (2016) 90–95. doi:10.2174/1381612822666151109112415.
[10] S. Bowen, C. Hilty, Time-resolved dynamic nuclear polarization enhanced NMR spectroscopy, Angew.
Chemie - Int. Ed. 47 (2008) 5235–5237. doi:10.1002/anie.200801492.
105
[11] C. Harrison, C. Yang, A. Jindal, R.J. Deberardinis, M.A. Hooshyar, M. Merritt, A. Dean Sherry, C.R.
Malloy, Comparison of kinetic models for analysis of pyruvate-to-lactate exchange by hyperpolarized
13C NMR, NMR Biomed. 25 (2012) 1286–1294. doi:10.1002/nbm.2801.
[12] H. Allouche-Arnon, A. Gamliel, C.M. Barzilay, R. Nalbandian, J.M. Gomori, M. Karlsson, M.H. Lerche,
R. Katz-Brull, A hyperpolarized choline molecular probe for monitoring acetylcholine synthesis,
Contrast Media Mol. Imaging. 6 (2011) 139–147. doi:10.1002/cmmi.418.
[13] M.J. Bayro, G.T. Debelouchina, M.T. Eddy, N.R. Birkett, C.E. Macphee, M. Rosay, W.E. Maas, C.M.
Dobson, R.G. Griffin, Intermolecular Structure Determination of Amyloid Fibrils with Magic-Angle
Spinning and Dynamic Nuclear Polarization NMR, J. Am. Chem. Soc. 133 (2011) 13967–13974.
[14] A. Potapov, W.M. Yau, R. Tycko, Dynamic nuclear polarization-enhanced 13C NMR spectroscopy of
static biological solids, J. Magn. Reson. 231 (2013) 5–14. doi:10.1016/j.jmr.2013.02.011.
[15] P. Mark D. Lingwood, B. Ting Ann Siaw, P. Napapon Sailasuta, M. Osama A. Abulseoud, M. Henry R.
Chan, M. Brian D. Ross, P. Pratip Bhattacharya, P. Songi Han, Hyperpolarized Water as an MR Imaging
Contrast Agent: Feasibility of in Vivo Imaging in a Rat Model, Radiology. 265 (2012) 418–425.
doi:10.1148/radiol.12111804.
[16] R.E. Lenkinski, Science to Practice: Can Hyperpolarized Water Be Used to Enhance MR Angiography
and Flow Measurement?, Radiology. 265 (2012) 325–326. doi:10.1148/radiol.12121642.
[17] E.R. McCarney, B.D. Armstrong, M.D. Lingwood, S. Han, Hyperpolarized water as an authentic
magnetic resonance imaging contrast agent., Proc. Natl. Acad. Sci. U. S. A. 104 (2007) 1754–1759.
doi:10.1073/pnas.0610540104.
[18] M.D. Lingwood, T.A. Siaw, N. Sailasuta, B.D. Ross, P. Bhattacharya, S. Han, Continuous flow
Overhauser dynamic nuclear polarization of water in the fringe field of a clinical magnetic resonance
imaging system for authentic image contrast, J. Magn. Reson. 205 (2010) 247–254.
doi:10.1016/j.jmr.2010.05.008.
[19] J.H. Ardenkjaer-Larsen, C. Laustsen, S. Bowen, R. Rizi, Hyperpolarized H2O MR angiography, Magn.
Reson. Med. 71 (2014) 50–56. doi:10.1002/mrm.25033.
[20] B.D. Armstrong, S. Han, Overhauser dynamic nuclear polarization to study local water dynamics., J.
Am. Chem. Soc. 131 (2009) 4641–4647. doi:10.1021/ja809259q.
[21] J.-H. Ardenkjaer-Larsen, G.S. Boebinger, A. Comment, S. Duckett, A.S. Edison, F. Engelke, C.
Griesinger, R.G. Griffin, C. Hilty, H. Maeda, G. Parigi, T. Prisner, E. Ravera, J. van Bentum, S. Vega, A.
Webb, C. Luchinat, H. Schwalbe, L. Frydman, Facing and Overcoming Sensitivity Challenges in

106
Biomolecular NMR Spectroscopy, Angew. Chemie Int. Ed. 54 (2015) 9162–9185.
doi:10.1002/anie.201410653.
[22] T. Harris, O. Szekely, L. Frydman, On the potential of Hyperpolarized Water in Biomolecular NMR
Studies, J. Phys. Chem. B. 118 (2014) 3281–3290. doi:10.1021/jp4102916.
[23] Q. Chappuis, J. Milani, B. Vuichoud, A. Bornet, A.D. Gossert, G. Bodenhausen, S. Jannin,
Hyperpolarized Water to Study Protein–Ligand Interactions, J. Phys. Chem. Lett. 6 (2015) 1674–1678.
doi:10.1021/acs.jpclett.5b00403.
[24] G. Olsen, E. Markhasin, O. Szekely, C. Bretschneider, L. Frydman, Optimizing water hyperpolarization
and dissolution for sensitivity-enhanced 2D biomolecular NMR, J. Magn. Reson. 264 (2016) 49–58.
doi:10.1016/j.jmr.2016.01.005.
[25] B. Vuichoud, A. Bornet, F. de Nanteuil, J. Milani, E. Canet, X. Ji, P. Miéville, E. Weber, D. Kurzbach, A.
Flamm, R. Konrat, A.D. Gossert, S. Jannin, G. Bodenhausen, Filterable Agents for Hyperpolarization of
Water, Metabolites, and Proteins, Chem. Eur. J. 22 (2016) 1521–3765.
doi:10.1002/chem.201602506.
[26] J.H. Ardenkjaer-Larsen, A.M. Leach, N. Clarke, J. Urbahn, D. Anderson, T.W. Skloss, Dynamic nuclear
polarization polarizer for sterile use intent, NMR Biomed. 24 (2011) 927–932.
doi:10.1002/nbm.1682.
[27] A. Bornet, J. Milani, B. Vuichoud, A.J. Perez Linde, G. Bodenhausen, S. Jannin, Microwave Frequency
Modulation to Enhance Dissolution Dynamic Nuclear Polarization, Chem. Phys. Lett. 602 (2014) 63–
67. doi:10.1016/j.cplett.2014.04.013.
[28] Y. Hovav, A. Feintuch, S. Vega, D. Goldfarb, Dynamic nuclear polarization using frequency modulation
at 3.34 T, J. Magn. Reson. 238 (2014) 94–105. doi:10.1016/j.jmr.2013.10.025.
[29] V. Weis, M. Bennati, M. Rosay, J.A. Bryant, R.G. Griffin, High-field DNP and ENDOR with a novel
multiple-frequency resonance structure, J. Magn. Reson. 140 (1999) 293–299.
doi:10.1006/jmre.1999.1841.
[30] P. Höfer, G. Parigi, C. Luchinat, P. Carl, G. Guthausen, M. Reese, T. Carlomagno, C. Griesinger, M.
Bennati, Field dependent dynamic nuclear polarization with radicals in aqueous solution, J. Am.
Chem. Soc. 130 (2008) 3254–3255. doi:10.1021/ja0783207.
[31] P. Miéville, P. Ahuja, R. Sarkar, S. Jannin, P.R. Vasos, S. Gerber-Lemaire, M. Mishkovsky, A. Comment,
R. Gruetter, O. Ouari, P. Tordo, G. Bodenhausen, Scavenging free radicals to preserve enhancement
and extend relaxation times in NMR using dynamic nuclear polarization, Angew. Chemie - Int. Ed. 49

107
(2010) 6182–6185. doi:10.1002/anie.201000934.
[32] T. Harris, C. Bretschneider, L. Frydman, Dissolution DNP NMR with solvent mixtures: Substrate
concentration and radical extraction, J. Magn. Reson. 211 (2011) 96–100.
doi:10.1016/j.jmr.2011.04.001.
[33] J.T. Anderson, W. A.; Arnold, Proton Relaxation Times in H2O-D2O Mixtures, Phys. Rev. 101 (1956)
511–512. doi:10.1103/PhysRev.101.511.
[34] H.Y. Simpson, J. H.; Carr, Diffusion and Nuclear Spin Relaxation in Water, Phys. Rev. 111 (1958) 1201–
1202. doi:10.1103/PhysRev.111.1201.
[35] N. Nestle, T. Baumann, R. Niessner, Oxygen determination in oxygen-supersaturated drinking waters
by NMR relaxometry, Water Res. 37 (2003) 3361–3366. doi:10.1016/S0043-1354(03)00211-2.
[36] R. Battino, T.R. Rettich, T. Tominaga, The Solubility of Oxygen and Ozone in Liquids, J. Phys. Chem.
Ref. Data. 12 (1983) 163–178. doi:10.1063/1.555680.
[37] Michael G. Costello, R.M. Flynn, J.G. Owens, 3M Company, Fluoroethers and Fluoroaminies, Kirk-
Othmer Encyclopedia of Chemical Technology, 5th ed., John Wiley & Sons, 2005.
doi:10.1002/0471238961.
[38] V. V. Krishnan, N. Murali, Radiation damping in modern NMR experiments: Progress and challenges,
Prog. Nucl. Magn. Reson. Spectrosc. 68 (2013) 41–57. doi:10.1016/j.pnmrs.2012.06.001.
[39] J. Tropp, M. Van Criekinge, Radiation damping and reciprocity in nuclear magnetic resonance: The
replacement of the filling factor, J. Magn. Reson. 206 (2010) 161–167.
doi:10.1016/j.jmr.2010.06.001.
[40] O. Rybalko, S. Bowen, V. Zhurbenko, J.H. Ardenkjær-Larsen, Waveguide transition with vacuum
window for multiband dynamic nuclear polarization systems, Rev. Sci. Instrum. 87 (2016) 54705.
doi:10.1063/1.4948294.
[41] R.M. Malinowski, K.W. Lipsø, M.H. Lerche, J.H. Ardenkjær-larsen, Dissolution Dynamic Nuclear
Polarization capability study with fluid path, J. Magn. Reson. 272 (2016) 141-146.
doi:10.1016/j.jmr.2016.09.015.
[42] K.W. Lipsø, E.S. Szocska Hansen, R. Tougaard, C. Laustsen, J.H. Ardenkjær-Larsen, Renal MR
Angiography and Perfusion in the Pig using Hyperpolarized Water, Magn. Reson. Med. In press
(2016). doi:10.1002/mrm.26478.
[43] C.H. Cunningham, J.Y. Lau, A.P. Chen, B.J. Geraghty, W.J. Perks, I. Roifman, G.A. Wright, K.A.

108
Connelly, Hyperpolarized 13 C Metabolic MRI of the Human Heart: Initial Experience, Circ. Res. 119
(2016) 1177-1182. doi:10.1161/CIRCRESAHA.116.309769.
[44] T. Wenckebach, Essentials of Dynamic Nuclear Polarization, Spindrift Publications, The Netherlands,
9 May 2016. ISBN 9789075541182.

109
Paper III

110
111
90 Current Pharmaceutical Design, 2016, 22, 90-95
Hyperpolarized 13C MR Angiography
Kasper W. Lipsø1,2, Peter Magnusson2, and Jan Henrik Ardenkjær-Larsen1,2,3*
1Department of Electrical Engineering, Technical University of Denmark, Kgs. Lyngby, Denmark; 2Danish Research Centre for
Magnetic Resonance, Centre for Functional and Diagnostic Imaging and Research, Copenhagen University Hospital Hvidovre,
Denmark; 3GE Healthcare, Brøndby, Denmark
Abstract: Magnetic resonance angiography (MRA) is a non-invasive technology that can be used for diagnosis and monitoring of
cardiovascular disease; the number one cause of mortality worldwide.
Hyperpolarized imaging agents provide signal enhancement of more than 10, 000 times, which implies large reduction in acquisition time
and improved spatial resolution. We review the role of hyperpolarized 13C agents for MR angiography and present the literature in the field.
Furthermore, we present a study of the benefit of intra-arterial injection over intravenous injection of hyperpolarized agent for cerebral
angiography in the rat, and compare the performance of two standard angiographic pulse sequences, the gradient echo (GRE) sequence and
the balanced steady-state free precession (bSSFP).
2D coronal cerebral angiographies using intra-arterial injections were acquired with a GRE sequence with in-plane resolution of 0.27 mm
and matrix size 256x128, and 2D coronal cerebral angiographies were acquired with a bSSFP sequence with in-plane resolution of 0.55
mm and matrix size 128x64.
The bSSFP sequence provides higher SNR in phantoms than the GRE sequence. Similarly, intravenous injections are imaged with higher
SNR with the bSSFP sequence, where the signal destruction of the GRE sequence is avoided. However, for intra-arterial injections, the
bSSFP sequence results in strong artefacts, and the GRE sequence is preferred.
Hyperpolarized MRA presents many challenges and cannot currently compete with conventional contrast enhanced MRA. Further research
may change this since hyperpolarization is still an immature methodology.
Keywords: Magnetic resonance angiography, hyperpolarization, 13C, HP001, DNP.
INTRODUCTION
Angiographic techniques are important in the diagnosis and
treatment of medical conditions such as emboli, stenosis and
intracranial aneurysms. The most frequently applied
angiographic techniques are ultrasound imaging (US), computed
tomography (CT), and nuclear medicine imaging such as PET
[1]. US is non-invasive, but has its limitations in imaging of the
cerebrovascular system, where cranium and tissue-bone
interfaces cause attenuation and disturbance of the signal. CT
provides high resolution images within short acquisition time,
but the radiation exposure is a major limitation of repeated use.
PET angiography can provide information about the functional
metrics in the vascular system, however the low spatial
resolution and the administration of radioactive contrast agent
makes PET less preferable [2, 3]. Magnetic resonance
angiography (MRA) is generally used with a contrast agent based
on e.g. gadolinium [4] that reduces the T1 of the blood, but flow
dependent techniques such as time-of-flight (TOF) or phase
contrast can also be employed without injections [5, 6]. One class
of MRA contrast agents includes blood pool agents such as
Clariscan™; ultra-small super paramagnetic iron oxide particles
that stay in circulation for hours [7]. Thus, the arterial vascular
system alone can be imaged during the first pass of the contrast
agent, whereas the entire vascular system can be acquired in a
large time window allowing signal averaging for high resolution.
Time-resolved fast imaging can be applied to capture the
dynamics [8].
Hyperpolarized 13C MRA
Conventional coronary proton MRA acquisition time depends
on parameters such as matrix size and repetition time, and is
*Address correspondence to this author at the DTU Electrical
Engineering, Ørsteds Plads, Building 349, room 106, 2800 Kgs. Lyngby, Denmark; Tel: (0045) 4525 3918; E-mail: [email protected]
typically acquired over several minutes [9]. Thus, respiratory
and cardiac motion, as well as movements of the patient will
affect the image quality. The need for faster image acquisition
has catalyzed research in hyperpolarized (HP) MRI, where the
signal can be enhanced by orders of magnitude compared to the
thermal signal [10]. The polarization is obtained via dissolution
Dynamic Nuclear Polarization (DNP). The sample is mixed with
an Electron Paramagnetic Agent (EPA) and cooled to low
temperature in a magnetic field, by which the unpaired electrons
of the EPA reach a polarization of unity. The polarization of the
electrons is transferred to the nuclear spins by irradiating with
microwaves at the resonance frequency of the electrons. The
high polarization of the nuclear spins are preserved to the liquid
phase by rapidly dissolving in a dissolution medium, before the
agent is injected. The polarization of the injected volume is more
than 4 orders of magnitude larger than the thermal signal of 13C.
Therefore, the signal in a 13C image obtained after injection of a
hyperpolarized substance is proportional to the concentration of
the agent in question, and the image acts as a qualitative map of
perfusion [11-14]. Likewise, the conversion of hyperpolarized 13C-labelled compounds such as pyruvate can be followed with
Magnetic Resonance Spectroscopic Imaging (MRSI) [15-17],
and the metabolic activity monitored [18].
Hyperpolarized MRA provides imaging of the injected
substance in the vascular system, and thus provides a direct
signal from the hyperpolarized spins in the blood. In addition,
hyperpolarized MRA is not dependent on flow velocity as e.g.
TOF-imaging, where flow close to the vessel walls appears with
a low signal due to low flow velocity. In 2002 Golman et al.
demonstrated that angiography in rats using hyperpolarized 13C
is possible with bis-1, 1(hydroxymethyl)-[1-13C]cyclopropane-
D8 (HP001) as imaging agent and demonstrated that both
ParaHydrogen-Induced Polarization (PHIP) [19] and dissolution
DNP [20] can be used for hyperpolarized 13C angiography with
i.v. agent administration (Fig. 1).

112
Svensson et al. [21] studied 13C cerebral MRA in the rat and
found that high SNR can be obtained in both the head and neck
area (Fig. 2) and in the thoracic/abdominal region using the
balanced steady state
free precision pulse sequence (bSSFP). Later, Olsson et al. [22]
presented a study on hyperpolarized 13C coronary MRA in a pig
model with i.a. injection. Recently, hyperpolarized H2O has been
applied in angiography with the advantage of applicability on
clinical scanners with 1H channels only, as well as higher
achievable magnetization due to a larger magnetic moment [23].
Fig. (1). Angiographic image of the rat heart region after i.v. injection in
the tail vein. Acquired with a gradient spoiled, gradient echo sequence
(TE/TR = 4 ms/9.5 ms, α = 10°, FOV = 70x70 mm2, matrix = 128x128,
slice = 30 mm, scan time = 2 s). With permission from [19] and Elsevier.
Fig. (2). First image in a series of angiograms covering the head and neck
region. The image has been acquired on a 2.35 T animal MRI system with
a trueFISP sequence (TE/TR = 1.8 ms/3.6 ms, FOV = 70x70 mm2, and
matrix = 64x64, with read oversampling). Major vessels appear with SNR
of 74-76, but some enhancement of other tissue is observed as well. With
permission from [21] and John Wiley and Sons.
For cerebral angiography in the rat, the hyperpolarized substance
is typically injected using either intravenous (i.v.) injection
through one of the tail veins, or intra-arterial (i.a.) injection
where a catheter is operated into one of the carotid arteries. The
injection method affects the system in various ways and e.g.
movement of the catheter and the reaction of the vessels to
increased pressure will result in difference in signal-to-noise
ratio (SNR) and artefacts in the images. Thus, the
MR sequence must be chosen and optimized in accordance with
the injection method. Furthermore, the injection type will
enhance specific characteristics of the arterial and venous
network. An even distribution in the vasculature should be
observed with an intravenous injection when the hyperpolarized
substance is distributed through the heart of the animal. When
the substance is injected in a carotid artery, only arteries
branching from that specific carotid artery as well as the
corresponding veins are highlighted.
13C Agent and MRI Considerations
The 13C-labelled agent HP001 is chosen for its long T1 (in vitro,
2.35 T: T1 ≈ 82 s, T2 ≈18 s; in vivo, 2.35 T: T1 ≈ 38 s, T2 ≈ 1.3
s) [21]. This means that the signal decay should be caused mainly
by dilution in the vasculature and extravasation of the agent to
the surrounding tissue, and to a smaller extent by relaxation
processes.
The bSSFP imaging technique has been demonstrated to be a
rapid, high-SNR technique for angiography and spectroscopic
applications using hyperpolarized substances (Fig. 2) [21, 22, 24,
25]. The gradient echo (GRE) technique has been used
extensively for single resonance HP lung imaging [26-28], but
less for HP- angiography using 13C-labeled substances. A
theoretical basis and in vitro measurement comparison between
bSSFP and GRE for the HP angiography application was
performed by Svensson et al. [21], but in vivo comparisons
between the combinations of the two imaging techniques (bSSFP
and GRE) and the two injection techniques (i.v. and i.a.) is to our
knowledge not performed.
In this review we demonstrate the current possibilities of a
hyperpolarized 13C-labelled agent for MRA and investigate the
difference between intravenous and intra-arterial injection with
the GRE and bSSFP imaging sequences.
METHODS
Polarization
Bis-1, 1-(hydroxymethyl)-[1-13C]cyclopropane-D8 (HP001)
was used as the imaging agent to obtain long relaxation times of
the 13C nuclei. Trityl OX063 (Oxford Instruments, Abingdon
UK) was used as paramagnetic agent. A batch consisting of 18.0
mg OX063, 500 mg HP001, 180 mg water and 15 L Dotarem (1:
10 dilution, Guerbet, Paris, France) was prepared. 100 L sample
was polarized using an Oxford Instruments Hypersense, 3.35 T,
1.4 K, by irradiation with microwaves at 94.112 GHz for one
hour. The polarization time constant was 1800 s. The sample was
dissolved in 1 mL PBS buffer with 0.01 g/L EDTA diluted in 3
mL NaCl (9 g/L). The 13C concentration in the final solution was
100 mmol/L. The solution temperature was approximately 37 °C

113
and the pH 7.5-8. The time from dissolution to injection start was
14-18 s and the polarization was 20-25% at time of injection.
Animal Preparation
All animal experiments were carried out in compliance with the
guidelines for use and care of laboratory animals and were
approved by the Danish Inspectorate of Animal Experiments,
approval 2012-15-2934-00244.
Male Sprague Dawley rats weighing 240-320 g were
anaesthetized with 1.8% isoflurane in air mixed with 5 % oxygen
adjusted to a respiration rate of 75±10 min-1 and mounted in an
animal holder. The body temperature was kept at 38±1 °C with
hot air flow.
Tail vein catherization: A catheter was inserted in a tail vein for
i.v. contrast agent administration. A volume of 1.5 mL was
injected over 6-9 s.
Carotid artery catherization: Carotid artery injections were
prepared by incision in the ventral neck of the rat and isolation
of the right carotid artery, before inserting and securing the
catheter in the artery. The catheter was fixed to the skin with tape.
A volume of 1.0 mL was injected over 6-9 s.
Fig. (3). The vertical sensitivity profile of the coil from a sum of squares
CSI image of a spherical bicarbonate phantom (small insert). The FOV
and slab position of the i.v. (bSSFP) acquisitions and the thinner slab of
the i.a. (GRE) acquisitions are indicated.
MR Scanner System and Pulse Sequences
Data was acquired on a 4.7 T imaging system (Agilent, Direct
Drive, VnmrJ 4.0) using a 13C/1H RF volume coil combined with
a 13C 4-channel surface array coil (receive-only, 50 mm inner
diameter, RAPID Biomedical GmbH, Germany). The receiver
coil was placed dorsal with the animal supine. Fig. 3 shows the
profile of the coil sensitivity measured as the sum-of-squares
image of a CSI acquisition of a spherical bicarbonate phantom.
The position of the GRE slab is indicated as the shaded area. The
bSSFP slab is overlapping, but extends 10 mm in the anterior
direction. The sensitivity is highest in the region closest to the
coil elements, thus the sensitivity of the vessels in this region is
more than twice the sensitivity in the outer region of the slab. The
system was shimmed to a proton line width of less than 110 Hz
over the field-of-view (FOV). The image reconstruction applied
the sum-of-squares algorithm where the signal in each pixel is
the square root of the sum of the squares of the signal from each
individual array coil element. The background noise is measured
in a ROI of 20x20 pixels in an area away from the hyperpolarized
signal.
Coil Sensitivity measurements: The coil sensitivity is
assessed with a CSI pulse sequence with FOV 80x80 mm2,
matrix size 16x16, α = 10°, TR = 75 ms on a spherical
phantom of 1.0 M bicarbonate (38 mm diameter).
HP-13C-MRA - bSSFP: The hyperpolarized signals were
acquired using a single-shot bSSFP sequence with 110° flip angle
(α). An /2-pulse preparation pulse was implemented at time TR/2
before the first excitation pulse to approach a steady state like
situation faster and a corresponding flip-back pulse was
implemented at the end of each image acquisition to restore the
longitudinal magnetization for the following time frame. The
angiographic images had a Field-Of-View (FOV) of 70x35 mm2
and a slab thickness of 30 mm placed coronal in the head and
neck region. The matrix size was 128x64. The repetition time and
echo time were set to minimum, TR/TE = 6.95/3.48 ms. A
bandwidth of 50 kHz yielded a total image acquisition of 450 ms
for each image. The sequence was started when the solution had
been fully injected to capture the maximum possible signal.
HP-13C-MRA, GRE: The GRE sequence was applied with an
FOV of 70x35 mm2, a slab thickness of 20 mm and with matrix
size 256x128. The pulse length was 2 ms and the repetition and
echo times were TR/TE = 10.16/5.10 ms. The total acquisition
time for an image was 1300 ms with α = 5° and imaging was
repeated over 30 time frames. Acquisition was started when
injection was initiated to capture the maximum signal strength. 1H MRA: Proton angiographic images were acquired with a
1H quadrature coil (M2M imaging corporation, Cleveland, Ohio,
USA) with inner diameter of 35 mm. A 3D GRE sequence with
TR/TE = 90/2.47 ms, α = 40°, FOV of 30x35x20 mm3, matrix
size 256x256x64 was used after an intravenous injection of 50 L
Clariscan™ (NC100150, NYCOMED IMAGING AS, Oslo,
Norway). The total acquisition time was 25 minutes.
Fig. (4). Coronal image of cerebral vessel structure acquired with a 3D
gradient echo sequence after injection of NC100150. The large arrow
indicates the superior sagittal sinus, the small arrows indicate the
transverse sinuses, and the dotted arrows indicate the superficial temporal
vein.

114
Fig. (6). Image of GRE sequence (4th frame) initiated after injection of
hyperpolarized HP001 through the right carotid artery as overlay on the
proton image of Fig. 4. The veins SSS, TRS (right) and STEMV (right)
coincide and the structure of finer vessels appear in the overlay.
RESULTS 1H MRA: Fig. 4 shows a contrast enhanced H 3D GRE image of
the cerebral vascular system. The large arrow indicates the
superior sagittal sinus (SSS), the small arrows indicate the
transverse sinuses (TRS) and the dotted arrows indicate the
superficial temporal vein (STEMV), posterior facial.
HP-13C-MRA, GRE: An excitation pulse flip angle of 5° was
found the optimal compromise between signal strength and
conversion of magnetization during the time series in a
separate study (data not shown). A time series of 8 frames
during intra-arterial injection is shown in Fig. 5. The best
image is the 4th time frame. The rat brain was centered in the
FOV, and arteries and veins of the right side of the head
appear with the largest denseness around the brain and towards
the nose region. Only a few veins appear in the left half of the
image, and only minor signal contribution is visible in the eye
region of the right side. Fig. 6 shows the 4th frame as overlay
on the proton image. Though the two angiographies are
obtained on different animals and positioning, the images are
in agreement and major venal structures (SSS, TRS, STEMV)
of the right side are identified.
A series of 3 consecutive intra-arterial injections of
hyperpolarized HP001 in an animal with intervals of
approximately one hour gave SNR 26, 19 and 20, as measured as
the ratio between the largest signal observed and the background
noise, and demonstrates reproducibility of the result.
18 injections in 10 animals yielded SNR of 17.6±4.5
(Mean±SD).
The corresponding GRE acquisition after an intravenous
injection yielded signal from the larger veins but with SNR lower
than 10 (acquired in 3 animals, image not shown).
HP-13C-MRA, bSSFP: The signal acquisition bandwidth was
studied in the range of 20-100 kHz, and we found 50 kHz to be
the optimal balance between high signal and minimal flow
artefacts. The sequence was started when the solution had been
fully injected to capture the maximum possible signal. In
separate experiments (data not shown), the flip angle for the
bSSFP- sequence was optimized on thermal phantom
experiments where a flip angle of 110° yielded a 22% higher
SNR than the corresponding experiment with 60° flip angle and
where flip angles higher than 110° did experiments on HP in vivo
experiments with the bSSFP (data not shown). A time series of
bSSFP acquired images with one second intervals is shown in
Fig. 7. SNR of 36 is observed in the first frame and the signal
decays rapidly in the following frames. The larger veins (SSS,
TRS, STEMV) identified from the overlay appear distinctly in a
symmetrical shape, and smaller venal structure appears towards
the nose region.
5 injections in 4 different animals yielded SNR of 31.3±20.0
(Mean±SD).
Fig. (5). Time series of GRE images initiated after injection of hyperpolarized HP001 through the right carotid artery. 1.3 s between each frame.

115
Fig. (7). bSSFP time series after finished injection of hyperpolarized
HP001 though the tail vein, 1 s between frames. Right image shows the
first image as overlay on the proton image of Fig. 4. The veins SSS, TRS
and STEMV coincide while smaller vessels are not distinguishable.
DISCUSSION
In this study we injected a dose close to the anticipated clinical
dose of ca. 0.4 mmol/kg, which is only 25-50% of the dose used
in previous studies with a similar polarization. We obtained
results similar to Golman et al., where an SNR of 34 was
demonstrated in a 128x128 matrix (70x70 mm2) in the rat heart
with an injection of 2-3 mL of 200 mM (ca. 1.5 mmol/kg)
solution with polarization of ca. 15% [19]. Svensson et al.
obtained SNR of 74-76 in a lower resolution of a 64x64 matrix
(70x70 mm2) placed in the rat head and neck region with
injection of 3-3.5 mL of 200 mM solution with a polarization of
ca. 15% [21].
The bSSFP sequence proved best for injections through the tail
vein where the physiological and physical reactions of the animal
are negligible, in contrary to injections through a carotid artery,
which caused minor mechanical movements of the neck and head
region where the catheter is inserted, as well as possible
physiological reactions in the imaged region due to the injected
bolus’ impact on the vessels due to pressure, pH, temperature and
tonicity. These movements caused motion artefacts in the bSSFP
acquisition, whereas a GRE sequence was more robust to
displacements and hence better suitable. Images of carotid artery
injection acquired with bSSFP (Fig. 8) showed a very high SNR
of 137. Even though this large signal from the high agent
concentration in the arteries was observed, the details of the
vascular system were indistinguishable. The sequence was
applied with TR/TE = 6.95/3.48 ms, α = 60° in a 128x128 matrix
with FOV 60x60 mm2 in a 30 mm slab.
The strong artefacts may be caused by motion due to the injection
as well as B0-field disturbances caused by the large difference in
oxygenated blood and the water introduced with the injection
[29].
The contrast agent is further diluted for tail vein injections. The
combination of small flip angle GRE acquisition and large
dilution in the vascular system resulted in SNR below 10.
Therefore, a bSSFP sequence with high flip angle is preferred.
The bSSFP-sequence had a slab thickness of 30 mm. In some
experiments, the transverse sinuses align orthogonally to the slice
and thus contribute with a large signal in the projection (arrow in
Fig. 7). These outliers cause the large variance where single
Fig. (8). bSSFP acquired image after intra-arterial injection demonstrates
high SNR of 137 and artefacts due to motion and susceptibility change.
pixels have yielded signal strength much larger than the rest of
the vasculature.
Large parts of the image characteristics in Fig. 5 are observed
throughout the series, while some features are vanishing in the
later time steps. The fact that the operated carotid has been sealed
off beneath the catheter explains that some of the branches have
closed off during several hours of occlusion in the scanner. The
image series and the consistency in the SNR indicate that
polarization, injection and data acquisition is reproducible.
When the bSSFP sequence was applied following an intraarterial
injection, we observe motion artefacts in the phase encoding
direction as shown in Fig. 8.
Polarizers for DNP have now been installed in several clinics
around the world, and studies of HP 13C in humans initiated [30].
As this equipment is being implemented, the application of
hyperpolarized agents for angiography will be further studied,
and a potential translation towards application in clinical practice
explored.
In conclusion, intravenous and intra-arterial injection techniques
were used in combinations with optimized GRE- and bSSFP-
imaging, respectively, for rat cerebral MRA with a
hyperpolarized 13C-labelled agent, and resulted in bSSFP-
imaging being preferable for intravenous injections, and GRE-
imaging being preferable for the intra-arterial injection
technique.
Hyperpolarized 13C MRA is currently unable to compete with
contrast enhanced MRA. Considering the complexity of the
method (primarily the need for polarizer hardware and the short
life time of the signal) it is unlikely that it will become an
attractive method. However, hyperpolarization is still an
immature methodology, and there are areas where current MRA
falls short. With further research into hyperpolarization to

116
increase the available signal, and possibly increase the life time,
there are opportunities for significant improvement.
CONFLICT OF INTEREST
The authors confirm that this article content has no conflict of
interest.
ACKNOWLEDGEMENTS
The authors want to thank Sascha Gude for her assistance with
the animal preparations.
We acknowledge funding from the Danish Research Council
grant 12-127232.
REFERENCES
[1] MacDonald ME, Frayne R. Cerebrovascular MRI: a review of
state-of-the-art approaches, methods and techniques. NMR
Biomed 2015; 28(7): 767-91. [2] Schroeder MA, Clarke K, Neubauer S, Tyler DJ. Hyperpolarized
magnetic resonance: A novel technique for the in vivo
assessment of cardiovascular disease. Circulation 2011; 124:
1580-94. [3] O’Leary DH, Bots ML. Imaging of atherosclerosis: carotid
intimamedia thickness. Eur heart J 2010; 31(14): 1682-9. [4] Kinner S, Maderwald S, Parohl N, et al. Contrast-enhanced
magnetic resonance angiography in rabbits: evaluation of the
gadolinium-based agent P846 and the iron-based blood pool
agent P904 in comparison with gadoterate meglumine. Invest
Radiol 2011; 46: 524-9. [5] Beckmann N. High resolution magnetic resonance angiography
non-invasively reveals mouse strain differences in the
cerebrovascular anatomy in vivo. Magn Reson Med 2000; 44:
252-8. [6] Reese T, Bochelen D, Sauter A, Beckmann N, Rudin M.
Magnetic resonance angiography of the rat cerebrovascular
system without the use of contrast agents. NMR Biomed 1999;
12: 189-96. [7] Howles GP, Ghaghada KB, Qi Y, Mukundan S, Johnson GA.
Highresolution magnetic resonance angiography in the mouse
using a nanoparticle blood-pool contrast agent. Magn Reson
Med 2009; 62: 1447-56. [8] Riederer SJ, Haider CR, Borisch EA, Weavers PT, Young PM.
Recent advances in 3D time-resolved contrast-enhanced MR
angiography. J Magn Reson Imaging 2015; 42: 3-22. [9] Kim WY, Danias PG, Stuber M, et al. Coronary magnetic
resonance angiography for the detection of coronary stenoses. N
Engl J Med 2001; 345: 1863-9. [10] Ardenkjær-Larsen JH, Fridlund B, Gram A, et al. Increase in
signal-to-noise ratio of >10, 000 times in liquid-state NMR. Proc
Natl Acad Sci USA 2003; 100: 10158-63. [11] Grant AK, Vinogradov E, Wang X, Lenkinski RE, Alsop DC.
Perfusion imaging with a freely diffusible hyperpolarized
contrast agent. Magn Reson Med 2011; 66: 746-55. [12] Johansson E, Månsson S, Wirestam R, et al. Cerebral perfusion
assessment by bolus tracking using hyperpolarized 13C. Magn
Reson Med 2004; 51: 464-72. [13] Johansson E, Olsson LE, Månsson S, et al. Perfusion assessment
with bolus differentiation: A technique applicable to
hyperpolarized tracers. Magn Reson Med 2004; 52: 1043-51. [14] Lau AZ, Miller JJ, Robson MD, Tyler DJ. Cardiac perfusion
imaging using hyperpolarized 13C urea using flow sensitizing
gradients. Magn Reson Med 2015, May 20. [Epub ahead of print].
[15] Day SE, Kettunen MI, Gallagher FA, et al. Detecting tumor
response to treatment using hyperpolarized 13C magnetic
resonance imaging and spectroscopy. Nat Med 2007; 13: 1382-
7. [16] Albers MJ, Bok R, Chen AP, et al. Hyperpolarized 13C lactate,
pyruvate, and alanine: Noninvasive biomarkers for prostate
cancer detection and grading. Cancer Res 2008; 68(20): 8607-
15. [17] Lauritzen MH, Søgaard LV, Madsen PL, Ardenkjær-Larsen JH.
Hyperpolarized metabolic MR in the study of cardiac function
and disease. Curr Pharm Des 2014; 20: 6162-70(9). [18] Dodd MS, Ball V, Bray R, et al. In vivo mouse cardiac
hyperpolarized magnetic resonance spectroscopy. J Cardiovasc
Magn Reson 2013; 15: 19. [19] Golman K, Ardenkjær-Larsen JH, Svensson J, et al.
13Cangiography. Acad Radiol 2002; 9(suppl 2): 507-10. [20] Golman K, Axelsson O, Jóhannesson H, Månsson S, Olofsson
C, Petersson. Parahydrogen-induced polarization in imaging:
Subsecond 13C angiography. Magn Reson Med 2001; 46: 1-5.
[21] Svensson J, Månsson S, Johansson E, Petersson JS, Olsson LE.
Hyperpolarized 13C MR angiography using trueFISP. Magn
Reson Med 2003; 50: 256-62. [22] Olsson LE, Chai C-M, Axelsson O, Karlsson M, Golman K,
Petersson JS. MR coronary angiography in pigs with intraarterial
injections of a hyperpolarized 13C substance. Magn Reson Med
2006; 55: 731-7. [23] Ardenkjær-Larsen JH, Laustsen C, Bowen S, Rizi R.
Hyperpolarized H2O MR angiography. Magn Reson Med 2014;
71: 50-6. [24] Leupold J, Månsson S, Petersson JS, Hennig J, Wieben O. Fast
multiecho balanced SSFP metabolite mapping of 1H and
hyperpolarized 13C compounds. Magn Reson Mater Phy 2009;
22: 251-6. [25] Leupold J, Wieben O, Månsson S. Fast chemical shift mapping
with multiecho balanced SSFP. Magn Reson Mater Phy 2006;
19: 26773. [26] Kauczor HU. Hyperpolarized helium-3 gas magnetic resonance
imaging of the lung. Top Magn Reson Imaging 2003; 14: 223-
30. [27] Deninger AJ, Månsson S, Petersson JS. Quantitative
measurement of regional lung ventilation using 3He MRI. Magn
Reson Med 2002; 48: 223-32. [28] Mugler JP, Altes TA. Hyperpolarized 129Xe MRI of the human
lung. J Magn Reson Imaging 2013; 37: 313-31. [29] Jain V, Abdulmalik O, Propert KJ, Wehrli FW. Investigating the
magnetic susceptibility properties of fresh human blood for
noninvasive oxygen saturation quantification. Magn Reson Med
2012; 68: 863-7. [30] Nelson SJ, Kurhanewicz J, Vigneron DB, et al. Metabolic
imaging of patients with prostate cancer using hyperpolarized
[1- 13C]pyruvate. Sci Transl Med 2013; 5(198): 198. ra108.
Received: July 19, 2015 Accepted: November 5, 2015

117
Paper IV

118
119
Magnetic Resonance in Medicine 00:00–00 (2016)
Renal MR Angiography and Perfusion in the Pig Using
Hyperpolarized Water
Kasper Wigh Lipsø,1 Esben Søvsø Szocska Hansen,2,3 Rasmus Stilling Tougaard,2,4
Christoffer Laustsen,2 and Jan Henrik Ardenkjær-Larsen1,5*
Purpose: To study hyperpolarized water as an angiography and
perfusion tracer in a large animal model. Methods: Protons dissolved in deuterium oxide (D2O) were
hyperpolarized in a SPINlab dissolution dynamic nuclear polarization
(dDNP) polarizer and subsequently investigated in vivo in a pig model
at 3 Tesla (T). Approximately 15 mL of hyperpolarized water was
injected in the renal artery by hand over 4–5 s. Results: A liquid state polarization of 5.3±6 0.9% of 3.8 M protons in
15 mL of deuterium oxide was achieved with a T1 of 24±6 1 s. This
allowed injection through an arterial catheter into the renal artery and
subsequently high-contrast imaging of the entire kidney parenchyma
over several seconds. The dynamic images allow quantification of
tissue perfusion, with a mean cortical perfusion of 504 ± 123 mL/100
mL/min.
Conclusion: Hyperpolarized water MR imaging was successfully
demonstrated as a renal angiography and perfusion method.
Quantitative perfusion maps of the kidney were obtained in agreement
with literature and control experiments with gadolinium contrast.
Magn Reson Med 000:000–000, 2016. © 2016 International Society
for Magnetic Resonance in Medicine
Key words: perfusion; magnetic resonance angiography;
hyperpolarization; DNP
INTRODUCTION
Magnetic resonance angiography (MRA) is an important tool for
diagnosing various medical conditions such as emboli, stenosis, and
aneurysms. More specifically, renal artery MRA allows detection
of renal vascular diseases such as fibromuscular dysplasia, venous
thrombosis, and arterial dissection (1). Submillimeter resolution
can be obtained with proton imaging, and further optimization can
be obtained by employing vascular contrast agents
1Department of Electrical Engineering, Technical University of Denmark, Kgs,
Lyngby, Denmark. 2Department of Clinical Medicine, MR Research Centre, Aarhus University, Aarhus,
Denmark. 3Danish Diabetes Academy, Odense, Denmark. 4Department of Cardiology - Research, Aarhus University Hospital, Aarhus, Denmark. 5GE Healthcare, Brøndby, Denmark. Grant sponsor: Danish Research Council; Grant number: 12-127232; Grant sponsor:
Danish National Research Foundation; Grant number: DNRF124.
*Correspondence to: Jan Henrik Ardenkjær-Larsen, Ph.D., DTU Electrical
Engineering, Ørsteds Plads, Building 349, Room 126, 2800 Kgs. Lyngby, Denmark.
Tel: (0045) 4525 3918; E-mail: [email protected]. Received 28 June 2016; revised 8 August 2016; accepted 1 September 2016
DOI 10.1002/mrm.26478
Published online 00 Month 2016 in Wiley Online Library (wileyonlinelibrary. com).
such as gadolinium (Gd) based blood pool agents (2) or
nanoparticles (3). Despite significant improvement in scanner
technology and reconstruction methods (4–6), MRA evaluation of
small vessels is still challenging. This is primarily due to the
inherent low sensitivity of MR, in which the signal is proportional
to the polarization of protons in the blood stream.
It has been demonstrated that this sensitivity problem can be
overcome by hyperpolarizing nuclear spins (7). The method has
recently been introduced in patients using [1-13C]pyruvate (8). By
enhancing the polarization of 13C by many orders of magnitude,
the detected signal is increased dramatically, allowing in situ
conversion of metabolic 13C-containing compounds to be imaged.
The procedure of increasing polarization beyond thermal level,
hyperpolarization (HP), can be achieved by dissolution dynamic
nuclear polarization (dDNP), in which the high polarization of the
high-gamma electrons, at cryogenic temperature and high
magnetic field strength, is transferred to the nuclei by irradiation
with microwaves. By rapid dissolution in a hot medium, the
hyperpolarized nuclei can be brought to liquid state and injected
into the patient before the polarization is lost as a result of
longitudinal relaxation (7). Alternatively, metabolically inert 13C-
labeled molecules can be used for angiographic imaging (9–11), as
demonstrated in rodent and porcine models, and for perfusion of
rodent organs (12–15) or of tumor models (16,17). 13C or 15N-
labeled molecules for angiography and perfusion imaging exploits
the long T1 for selected 13C and 15N molecules and the low signal
background (18). Despite these advantages, these molecules
exhibit partial permeability and active transport limitations.
A more accurate technique for water perfusion measurements is
therefore necessary (19,20). A way to measure the perfusion of
water molecules directly exists, using 15O-labeled water as a tracer
for positron emission tomography (PET) imaging (21,22), with the
main drawbacks being the use of a radioactive tracer and the
limited spatial and temporal resolution of PET. Using
hyperpolarized water for angiographic and perfusion imaging
overcomes several of these limitations. Water protons for imaging
have previously been hyperpolarized by use of the Overhauser
effect (23). However, the maximum achievable magnetization is
limited. Typically, an enhancement of 100 times at 0.35T can be
obtained for pure water (H2O), corresponding to a polarization of
0.001%. Higher polarizations have been reached with dissolution-
DNP using the 3.35T HyperSense polarizer, in which 3–4mL of
5M 1H in D2O with a polarization of 3–5% have been applied to
biomolecular NMR studies
© 2016 International Society for Magnetic Resonance in Medicine 1
120
2 Lipsø et al
(24) or MR angiographies in the rat (25). Correcting for the
difference in proton concentration, this corresponds to an available
signal of two orders of magnitude larger than the Overhauser
experiments. Imaging of hyperpolarized protons allows for the use
of coils and pulse sequences already available in the clinical setting.
Much more effort has gone into optimizing pulse sequences for
optimal performance for proton imaging than for other nuclei.
Moreover, the magnetization achievable with hyperpolarized water
is superior to other nuclei, because of its large gyromagnetic ratio
(γ1H ≈ 4 · γ13C) and the potentially high proton concentration. As a
tracer for perfusion, hyperpolarized water has additional interesting
properties. Water diffuses freely in the vascular bed and
intracellularly, hence providing information not obtainable with
larger compounds such as Gd-based MR contrast agents or larger
nuclear tracers. Compared with the slow washout rate of
conventional MR contrast agents (26), the T1 value of
hyperpolarized tracers hampers image acquisition, as well as
reduces the spatial range of measurable perfusion. However, the
signal enhancement of hyperpolarization facilitates higher
resolution and faster image acquisition, which allow us to trace the
permeable protons in detail—with the stated limitations.
The purpose of this study was to demonstrate that hyperpolarized
water can be used as a tracer to provide subsecond, high-resolution
angiographies in pigs by intra-arterial injection in the renal artery,
and that accurate perfusion maps can be obtained with good signal-
to-noise ratio (SNR).
METHODS
The polarizer and fluid path have been described in detail in (27).
Briefly, the dDNP polarizer operates at 5T and approximately 0.9
K. The sample and solvent was loaded into a fluid path that allows
the sample to be polarized in the magnetic field at low temperature
under microwave irradiation. The solvent was contained in a
syringe that connects to the vial using two concentric tubes (inner
and outer tube) and a valve. The syringe was placed in a
heater/pressure module outside the polarizer cryostat. During
dissolution, the hyperpolarized solution leaves the polarizer
through an exit tube.
Sample and Solvent Preparation
A sample of 1mL 30mM TEMPO (2,2,6,6-Tetramethylpiperidine
1-oxyl, 98%, Sigma Aldrich, Copenhagen, Denmark) in
H2O/glycerol 1:1 (w/w) was prepared. The sample was placed in
the fluid path vial and frozen in liquid nitrogen. Dissolution
medium (DM) consisted of D2O with 1mM calcium disodium
ethylenediaminetetraacetic acid (EDTA) and 9g/L NaCl (both
Sigma Aldrich, Denmark).
31.01g DM (28mL) was filled in the syringe and degassed by
bubbling with helium gas for 10min. The fluid path was flushed
with helium gas for 2min to remove air and ensure clear passage.
Polarization
The sample vial was rapidly transferred from the liquid nitrogen
bath to the 5T magnet in the polarizer (SPINlab, GE Healthcare,
Brøndby, Denmark). The sample was irradiated with approximately
50 mW microwaves at 139.923 GHz for 1h.
Dissolution
The syringe containing the DM was heated to 130C for 1h before
dissolution while being under pressure. The piston of the syringe
was driven with 16-bar pressure during dissolution. The dissolved
sample was injected through the exit tube into a separatory funnel
(100mL) containing 25mL of heptane (>99%, Sigma Aldrich,
Copenhagen, Denmark) to extract the radical from the aqueous
phase. The heptane had been degassed by flushing with helium gas
in the funnel for 10min. The funnel was shaken heavily during
dissolution for a total of 10 s from dissolution start. The lower,
aqueous phase was extracted into a syringe before transferring to
the scanner room. The proton concentration in the dissolved sample
was analyzed by NMR after the addition of 2M formate solution as
reference.
Animal Protocol
All animal experiments were carried out in compliance with the
guidelines for use and care of laboratory animals and were approved
by the Danish Inspectorate of Animal Experiments. Four healthy
30-kg female Danish domestic pigs were presedated with
intramuscular injection of Stressnil (1mL/kg) and Midazolam
(1mL/kg), and anesthesia was maintained by continuous infusion of
Propofol (0.4mg/kg/h) and Fentanyl (8mg/kg/h). The animals were
intubated and mechanically ventilated with a 60% O2-air mix.
A 6-F introducer sheath was positioned in the left common
femoral artery by ultrasound guidance to allow access for a 6F, JR
4.0 angiography catheter to be placed in the left main renal artery
using X-ray guidance. The angiography catheter was repeatedly
flushed with heparinized sterile water to avoid occlusion. 15mL HP
water was injected over 5 s, initiated approximately 22 s after
dissolution.
Through a vein access in the right ear, a bolus of 0.2 mmol/kg
Gd-DTPA (Gadobutrol, Gadovist, Bayer Schering Pharma, Berlin,
Germany) was administered manually for conventional T1-DCE-
MRI.
MRI Acquisition
MRI detection was performed on a 3T GE HDx with an eight-
channel cardiac array receiver coil (GE Healthcare, Milwaukee,
Wisconsin, USA). Phantom experiments were performed with a
gradient echo sequence using a flip angle of 1°, matrix size 128 x
128, field of view (FOV)=(24mm)2 in a slab of 40 mm with
repetition time (TR)=3 ms, echo time (TE)=0.784 ms. The
acquisition time of each frame was 450 ms, and images were
acquired with a time delay of 1 s.
Axial and coronal images were acquired to cover both kidneys to
allow for planning of the angiography slice
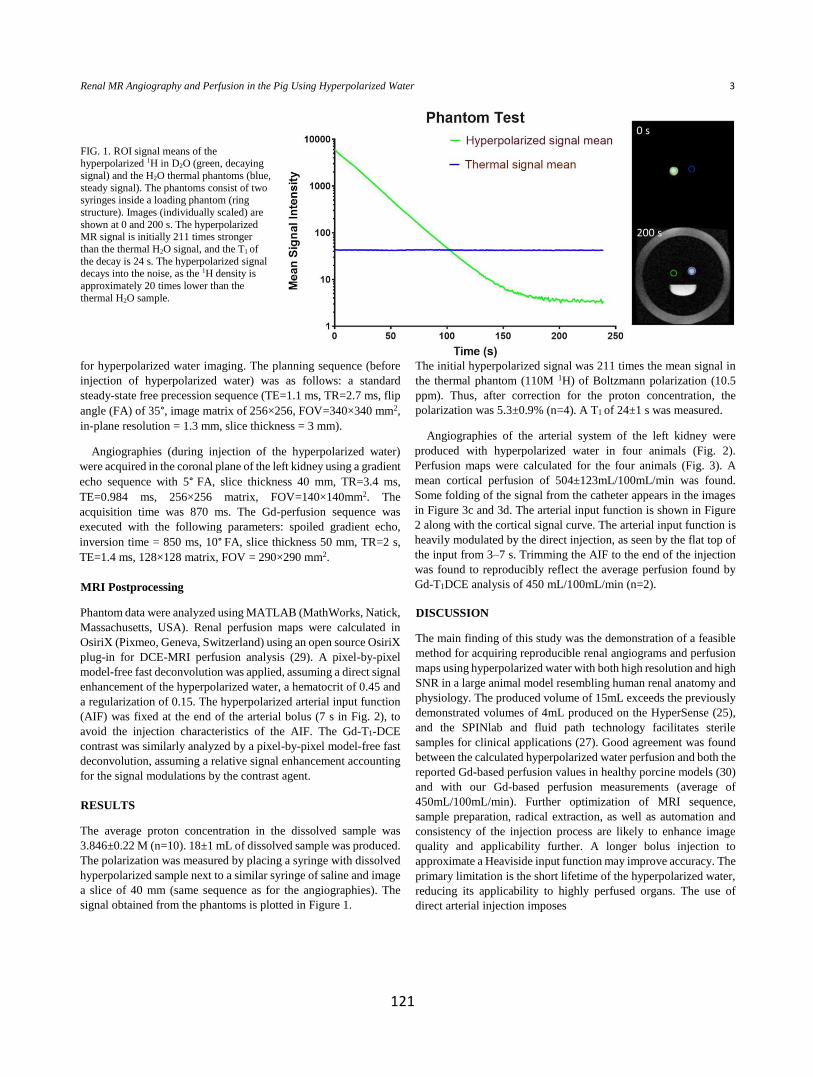
121
for hyperpolarized water imaging. The planning sequence (before
injection of hyperpolarized water) was as follows: a standard
steady-state free precession sequence (TE=1.1 ms, TR=2.7 ms, flip
angle (FA) of 35°, image matrix of 256×256, FOV=340×340 mm2,
in-plane resolution = 1.3 mm, slice thickness = 3 mm).
Angiographies (during injection of the hyperpolarized water)
were acquired in the coronal plane of the left kidney using a gradient
echo sequence with 5° FA, slice thickness 40 mm, TR=3.4 ms,
TE=0.984 ms, 256×256 matrix, FOV=140×140mm2. The
acquisition time was 870 ms. The Gd-perfusion sequence was
executed with the following parameters: spoiled gradient echo,
inversion time = 850 ms, 10° FA, slice thickness 50 mm, TR=2 s,
TE=1.4 ms, 128×128 matrix, FOV = 290×290 mm2.
MRI Postprocessing
Phantom data were analyzed using MATLAB (MathWorks, Natick,
Massachusetts, USA). Renal perfusion maps were calculated in
OsiriX (Pixmeo, Geneva, Switzerland) using an open source OsiriX
plug-in for DCE-MRI perfusion analysis (29). A pixel-by-pixel
model-free fast deconvolution was applied, assuming a direct signal
enhancement of the hyperpolarized water, a hematocrit of 0.45 and
a regularization of 0.15. The hyperpolarized arterial input function
(AIF) was fixed at the end of the arterial bolus (7 s in Fig. 2), to
avoid the injection characteristics of the AIF. The Gd-T1-DCE
contrast was similarly analyzed by a pixel-by-pixel model-free fast
deconvolution, assuming a relative signal enhancement accounting
for the signal modulations by the contrast agent.
RESULTS
The average proton concentration in the dissolved sample was
3.846±0.22 M (n=10). 18±1 mL of dissolved sample was produced.
The polarization was measured by placing a syringe with dissolved
hyperpolarized sample next to a similar syringe of saline and image
a slice of 40 mm (same sequence as for the angiographies). The
signal obtained from the phantoms is plotted in Figure 1.
The initial hyperpolarized signal was 211 times the mean signal in
the thermal phantom (110M 1H) of Boltzmann polarization (10.5
ppm). Thus, after correction for the proton concentration, the
polarization was 5.3±0.9% (n=4). A T1 of 24±1 s was measured.
Angiographies of the arterial system of the left kidney were
produced with hyperpolarized water in four animals (Fig. 2).
Perfusion maps were calculated for the four animals (Fig. 3). A
mean cortical perfusion of 504±123mL/100mL/min was found.
Some folding of the signal from the catheter appears in the images
in Figure 3c and 3d. The arterial input function is shown in Figure
2 along with the cortical signal curve. The arterial input function is
heavily modulated by the direct injection, as seen by the flat top of
the input from 3–7 s. Trimming the AIF to the end of the injection
was found to reproducibly reflect the average perfusion found by
Gd-T1DCE analysis of 450 mL/100mL/min (n=2).
DISCUSSION
The main finding of this study was the demonstration of a feasible
method for acquiring reproducible renal angiograms and perfusion
maps using hyperpolarized water with both high resolution and high
SNR in a large animal model resembling human renal anatomy and
physiology. The produced volume of 15mL exceeds the previously
demonstrated volumes of 4mL produced on the HyperSense (25),
and the SPINlab and fluid path technology facilitates sterile
samples for clinical applications (27). Good agreement was found
between the calculated hyperpolarized water perfusion and both the
reported Gd-based perfusion values in healthy porcine models (30)
and with our Gd-based perfusion measurements (average of
450mL/100mL/min). Further optimization of MRI sequence,
sample preparation, radical extraction, as well as automation and
consistency of the injection process are likely to enhance image
quality and applicability further. A longer bolus injection to
approximate a Heaviside input function may improve accuracy. The
primary limitation is the short lifetime of the hyperpolarized water,
reducing its applicability to highly perfused organs. The use of
direct arterial injection imposes
Renal MR Angiography and Perfusion in the Pig Using Hyperpolarized Water 3
FIG. 1. ROI signal means of the hyperpolarized 1H in D2O (green, decaying
signal) and the H2O thermal phantoms (blue,
steady signal). The phantoms consist of two syringes inside a loading phantom (ring
structure). Images (individually scaled) are
shown at 0 and 200 s. The hyperpolarized MR signal is initially 211 times stronger
than the thermal H2O signal, and the T1 of
the decay is 24 s. The hyperpolarized signal decays into the noise, as the 1H density is
approximately 20 times lower than the
thermal H2O sample.
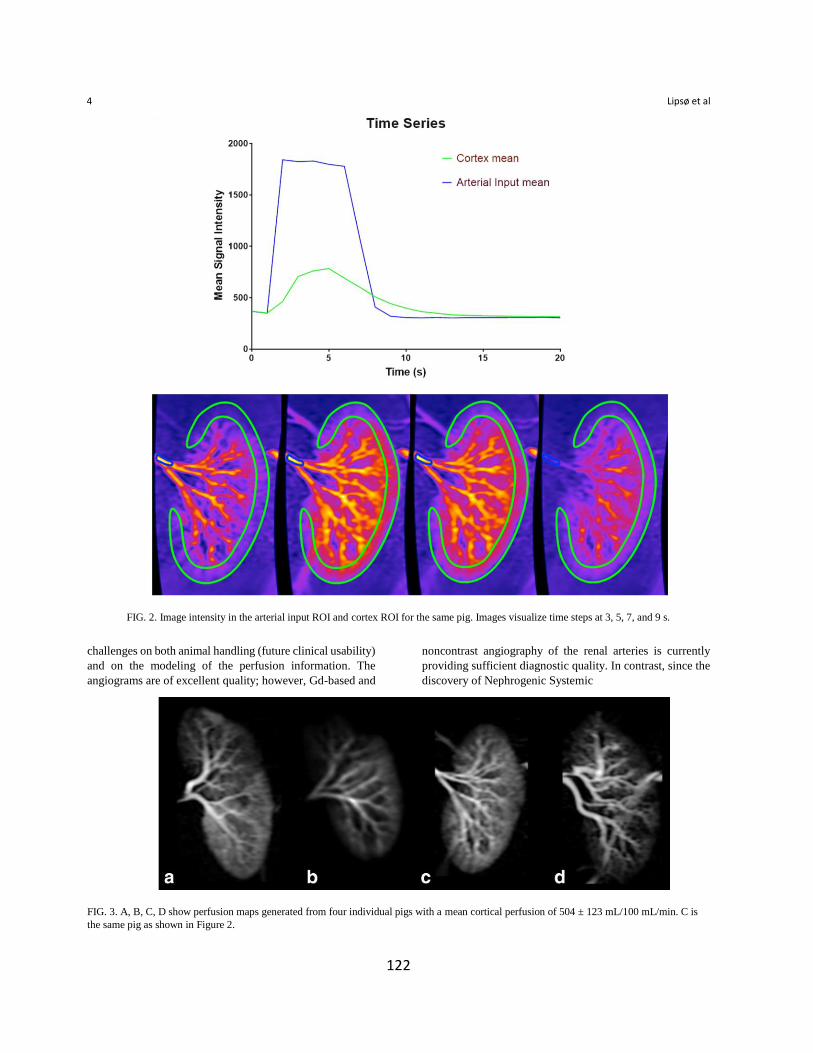
122
4 Lipsø et al
FIG. 2. Image intensity in the arterial input ROI and cortex ROI for the same pig. Images visualize time steps at 3, 5, 7, and 9 s.
challenges on both animal handling (future clinical usability)
and on the modeling of the perfusion information. The
angiograms are of excellent quality; however, Gd-based and
noncontrast angiography of the renal arteries is currently
providing sufficient diagnostic quality. In contrast, since the
discovery of Nephrogenic Systemic
FIG. 3. A, B, C, D show perfusion maps generated from four individual pigs with a mean cortical perfusion of 504 ± 123 mL/100 mL/min. C is
the same pig as shown in Figure 2.

123
Fibrosis, new MR methods to measure perfusion may have a
role. In addition to the specific extravasation properties of
water relative to any other molecule, the signal that can be
created by hyperpolarized 1H exceeds that of any other
magnetic nucleus (eg, 13C).
Both the radical and molecular oxygen in the sample
induce dipolar relaxation that reduces the longitudinal
relaxation time T1. Thus, the radical extraction in the organic
phase as well as the oxygen removal during preparation are
crucial elements for achieving long T1 and, ultimately, high
polarization after substance transferring. TEMPO was
chosen without optimization as a good compromise between
water solubility and preferential partitioning to the heptane
phase. The proton concentration was chosen as an optimal
compromise between the limitation of the intermolecular
dipolar relaxation between proton nuclei and achievement of
high signal in the injectable sample. We believe that the 1 H
signal (polarization) can be further increased by a factor of
five by optimization of the solid-state DNP polarization and
the reduction of losses in the dissolution.
The ability to hyperpolarize water protons in a polarizer
designed for clinical use, with sufficient polarization to allow
ultrafast angiographic and perfusion assessment, shows great
promise for future clinical translation.
REFERENCES
1. Attenberger UI, Morelli JN, Schoenberg SO, Michaely HJ. Assessment
of the kidneys: magnetic resonance angiography, perfusion and diffusion.
J Cardiovasc Magn Reson 2011;13:1–13. 2. Kinner S, Maderwald S, Parohl N, Albert J, Corot C, Robert P,
Barkhausen J, Vogt FM. Contrast-enhanced magnetic resonance
angiography in rabbits: evaluation of the gadolinium-based agent p846
and the iron-based blood pool agent p904 in comparison with gadoterate
meglumine. Invest Radiol 2011;46:524–529. 3. Howles GP, Ghaghada KB, Qi Y, Mukundan S, Johnson GA. High-
resolution magnetic resonance angiography in the mouse using a
nanoparticle blood-pool contrast agent. Magn Reson Med 2009;62:1447–
1456. 4. Addy NO, Ingle RR, Wu HH, Hu BS, Nishimura DG. High-resolution
variable-density 3D cones coronary MRA. Magn Reson Med 2015;74:
614–621. 5. Koktzoglou I, Murphy IG, Giri S, Edelman RR. Quiescent interval low
angle shot magnetic resonance angiography of the extracranial carotid
arteries. Magn Reson Med 2016;75:2072–2077. 6. Nezafat M, Henningsson M, Ripley DP, Dedieu N, Greil G, Greenwood
JP, Bornert P, Plein S, Botnar RM. Coronary MR angiography at 3T: fat
suppression versus water-fat separation. Magn Reson Mater Physics Biol
Med 2016. doi: 10.1007/s10334-016-0550-7. 7. Ardenkjær-Larsen JH, Fridlund B, Gram A, Hansson G, Hansson
L,Lerche MH, Servin R, Thaning M, Golman K. Increase in signal-to-
noise ratio of>10,000 times in liquid-state NMR. Proc Natl Acad Sci U S
A 2003;100:10158–10163. 8. Nelson SJ, Kurhanewicz J, Vigneron DB, et al. Metabolic imaging of
patients with prostate cancer using hyperpolarized [1- 13C] pyruvate. Sci
Transl Med 2013:5;198ra108. 9. Golman K, Axelsson O, Johannesson H, Månsson S, Olofsson C,
Petersson JS, Parahydrogen-induced polarization in imaging: subsecond
13C angiography. Magn Reson Med 2001;46:1–5.
10. Svensson J, Månsson S, Johansson E, Petersson JS, Olsson LE.
Hyperpolarized 13C MR angiography using trueFISP. Magn Reson Med 2003;50:256–262.
11. Lipsø KW, Magnusson P, Ardenkjær-Larsen JH. Hyperpolarized (13)C
MR angiography. Curr Pharm Des 2016;22:90–95. 12. Qi H, Nørlinger TS, Nielsen PM, Bertelsen LB, Mikkelsen E, Xu
Y,Stødkilde-Jørgensen H, Laustsen C. Early diabetic kidney maintains
the corticomedullary urea and sodium gradient. Physiol Rep 2016;4:1–6. 13. Lau AZ, Miller JJ, Robson MD, Tyler DJ. Cardiac perfusion imaging
using hyperpolarized (13)C urea using flow sensitizing gradients. Magn
Reson Med 2016;75:1474–1483. 14. Lau AZ, Miller JJ, Robson MD, Tyler DJ. Simultaneous assessment of
cardiac metabolism and perfusion using copolarized [1-(13) C]pyruvate
and (13) C-urea. Magn Reson Med 2016. doi: 10.1002/mrm. 26106. 15. Von Morze C, Bok RA, Reed GD, Ardenkjær-Larsen JH, KurhanewiczJ,
Vigneron DB. Simultaneous multiagent hyperpolarized 13C perfusion
imaging. Magn Reson Med 2014;72:1599–1609. 16. Park I, von Morze C, Lupo JM, Ardenkjær-Larsen JH, Kadambi A,
Vigneron DB, Nelson SJ. Investigating tumor perfusion by
hyperpolarized 13C MRI with comparison to conventional gadolinium
contrast-enhanced MRI and pathology in orthotopic human GBM
xenografts. Magn Reson Med 2016. doi: 10.1002/mrm.26155. 17. Von Morze C, Larson PEZ, Hu S, Yoshihara HAI, Bok RA, Goga A,
Ardenkjær-Larsen JH, Vigneron DB. Investigating tumor perfusion and
metabolism using multiple hyperpolarized 13C compounds: HP001,
pyruvate and urea. Magn Reson Imaging 2012;30:305–311. 18. Durst M, Chiavazza E, Haase A, Aime S, Schwaiger M, Schulte RF. α-
trideuteromethyl[15N]glutamine: A long-lived hyperpolarized perfusion
marker. Magn Reson Med 2016. doi: 10.1002/mrm.26104. 19. Bergmann SR, Herrero P, Markham J, Weinheimer CJ, Norine M.
Noninvasive quantitation of myocardial blood flow in human subjects
with oxygen-15-labeled water and positron emission tomography. J Am
Coll Cardiol 1989;14:639–652. 20. De Langen AJ, van den Boogaart VEM, Marcus JT, Lubberink M. Useof
H2(15)O-PET and DCE-MRI to measure tumor blood flow. Oncologist
2008;13:631–644. 21. Herscovitch P, Markham J, Raichle ME. Brain blood flow measured with
intravenous H215O. I: Theory and error analysis. J Nucl Med
1983;24:782–789. 22. Raichle ME, Martin WRW, Herscovltch P, Mintun MA, Markham
J.Brain blood flow measured with intravenous H215O: II:
Implementation and validation. J Nucl Med 1983;24:790–798. 23. McCarney ER, Armstrong BD, Lingwood MD, Han S. Hyperpolarized
water as an authentic magnetic resonance imaging contrast agent. Proc
Natl Acad Sci U S A 2007;104:1754–1759. 24. Harris T, Szekely O, Frydman L. On the potential of hyperpolarized water
in biomolecular NMR studies. J Phys Chem B 2014;118:3281– 3290. 25. Ardenkjær-Larsen JH, Laustsen C, Bowen S, Rizi R. HyperpolarizedH2O
MR angiography. Magn Reson Med 2014;71:50–56. 26. Schoenberg SO, Rieger J, Weber CH, Michaely HJ, Waggershauser
T,Ittrich C, Dietrich O, Reiser MF. High-spatial-resolution MR
angiography of renal arteries with integrated parallel acquisitions:
comparison with digital subtraction angiography and US. Radiology
2005;235: 687–698. 27. Ardenkjær-Larsen JH, Leach AM, Clarke N, Urbahn J, Anderson D,
Skloss TW. Dynamic nuclear polarization polarizer for sterile use intent.
NMR Biomed 2011;24:927–932. 28. Zollner FG, Weisser G, Reich M, Kaiser S, Schoenberg SO, Sourbron SP,
Schad LR. Ummperfusion: an open source software tool towards
quantitative MRI perfusion analysis in clinical routine. J Digit Imaging
2013;26:344–352. 29. Wentland AL, Artz NS, Fain SB, Grist TM, Djamali A, Sadowski EA.MR
measures of renal perfusion, oxygen bioavailability and total renal blood
flow in a porcine model: noninvasive regional assessment of renal
function. Nephrol Dial Transplant 2012;27:128–135.

124

125
Paper V

126

127
Manuscript in preparation
Dynamic Coronary MR Angiography in the Pig using
Hyperpolarized Water
Kasper Wigh Lipsø, M.Sc.1, Esben Søvsø Szocska Hansen M.Sc2,3, Rasmus Stilling Tougaard,
MD2,4, Christoffer Laustsen, PhD2 and Jan Henrik Ardenkjær-Larsen, PhD1,5
1Department of Electrical Engineering, Technical University of Denmark, Kgs. Lyngby, Denmark.
2Department of Clinical Medicine, MR Research Centre, Aarhus University, Aarhus, Denmark
3Danish Diabetes Academy, Odense, Denmark
4Department of Cardiology - Research, Aarhus University Hospital, Aarhus, Denmark
5GE Healthcare, Brøndby, Denmark.
Abstract
Rationale: Magnetic resonance imaging is a safe modality providing high-resolution images of soft tissue.
However, the inherent low sensitivity limits the achievable signal and contrast. Hyperpolarization has been shown
to increase the signal several orders of magnitude, and recently been translated to human cardiac application. The
use of hyperpolarization suggests that large reductions in scan time can be achieved, enabling the high temporal
resolution required to acquire dynamic cardiac images without motion artifacts for coronary flow and tissue
perfusion assessment.
Objective: To demonstrate the first dynamic coronary magnetic resonance angiographies using hyperpolarized
water.
Methods and Results: Water was hyperpolarized using dissolution dynamic nuclear polarization at 5 T to a
polarization of >5% in a clinical polarizer. Sample was injected into the coronary arteries of Danish landrace
pigs (N = 9, 3 injections in 3 different animals) over 6 s. MRI images were acquired with a gradient echo
sequence of 5° flip angle in a tilted slab covering the main right coronary arteries. The acquisition time of each
frame was 870 ms.
Conclusions: High signal-to-noise MR angiography of the coronary arteries of a large animal model with high
spatial resolution and temporal resolution was demonstrated. The dynamic first pass nature of the positive
contrast examination, allows perfusion analysis of the water movement from the arteries to the capillary bed of
the cardiac tissue.
Key words: Coronary Angiography, Cardiac Perfusion, Magnetic Resonance Angiography, Hyperpolarization,
dissolution-DNP
___________________________________________________________________________________
Name and complete address for correspondence: Jan Henrik Ardenkjær-Larsen, DTU Electrical Engineering,
Ørsteds Plads, Building 349, room 126, 2800 Kgs. Lyngby, Denmark. Tel (0045) 4525 3918. E-mail:
Sources of Funding: This work was supported by the Danish Research Council (grant number 12-127232) and
the Danish National Research Foundation (grant number DNRF124).
Disclosures: The authors report no conflicts.
Introduction

128
Magnetic Resonance Angiography (MRA) for coronary artery imaging has so far failed to translate into
widespread clinical use1,2. This is partly due to the inherent low sensitivity of current MRA methods, extending
the acquisition time to several minutes and multiple respiration and heart cycles3. Coronary arteries are challenging
structures to image with MRI due to the small and tortuous vessel structures and motion. Therefore, successful
coronary MRA requires high-resolution, whole-heart imaging, and effective motion suppression. Current free-
breathing protocols use segmented acquisitions with prospective electrocardiography (ECG) and navigator gating
to suppress cardiac and respiratory motion artefacts and blurring. The current strategy for cardiac gating means
that the acquisition window is well within one of the quiescent periods, leaving the remaining time (80-90%)
unused.
Today, the typical first-line test for evaluation of Coronary Artery Disease (CAD) is stress SPECT Myocardial
Perfusion Imaging (MPI) or contrast-enhanced Coronary CT coronary Angiography (CCTA)4. Increasing evidence
support the altered myocardial perfusion as an accurate diagnostic marker of CAD4. Water perfusion is of
particular interest and has been demonstrated with 15O-labeled water in positron emission tomography (PET)5–8.
To date, MR contrast agents consist of other compounds (primarily Gadolinium-based chelates), with different
permeability dynamics than water9,10. Recent advances have introduced Arterial Spin Labeling (ASL) to map the
perfusion of blood in the myocardial tissue11,12, however, common to these methods is the inherent low sensitivity,
and thus lack of robustness and diagnostic quality.
One way to dramatically increase the sensitivity of MRI is hyperpolarization. In hyperpolarization, we detect the
magnetic resonance signal from a molecule that has gone through an activation process, hyperpolarization, to
enhance the nuclear spin polarization by many orders of magnitude13. The hyperpolarized state decay at a rate that
is slow enough to allow us to follow the fate of the molecule for seconds to minutes. Hyperpolarization is typically
performed on endogenous, metabolically active 13C labelled molecules, such as [1-13C]pyruvate. The method that
has recently been translated to human use for characterization of cancer14 or assessment of myocardial
metabolism15. Imaging of hyperpolarized inert 13C labelled molecules for angiography and perfusion has been
demonstrated in both rodent and large animal models16–20. The direct detection of signal from injected molecules,
improves the quantification of the perfusion compared to conventional perfusion methods21–27.
MRI of hyperpolarized carbon-13 suffers from needing specialized scanner hardware and coils and a lack of
optimized pulse sequences. Instead, hyperpolarization of the protons of water molecules would allow the use of
conventional MR hardware and pulse sequences. In addition to compatibility with existing equipment, protons
have the advantage of a four times higher magnetic moment than that of 13C, resulting in a larger magnetization,
and hence signal. The main drawback of hyperpolarized water is the short relaxation time. After hyperpolarization,
during handling, transfer and injection, the relaxation time is 20-30 s28,29, but as soon as the water protons have
been injected into the blood stream, the relaxation time reduces to a few seconds30 requiring intra-arterial injection.
Hyperpolarized water has been demonstrated for MRI angiographies in small animal models, where the cerebral
network and the vena cava were imaged30, and was recently applied for angiographies of the pig renal arteries, and
perfusion measurements of the kidney tissue29. In this study, we hypothesize that high resolution dynamic coronary
MRA and myocardial perfusion can be acquired using hyperpolarized water. This may be combined with the
metabolic assessment as demonstrated by Cunningham et al.13 to provide both metabolic and hemodynamic
information within the same scan session.
129
Methods
Sample and medium preparation: A sample of 1 mL 30 mM TEMPO (2,2,6,6-Tetramethylpiperidine 1-oxyl, 98%)
in H2O/glycerol 1:1 (w/w) was prepared. Dissolution medium consisted of D2O with 1 mM calcium disodium
ethylenediaminetetraacetic acid (EDTA) and 9 g/L NaCl (all from Sigma Aldrich, Denmark).
Fluid path filling: The fluid path consisted of a syringe, from which the heated dissolution medium was transferred
in an inner concentric tube to the sample vial for dissolution of the sample. The dissolved sample was transferred
out of the magnetic field in the outer concentric tube.
The sample was placed in the vial using a 150 cm filling tube31 and frozen in liquid nitrogen. 31.01 g dissolution
medium (28 mL) was filled in the syringe and degassed by bubbling with helium gas for 10 minutes. The fluid
path was flushed with helium gas for 2 minutes in order to remove air and ensure clear passage.
Polarization: The sample vial was rapidly transferred from the liquid nitrogen bath to the 5 T magnet in the
polarizer (SPINlab, GE Healthcare, Brøndby, Denmark). The sample was irradiated with app. 50 mW microwaves
at 139.923 GHz for one hour.
Dissolution: The syringe containing the dissolution medium was heated to 130 °C one hour before dissolution.
The piston in the syringe was driven with 16 bar pressure. The dissolved sample was injected into a sealed
separatory funnel (150 mL) containing 25 mL of heptane (>99%, Sigma Aldrich, Denmark). The heptane had been
degassed by flushing with helium gas in the funnel for 10 minutes. The funnel was shaken heavily during
dissolution for a total of 10 s from dissolution start. The lower, aqueous phase was extracted into a syringe before
transferring to the scanner room. The proton concentration in the dissolved sample was analyzed by NMR after
addition of 0.2 M potassium formate (Sigma Aldrich, Denmark) as reference.
Animal protocol: All animal experiments were carried out in compliance with the guidelines for use and care of
laboratory animals and were approved by the Danish Inspectorate of Animal Experiments. Three healthy 30 kg
female Danish domestic pigs were pre-sedated with intramuscular injection of Stressnil (1 mL/kg), and Midazolam
(1 mL/kg), and anesthesia was maintained by continuous intravenous infusion of Propofol (0.4 mg/kg/h) and
Fentanyl (8 ng/kg/h). The animals were intubated and mechanically ventilated with a 60 % O2-air mix.
A 6 F introducer sheath was positioned in the left common femoral artery by ultrasound guidance to allow access
for a 6F, JR 4.0, angiography catheter to be placed in the left LAD coronary artery via x-ray guidance. The
angiography catheter was repeatedly flushed with heparinized sterile water to avoid occlusion. 15 mL
hyperpolarized water was injected over 5 s, initiated approximately 22 s after dissolution.
MRI acquisition: MRI detection was performed on a 3 T GE HDx with an 8-channel cardiac array receiver coil
(GE Healthcare, Milwaukee, WI, USA). Axial and coronal images were acquired to cover the heart to allow for
planning of the angiography slab for hyperpolarized water imaging. The sequence was as follows: a 3D T1
weighted sequence with a standard steady state free precession sequence (TE = 1.1 ms, TR = 2.7 ms, FA = 35°,
image matrix 256x256, FOV = 340x340 mm2, in-plane resolution of 1.3 mm and slice thickness of 3 mm).
Angiographies were acquired in a tilted plane covering the left anterior descending artery (LAD) using a gradient
echo sequence with FA = 5°, slice thickness of 40 mm, TR = 3.4 ms, TE = 0.984 ms, matrix size 256x256 and
FOV = 140x140 mm2. The acquisition time was 870 ms.
ROI analysis of the images were performed in OsiriX (Pixmeo, Geneva, Switzerland). Apparent signal-to-noise
ratio (aSNR) and coronary sharpness were measured to quantify image performance32. aSNR was measured at the
left main stem coronary artery where the catheter was positioned (signal at bolus peak / SD prior injection) and
coronary sharpness was measured in the proximal LAD at bolus peak – reported as mean and standard deviation
between the individual shots (N = 8).
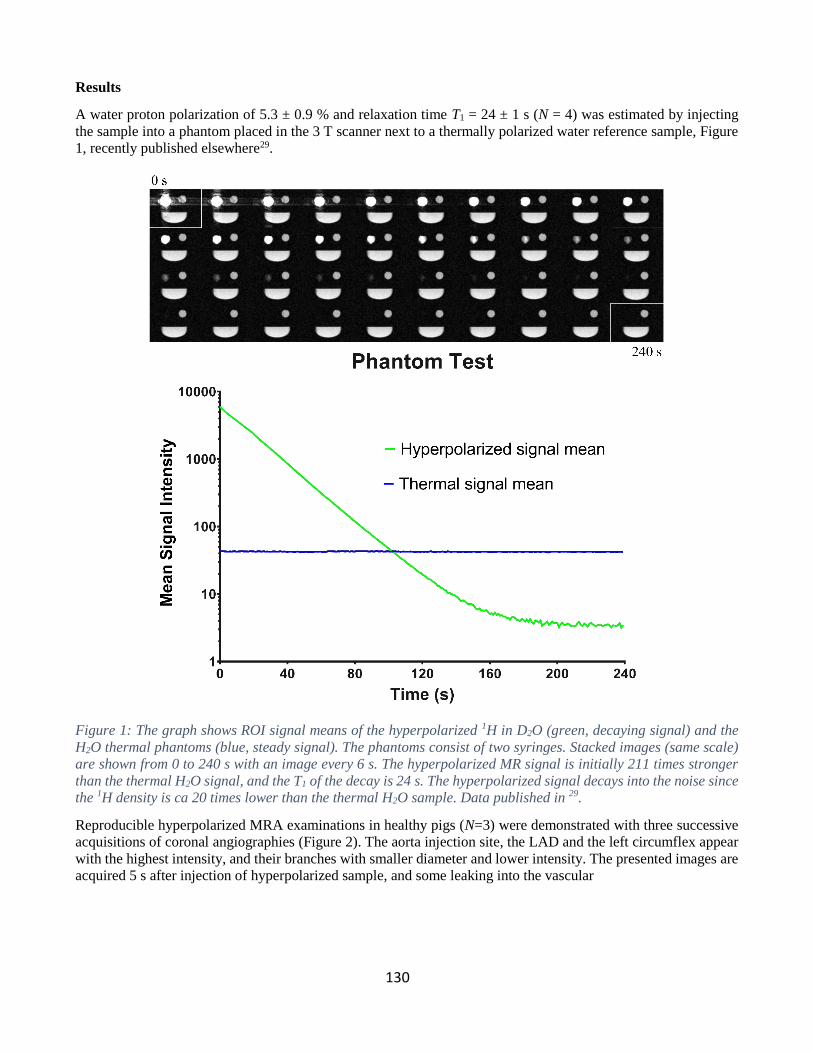
130
Results
A water proton polarization of 5.3 ± 0.9 % and relaxation time T1 = 24 ± 1 s (N = 4) was estimated by injecting
the sample into a phantom placed in the 3 T scanner next to a thermally polarized water reference sample, Figure
1, recently published elsewhere29.
Figure 1: The graph shows ROI signal means of the hyperpolarized 1H in D2O (green, decaying signal) and the
H2O thermal phantoms (blue, steady signal). The phantoms consist of two syringes. Stacked images (same scale)
are shown from 0 to 240 s with an image every 6 s. The hyperpolarized MR signal is initially 211 times stronger
than the thermal H2O signal, and the T1 of the decay is 24 s. The hyperpolarized signal decays into the noise since
the 1H density is ca 20 times lower than the thermal H2O sample. Data published in 29.
Reproducible hyperpolarized MRA examinations in healthy pigs (N=3) were demonstrated with three successive
acquisitions of coronal angiographies (Figure 2). The aorta injection site, the LAD and the left circumflex appear
with the highest intensity, and their branches with smaller diameter and lower intensity. The presented images are
acquired 5 s after injection of hyperpolarized sample, and some leaking into the vascular

131
Figure 2: Coronary angiographies after hyperpolarized water injections in three different animals. Images 5 s
after injection of sample.
bed is observed in between arteries. The orientation and projection are different in the three animals, but the images
in each individual animal were reproducible. aSNR from the left main stem was 269±169 and coronary sharpness
from proximal LAD was 0.31±0.086 mm-1.
A time series of angiographies is presented in Figure 3, initiated from the first observed hyperpolarized signal and
11 additional time steps of 1 s each. High intensity signal was evident in the main coronary arteries in frames 3-7,
during which fresh sample was injected. After that, the maximum intensity decreased due to relaxation and wash
out of the sample. No hyperpolarized signal was observed after 14 s. Frames 3, 4, 6, 7 and 12 of the series suffers
from motion artefacts, possibly from cardiac contractions.
Figure 3: Time series of consecutive images acquired every second from injection of sample. Major and minor
vessels of the coronary tree can easily be identified.

132
The signal in the minor branch arteries appeared after the first few time steps, and appeared increasingly
more distinct throughout the series until vanishing due to relaxation and washout. Similarly, the signal
in the tissue occurred with a time delay from the arterial signal. The temporal profile is shown in Figure
4, where the average signal intensity in regions of interest (ROI) in the proximal LAD, medial LAD and
at a distal branch of LAD. The signal increase is first observed in the proximal LAD, and later in the
medial and distal branch of the LAD, describing the perfusion from injection site into the vasculature.
Figure 4: Time of arrival of hyperpolarized water at proximal LAD, medial LAD and at a distal branch of LAD.
Discussion
The main finding of this study was the demonstration of the feasibility of using hyperpolarized water for
dynamic coronary angiography and perfusion mapping. The high reproducibility and quality of the
images in a large animal model shows great promise for future applications in humans. The coronary
arteries in the porcine model resembles human cardiac anatomy, and thus portrays the clinical situation
well. The coronary arteries were imaged with high resolution and SNR. The angiograms are of high
quality, and is superior to coronary MRA available in today’s clinical practice. A main drawback of the
method is the invasive nature of the catheterization.
The images are acquired in less than one second, providing series of high temporal resolution. Thus the
perfusion of the cardiac tissue can be evaluated by fitting the signal with a model function, where also
the relaxation of the signal is accounted for. This technique would provide perfusion values of water,
contrary to most established perfusion measurement techniques, where the perfusion of contrast
enhancing compounds is recorded, without exposing patients to ionizing irradiation. The high perfusion
of the cardiac muscle as well as its importance in cardiovascular disease makes it an obvious organ for
hyperpolarized water perfusion imaging. The motion of the heart is a key challenge for authentic
measurements. Thus, ECG triggered acquisition and respiratory control is required for automated
perfusion data analysis, something we do not have access to in the current setup. In general, the scanner
used in this study is not optimized for cardiac imaging and the performance inferior to current state of
the art33–35.
133
The hyperpolarization method yielded consistent, reproducible sample properties; MR signal in
particular. The images in this study were obtained with 5% proton polarization. We believe that ten times
higher polarization is achievable, dramatically improving the image quality over what is presented here.
The method presented in this study should be translational to clinical use. The same polarizer (SPINlab)
used for clinical studies with [1-13C]pyruvate was used, providing the possibility of producing sterile
samples. The safety profile of the formulation needs to be established, and the catheterization of coronary
arteries may be the largest challenge for clinical translation.
References
1. Kato S, Kitagawa K, Ishida N, Ishida M, Nagata M, Ichikawa Y, Katahira K, Matsumoto Y, Seo
K, Ochiai R, Kobayashi Y, Sakuma H. Assessment of Coronary Artery Disease Using Magnetic
Resonance Coronary Angiography. J Am Coll Cardiol. 2010;56:983–991.
2. W. Yong Kim, M.D. PD, Peter G. Danias, M.D. PD, Matthias Stuber PD, Scott D. Flamm MD,
Sven Plein MD, Eike Nagel MD, Susan E. Langerak MS, Oliver M. Weber PD, Erik M.
Pedersen, M.D. PD, Matthias Schmidt MD, René M. Botnar PD, Warren J. Manning MD.
Coronary Magnetic Resonance Angiography for the Detection of Coronary Stenoses. N Engl J
Med. 2011;345:1863–1869.
3. Kramer CM, Narula J. Atherosclerotic Plaque Imaging: The Last Frontier for Cardiac Magnetic
Resonance. JACC Cardiovasc Imaging. 2009;2:916–918.
4. Takx RAP, Blomberg BA, El Aidi H, Habets J, de Jong PA, Nagel E, Hoffmann U, Leiner T.
Diagnostic accuracy of stress myocardial perfusion imaging compared to invasive coronary
angiography with fractional flow reserve meta-analysis. Circ Cardiovasc Imaging. 2015;8.
5. Herscovitch P, Markham J, Raichle ME. Brain Blood Flow Measured with Intravenous H215O.:
I. Theory and Error Analysis. J Nucl Med. 1983;24:782–789.
6. Raichle ME, Martin WRW, Herscovltch P, Mintun MA, Markham J. Brain Blood Flow
Measured with Intravenous H215O.: II. Implementation and Validation. J Nucl Med. 1983;24.
7. Rosen BR, Belliveau JW, Vevea JM, Brady TJ. Perfusion imaging with NMR contrast agents.
Magn Reson Med. 1990;14:249–265.
8. Bergmann SR, Herrero P, Markham J, Weinheimer CJ, Norine M. Noninvasive Quantitation of
Myocardial Blood Flow in Human Subjects With Oxygen-15 Labeled Water and Positron
Emission Tomography. J Am Coll Cardiol. 1989;14:639–652.
9. Prompona M, Cyran C, Nikolaou K, Bauner K, Reiser M, Huber A. Contrast-Enhanced Whole-
Heart MR Coronary Angiography at 3.0 T Using the Intravascular Contrast Agent Gadofosveset.
Invest Radiol. 2009;44:369–374.
10. Bi X, Carr JC, Li D. Whole-heart coronary magnetic resonance angiography at 3 Tesla in 5
minutes with slow infusion of Gd-BOPTA, a high-relaxivity clinical contrast agent. Magn Reson
Med. 2007;58:1–7.
11. Schwitter J, Wacker CM, Wilke N, Al-Saadi N, Sauer E, Huettle K, Schönberg SO, Luchner A,
134
Strohm O, Ahlstrom H, Dill T, Hoebel N, Simor T. MR-IMPACT II: Magnetic Resonance
Imaging for Myocardial Perfusion Assessment in Coronary artery disease Trial: perfusion-
cardiac magnetic resonance vs. single-photon emission computed tomography for the detection
of coronary artery disease: a comparative. Eur Heart J. 2013;34:775–81.
12. Kober F, Jao T, Troalen T, Nayak KS. Myocardial arterial spin labeling. J Cardiovasc Magn
Reson. 2016;18:22.
13. Ardenkjaer-Larsen JH, Fridlund B, Gram A, Hansson G, Hansson L, Lerche MH, Servin R,
Thaning M, Golman K. Increase in signal-to-noise ratio of > 10,000 times in liquid-state NMR.
Proc Natl Acad Sci U S A. 2003;100:10158–10163.
14. Nelson SJ, Kurhanewicz J, Vigneron DB, Larson PEZ, Harzstark AL, Ferrone M, Criekinge M
Van, Chang JW, Bok R, Park I, Reed G, Carvajal L, Small EJ, Munster P, Weinberg VK,
Ardenkjaer-larsen JH, Chen AP, Hurd RE, Odegardstuen L, Robb FJ, Tropp J, Murray J a.
Metabolic Imaging of Patients with Prostate Cancer Using Hyperpolarized [1- 13 C]Pyruvate.
Sci Transl Med. 2013;5:198ra108.
15. Cunningham CH, Lau JY, Chen AP, Geraghty BJ, Perks WJ, Roifman I, Wright GA, Connelly
KA. Hyperpolarized 13 C Metabolic MRI of the Human Heart: Initial Experience. Circ Res.
2016;In press.
16. Golman K, Axelsson O, Jóhannesson H, Månsson S, Olofsson C, Petersson JS. Parahydrogen-
induced polarization in imaging: Subsecond 13C angiography. Magn Reson Med. 2001;46:1–5.
17. Golman K, Ardenkjær-Larsen JH, Svensson J, Axelsson O, Hansson G, Hansson L, Jóhannesson
H, Leunbach I, Månsson S, Petersson JS, Pettersson G, Servin R, Wistrand L-G. 13C-
Angiography. Acad Radiol. 2002;9:507–510.
18. Svensson J, Månsson S, Johansson E, Petersson JS, Olsson LE. Hyperpolarized 13C MR
angiography using trueFISP. Magn Reson Med. 2003;50:256–262.
19. Lipsø KW, Magnusson P, Ardenkjær-Larsen JH. Hyperpolarized 13 C MR Angiography. Curr
Pharm Des. 2016;22:90–95.
20. Olsson LE, Chai CM, Axelsson O, Karlsson M, Golman K, Petersson JS. MR coronary
angiography in pigs with intraarterial injections of a hyperpolarized 13C substance. Magn Reson
Med. 2006;55:731–737.
21. Von Morze C, Larson PEZ, Hu S, Yoshihara H a I, Bok R a., Goga A, Ardenkjaer-Larsen JH,
Vigneron DB. Investigating tumor perfusion and metabolism using multiple hyperpolarized 13C
compounds: HP001, pyruvate and urea. Magn Reson Imaging. 2012;30:305–311.
22. Von Morze C, Bok RA, Reed GD, Ardenkjaer-Larsen JH, Kurhanewicz J, Vigneron DB.
Simultaneous multiagent hyperpolarized 13C perfusion imaging. Magn Reson Med.
2014;72:1599–1609.
23. Grant AK, Vinogradov E, Wang X, Lenkinski RE, Alsop DC. Perfusion imaging with a freely
diffusible hyperpolarized contrast agent. Magn Reson Med. 2011;66:746–755.
24. Johansson E, Månsson S, Wirestam R, Svensson J, Petersson JS, Golman K, Ståhlberg F.
Cerebral Perfusion Assessment by Bolus Tracking Using Hyperpolarized 13C. Magn Reson
135
Med. 2004;51:464–472.
25. Lau AZ, Miller JJ, Robson MD, Tyler DJ. Cardiac perfusion imaging using hyperpolarized 13 c
urea using flow sensitizing gradients. Magn Reson Med. 2016;75:1474–1483.
26. Lau AZ, Miller JJ, Robson MD, Tyler DJ. Simultaneous assessment of cardiac metabolism and
perfusion using copolarized [1-(13) C]pyruvate and (13) C-urea. Magn Reson Med. 2016;0:1–8.
27. Park I, von Morze C, Lupo JM, Ardenkjaer-Larsen JH, Kadambi A, Vigneron DB, Nelson SJ.
Investigating tumor perfusion by hyperpolarized 13C MRI with comparison to conventional
gadolinium contrast-enhanced MRI and pathology in orthotopic human GBM xenografts. Magn
Reson Med. 2016;0:n/a-n/a.
28. Olsen G, Markhasin E, Szekely O, Bretschneider C, Frydman L. Optimizing water
hyperpolarization and dissolution for sensitivity-enhanced 2D biomolecular NMR. J Magn
Reson. 2016;264:49–58.
29. Lipsø KW, Szocska Hansen ES, Tougaard R, Laustsen C, Ardenkjær-Larsen JH. Renal MR
Angiography and Perfusion in the Pig using Hyperpolarized Water. Magn Reson Med. 2016;In
press.
30. Ardenkjaer-Larsen JH, Laustsen C, Bowen S, Rizi R. Hyperpolarized H2O MR angiography.
Magn Reson Med. 2014;71:50–56.
31. Malinowski RM, Lipsø KW, Lerche MH, Ardenkjær-Larsen JH. Dissolution Dynamic Nuclear
Polarization capability study with fluid path. J Magn Reson. 2016;272:141–146.
32. Li D, Carr JC, Shea SM, Zheng J, Wielopolski PA, Finn JP. Coronary Arteries: Magnetization-
prepared Contrast-enhanced Three- dimensional Volume-targeted Breath-hold MR
Angiography. Radiology. 2001;219:270–277.
33. Henningsson M, Hussain T, Vieira MS, Greil GF, Smink J, Ensbergen G v, Beck G, Botnar RM.
Whole-heart coronary MR angiography using image-based navigation for the detection of
coronary anomalies in adult patients with congenital heart disease. J Magn Reson Imaging.
2016;43:947–55.
34. Addy NO, Ingle RR, Wu HH, Hu BS, Nishimura DG. High-resolution variable-density 3D cones
coronary MRA. Magn Reson Med. 2015;74:614–621.
35. Nezafat M, Henningsson M, Ripley DP, Dedieu N, Greil G, Greenwood JP, Börnert P, Plein S,
Botnar RM. Coronary MR angiography at 3T: fat suppression versus water-fat separation. Magn
Reson Mater Physics, Biol Med. 2016;5–10.