Embed Size (px)
Citation preview
Survival Analysis With Generalized Additive Models
Christos Argyropoulos, MD, MSc, PhD, FASN Division of Nephrology,
University of New Mexico Health Sciences Center
PLoS One. 2015 Apr 23;10(4):e0123784. http://dx.doi.org/10.1371/journal.pone.0123784
Outline of the talk
• Motivation
• Background
• Development
• Results
• Future extensions
Motivation & Background • Secondary analysis of a randomized trial
regarding dialysis devices in 2006
• Intervention protocol modification (known timeline) X treatment interaction suggested in Schoenfeld residual analyses
• Subgroup also postulated by independent commentary when the trial published
• Is this “secular trend/drift” ?
• Clinical question could be answered by considering > 1 time scales in the clinical trial
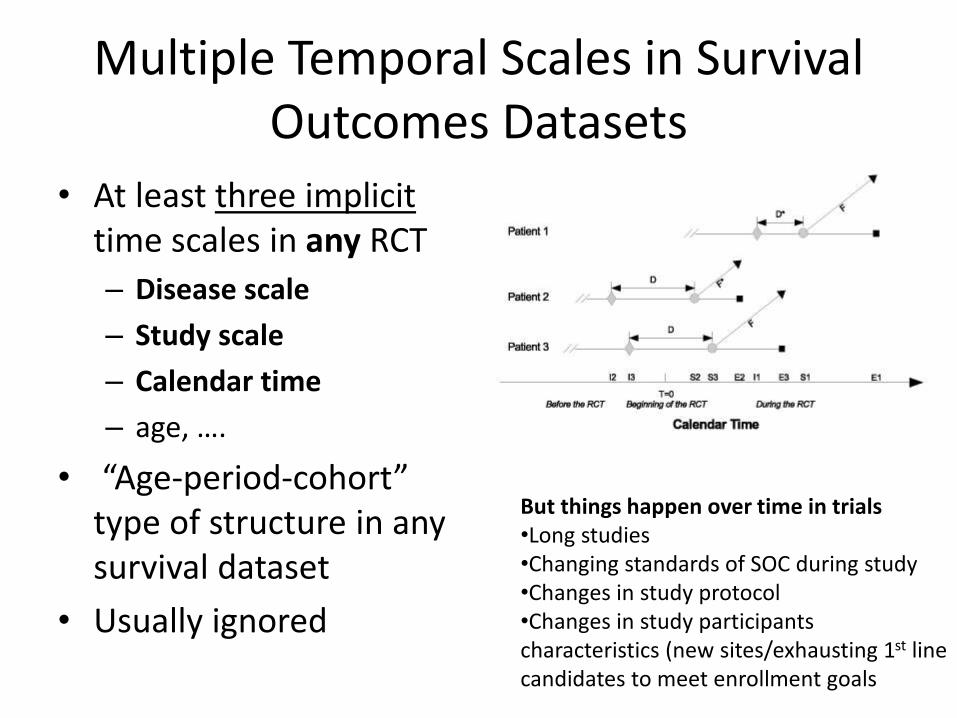
Multiple Temporal Scales in Survival Outcomes Datasets
• At least three implicittime scales in any RCT
– Disease scale
– Study scale
– Calendar time
– age, ….
• “Age-period-cohort” type of structure in any survival dataset
• Usually ignored
But things happen over time in trials•Long studies•Changing standards of SOC during study•Changes in study protocol•Changes in study participants characteristics (new sites/exhausting 1st line candidates to meet enrollment goals
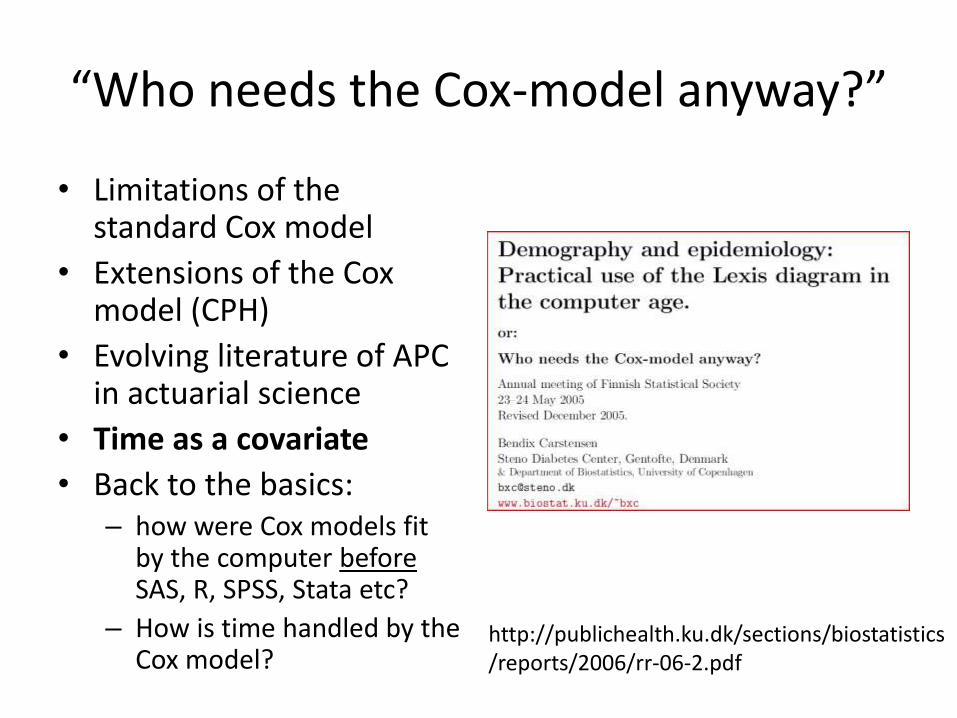
“Who needs the Cox-model anyway?”
• Limitations of the standard Cox model
• Extensions of the Cox model (CPH)
• Evolving literature of APC in actuarial science
• Time as a covariate
• Back to the basics: – how were Cox models fit
by the computer beforeSAS, R, SPSS, Stata etc?
– How is time handled by the Cox model?
http://publichealth.ku.dk/sections/biostatistics/reports/2006/rr-06-2.pdf
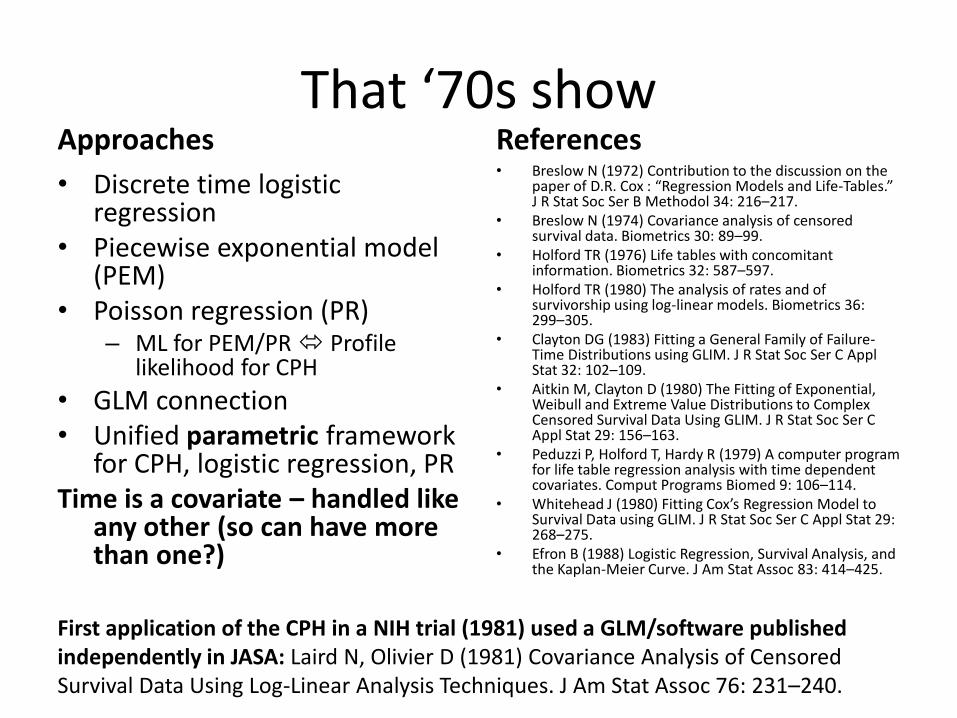
That ‘70s showApproaches
• Discrete time logistic regression
• Piecewise exponential model (PEM)
• Poisson regression (PR)– ML for PEM/PR Profile
likelihood for CPH
• GLM connection• Unified parametric framework
for CPH, logistic regression, PRTime is a covariate – handled like
any other (so can have more than one?)
References• Breslow N (1972) Contribution to the discussion on the
paper of D.R. Cox : “Regression Models and Life-Tables.” J R Stat Soc Ser B Methodol 34: 216–217.
• Breslow N (1974) Covariance analysis of censored survival data. Biometrics 30: 89–99.
• Holford TR (1976) Life tables with concomitant information. Biometrics 32: 587–597.
• Holford TR (1980) The analysis of rates and of survivorship using log-linear models. Biometrics 36: 299–305.
• Clayton DG (1983) Fitting a General Family of Failure-Time Distributions using GLIM. J R Stat Soc Ser C ApplStat 32: 102–109.
• Aitkin M, Clayton D (1980) The Fitting of Exponential, Weibull and Extreme Value Distributions to Complex Censored Survival Data Using GLIM. J R Stat Soc Ser C Appl Stat 29: 156–163.
• Peduzzi P, Holford T, Hardy R (1979) A computer program for life table regression analysis with time dependent covariates. Comput Programs Biomed 9: 106–114.
• Whitehead J (1980) Fitting Cox’s Regression Model to Survival Data using GLIM. J R Stat Soc Ser C Appl Stat 29: 268–275.
• Efron B (1988) Logistic Regression, Survival Analysis, and the Kaplan-Meier Curve. J Am Stat Assoc 83: 414–425.
First application of the CPH in a NIH trial (1981) used a GLM/software published independently in JASA: Laird N, Olivier D (1981) Covariance Analysis of Censored Survival Data Using Log-Linear Analysis Techniques. J Am Stat Assoc 76: 231–240.
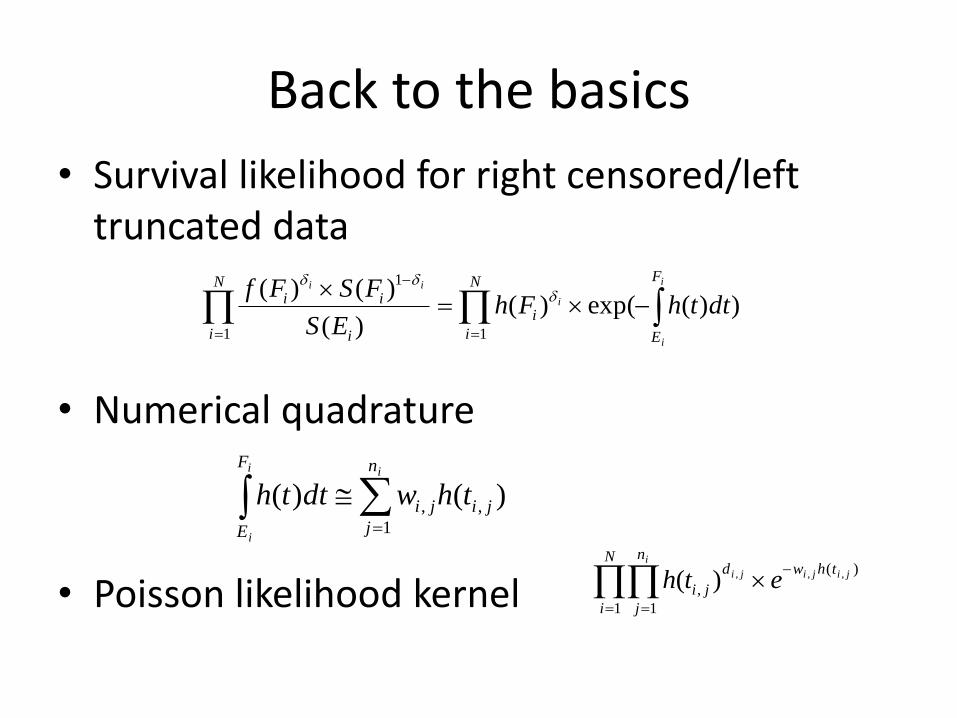
Back to the basics
• Survival likelihood for right censored/left truncated data
• Numerical quadrature
• Poisson likelihood kernel
N
i
F
E
i
N
i i
ii
i
i
i
ii
dtthFhES
FSFf
11
1
))(exp()()(
)()(
ii
i
n
j
jiji
F
E
thwdtth1
,, )()(
N
i
n
j
thwd
ji
i
jijiji eth1 1
)(
,,,,)(
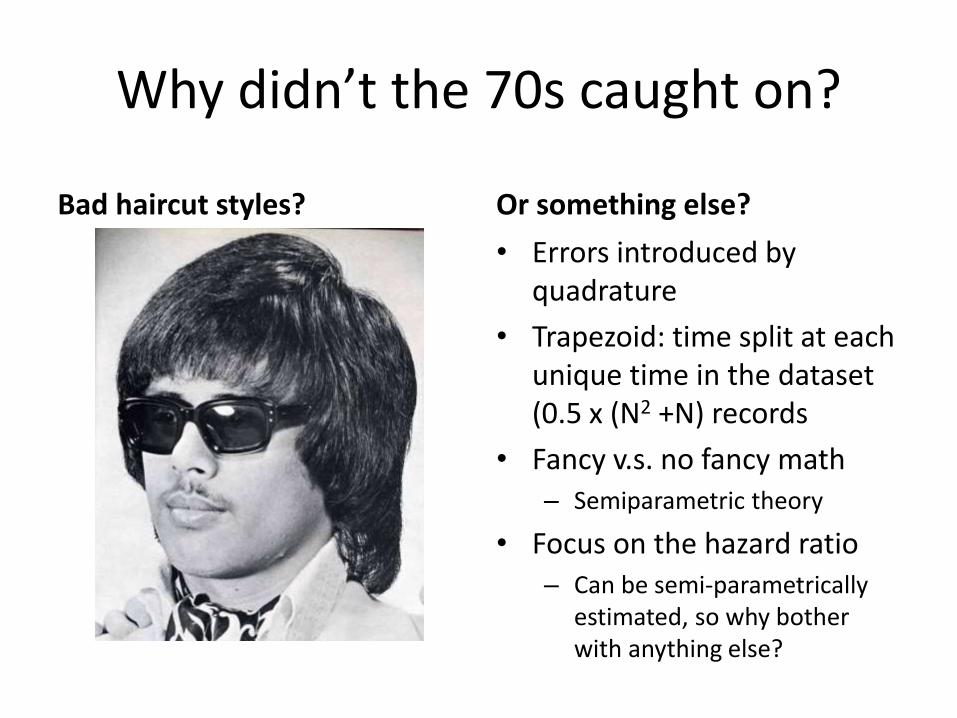
Why didn’t the 70s caught on?
Bad haircut styles? Or something else?
• Errors introduced by quadrature
• Trapezoid: time split at each unique time in the dataset (0.5 x (N2 +N) records
• Fancy v.s. no fancy math– Semiparametric theory
• Focus on the hazard ratio– Can be semi-parametrically
estimated, so why bother with anything else?
Back to the 21st century
• There are more efficient ways to integrate functions
• Computers are faster and have more memory
• Trials and datasets are getting more complex
• Additional consumers of clinical trial data
• We want to “do more stuff” with our data:– Non-proportional hazards, correlated outcomes, subgroup
analyses, center effects, alternative/complimentary measures of treatment effects
• Best not to waste degrees of freedom
• Best not to leave functional specifications to the analyst
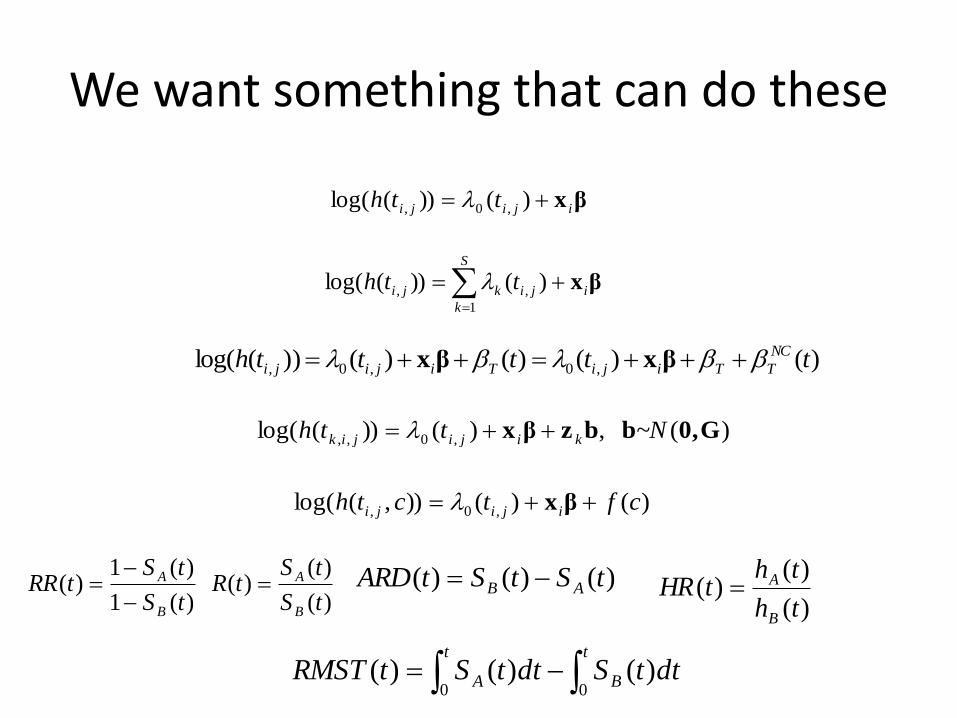
We want something that can do these
βx ijiji tth )())(log( ,0,
βxi
S
k
jikji tth 1
,, )())(log(
)()()()())(log( ,0,0, ttttth NC
TTijiTijiji βxβx
)( ,)())(log( ,0,, G0,bbzβx ~Ntth kijijik
)()()),(log( ,0, cftcth ijiji βx
)(1
)(1)(
tS
tStRR
B
A
)(
)()(
tS
tStR
B
A )()()( tStStARD AB )(
)()(
th
thtHR
B
A
t
B
t
A dttSdttStRMST00
)()()(
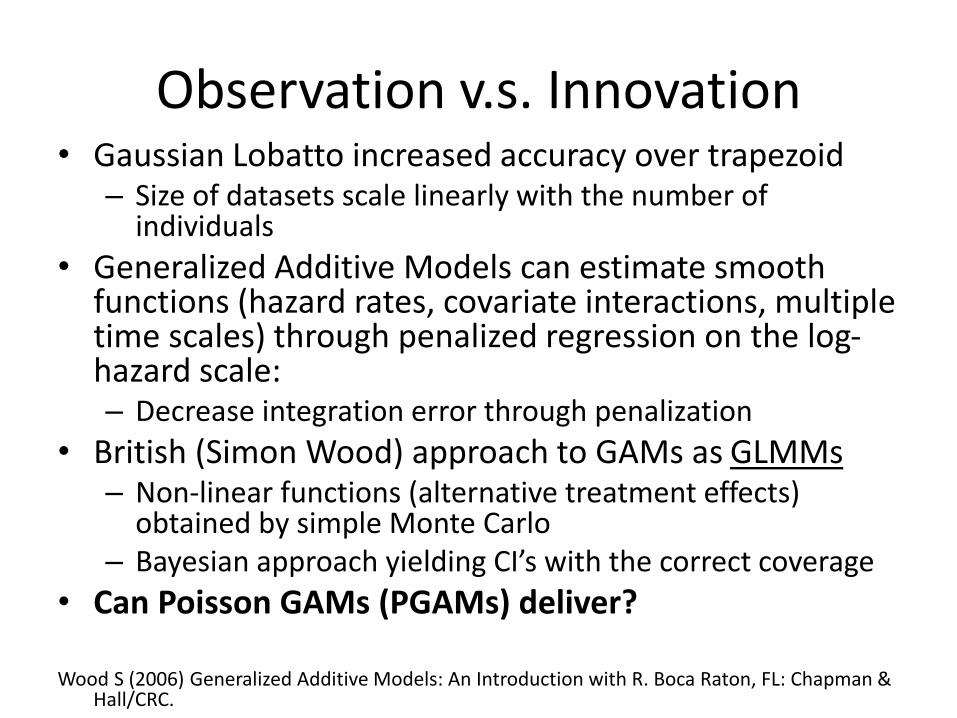
Observation v.s. Innovation• Gaussian Lobatto increased accuracy over trapezoid
– Size of datasets scale linearly with the number of individuals
• Generalized Additive Models can estimate smooth functions (hazard rates, covariate interactions, multiple time scales) through penalized regression on the log-hazard scale:– Decrease integration error through penalization
• British (Simon Wood) approach to GAMs as GLMMs– Non-linear functions (alternative treatment effects)
obtained by simple Monte Carlo– Bayesian approach yielding CI’s with the correct coverage
• Can Poisson GAMs (PGAMs) deliver?
Wood S (2006) Generalized Additive Models: An Introduction with R. Boca Raton, FL: Chapman & Hall/CRC.
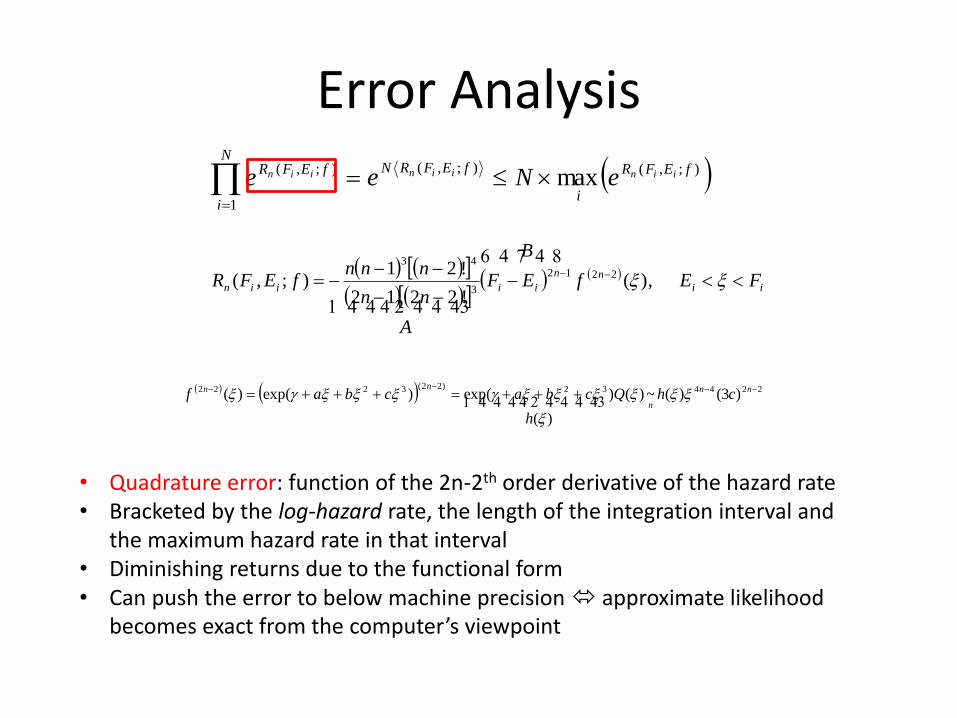
Error Analysis
);,();,(
1
);,(max
fEFR
i
fEFRNN
i
fEFR iiniiniin eNee
ii
nn
iiiin FEf
B
EF
A
nn
nnnfEFR
),(!2212
!21);,( 2212
3
43
224432)22(3222 )3()(~)(
)(
)exp()exp()( nn
n
nn chQ
h
cbacbaf
• Quadrature error: function of the 2n-2th order derivative of the hazard rate• Bracketed by the log-hazard rate, the length of the integration interval and
the maximum hazard rate in that interval • Diminishing returns due to the functional form• Can push the error to below machine precision approximate likelihood
becomes exact from the computer’s viewpoint
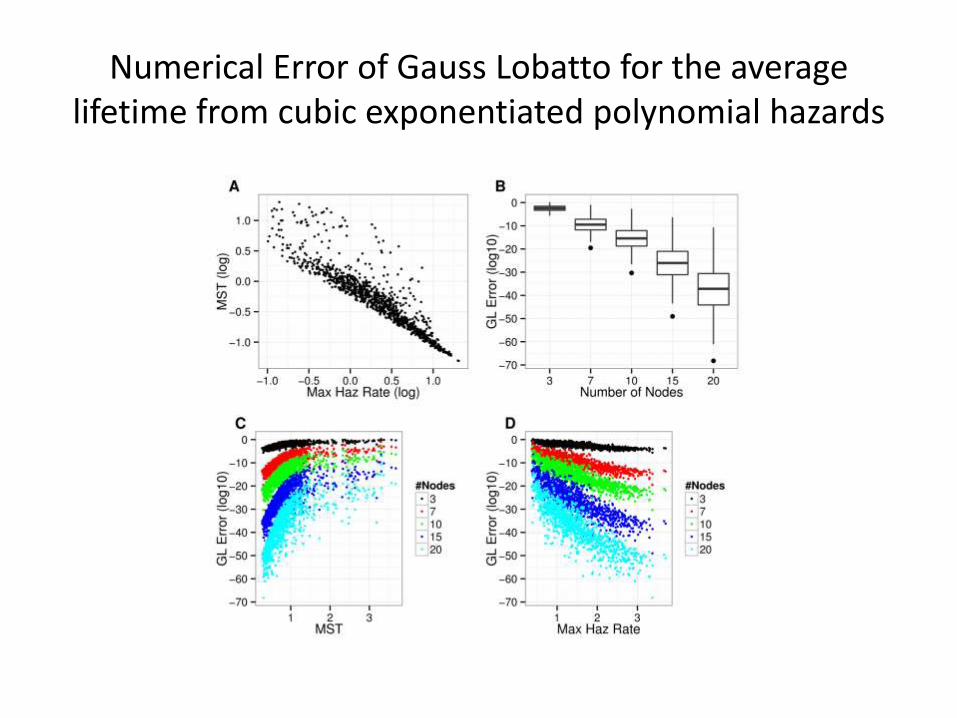
Numerical Error of Gauss Lobatto for the average lifetime from cubic exponentiated polynomial hazards
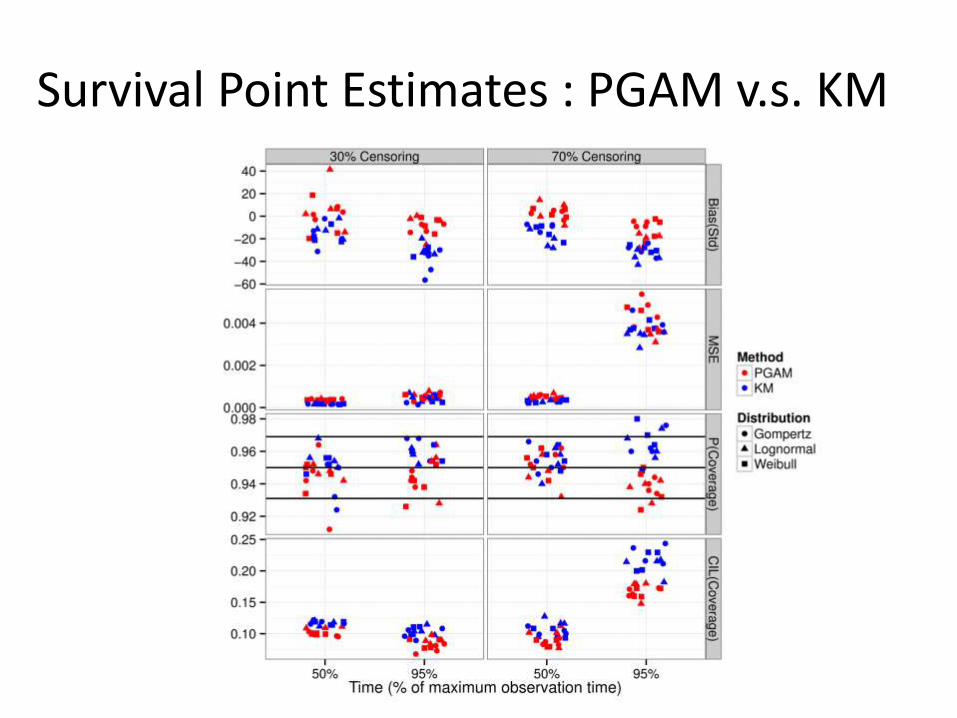
Survival Point Estimates : PGAM v.s. KM
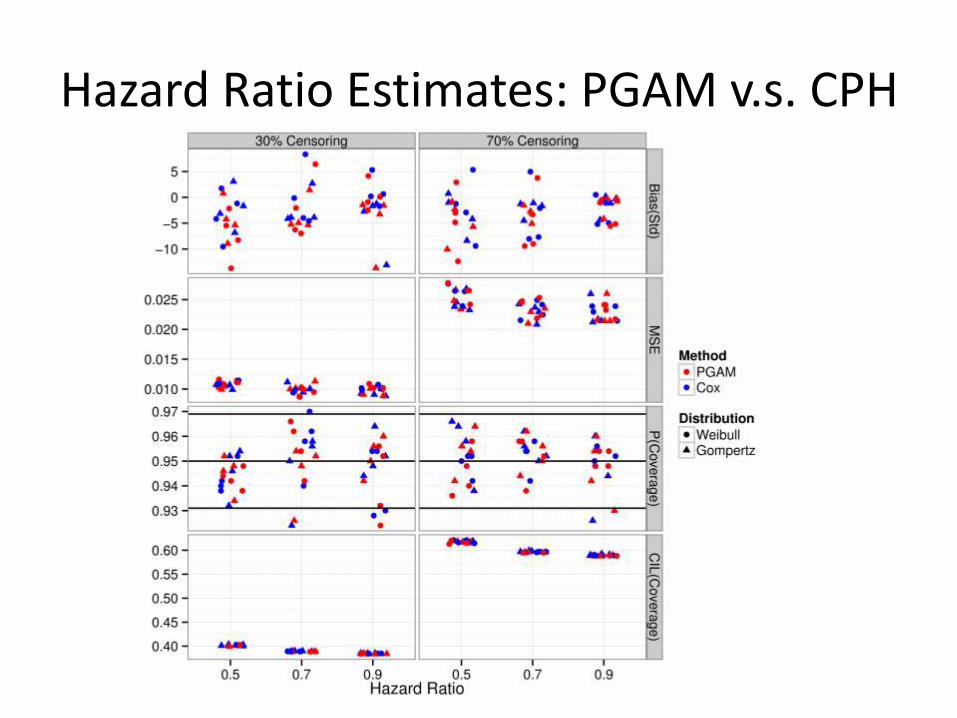
Hazard Ratio Estimates: PGAM v.s. CPH
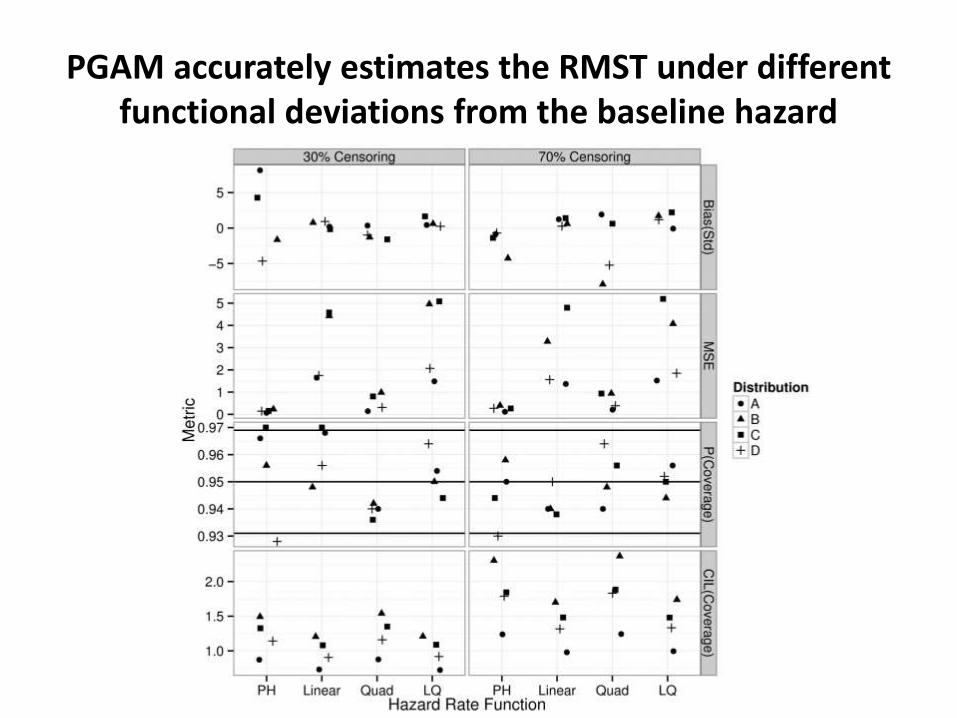
PGAM accurately estimates the RMST under different functional deviations from the baseline hazard
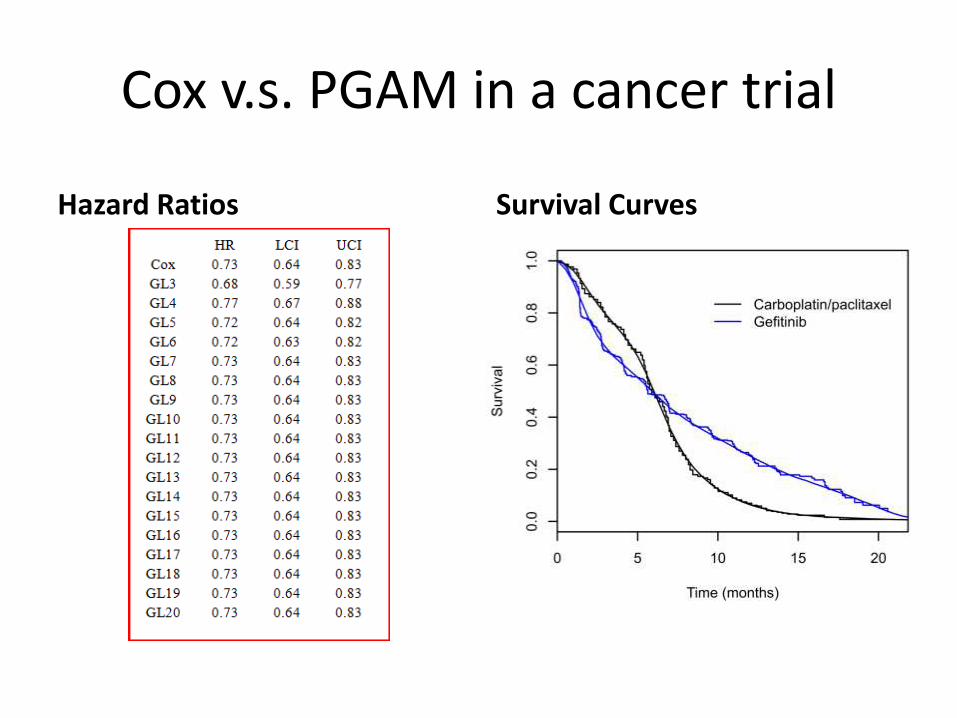
Cox v.s. PGAM in a cancer trial
Hazard Ratios Survival Curves
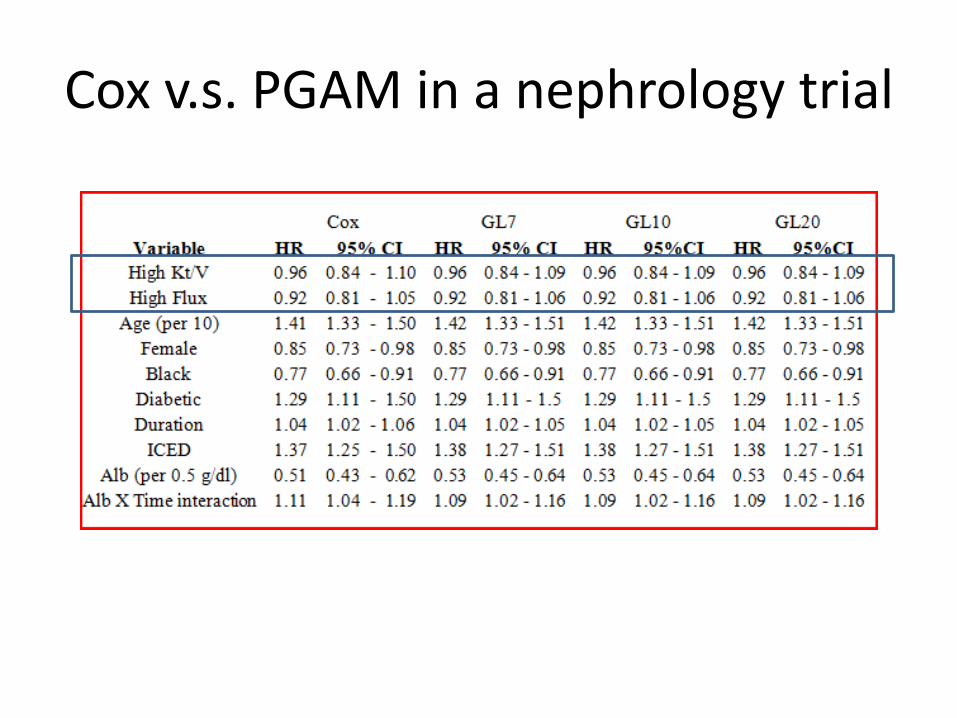
Cox v.s. PGAM in a nephrology trial
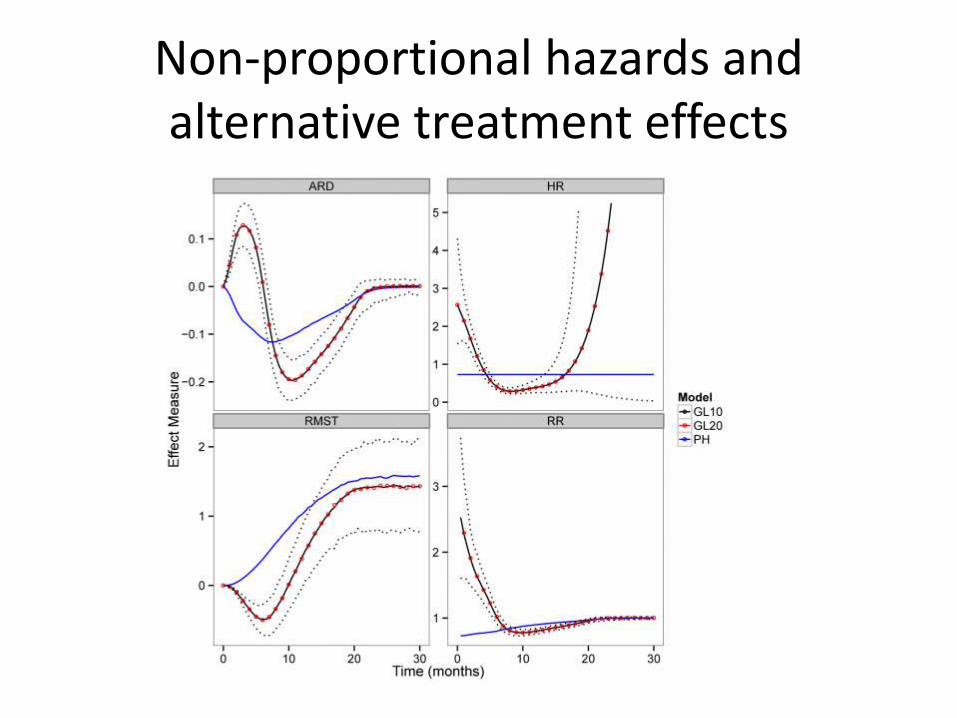
Non-proportional hazards and alternative treatment effects
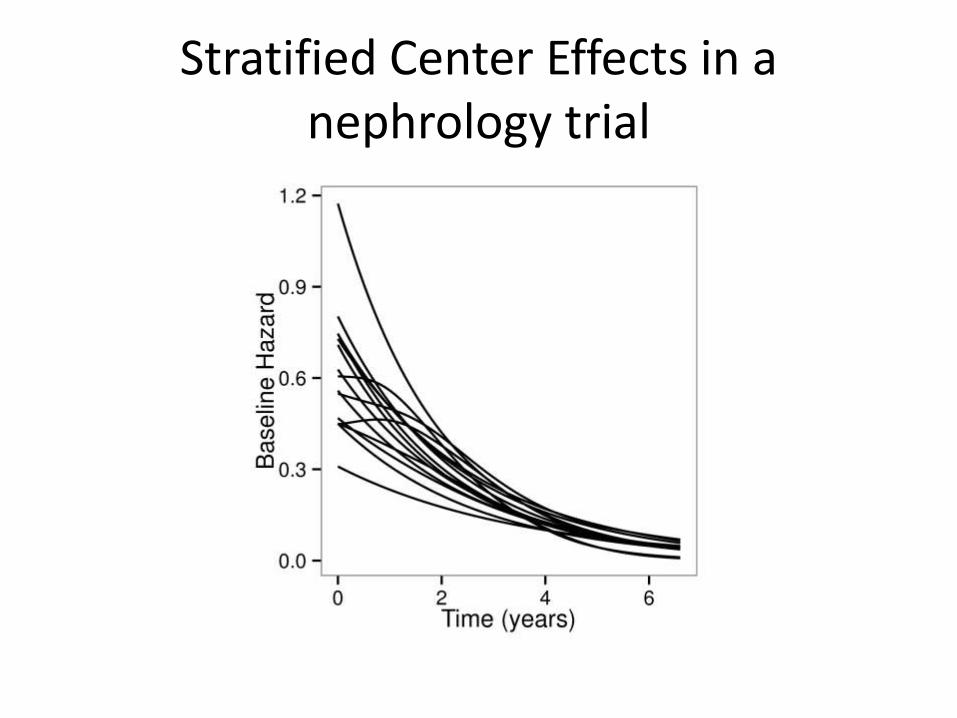
Stratified Center Effects in a nephrology trial
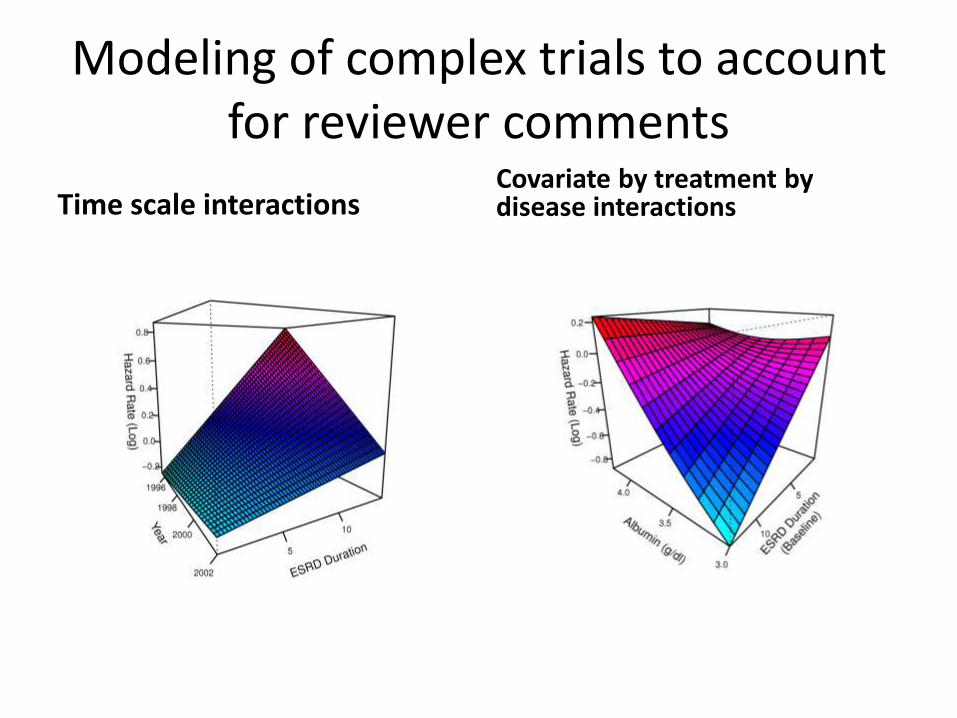
Modeling of complex trials to account for reviewer comments
Time scale interactionsCovariate by treatment by disease interactions
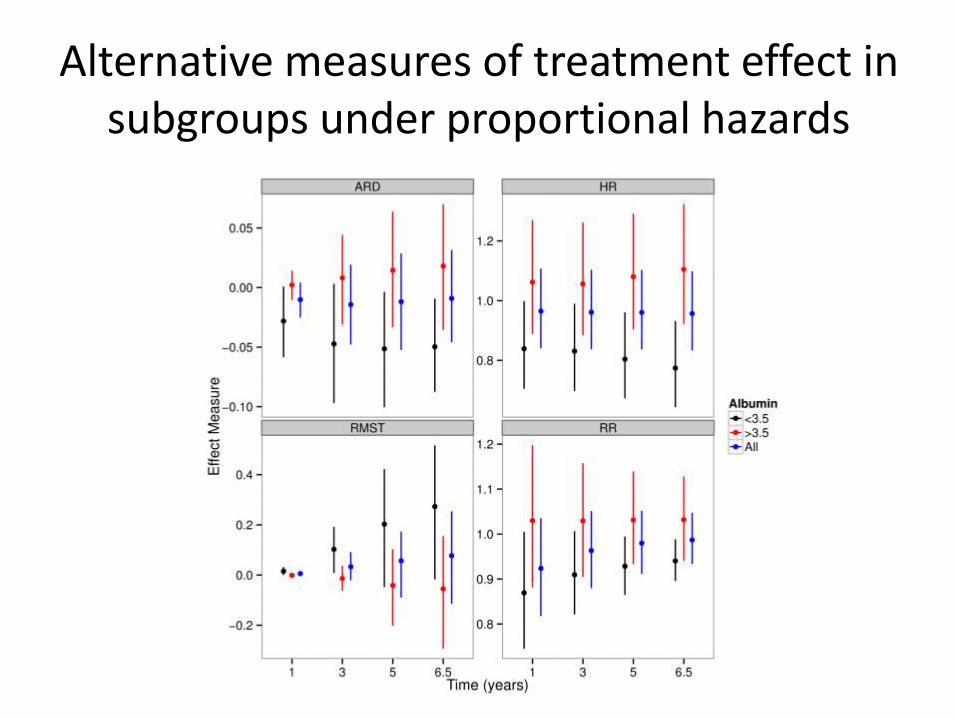
Alternative measures of treatment effect in subgroups under proportional hazards
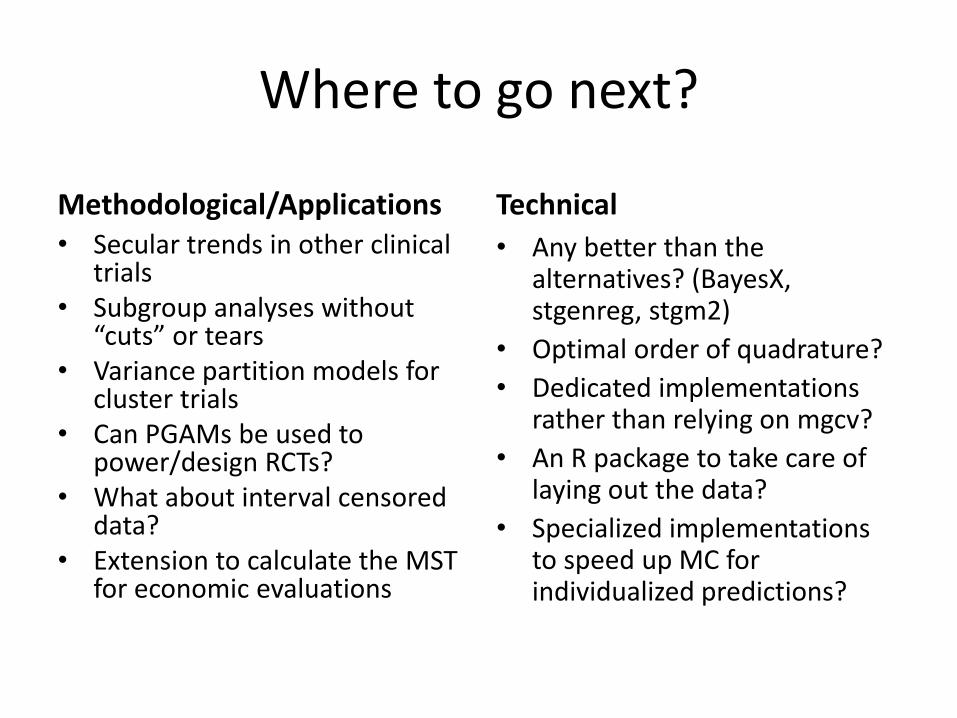
Where to go next?
Methodological/Applications• Secular trends in other clinical
trials• Subgroup analyses without
“cuts” or tears• Variance partition models for
cluster trials• Can PGAMs be used to
power/design RCTs?• What about interval censored
data?• Extension to calculate the MST
for economic evaluations
Technical
• Any better than the alternatives? (BayesX, stgenreg, stgm2)
• Optimal order of quadrature?
• Dedicated implementations rather than relying on mgcv?
• An R package to take care of laying out the data?
• Specialized implementations to speed up MC for individualized predictions?