Embed Size (px)
Citation preview
Enabling data exploration and
storytelling though visualization
Jewel Loree, @jeweloree
Data Analyst, Product Marketing
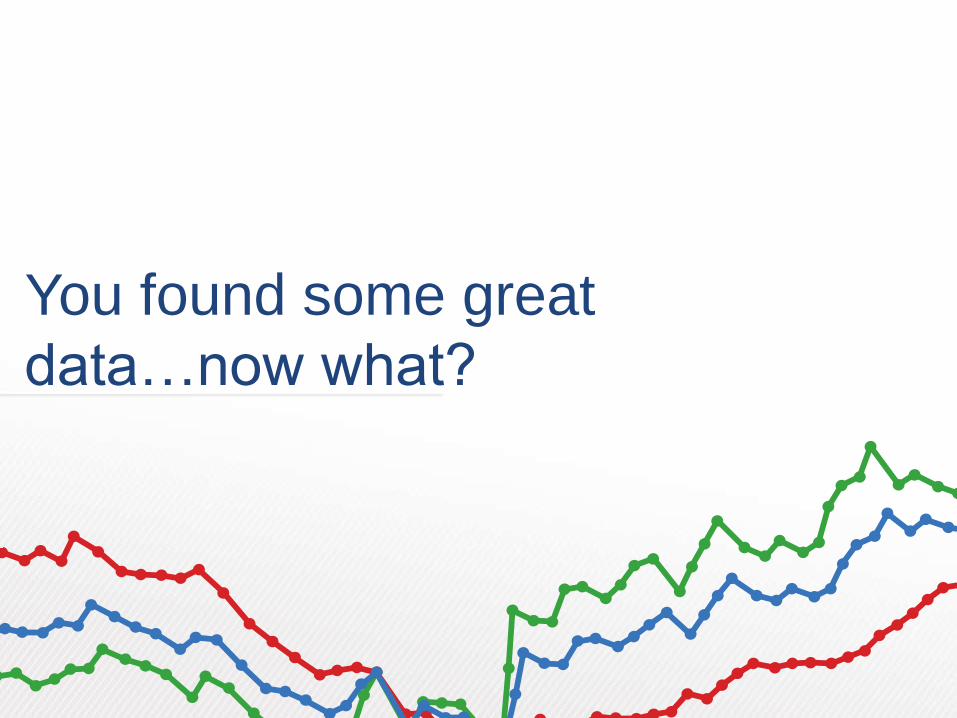
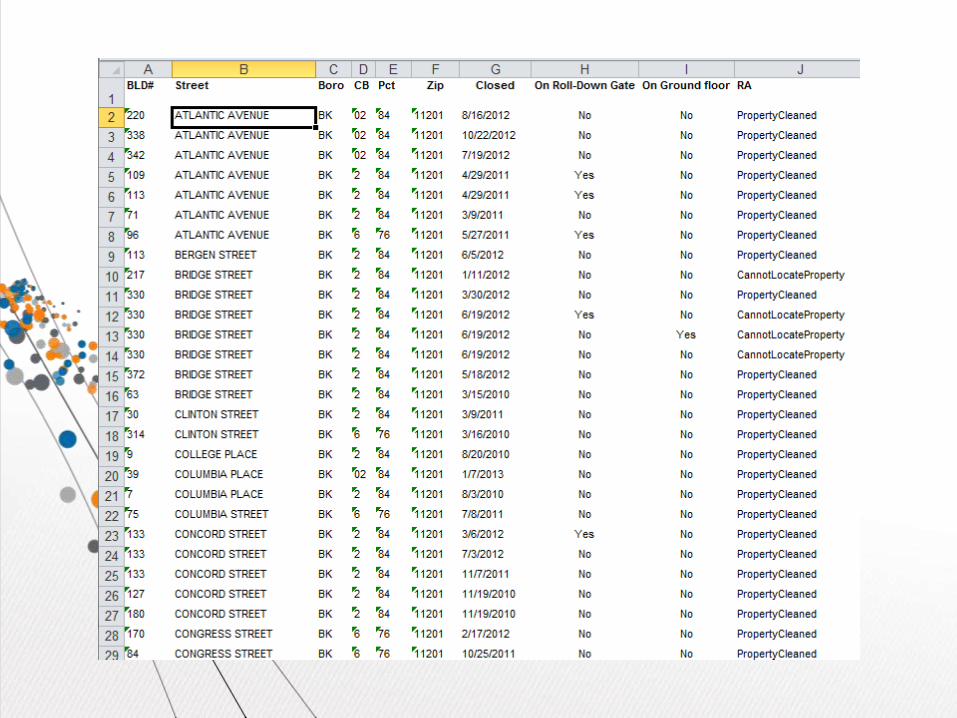
You found some great
data…now what?
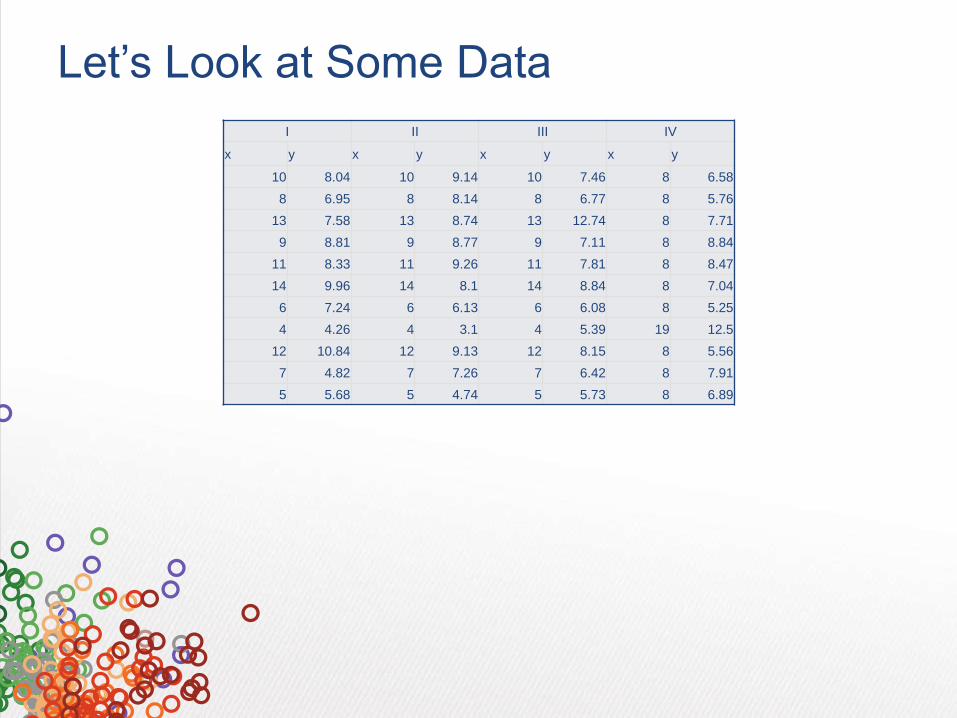
Let’s Look at Some Data
I II III IV
x y x y x y x y
10 8.04 10 9.14 10 7.46 8 6.58
8 6.95 8 8.14 8 6.77 8 5.76
13 7.58 13 8.74 13 12.74 8 7.71
9 8.81 9 8.77 9 7.11 8 8.84
11 8.33 11 9.26 11 7.81 8 8.47
14 9.96 14 8.1 14 8.84 8 7.04
6 7.24 6 6.13 6 6.08 8 5.25
4 4.26 4 3.1 4 5.39 19 12.5
12 10.84 12 9.13 12 8.15 8 5.56
7 4.82 7 7.26 7 6.42 8 7.91
5 5.68 5 4.74 5 5.73 8 6.89
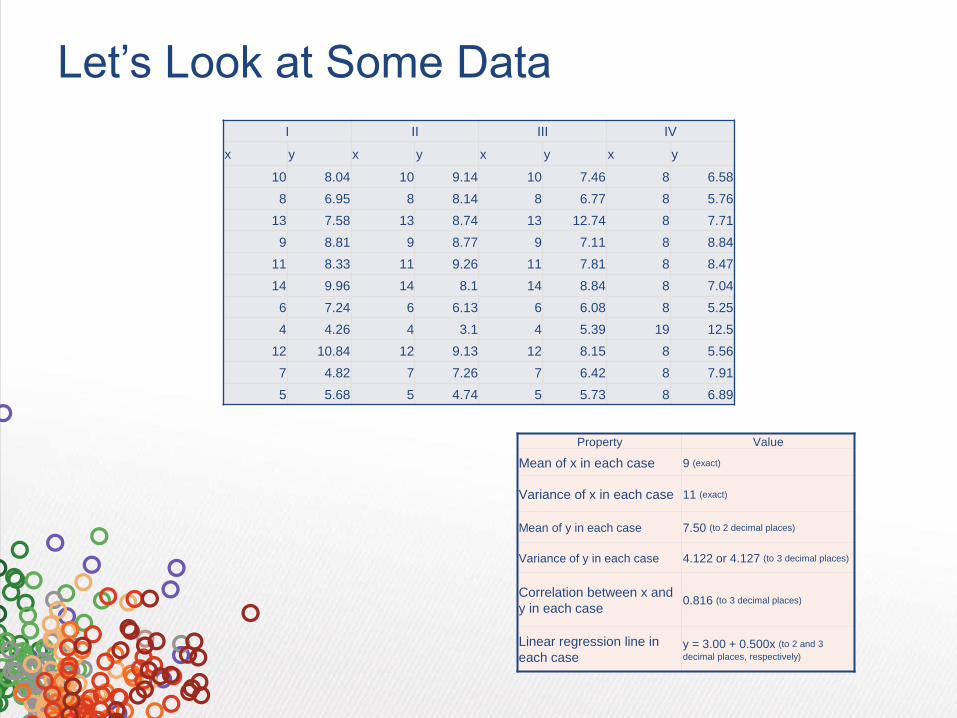
Let’s Look at Some Data
Property Value
Mean of x in each case 9 (exact)
Variance of x in each case 11 (exact)
Mean of y in each case 7.50 (to 2 decimal places)
Variance of y in each case 4.122 or 4.127 (to 3 decimal places)
Correlation between x and
y in each case0.816 (to 3 decimal places)
Linear regression line in
each casey = 3.00 + 0.500x (to 2 and 3
decimal places, respectively)
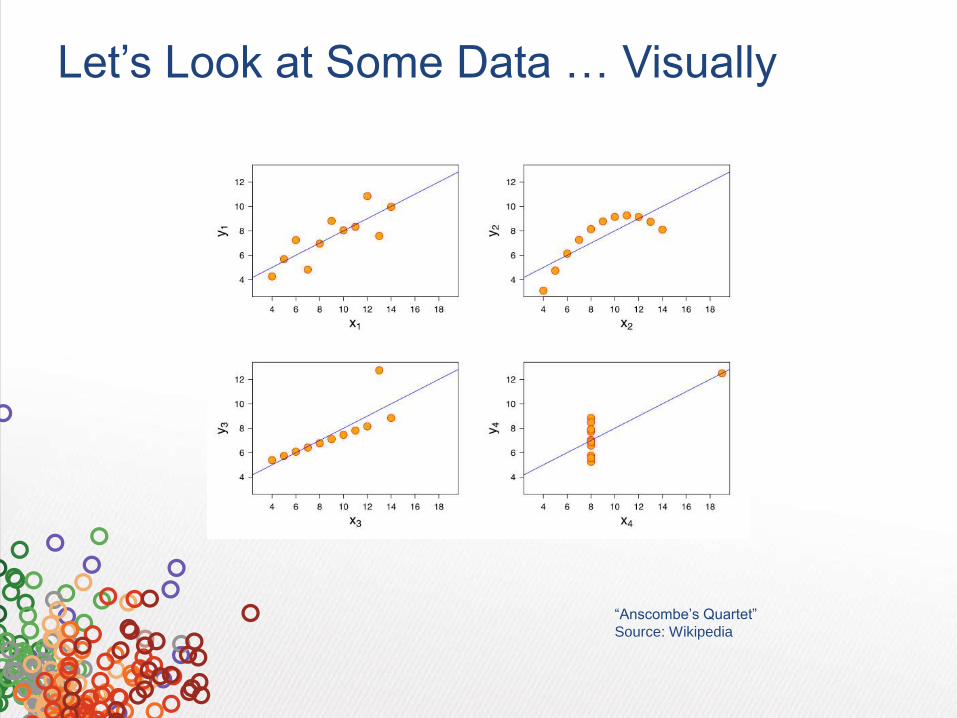
Let’s Look at Some Data … Visually
“Anscombe’s Quartet”
Source: Wikipedia
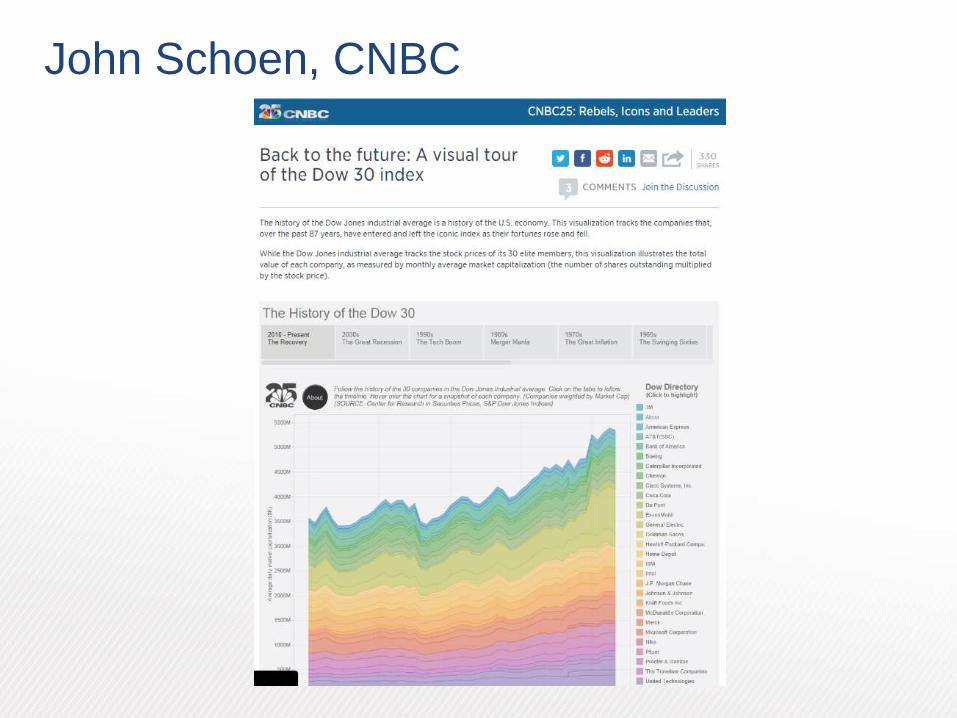
John Schoen, CNBC
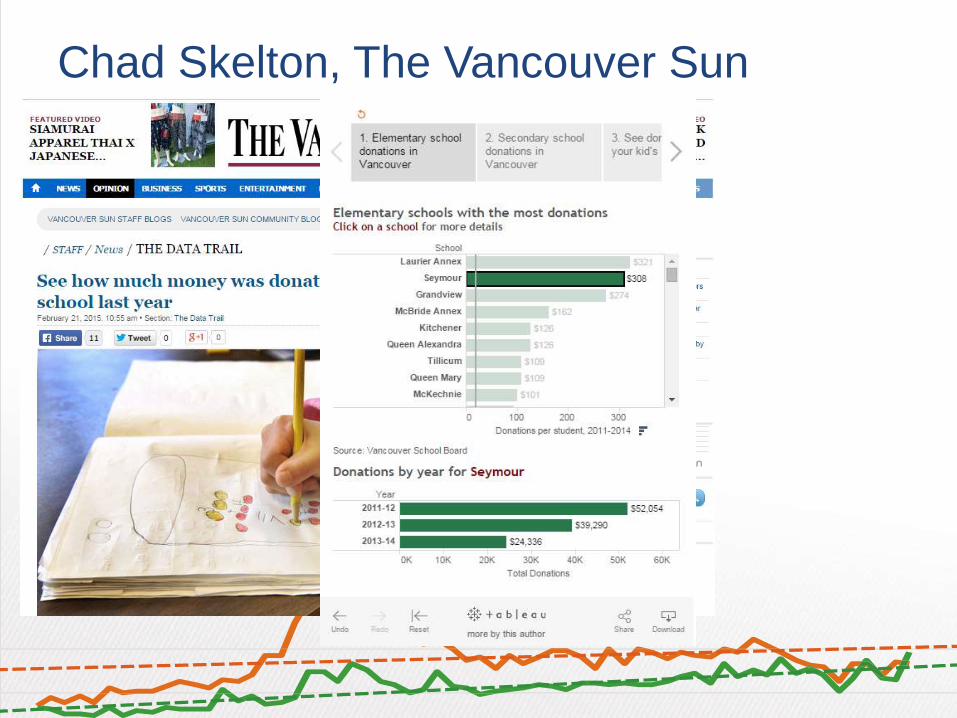
Chad Skelton, The Vancouver Sun
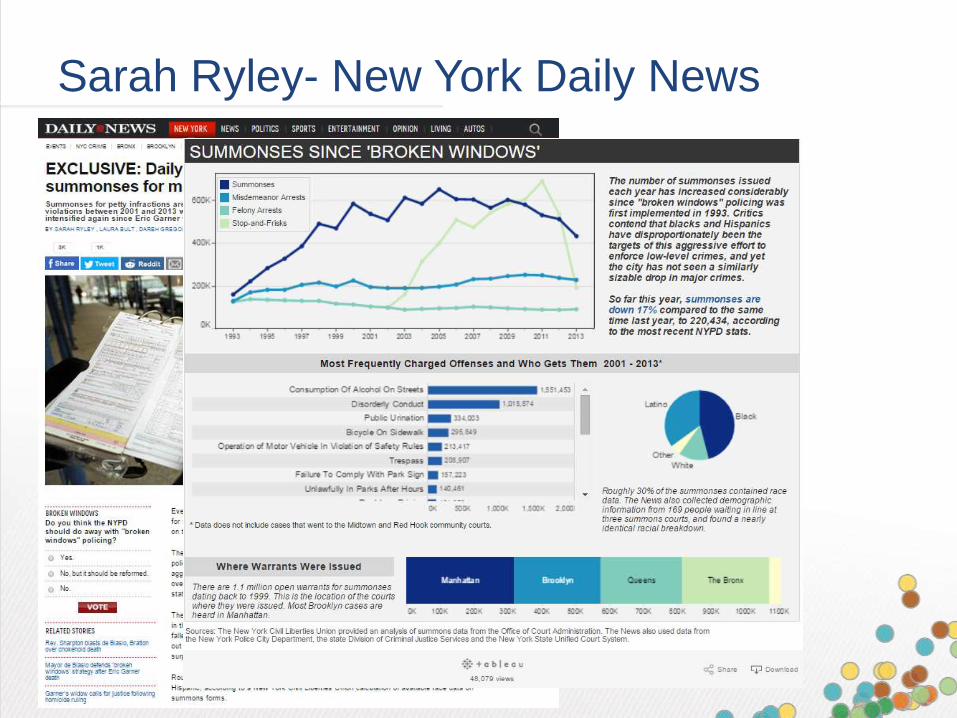
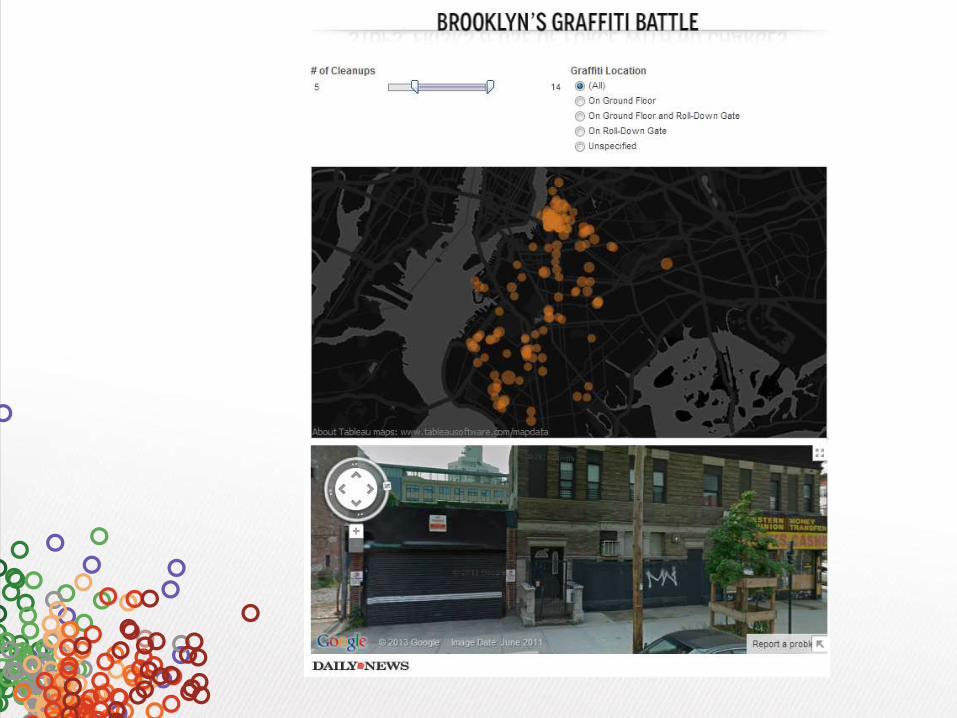
Sarah Ryley- New York Daily News