Embed Size (px)
Citation preview

Identifying High Performing
Firms in Turkey
and Linking Them to Good
Jobs
Aysenur Acar and Ximena V. Del Carpio
10 January 2019
Central Bank of the Republic of Turkey
Ankara, Turkey

Motivation
2
Understanding which firms are most likely to create more jobs
Definition of Gazelles (High Performance Firms – HPFs) :
whether a gazelle is one that grows or achieves a high level of performance;
whether changes need to be sustained over a period of time;
whether thresholds are absolute or relative;
whether the outcome of interest is employment, growth or productivity.
Systematic firm characteristics associated with the different definitions
SMEs have been seen as ‘the engines of job creation”
Do HPFs create good jobs?
The aims are:
to identify high performing firms using different definitions
&
to link those firms to good jobs

Literature
3
• Birch, 1979- Small enterprises, popularizing the term “gazelles” for fast growing firms
(compared to “mice”, the small firms that did not grow, or “elephants”, large firms that do
not grow (e.g. Birch and Medoff, 1994))
• Storey, 1994; Haltiwanger et al., 2010- High growth firms (HGFs) account for a large share
of job creation
• Davidsson, 1998 and Delmar, 2003- Fast growing firms focusing on measurement:
– choice of growth indicator (e.g. employment)
– whether growth is measured in relative terms,
– time
– process of growth (achieved organically or through acquisitions)
• Daunfeldt, Elert and Johansson (2013)- some different aspects of how HGFs are defined,
looking at both absolute and relative measures

Data
4
1. Panel census data from Turkey 2007-2016, namely Entrepreneurship Information System (EIS)
• Drawback: There is no information on which firms may have benefitted from government programs that
may influence high growth firms
2. HPFs are identified based on the performance of two outputs: employment and value added
𝑉𝑎𝑙𝑢𝑒 𝐴𝑑𝑑𝑒𝑑 𝑡 = (𝐿𝑎𝑏𝑜𝑟 𝑐𝑜𝑠𝑡𝑠𝑡 + 𝑂𝑝𝑒𝑟𝑎𝑡𝑖𝑛𝑔 𝑝𝑟𝑜𝑓𝑖𝑡𝑠𝑡 + 𝐷𝑒𝑝𝑟𝑒𝑐𝑖𝑎𝑡𝑖𝑜𝑛𝑡 ) / 𝑆𝑒𝑐𝑡𝑜𝑟𝑎𝑙 𝑑𝑒𝑓𝑙𝑎𝑡𝑖𝑜𝑛𝑠𝑡
3. Minimum size of 10 (avoids selecting HPFs with only 1-2 additional workers)
• country comparisons
• the hiring of a single worker represents a significant rate of growth for the smallest firms, might skew
results towards identifying fast-growing firms to the smallest ones.
4. ‘age’ is based on when firms began operations, but it should be noted that they only enter the sample
when they pass the 10 employee threshold;
• we will have firms whose birth and initial performance is not included. We have also chosen to keep
firms in the sample once they have passed the minimum employment threshold, even if they
subsequently fall below it to avoid biasing the sample to those with better performance.
5. Exit? Officially closed down?
• There are establishments that do not report and then report again. We do not count those as exits; exit is
reserved for establishments that do not reappear in the dataset.
6. High performance episodes are calculated over a minimum of 4 years (3 periods of growth)

Methodology
5
Selecting on different dimensions for Employment or Value Added outputs include:
Age:
No restrictions (tt3)
Young (15 or 05)
Persistence:
Required positive
performance every
year (s=sustained)
No restrictions
(j=jump)
Performance:
Growth rate
(g=growth)
Increased level
outcome (c=change)
Selection:
Relative –top 5%
(r=relative)
Absolute -i.e. 20%
growth
(a=absolute)
Period selecting:
- Pooling years
- Year by year –
offsets business
cycle effects (y)
(always 4 years)

Methodology-Definitions
6
* Includes entry; comparison is made at level of employment (or value added) at age 5
** Rather than calculate threshold and keep those that sustained non-negative growth; only calculate the threshold on those that have sustained
growth episodes. This reduces the share of firms, so the cutoff was taken at 10% instead of the usual 5%.# Meets 20% growth 3 years consecutively ## The product of change & growth
Main Results
7
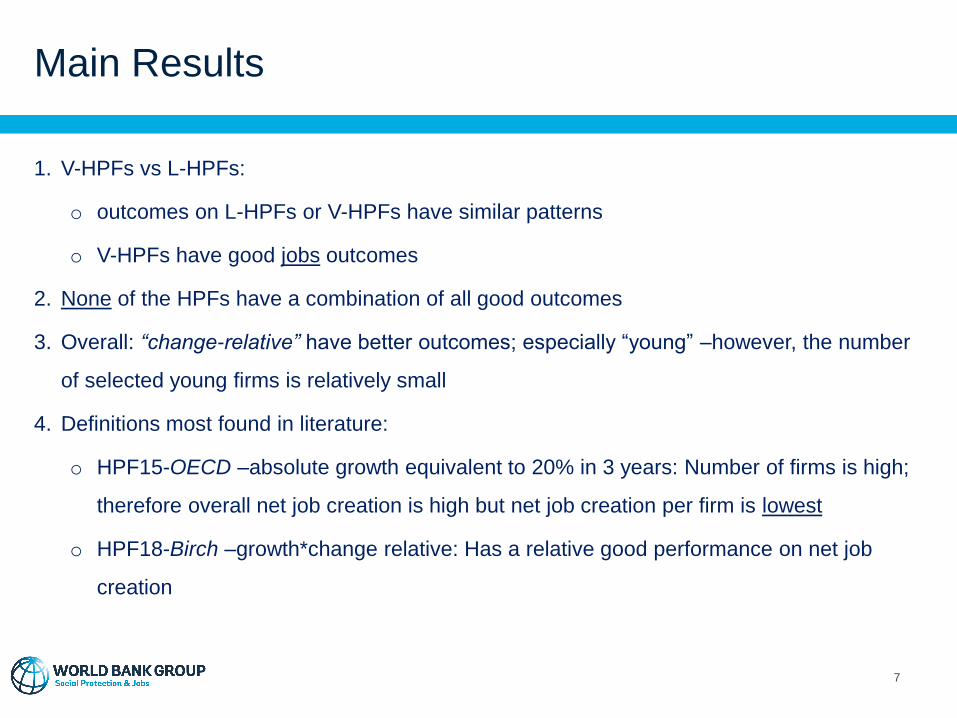
1. V-HPFs vs L-HPFs:
o outcomes on L-HPFs or V-HPFs have similar patterns
o V-HPFs have good jobs outcomes
2. None of the HPFs have a combination of all good outcomes
3. Overall: “change-relative” have better outcomes; especially “young” –however, the number
of selected young firms is relatively small
4. Definitions most found in literature:
o HPF15-OECD –absolute growth equivalent to 20% in 3 years: Number of firms is high;
therefore overall net job creation is high but net job creation per firm is lowest
o HPF18-Birch –growth*change relative: Has a relative good performance on net job
creation

Main Results
8
EMPLOYMENT VALUE ADDED
HPF N. Firms
Net Job
Creation
Net Job
Creation per
episode N. Firms
Net Job
Creation
Net Job
Creation per
episode
HPF1 tt3jcry change 14,937 2,820,633 41.5 13,291 2,471,948 35.4
HPF2 tt3jcr best episode 9,570 2,514,009 74.6 9,337 2,256,095 50.8
HPF3 tt3scry sustain 11,564 2,514,562 48.9 9,461 2,031,844 41.3
HPF4 tt3scr sustain pooled 11,374 2,494,644 49.4 9,495 2,040,993 41.1
HPF5 15jcr young 3,226 1,296,961 84.0 3,058 1,141,190 74.7
HPF6 15cr young sustain 3,325 1,102,805 71.6 2,439 890,899 63.9
HPF7 05jcr entry, age5 5,555 1,750,190 40.9 5,547 1,627,980
HPF8 tt3jgry growth 22,343 1,866,122 22.2 24,343 1,383,597 13.5
HPF9 tt3jgr best episode 9,714 1,190,326 37.1 9,419 692,483 18.5
HPF10 tt3sgry sustained 16,992 1,585,748 25.4 15,672 1,112,842 17.3
HPF11 tt3sgr
sustained
pooled 16,843 1,562,642 25.4 15,646 1,113,729 17.3
HPF12 tt3Sgry only sustain 6,730 951,865 39.3 5,860 554,147 23.3
HPF13 15jgr young 3,197 521,280 36.4 3,058 302,656 21.9
HPF14 15sgr young sustain 4,453 634,749 37.9 4,111 381,899 22.1
HPF15 tt3jga absolute 48,819 2,769,648 14.3 81,105 3,082,266 8.3
HPF16 tt3sga sustained 36,830 2,411,094 17.0 49,587 2,524,471 11.0
HPF17 tt3sgA consecutive 8,897 992,853 28.7 16,016 1,159,730 16.0
HPF18 tt1cgry birch 16,670 2,827,198 38.1 16,255 2,529,511 30.5

Overlaps across different employment L-HPFs
9
Change and Growth (1 vs 3 & 8
vs 10)
• 77% are sustained –similar
year-by-year or single pooled
• Almost all young are picked up
by same criteria HPF with no
age restriction
Absolute
• OECD (20% equivalent growth over 3
years) picks up almost all other HPFs
(except Age 5)
• 75% are sustained (15 vs 16), but only
18% meet criteria in 3 consecutive years
(15 vs 17)
Birch picks up most others
Change vs Growth
• 64% of HPF1 (change) are
also HPF8 (growth), but
only 43% of HPF8 are
HPF1 too

Overlaps across different employment L-HPFs and
value added V-HPFs
10
• Overall overlaps decreases, but still
OECD definition covers more
• 56% are sustained (15 vs 16), but only
23% meet criteria in 3 consecutive
years (15 vs 17)

Determinants of being HPF
1. HPFs selected on amount of jobs or value added generated tend to be larger firms, while HPFs
selected on growth rates tend to be evenly found across size categories
2. All HPFs are more likely to be young; the effect is not that large
3. The likelihood of certain sectors being more likely to have HPFs depends on whether HPFs are
selected on employment or value added rather than on growth or change in levels
Note: coefficients are small (omitted category is Agriculture, Fishing and Forestry)
o Mining, construction and utilities are positive and significant for L-HPFs and only for growth V-HPF
o Textiles and apparel have negative coefficient for all HPFs
o Furniture is positive and significant for all HPFs selected on growth and negative for others
o Other manufacturing is positive for all V-HPFs and for L-HPF selected on growth
o Commerce, hotel and restaurants and business and finance are mostly negative
o Transport and communications tend to be positive for V-HPF selected on growth
o Other services are positive for HPFs selected on growth
11

Determinants of being a High Performance Firm (at start)(1) (2) (3) (4) (5) (6) (7) (8) (9) (10) (11) (12)
tt3jcry tt3scry tt3jgry tt3sgry OECD Birch tt3jcry tt3scry tt3jgry tt3sgry OECD Birch
HPF1L HPF3L HPF8L HPF10L HPF15L HPF18L HPF1rV HPF3rV HPF8rV HPF10rV HPF15rV HPF18rV
sz_20to49 0.112*** 0.0816*** 0.0345*** 0.0265*** 0.0781*** 0.0874*** 0.0992*** 0.0685*** 0.0337*** 0.0315*** 0.0691*** 0.0953***
(0.00384) (0.00342) (0.00601) (0.00460) (0.00757) (0.00385) (0.00757) (0.00535) (0.00469) (0.00274) (0.00600) (0.00486)
sz_50to99 0.363*** 0.289*** 0.103*** 0.0807*** 0.122*** 0.283*** 0.329*** 0.257*** 0.0527*** 0.0554*** 0.0804*** 0.264***
(0.0126) (0.0145) (0.0111) (0.00886) (0.0113) (0.0104) (0.0188) (0.0158) (0.00861) (0.00787) (0.00700) (0.0127)
sz_100to499 0.616*** 0.506*** 0.120*** 0.0972*** 0.119*** 0.483*** 0.564*** 0.465*** 0.0618*** 0.0658*** 0.0691*** 0.460***
(0.0232) (0.0294) (0.0139) (0.0121) (0.0131) (0.0190) (0.0243) (0.0234) (0.0118) (0.00926) (0.00873) (0.0199)
sz_500plus 0.790*** 0.622*** 0.0881*** 0.0856*** 0.0783*** 0.709*** 0.834*** 0.667*** 0.0236* 0.0481*** 0.0238 0.711***
(0.0239) (0.0437) (0.0134) (0.0139) (0.0224) (0.0215) (0.0174) (0.0195) (0.0137) (0.0131) (0.0217) (0.0219)
age10_19 -0.00773** -0.00917*** -0.0198*** -0.0276*** -0.0119* -0.0145*** -0.00159 -0.00294** -0.0531*** -0.0443*** -0.0271*** -0.0223***
(0.00316) (0.00193) (0.00494) (0.00331) (0.00652) (0.00399) (0.00214) (0.00122) (0.00391) (0.00205) (0.00554) (0.00265)
age20_29 -0.0114** -0.0113*** -0.0435*** -0.0424*** -0.0495*** -0.0228*** -0.00397 -0.00283 -0.0736*** -0.0523*** -0.0733*** -0.0281***
(0.00466) (0.00287) (0.00941) (0.00593) (0.0115) (0.00486) (0.00484) (0.00200) (0.00536) (0.00380) (0.00670) (0.00486)
age30plus -0.0259*** -0.0233*** -0.0841*** -0.0687*** -0.137*** -0.0473*** -0.0154*** -0.0131*** -0.0905*** -0.0602*** -0.152*** -0.0389***
(0.00581) (0.00451) (0.00834) (0.00712) (0.0158) (0.00728) (0.00502) (0.00379) (0.0108) (0.00572) (0.0170) (0.00542)
MinUtilConstr 0.0338*** 0.00563* 0.0971*** 0.0330*** 0.0539*** 0.0596*** -0.0145** -0.0127*** 0.0622*** 0.0257*** 0.0452*** 0.00771
(0.00657) (0.00332) (0.0141) (0.00798) (0.00896) (0.00947) (0.00634) (0.00376) (0.0158) (0.00831) (0.00406) (0.00711)
TextApparel -0.0175*** -0.0125*** -0.0150*** -0.0118** -0.0534*** -0.0165*** -0.0258** -0.0121 -0.0338*** -0.00866 -0.0214 -0.0328*
(0.00436) (0.00354) (0.00458) (0.00472) (0.0136) (0.00508) (0.0118) (0.00740) (0.00781) (0.00636) (0.0173) (0.0168)
Furniture -0.0205*** -0.0123*** 0.0220*** 0.0168*** 0.0349*** -0.0123*** -0.0343*** -0.0177*** 0.0123*** 0.0319*** 0.0620*** -0.0374***
(0.00139) (0.000938) (0.00212) (0.00141) (0.00153) (0.00119) (0.00341) (0.00206) (0.00365) (0.00471) (0.00196) (0.00372)
Other Manuf -0.00195 0.000306 0.0162*** 0.0127*** 0.0254*** 0.00491 0.0242*** 0.0203*** 0.0328*** 0.0384*** 0.0796*** 0.0413***
(0.00339) (0.00250) (0.00537) (0.00443) (0.00755) (0.00480) (0.00622) (0.00453) (0.00637) (0.00598) (0.00465) (0.00928)
Commerce -0.0131*** -0.0107*** 0.0118* 0.00424 -0.00916** -0.00427 0.00806 0.00484 0.00696 0.00727 0.0275*** 0.0169
(0.00295) (0.00305) (0.00608) (0.00461) (0.00464) (0.00396) (0.0151) (0.00782) (0.00682) (0.00462) (0.00729) (0.0186)
TranspCommun 0.00942 0.00138 0.0616** 0.0362 0.0438 0.0283* 0.00625 0.00794 0.0608*** 0.0467*** 0.0662*** 0.0262*
(0.00940) (0.00525) (0.0292) (0.0220) (0.0448) (0.0170) (0.00794) (0.00501) (0.0171) (0.0137) (0.0202) (0.0144)
Hotel&Rest -0.00226 -0.00530 0.0209*** 0.0104 -0.0103 0.00885 -0.0364*** -0.0185*** 0.0293** 0.0122 0.0140 -0.0285*
(0.00857) (0.00688) (0.00703) (0.00735) (0.00772) (0.00901) (0.00887) (0.00540) (0.0147) (0.0100) (0.0189) (0.0173)
Bus&Fin -0.00289 -0.00103 -0.00745 -0.00125 -0.0705*** 0.00105 0.0135 0.000655 0.00205 -0.00462 -0.0592*** 0.0233*
(0.00818) (0.00685) (0.00804) (0.00822) (0.0138) (0.00726) (0.0113) (0.00491) (0.0126) (0.00734) (0.0208) (0.0131)
OtherServ 0.0300** 0.0124 0.0752*** 0.0438*** 0.0462** 0.0456** -0.00187 -0.000847 0.0844*** 0.0561*** 0.0741*** 0.0283***
(0.0151) (0.00787) (0.0259) (0.0159) (0.0230) (0.0200) (0.00794) (0.00512) (0.0182) (0.0145) (0.0109) (0.0106)
Year dummy yes yes yes yes yes yes yes yes yes yes yes yes
Observations 173,997 181,681 178,444 184,854 185,325 175,049 170,930 180,486 177,477 183,366 196,211 172,636
Robust standard errors in parentheses
*** p<0.01, ** p<0.05, * p<0.1
12
𝐻𝑃𝐹𝑖𝑠𝑡 = 𝛽0 + 𝛽𝑠𝑧𝑘 ∗ 𝑆𝑧𝑖𝑠𝑡 + 𝛽𝑎𝑔𝑚 ∗ 𝐴𝑔𝑖𝑠𝑡 + 𝜑𝑌𝑒𝑎𝑟𝑡 + 𝜃𝐼𝑠 + 𝜀𝑖𝑠𝑡 (1)
measures at level of the firm I belonging to sector s at time t.
The regressions are not intended to be casual; the aim is to look at characteristics associated with being a future HPF,
conditional on controlling for other initial characteristics.

What sectors stand out on employment HPFs?
Examples
13

What sectors stand out on value added HPFs?
Examples
14

Sectoral overlap between employment and value
added HPFs: OECD definition
15
42. Civil engineering
87. Residential care activities
23. Manufacture of other
non metallic mineral products
62. Computer programming, consultancy and
related activities
28. Manufacture of machinery
and equipment
30. Manufacture of other transport
equipment
51. Air transport
21. Manufacture of
basic
pharmaceutical
products etc.
80. Security and
investigation
activities
81. Services to
buildings and
landscape
activities
91. Libraries,
archives, museums
etc.
97. Activities of
households as
employers of
domestic
personnel
29. Manufacture of
motor vehicles etc.
Employment Value Added

Creating more & better jobs: Implications for Policy
16
Non-gazelles Gazelles
Go
od jobs
Bad jobs
60. Programming and broadcasting activities
63. Information service activities
77. Rental and leasing activities
20. Manufacture of chemicals and chemical
products
80. Security and investigation activities
51. Air transport
21. Manufacture of basic pharmaceutical
products and pharmaceutical preparations
62. Computer programming, consultancy
and related activities
26. Manufacture of computer, electronic
and optical products
12. Manufacture of tobacco products
81. Services to buildings and landscape
activities
42. Civil engineering
91. Libraries, archives, museums and other
cultural activities
23. Manufacture of other non metallic
mineral products
86. Human health activities
10. Manufacture of food products
11. Manufacture of beverages
13. Manufacture of textiles
31. Manufacture of furniture
49. Land transport and transport via pipelines
25. Manufacture of fabricated metal products,
except machinery and equipment

Conclusion
1. Large firms create more jobs (higher selection of larger firms with
change definitions).
2. Young firms are more likely to be high performing firms.
3. Sectors of HPFs in both dimensions (labor and productivity) vary
widely, from low skill requiring sectors to higher skill requiring
sectors.
4. For policymakers/academics: What to do with sectors in the red
quadrant (non-gazelle/bad jobs), and how to help sectors in the
grey quadrant to offer better quality jobs so the economy can
benefit from their high performance.
17