Embed Size (px)
Citation preview

Wages and SalariesIn the Baltic States
March 2017
Compiled by Kadri Seeder, Salary Information Agency
-5.9
-2.3
-0.1
0.1 0
.6 0.7 0.8 1
1.4 1.5 1.7
1.7 1.9
1.9 2 2.2 2.4 2.6 3
.3
4.3 4.5 4.8
6.3
7.2 7
.7 7.9 8.1
14.6
-10
-5
0
5
10
15
20
%
Labour cost index - percentage change The same quarter of previous year = 100
2014Q3 2015Q3 2016Q3
Source: Eurostat
Notes:
Seasonally and calendar adjusted data
Percentage change compared to same period in previous year
Industry, construction and services (except activities of households as employers and extra-territorial organisations and bodies)
Wages and salaries (total)

Average hourly labour costs, 2015
Source: Eurostat

320
346
381
453
540
545
635
552
585 723
724
749 893
808 1
152
1326
1271 1
644 1962
1854
2038 2348
2912
2247
2829
2341
2332
2570
3157
3082
3575
2908
4301
4866
507
578
633
648
774
802
902
950
1025
1061
1072
1114
1164 1488 1
834
1852
2057
2142
2677
2865
3037
3072
3153
3221
3359
3374
3402
3554
3700 3997 4
373
4877 5
243
6410
0
1000
2000
3000
4000
5000
6000
7000
Mean monthly earnings by occupation, 2014
Manual workers (OC7-9) Non manual workers (OC1-5)
Source: Eurostat
Org size: 10 and more employees

679
794
628
774
887
994
985
1167
1199
1344
1205
1320
1569 2
125
2038
2236 2
731
2657
3490
5170
4251
3626
3882
3479
4091
4046
4259
4212
3180
4615 5017
5887
5778
7706
981
1035
1037
1235
1301
1456
1551
1709
1919
1958
2035
2093
2244
3093
3257
3479 3920 4
431 4878
4984
5276
5290
5371
5474 6
007
6081 6483
6544 6958 7
459
7546
7731
8593
9385
0
1000
2000
3000
4000
5000
6000
7000
8000
9000
10000
Mean monthly earnings by occupation, 2014
Professionals (OC2) Managers (OC1)
Source: Eurostat
Org size: 10 and more employees
249
288
319
383
412
441
483
492
499
534
546
572
644
718
954
1082
1131 1327 1
578
1718
1746
1754
1768
1882
1893
2273
2343
2440
2447
2601
2617
3113
3620
4432
265
297
333
387
446
444
523
530
561
576
623
586
665 799 1
051
1185
1312
1429
1804
1878 2101
2037
2002
1907
1944
2396
2462
2811
2365 2571 2
838
3001
3791
4485
0
500
1000
1500
2000
2500
3000
3500
4000
4500
5000
Mean monthly earnings by occupation, 2014
Elementary occupations (OC9) Service and slaes workers (OC5)
Source: Eurostat
Org size: 10 and more employees

825
784
792 839 887 9
49
1005 1065 1146
1199 1265 1332 13
99
682
655
63
3
66
0
685
716 765 818 859 906 951 999
1049
623
596
576
59
3
615 646
677 714 7
71 814 864 9
19
0
200
400
600
800
1000
1200
1400
1600
2008 2009 2010 2011 2012 2013 2014 2015 2016 2017* 2018* 2019* 2020*
Years
Annual average monthly gross wages, EUR
Estonia Latvia Lithuania
Source: Statistics Estonia, Central Statistical Bureau of Latvia, Statistics Lithuania, ministries of finance
* - forecast
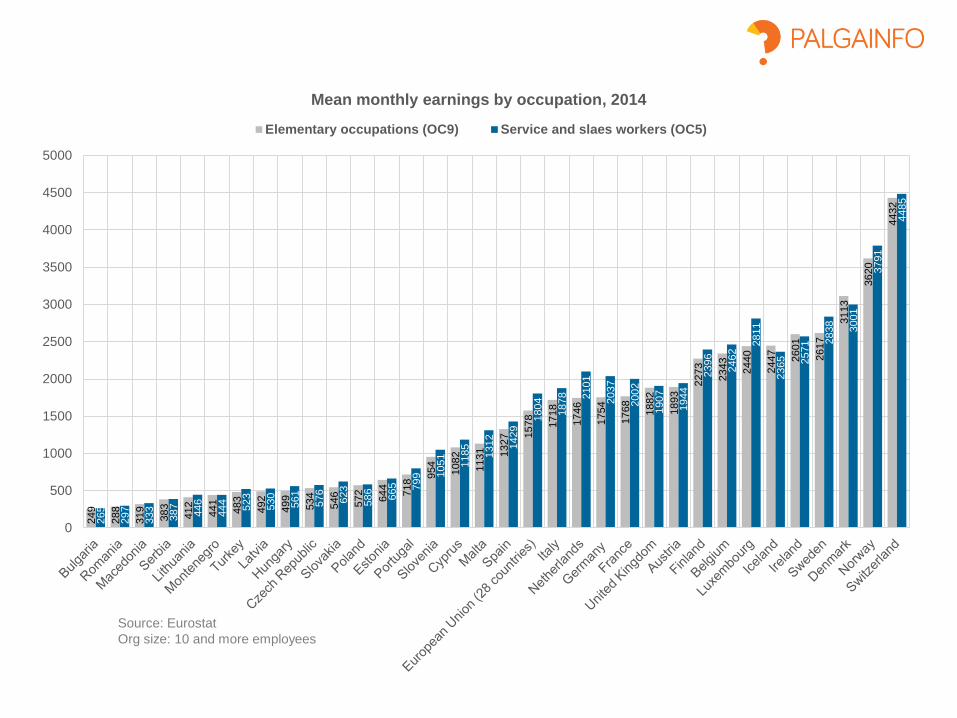
670
637
637 672 706 757 79
9 859 9
20
498
486
450
470
488
516 560 603
63
1
478
464
450
462
478
501
527
554 600
0
200
400
600
800
1000
1200
1400
1600
2008 2009 2010 2011 2012 2013 2014 2015 2016*
Years
Annual average monthly net wages, EUR
Estonia Latvia Lithuania
Source: Statistics Estonia, Central Statistical Bureau of Latvia, Statistics Lithuania, ministries of finance
* The net wage in Estonia was calculated by tax rates because it was not published yet.
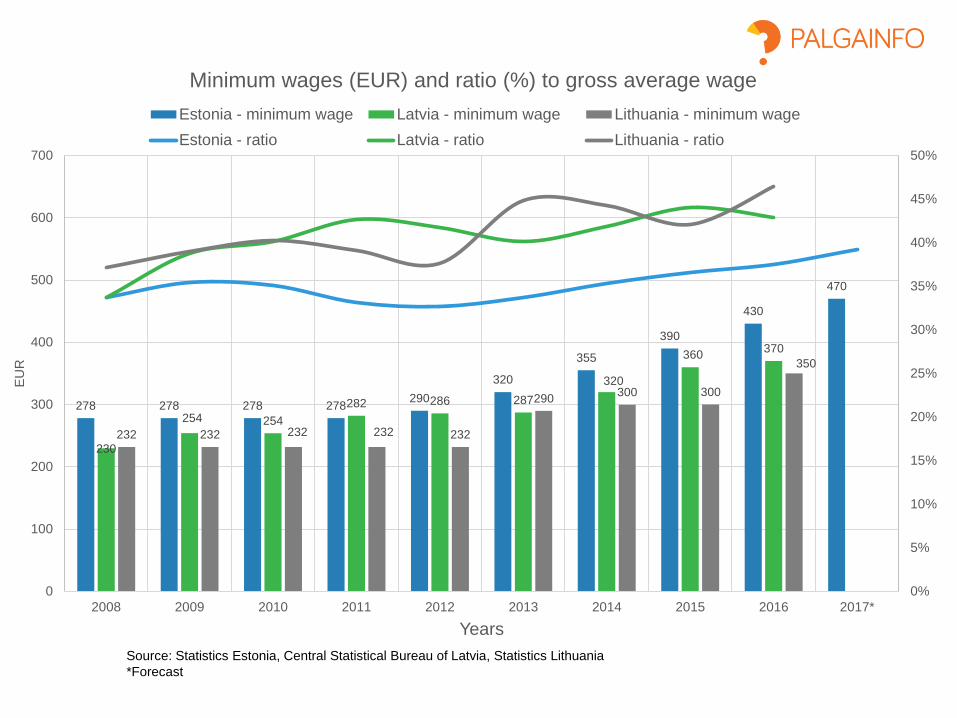
278 278 278 278290
320
355
390
430
470
230
254 254
282 286 287
320
360370
232 232 232 232 232
290300 300
350
0%
5%
10%
15%
20%
25%
30%
35%
40%
45%
50%
0
100
200
300
400
500
600
700
2008 2009 2010 2011 2012 2013 2014 2015 2016 2017*
EU
R
Years
Minimum wages (EUR) and ratio (%) to gross average wage
Estonia - minimum wage Latvia - minimum wage Lithuania - minimum wage
Estonia - ratio Latvia - ratio Lithuania - ratio
Source: Statistics Estonia, Central Statistical Bureau of Latvia, Statistics Lithuania
*Forecast

789
850
800838
776813
752784
758
823
759
814792
857
809
865847
900855
916 900
976
930
986966
1023
977
10391010
10821045
11051091
11631119
1182
645679 693 711
669 674649
626 615 632 637 647 640659 664 676 663
684 687 703 689716 722 737 740
762 772 786 785815 829 844 827
853 860894
623648
672 672635 629 620 614
588 595 603 614 600 610 613 630 619 624 629 646 647 653 668 678 671 682 697 715 700 714735
757 748772
793823
0
200
400
600
800
1000
1200
1400
2008 I Q
II Q
III Q
IV Q
2009 I Q
II Q
III Q
IV Q
2010 I Q
II Q
III Q
IV Q
2011 I Q
II Q
III Q
IV Q
2012 I Q
II Q
III Q
IV Q
2013 I Q
II Q
III Q
IV Q
2014 I Q
II Q
III Q
IV Q
2015 I Q
II Q
III Q
IV Q
2016 I Q
II Q
III Q
IV Q
Average monthly gross wages, EUR
Estonia Latvia Lithuania
Source: Statistics Estonia, Central Statistical Bureau of Latvia, Statistics Lithuania

641
689651
680
633660
612634
611
660
611653 637
685648
692 677716
681
729 721
778742
786 769812
777
827 815
871842
891 882
937902
945
470495 506 521
500 505476 460
438 450 453 459 456 470 473 481 474 488 491 501 496 514 521 530 543 558 564 575 579599 611 622 610 627 632
657
478 496 514 514493 489 482 477 459 464 469 478 467 475 477 489 481 485 488 501 501 506 517 524 522 531 541 554 544 554 569 585 584 601 616
637
0
200
400
600
800
1000
1200
1400
2008 I Q
II Q
III Q
IV Q
2009 I Q
II Q
III Q
IV Q
2010 I Q
II Q
III Q
IV Q
2011 I Q
II Q
III Q
IV Q
2012 I Q
II Q
III Q
IV Q
2013 I Q
II Q
III Q
IV Q
2014 I Q
II Q
III Q
IV Q
2015 I Q
II Q
III Q
IV Q
2016 I Q
II Q
III Q
IV Q
Average monthly net wages, EUR
Estonia Latvia Lithuania
Source: Statistics Estonia, Central Statistical Bureau of Latvia, Statistics Lithuania

-15%
-10%
-5%
0%
5%
10%
15%
20%
25%
30%
35%
40%
2005 I Q
II Q
III Q
IV Q
2006 I Q
II Q
III Q
IV Q
2007 I Q
II Q
III Q
IV Q
2008 I Q
II Q
III Q
IV Q
2009 I Q
II Q
III Q
IV Q
2010 I Q
II Q
III Q
IV Q
2011 I Q
II Q
III Q
IV Q
2012 I Q
II Q
III Q
IV Q
2013 I Q
II Q
III Q
IV Q
2014 I Q
II Q
III Q
IV Q
2015 I Q
II Q
III Q
IV Q
2016 I Q
II Q
III Q
IV Q
Change of average monthly gross wages The same quarter of previous year = 100
Estonia
Lativa
Lithuania
Source: Statistics Estonia, Central Statistical Bureau of Latvia, Statistics Lithuania
2015 2016
I Q II Q III Q IV Q I Q II Q III Q IV Q
4.5% 5.8% 6.9% 6.4% 8.1% 7.6% 7.1% 6.9%
6.3% 6.9% 7.3% 7.4% 5.2% 5.2% 3.7% 5.9%
4.3% 4.6% 5.5% 5.9% 6.9% 8.1% 7.9% 8.7%

-15%
-10%
-5%
0%
5%
10%
15%
20%
25%
2005 I Q
II Q
III Q
IV Q
2006 I Q
II Q
III Q
IV Q
2007 I Q
II Q
III Q
IV Q
2008 I Q
II Q
III Q
IV Q
2009 I Q
II Q
III Q
IV Q
2010 I Q
II Q
III Q
IV Q
2011 I Q
II Q
III Q
IV Q
2012 I Q
II Q
III Q
IV Q
2013 I Q
II Q
III Q
IV Q
2014 I Q
II Q
III Q
IV Q
2015 I Q
II Q
III Q
IV Q
2016 I Q
II Q
III Q
IV Q
Change of real wages The same quarter of previous year = 100
Estonia
Latvia
Lithuania
Source: Statistics Estonia, Central Statistical Bureau of Latvia, Statistics Lithuania
Note: Real wages take into account the influence of the change in the consumer price index
2015 2016
I Q II Q III Q IV Q I Q II Q III Q IV Q
5.4% 5.9% 7.5% 6.9% 8.5% 8.3% 6.7% 5.5%
6.8% 6.4% 8.4% 8.0% 5.6% 5.4% 3.2% 4.0%
5.8% 5.1% 6.2% 6.0% 6.3% 7.7% 7.4% 7.6%

1011
1444
1141
1607
1181
1096
1045
1167
771
1909
1831
916
1332
1076
1475
1102
1252
970
626
839
1062
845
1188
856
846
798
909
588
1413
1784
795
964
804
1147
757
830
767
746
719
1037
851
1007
823
753
762
775
567
1362
1427
747
1038
693
998
729
826
693
722
0 500 1000 1500 2000 2500
Agriculture, forestry and fishing
Mining and quarrying
Manufacturing
Electricity, gas, steam and air conditioning supply
Water supply; sewerage, waste management and…
Construction
Wholesale and retail trade; Repair of motor…
Transportation and storage
Accommodation and food service activities
Information and communication
Financial and insurance activities
Real estate activities
Professional, scientific and technical activities
Administrative and support service activities
Public administration and defence; compulsory…
Education
Human health and social work activities
Arts, entertainment and recreation
Other service activities
Average monthly gross wage by economic activity, 4st quarter of 2016, EUR
Estonia
Latvia
Lithuania
Source: Statistics Estonia, Central Statistical Bureau of Latvia, Statistics Lithuania

3.6%
3.6%
8.1%
6.1%
3.8%
1.1%
3.5%
6.2%
6.8%
7.3%
6.0%
9.3%
0.9%
15.5%
6.5%
9.5%
7.9%
6.2%
8.4%
4.5%
7.1%
6.6%
9.6%
5.0%
2.9%
6.4%
0.0%
6.7%
3.1%
1.9%
3.5%
0.7%
10.0%
10.6%
10.0%
5.2%
2.4%
11.3%
8.8%
4.6%
9.7%
2.4%
5.2%
7.7%
8.8%
7.2%
14.0%
7.9%
6.2%
3.6%
5.5%
8.7%
9.9%
8.8%
11.0%
10.6%
11.0%
0% 2% 4% 6% 8% 10% 12% 14% 16% 18%
Agriculture, forestry and fishing
Mining and quarrying
Manufacturing
Electricity, gas, steam and air conditioning supply
Water supply; sewerage, waste management and…
Construction
Wholesale and retail trade; Repair of motor…
Transportation and storage
Accommodation and food service activities
Information and communication
Financial and insurance activities
Real estate activities
Professional, scientific and technical activities
Administrative and support service activities
Public administration and defence; compulsory…
Education
Human health and social work activities
Arts, entertainment and recreation
Other service activities
Change of average monthly gross wage by economic activity, 4st Q 2015/16 The same quarter of previous year = 100
Estonia
Latvia
Lithuania
Source: Statistics Estonia, Central Statistical Bureau of Latvia, Statistics Lithuania

For further information and comments please contact:
The Salary Information Agency
E-mail: [email protected]
Phone: +372 56885066
http://www.palgainfo.ee


![[SIS] The Patterns of Culture](https://img.pdfslide.us/doc/110x75/53ed56068d7f7289708b5be7/sis-the-patterns-of-culture.jpg)