Embed Size (px)
DESCRIPTION
Presentation given by Trina Chiasson, Co-founder and CEO of Infoactive, at the Do Good Data conference. May 2014, Chicago. For questions and follow up, tweet: https://twitter.com/trinachi
Citation preview

Information Graphics for EveryoneTrina Chiasson, @trinachi


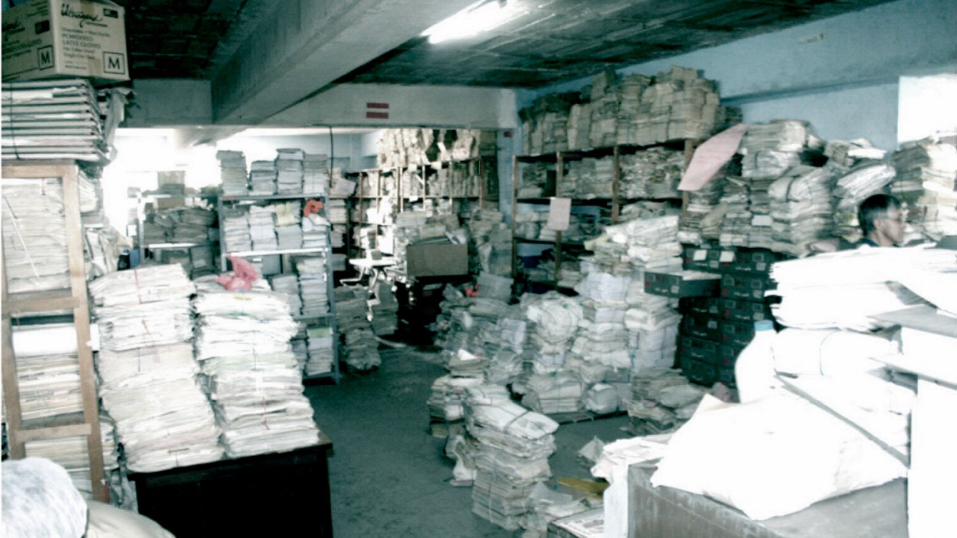
I did nonprofit stuff
We had lots of data

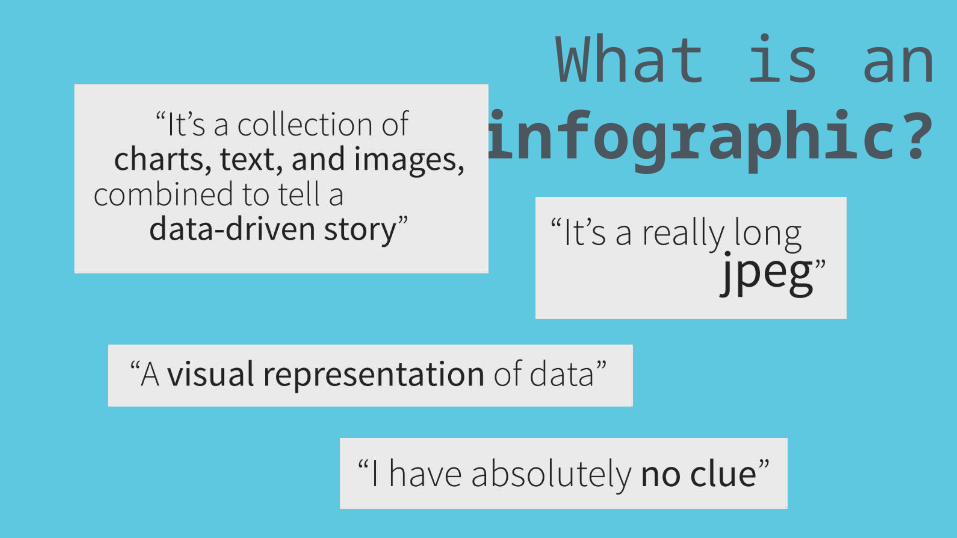
What is aninfographic?
A graphic that presents data
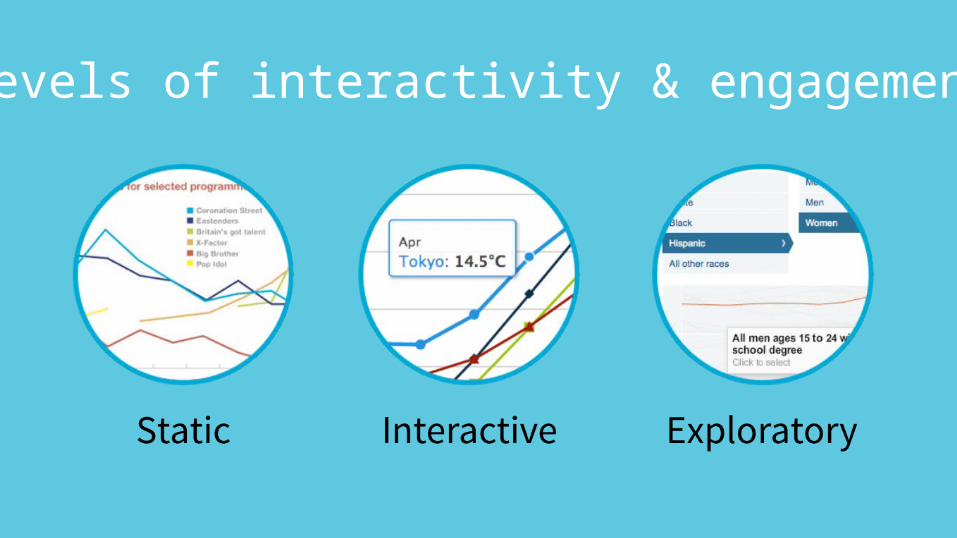
Levels of interactivity & engagement
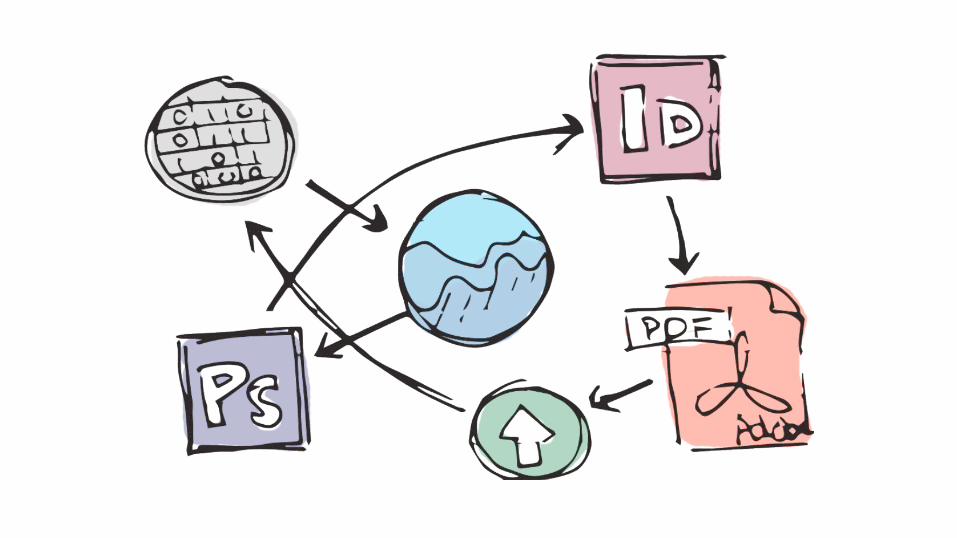
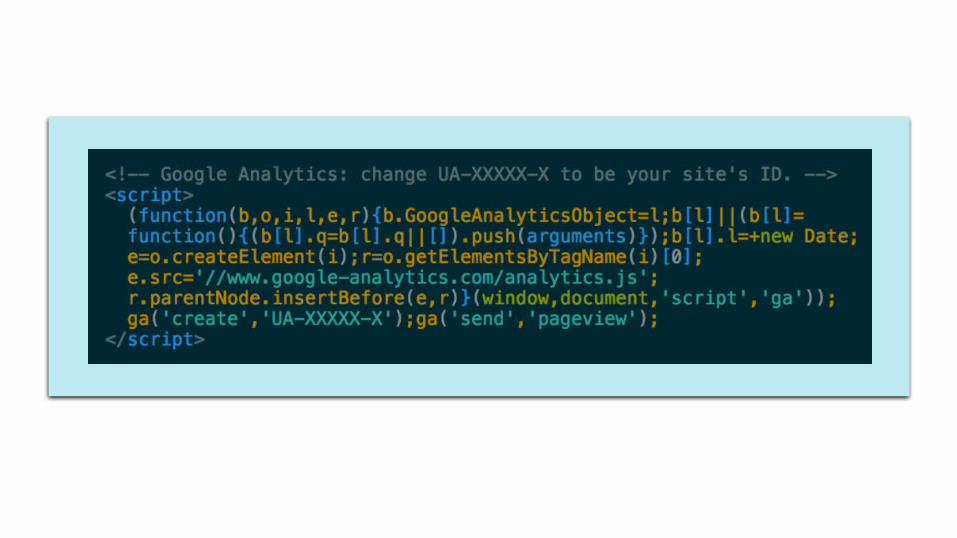
Data visualizations are hard to do

Can software help?
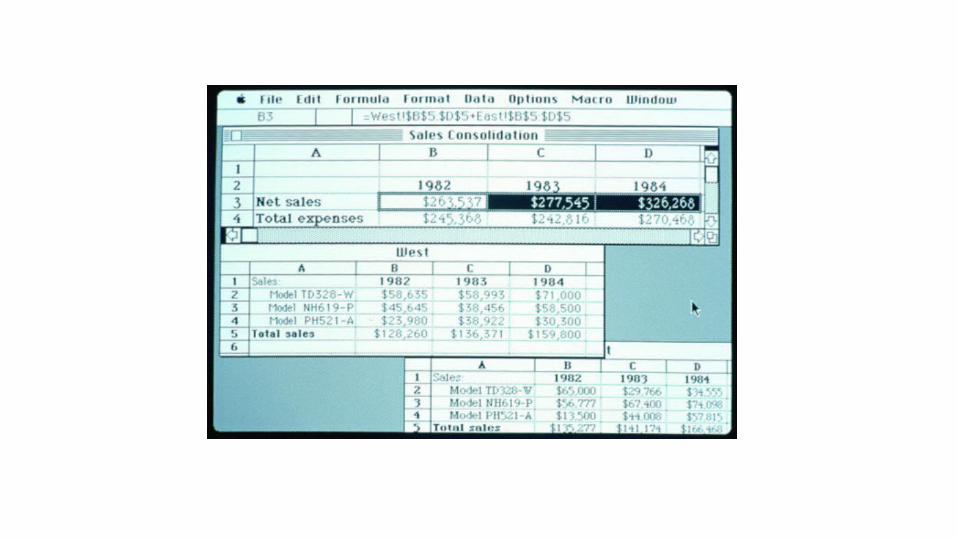
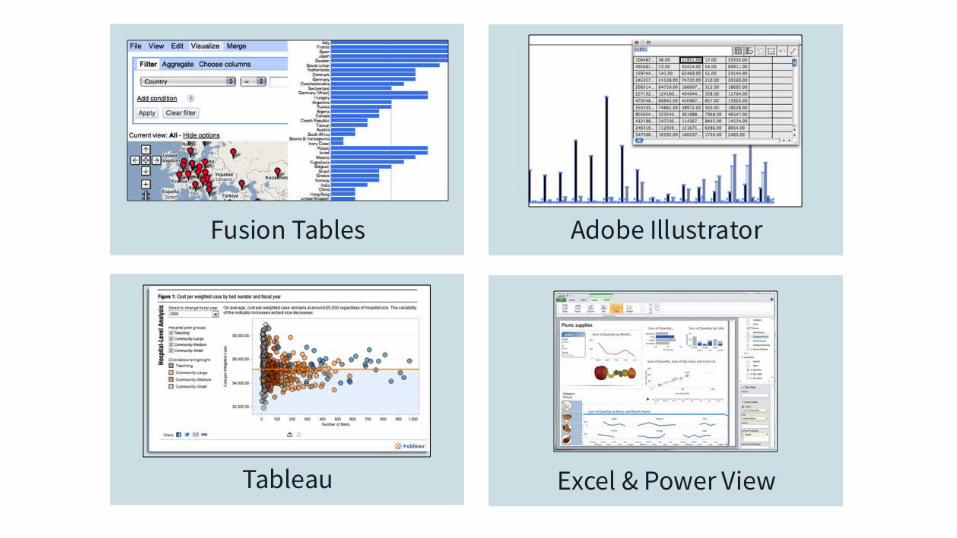
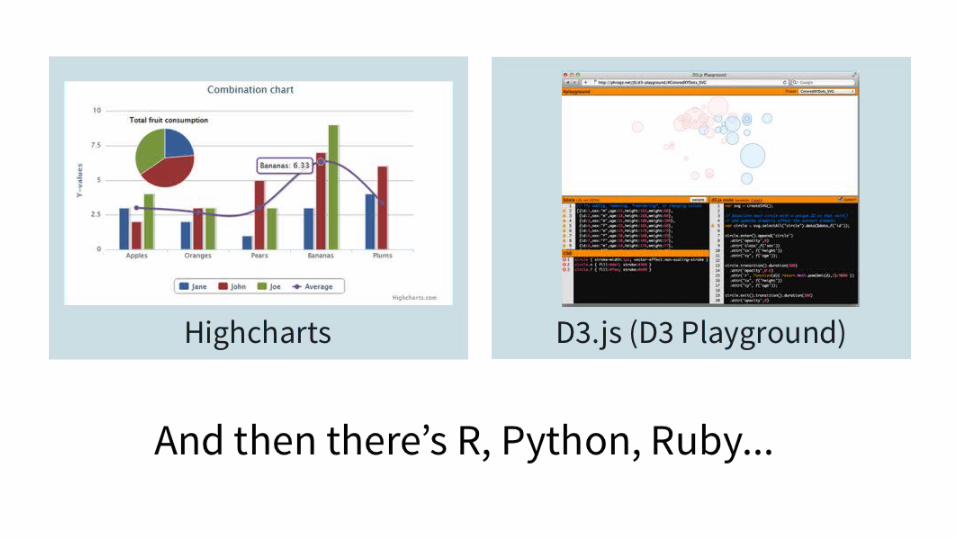
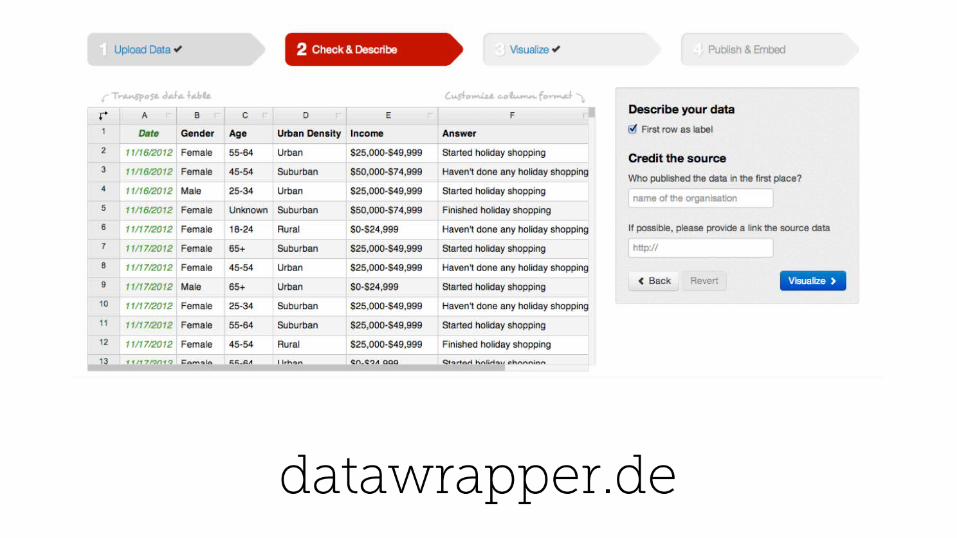
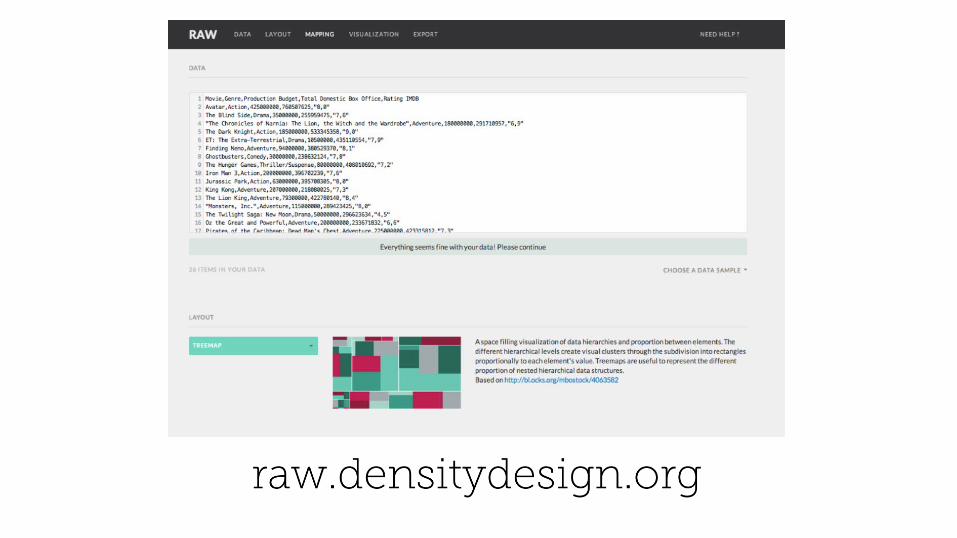

The perfect software doesn’t exist
Adventures in building datavis software:
infoactive.co
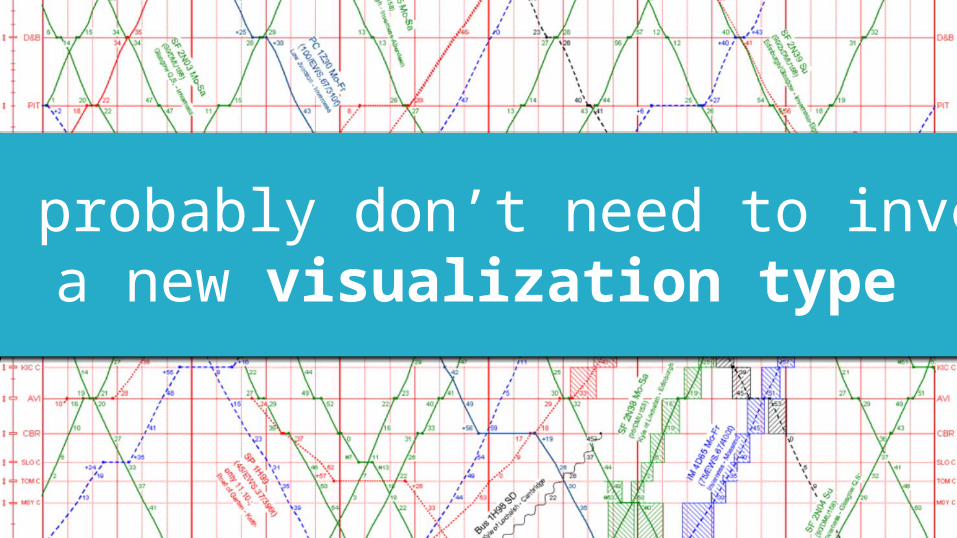
You probably don’t need to inventa new visualization type
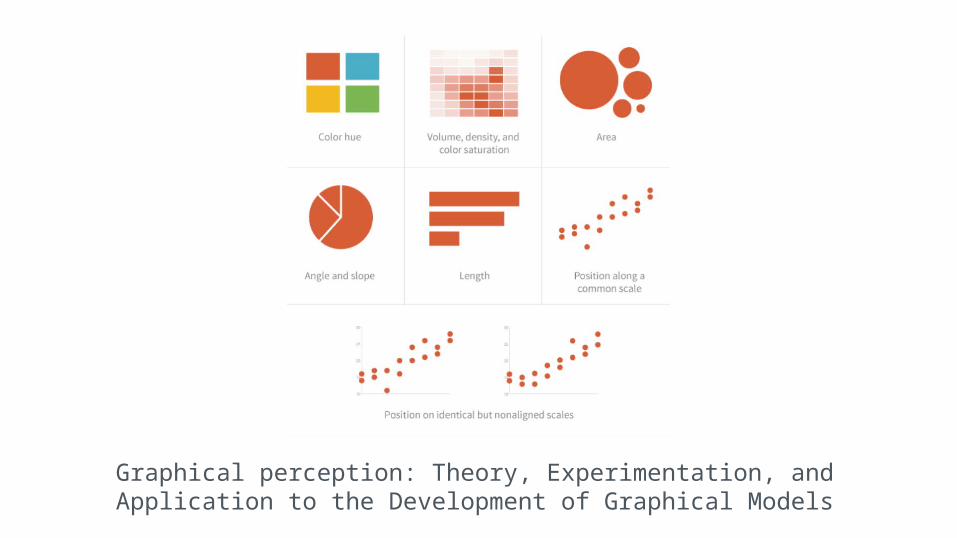
Graphical perception: Theory, Experimentation, and Application to the Development of Graphical Models

Questions?
infoactive.co/ebook • @DataDesignBook • @Infoactive
Trina Chiasson • [email protected] • @trinachi