Embed Size (px)
Citation preview
1
Measuring and Monetizing the Customer Experience using
Voice-of-the-Customer Social Media DataNew Developments in Measurement and Analytics
2
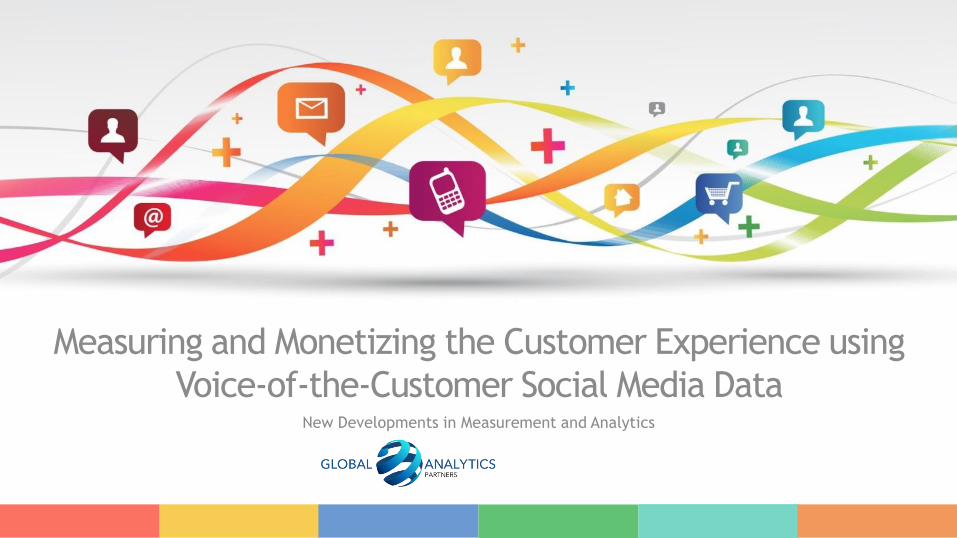
The Premise and Measurement Raw Material
• Public Relations ….. The professional maintenance of a
favorable public image
Brand Image &
Reputation (PR)
Social Media
Voice-of-the Customer
(VOC)Customer-
Brand Experience
3
Let’s Get Started
4Measuring the customer experience is imperative
“You’ve got to start with the customer experience
and work back toward the technology – not the other way around.”
~ Steve Jobs
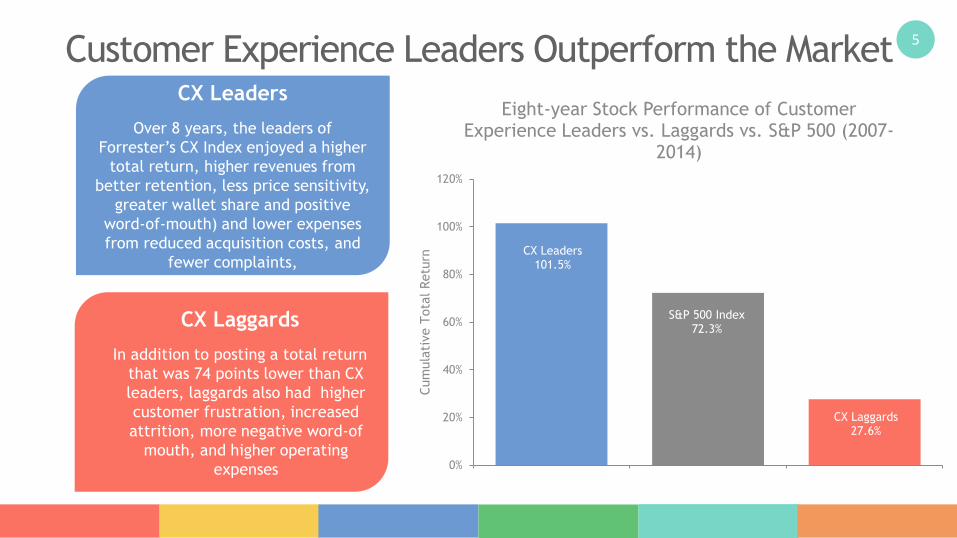
5Customer Experience Leaders Outperform the Market
CX Leaders101.5%
S&P 500 Index72.3%
CX Laggards27.6%
0%
20%
40%
60%
80%
100%
120%
Cum
ula
tive T
ota
l Retu
rn
Eight-year Stock Performance of Customer Experience Leaders vs. Laggards vs. S&P 500 (2007-
2014)
CX Laggards
In addition to posting a total return
that was 74 points lower than CX
leaders, laggards also had higher
customer frustration, increased
attrition, more negative word-of
mouth, and higher operating
expenses
CX Leaders
Over 8 years, the leaders of
Forrester’s CX Index enjoyed a higher
total return, higher revenues from
better retention, less price sensitivity,
greater wallet share and positive
word-of-mouth) and lower expenses
from reduced acquisition costs, and
fewer complaints,
6
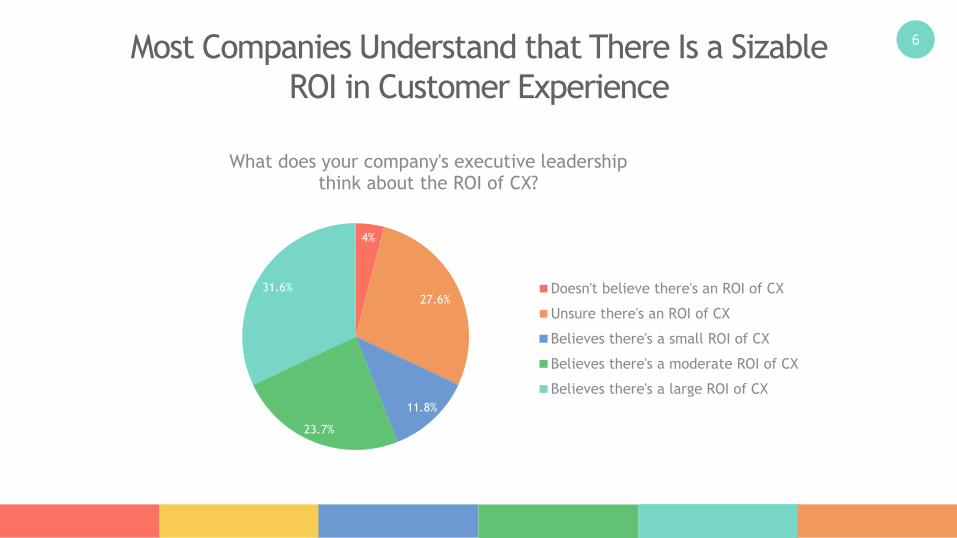
4%
27.6%
11.8%
23.7%
31.6%
What does your company's executive leadership think about the ROI of CX?
Doesn't believe there's an ROI of CX
Unsure there's an ROI of CX
Believes there's a small ROI of CX
Believes there's a moderate ROI of CX
Believes there's a large ROI of CX
Most Companies Understand that There Is a Sizable
ROI in Customer Experience
7
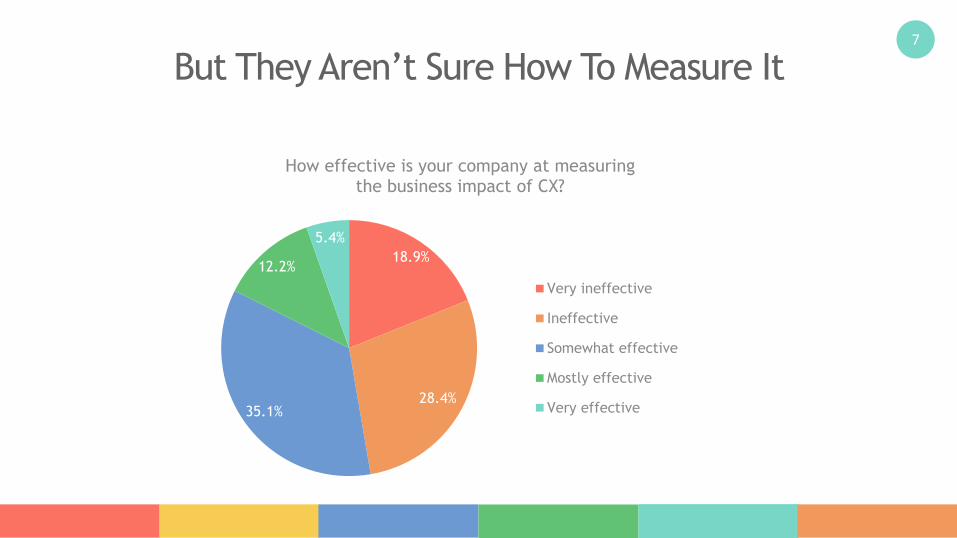
18.9%
28.4%35.1%
12.2%
5.4%
How effective is your company at measuring the business impact of CX?
Very ineffective
Ineffective
Somewhat effective
Mostly effective
Very effective
But They Aren’t Sure How To Measure It
8
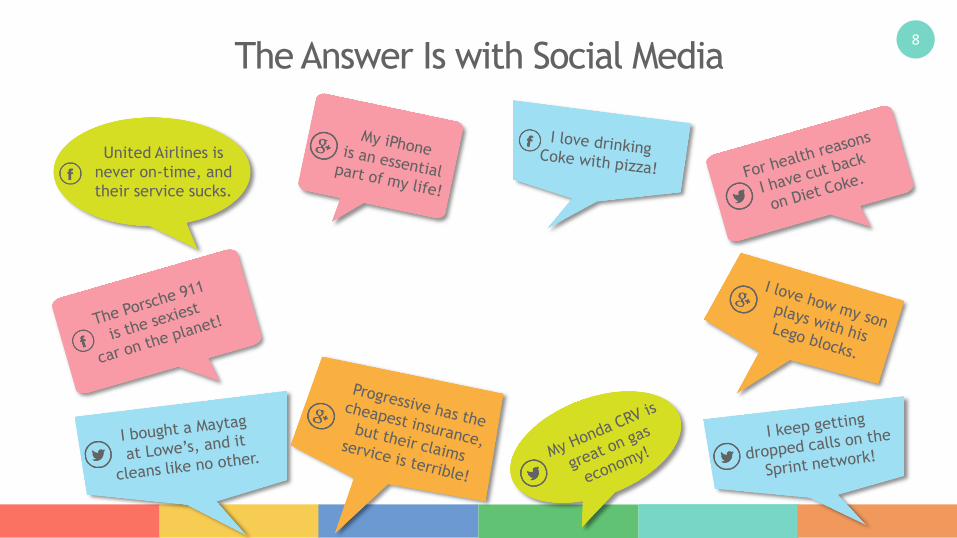
The Answer Is with Social Media
United Airlines is
never on-time, and
their service sucks.
9
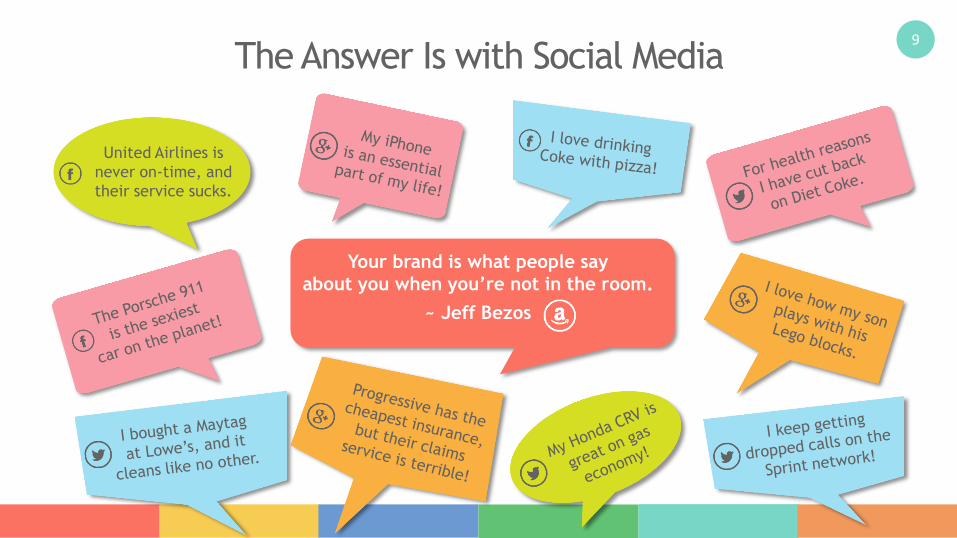
The Answer Is with Social Media
United Airlines is
never on-time, and
their service sucks.
Your brand is what people say
about you when you’re not in the room.
~ Jeff Bezos
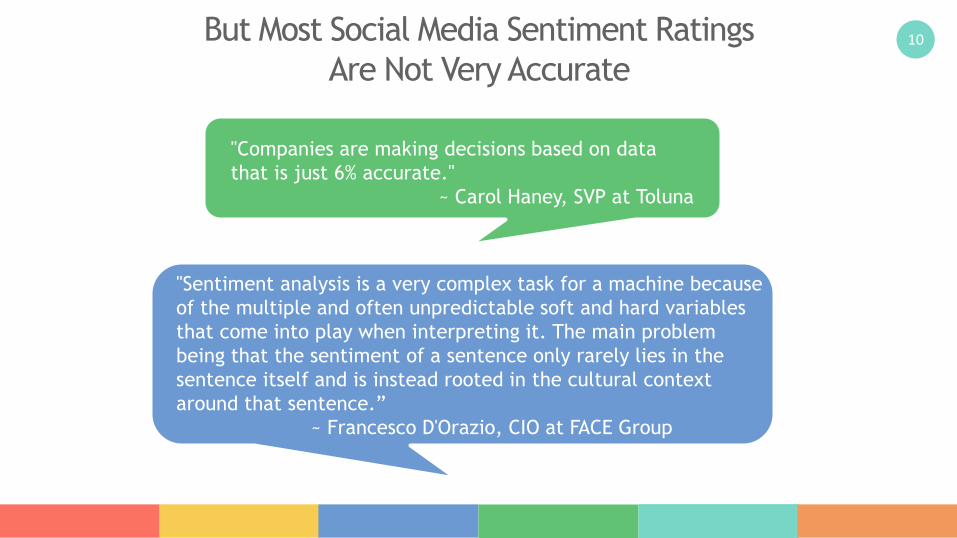
10But Most Social Media Sentiment Ratings
Are Not Very Accurate
"Sentiment analysis is a very complex task for a machine because
of the multiple and often unpredictable soft and hard variables
that come into play when interpreting it. The main problem
being that the sentiment of a sentence only rarely lies in the
sentence itself and is instead rooted in the cultural context
around that sentence.”
~ Francesco D'Orazio, CIO at FACE Group
"Companies are making decisions based on data
that is just 6% accurate."
~ Carol Haney, SVP at Toluna
11
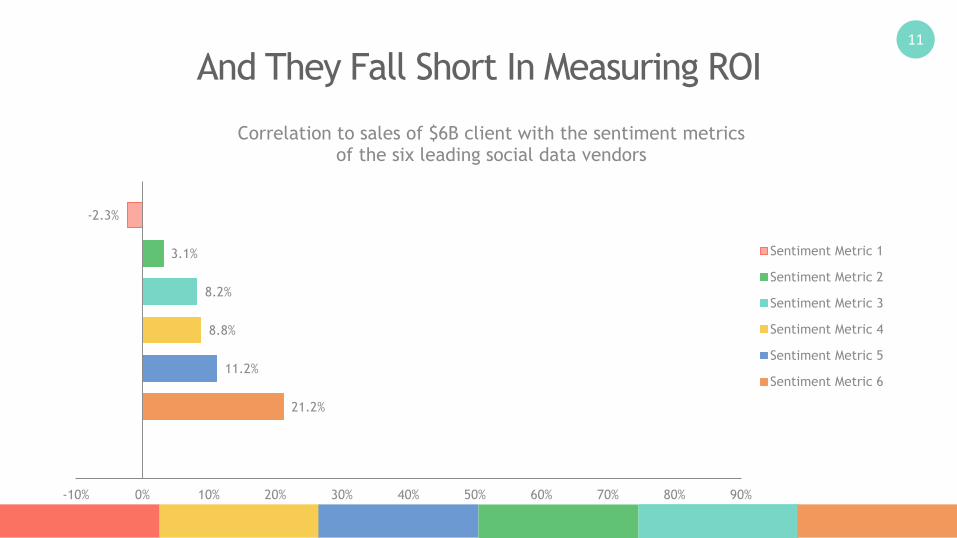
And They Fall Short In Measuring ROI
21.2%
11.2%
8.8%
8.2%
3.1%
-2.3%
-10% 0% 10% 20% 30% 40% 50% 60% 70% 80% 90%
Correlation to sales of $6B client with the sentiment metrics of the six leading social data vendors
Sentiment Metric 1
Sentiment Metric 2
Sentiment Metric 3
Sentiment Metric 4
Sentiment Metric 5
Sentiment Metric 6
SEI Pos/Neg Ratio
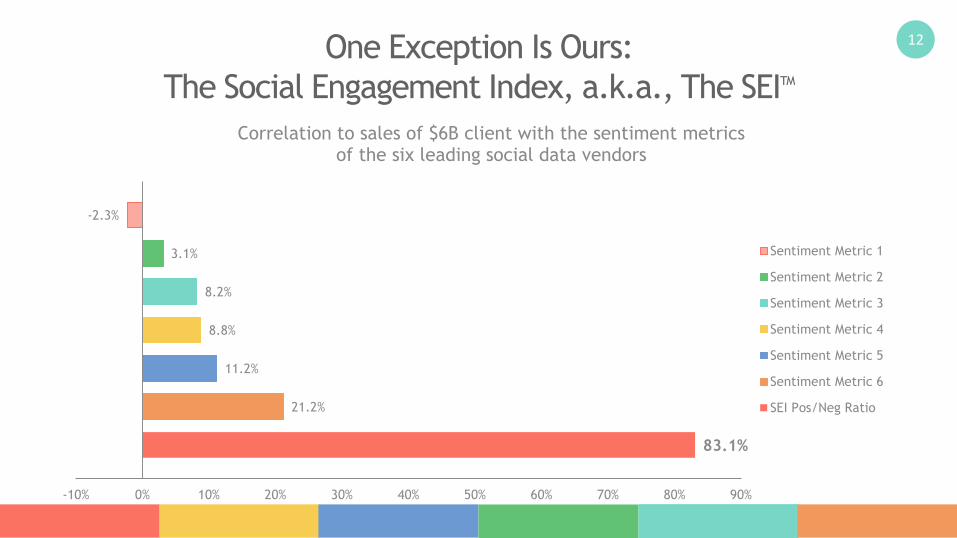
12One Exception Is Ours:
The Social Engagement Index, a.k.a., The SEITM
83.1%
21.2%
11.2%
8.8%
8.2%
3.1%
-2.3%
-10% 0% 10% 20% 30% 40% 50% 60% 70% 80% 90%
Correlation to sales of $6B client with the sentiment metrics of the six leading social data vendors
Sentiment Metric 1
Sentiment Metric 2
Sentiment Metric 3
Sentiment Metric 4
Sentiment Metric 5
Sentiment Metric 6
SEI Pos/Neg Ratio
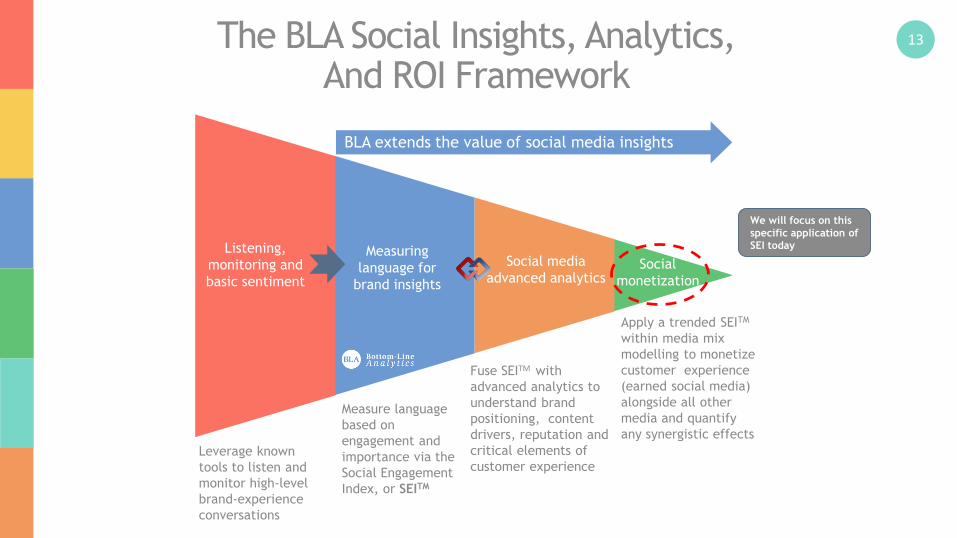
13The BLA Social Insights, Analytics, And ROI Framework
Fuse SEITM with
advanced analytics to
understand brand
positioning, content
drivers, reputation and
critical elements of
customer experienceLeverage known
tools to listen and
monitor high-level
brand-experience
conversations
Measure language
based on
engagement and
importance via the
Social Engagement
Index, or SEITM
Listening,
monitoring and
basic sentiment
Measuring
language for
brand insights
Social media
advanced analyticsSocial
monetization
Apply a trended SEITM
within media mix
modelling to monetize
customer experience
(earned social media)
alongside all other
media and quantify
any synergistic effects
BLA extends the value of social media insights
We will focus on this
specific application of
SEI today
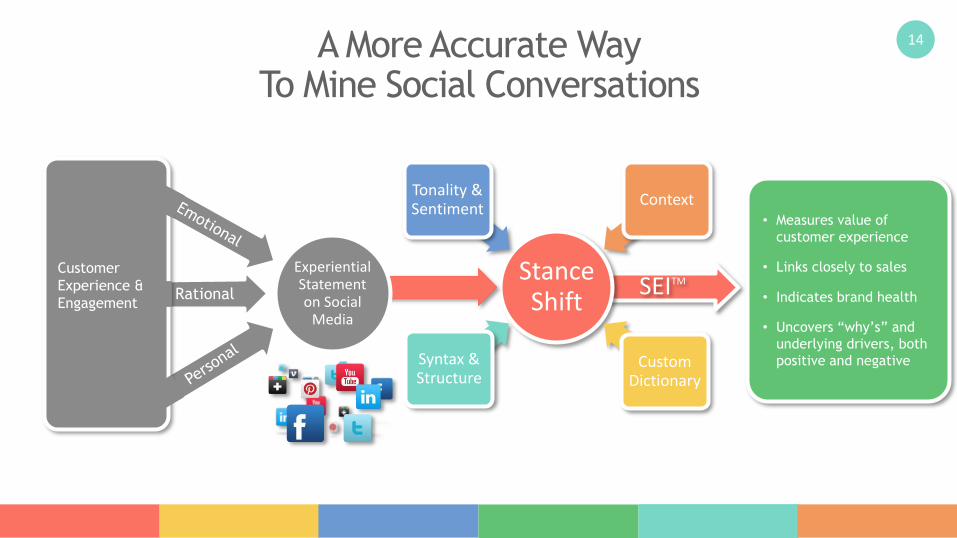
14
SEITMStance Shift
Syntax & Structure
Tonality & Sentiment
Context
Custom Dictionary
A More Accurate Way To Mine Social Conversations
• Measures value of
customer experience
• Links closely to sales
• Indicates brand health
• Uncovers “why’s” and
underlying drivers, both
positive and negative
Experiential Statement on Social
Media
Ex
Rx
Pr
Customer
Experience &
EngagementRational
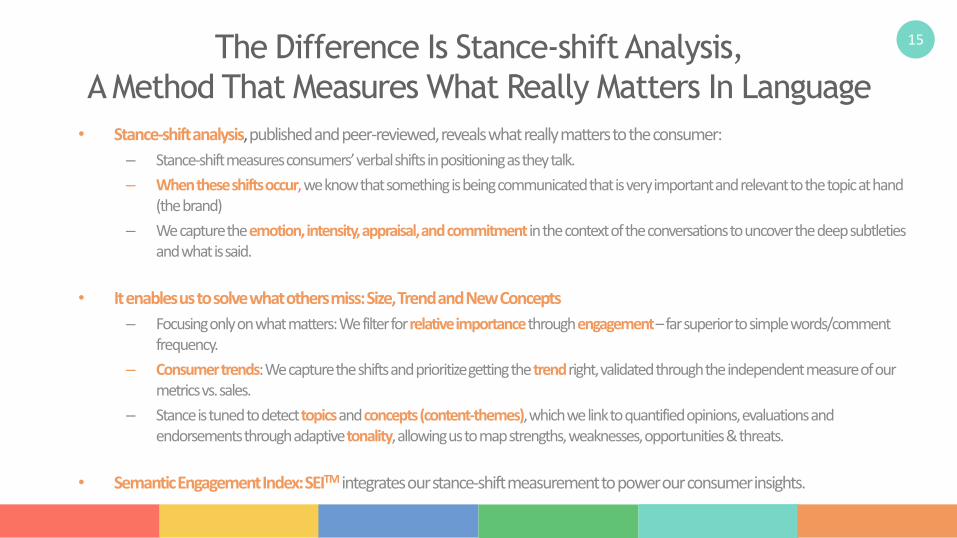
15The Difference Is Stance-shift Analysis,
A Method That Measures What Really Matters In Language
• Stance-shift analysis, published and peer-reviewed, reveals what really matters to the consumer:
– Stance-shift measures consumers’ verbal shifts in positioning as they talk.
– When these shifts occur, we know that something is being communicated that is very important and relevant to the topic at hand (the brand)
– We capture the emotion, intensity, appraisal, and commitment in the context of the conversations to uncover the deep subtleties and what is said.
• It enables us to solve what others miss: Size, Trend and New Concepts
– Focusing only on what matters: We filter for relative importance through engagement–far superior to simple words/comment frequency.
– Consumertrends: We capture the shifts and prioritize getting the trendright, validated through the independent measure of our metrics vs. sales.
– Stance is tuned to detect topicsand concepts (content-themes), which we link to quantified opinions, evaluations and endorsements through adaptive tonality, allowing us to map strengths, weaknesses, opportunities & threats.
• Semantic Engagement Index: SEITM integrates our stance-shift measurement to power our consumer insights.
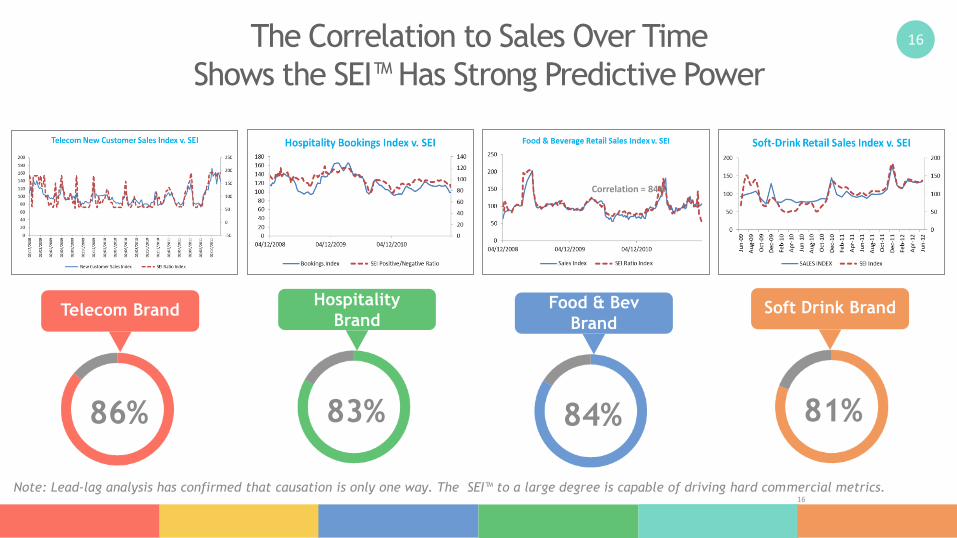
16The Correlation to Sales Over Time
Shows the SEI™ Has Strong Predictive Power
16
Correlation = 84%
Note: Lead-lag analysis has confirmed that causation is only one way. The SEI™ to a large degree is capable of driving hard commercial metrics.
86%
Telecom Brand
81%
Soft Drink Brand
84%
Food & Bev
Brand
83%
Hospitality
Brand
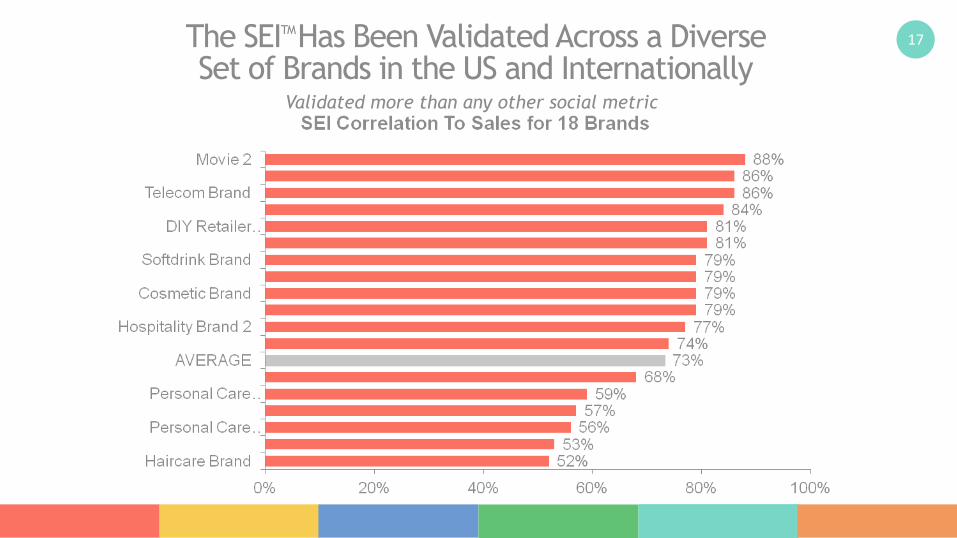
17The SEITM Has Been Validated Across a Diverse Set of Brands in the US and Internationally
Validated more than any other social metric
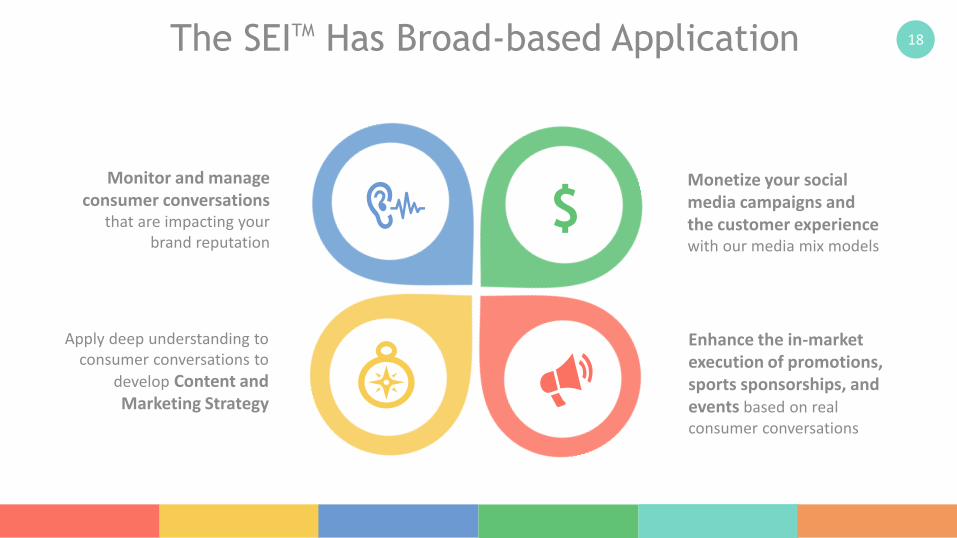
18The SEITM Has Broad-based Application
$Monitor and manage
consumer conversationsthat are impacting your
brand reputation
Apply deep understanding to consumer conversations to
develop Content and Marketing Strategy
Enhance the in-market execution of promotions, sports sponsorships, and events based on real consumer conversations
Monetize your social media campaigns andthe customer experience with our media mix models
19
Case 1: Defining the Coffee
Retailer Brand Experience
20
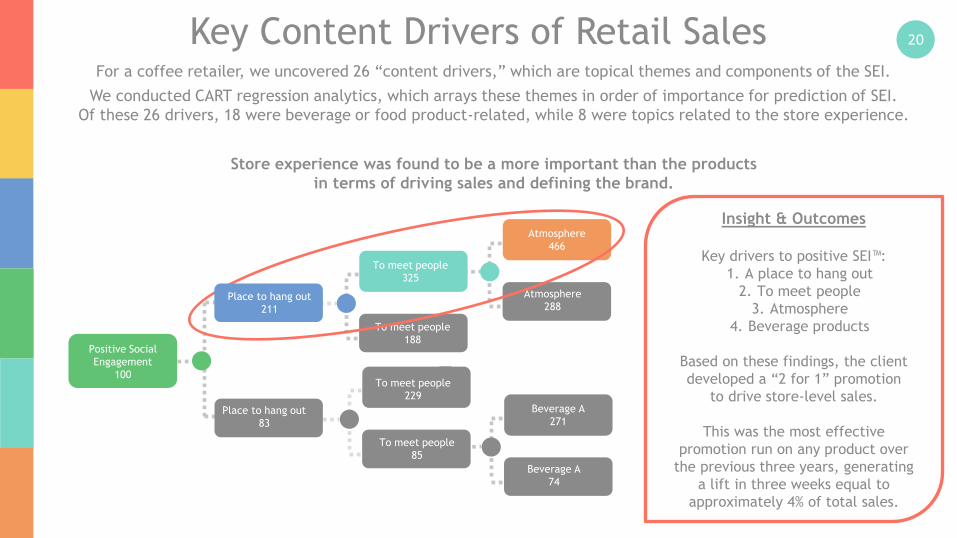
For a coffee retailer, we uncovered 26 “content drivers,” which are topical themes and components of the SEI.
We conducted CART regression analytics, which arrays these themes in order of importance for prediction of SEI.
Of these 26 drivers, 18 were beverage or food product-related, while 8 were topics related to the store experience.
Store experience was found to be a more important than the products
in terms of driving sales and defining the brand.
Key Content Drivers of Retail Sales
To meet people
188
Atmosphere
288
Atmosphere
466
Note: Separate analysis - Classification & Regression Trees (CART)
Positive Social
Engagement
100To meet people
229
Place to hang out
83
Beverage A
271
Beverage A
74
To meet people
85
To meet people
325
Insight & Outcomes
Key drivers to positive SEI™:
1. A place to hang out
2. To meet people
3. Atmosphere
4. Beverage products
Based on these findings, the client
developed a “2 for 1” promotion
to drive store-level sales.
This was the most effective
promotion run on any product over
the previous three years, generating
a lift in three weeks equal to
approximately 4% of total sales.
Place to hang out
211
21
Case 2: The most important
customer experience drivers
for a hard goods retailer
22
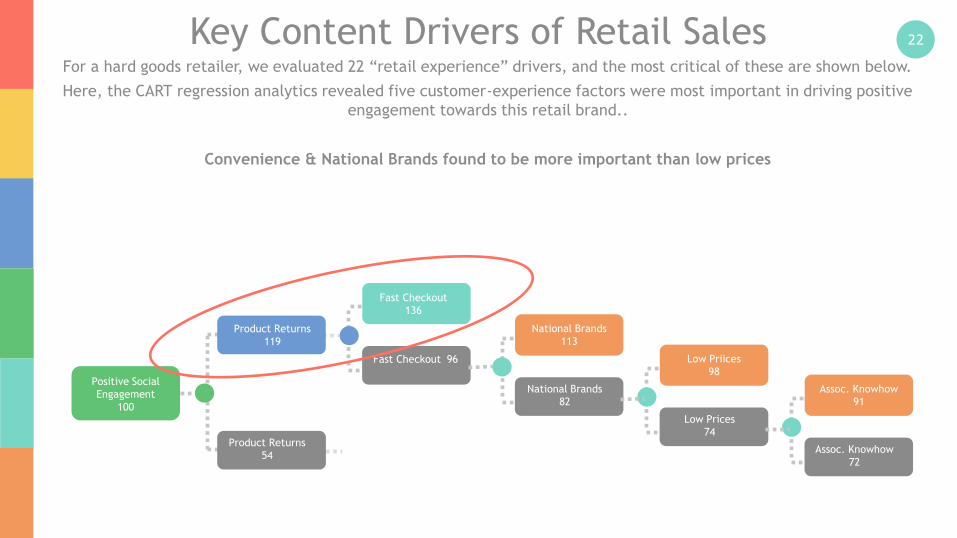
For a hard goods retailer, we evaluated 22 “retail experience” drivers, and the most critical of these are shown below.
Here, the CART regression analytics revealed five customer-experience factors were most important in driving positive
engagement towards this retail brand..
Convenience & National Brands found to be more important than low prices
Key Content Drivers of Retail Sales
Fast Checkout 96
National Brands
82
National Brands
113
Note: Separate analysis - Classification & Regression Trees (CART)
Positive Social
Engagement
100
Product Returns
54
Fast Checkout
136
Product Returns
119
Low Prices
74
Low Priices
98
Assoc. Knowhow
72
Assoc. Knowhow
91
23
Case 3: Finding the right
positioning for a new instant
beverage brand
24
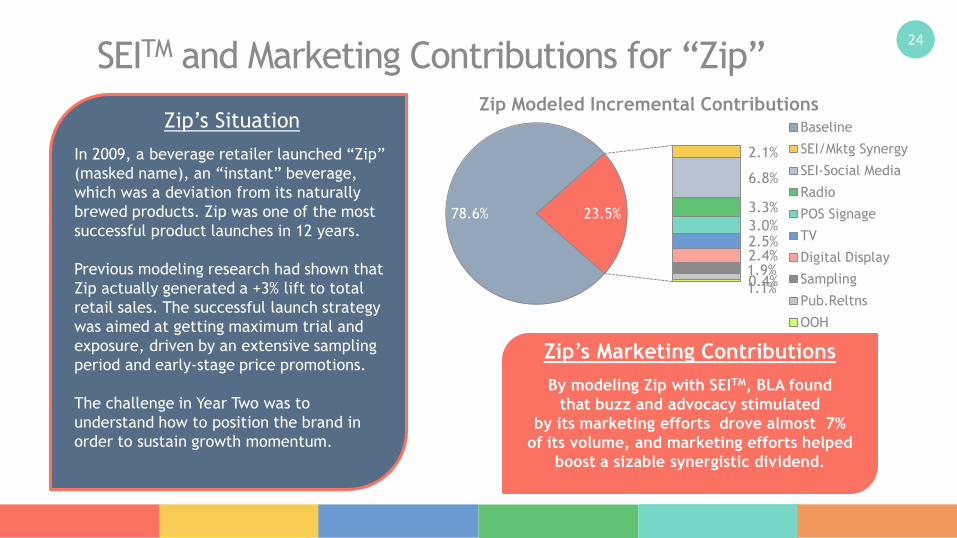
SEITM and Marketing Contributions for “Zip”
78.6%
2.1%
6.8%
3.3%
3.0%2.5%2.4%1.9%
1.1%0.4%
23.5%
Zip Modeled Incremental ContributionsBaseline
SEI/Mktg Synergy
SEI-Social Media
Radio
POS Signage
TV
Digital Display
Sampling
Pub.Reltns
OOH
Zip’s Marketing Contributions
By modeling Zip with SEITM, BLA found
that buzz and advocacy stimulated
by its marketing efforts drove almost 7%
of its volume, and marketing efforts helped
boost a sizable synergistic dividend.
Zip’s Situation
In 2009, a beverage retailer launched “Zip”
(masked name), an “instant” beverage,
which was a deviation from its naturally
brewed products. Zip was one of the most
successful product launches in 12 years.
Previous modeling research had shown that
Zip actually generated a +3% lift to total
retail sales. The successful launch strategy
was aimed at getting maximum trial and
exposure, driven by an extensive sampling
period and early-stage price promotions.
The challenge in Year Two was to
understand how to position the brand in
order to sustain growth momentum.
25
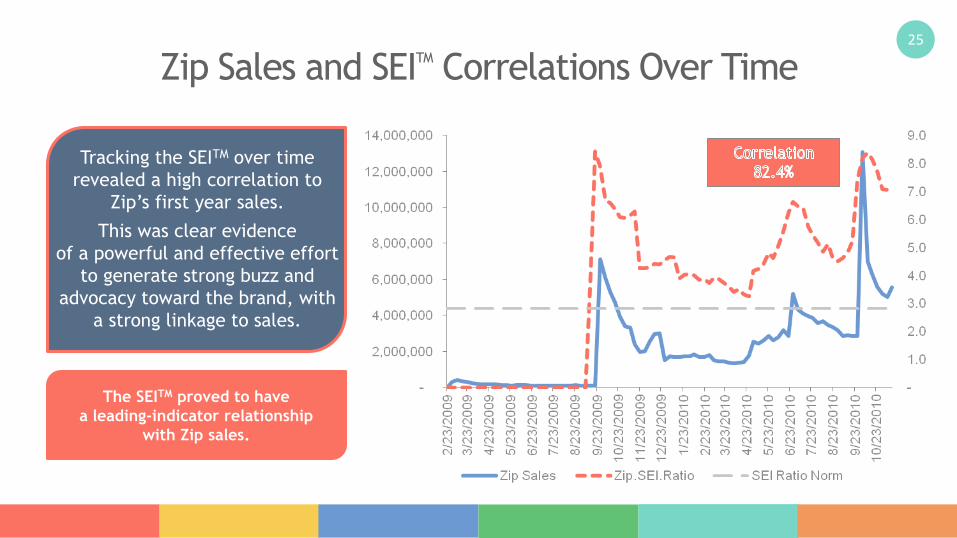
Zip Sales and SEITM Correlations Over Time
Tracking the SEITM over time
revealed a high correlation to
Zip’s first year sales.
This was clear evidence
of a powerful and effective effort
to generate strong buzz and
advocacy toward the brand, with
a strong linkage to sales.
Note: Plotted metric is ratio of Positive to Negative SEITM
The SEITM proved to have
a leading-indicator relationship
with Zip sales.
26
188
3,516
103 128300
301350
491
724
930
-
500
1,000
1,500
2,000
2,500
3,000
3,500
4,000
Base
line N
et
Posi
tive
SEI
Gre
at
Aro
ma
Yum
my F
lavors
Gre
at
Gif
t Id
ea
Convenie
nt
Tast
es
Gre
at
Cold
or
Hot
Tast
es
Gre
at
Gre
at
for
Takin
g t
o t
he
Off
ice
Tast
es
Lik
e t
he R
eal
ThIn
g
Tota
l N
et
Posi
tive S
EI
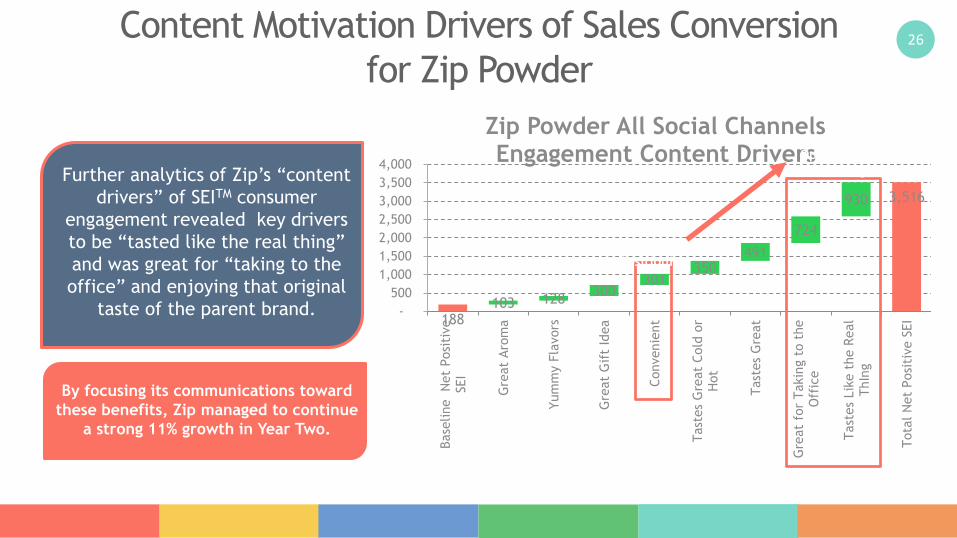
Zip Powder All Social Channels Engagement Content Drivers
Content Motivation Drivers of Sales Conversion
for Zip Powder
Further analytics of Zip’s “content
drivers” of SEITM consumer
engagement revealed key drivers
to be “tasted like the real thing”
and was great for “taking to the
office” and enjoying that original
taste of the parent brand.
Current
Positioning
Optimized
Positioning
By focusing its communications toward
these benefits, Zip managed to continue
a strong 11% growth in Year Two.
27
Case 4: Scoring and Evaluating
Sports Sponsorships
28
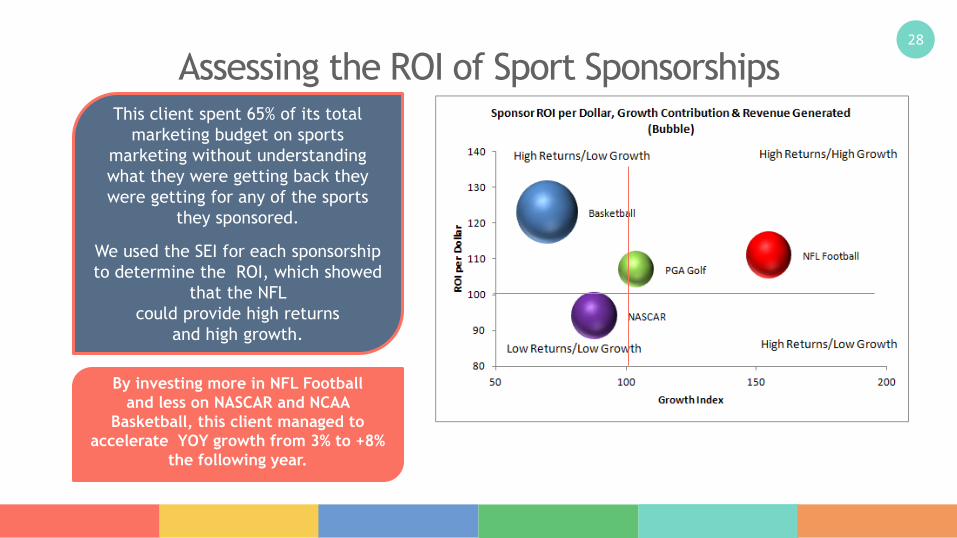
Assessing the ROI of Sport SponsorshipsThis client spent 65% of its total
marketing budget on sports
marketing without understanding
what they were getting back they
were getting for any of the sports
they sponsored.
We used the SEI for each sponsorship
to determine the ROI, which showed
that the NFL
could provide high returns
and high growth.
By investing more in NFL Football
and less on NASCAR and NCAA
Basketball, this client managed to
accelerate YOY growth from 3% to +8%
the following year.

29
Bangalore, IN Office:No. 141, 2nd Cross, 2nd Main,Domlur, 2nd Stage, Bangalore 560071Phone: +91 80 40917572, +91 80 [email protected]
Contact Us US Office:
Suite 100, 1780 Chadds Lake Dr, NE
Marietta, Georgia, 30068-1608
Atlanta, USA