Embed Size (px)
Citation preview

Marc Smith
Charting Collections of Connections in Social Media
EMERGENCE Speaker 9 of 17
Followed by
Original Swimming Party
@marc_smith

A project from the Social Media Research Foundation: http://www.smrfoundation.org

Speaker 1 of 15
Followed by
Name Surname
About Me Marc A. Smith Chief Social Scientist / Director Social Media Research Foundation [email protected] http://www.smrfoundation.org http://www.codeplex.com/nodexl http://www.twitter.com/marc_smith http://www.linkedin.com/in/marcasmith http://www.slideshare.net/Marc_A_Smith http://www.flickr.com/photos/marc_smith http://www.facebook.com/marc.smith.sociologist
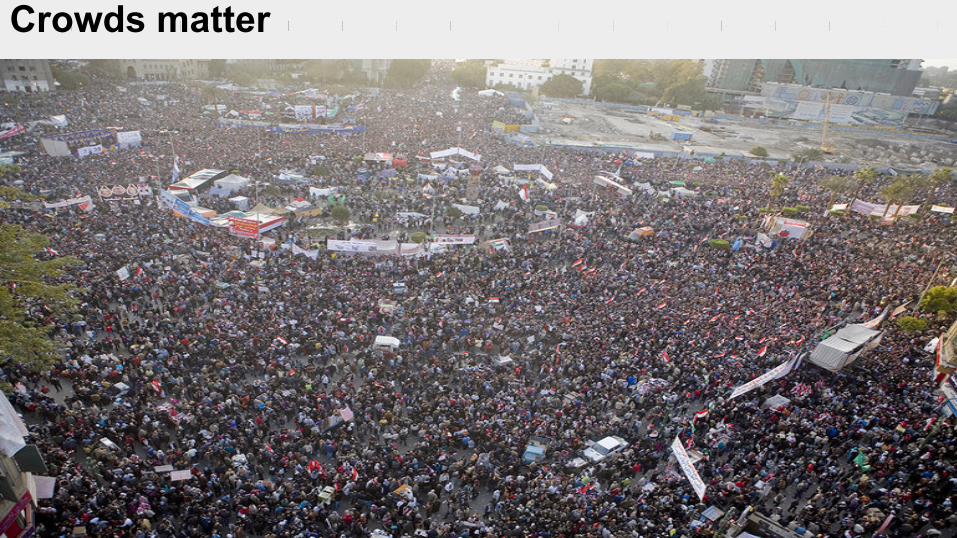
Crowds matter
http://www.flickr.com/photos/amycgx/3119640267/
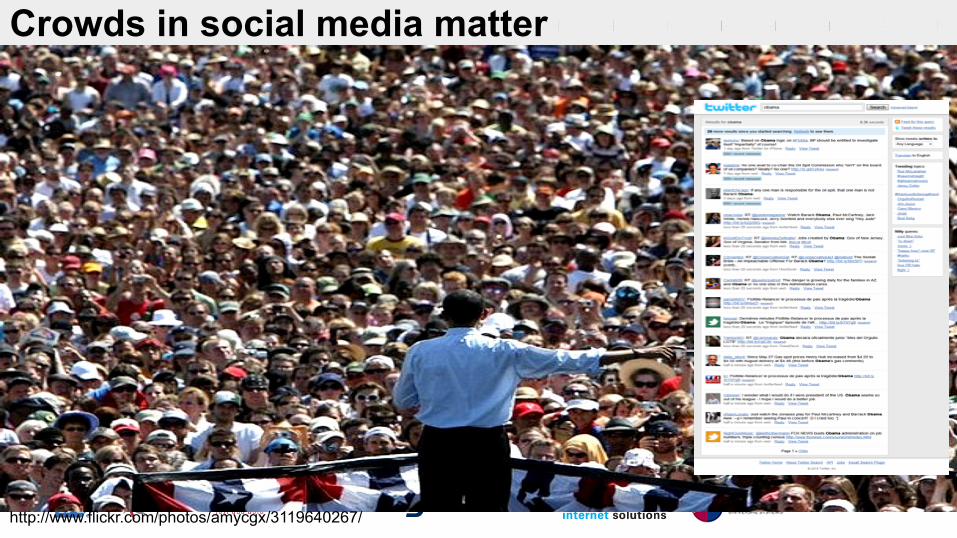
Crowds in social media matter
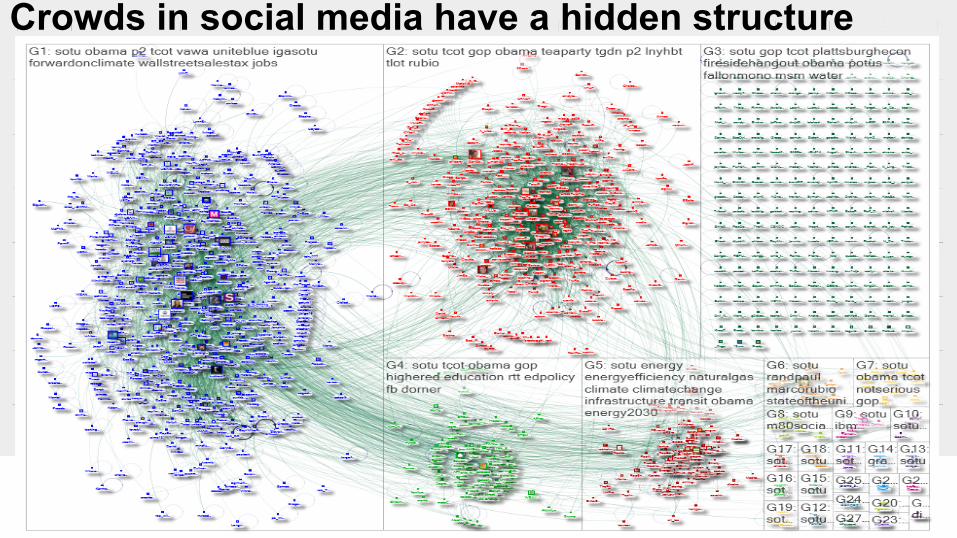
Crowds in social media have a hidden structure

7
8
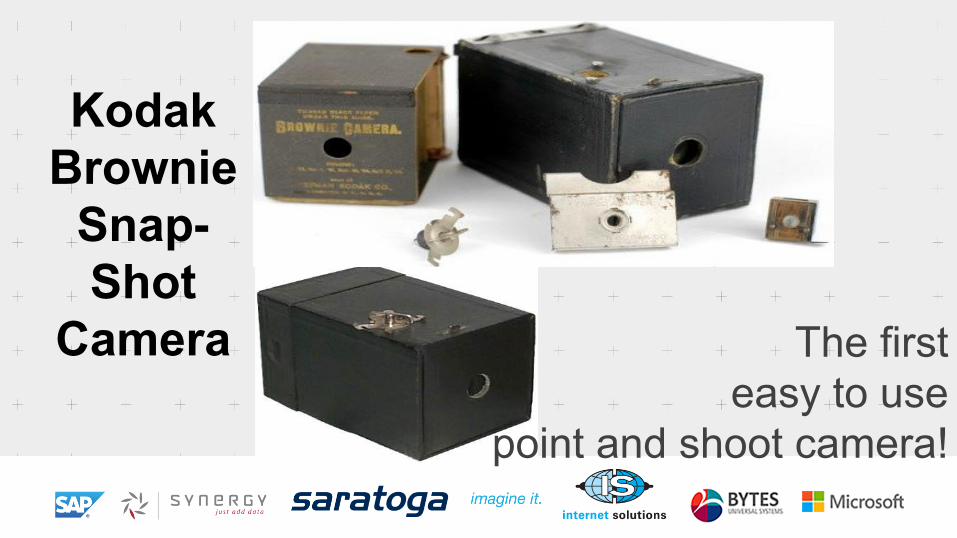
The first easy to use
point and shoot camera!
Kodak Brownie
Snap- Shot
Camera

We envision hundreds of NodeXL data collectors around the world collectively generating a free and open archive of social media network
snapshots on a wide range of topics.
http://msnbcmedia.msn.com/i/msnbc/Components/Photos/071012/071012_telescope_hmed_3p.jpg

World Wide Web
Social media must contain one or more
social networks
Crowds in social media form networks

Social Media (email, Facebook, Twitter, YouTube, and more) is all about connections
from people to people.
12

There are many kinds of ties….
http://www.flickr.com/photos/stevendepolo/3254238329
Send, Mention, Like, Link, Reply, Rate, Review, Favorite, Friend, Follow, Forward, Edit, Tag, Comment, Check-in…

Patterns are left behind
14

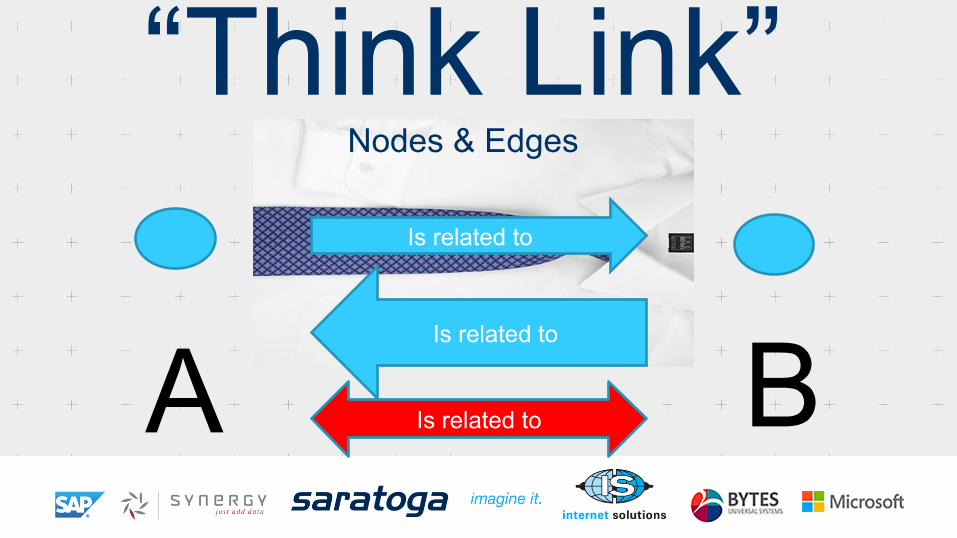
“Think Link” Nodes & Edges
Is related to
A B
Is related to
Is related to
“Think Link” Nodes & Edges
A B
Is related to
Is related to
Is related to
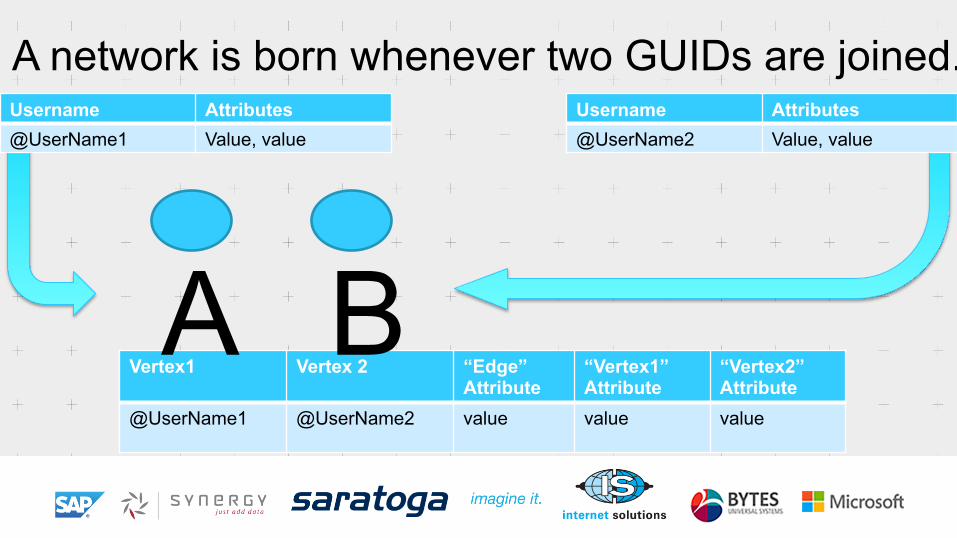
Vertex1 Vertex 2 “Edge” Attribute
“Vertex1” Attribute
“Vertex2” Attribute
@UserName1 @UserName2 value value value
A network is born whenever two GUIDs are joined. Username Attributes @UserName1 Value, value
Username Attributes @UserName2 Value, value
A B

NodeXL imports “edges” from many social media data sources
Social media network analysis
• Social media is inherently made of networks,
– which are created when people link and reply.
• Collections of connections have an emergent shape,
– Some shapes are better than others.
• Some people are located in strategic locations in these shapes,
– Centrally located people are more influential than others.
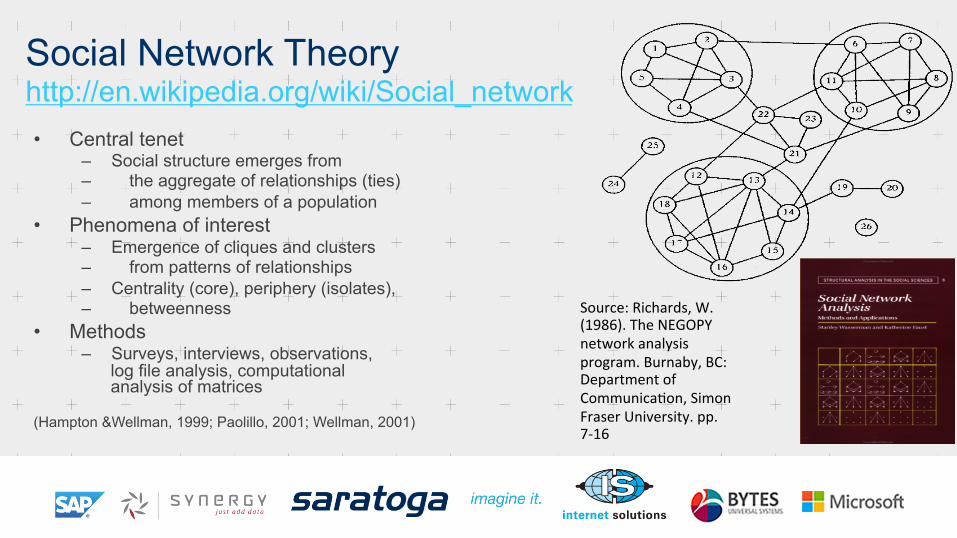
• Central tenet – Social structure emerges from – the aggregate of relationships (ties) – among members of a population
• Phenomena of interest – Emergence of cliques and clusters – from patterns of relationships – Centrality (core), periphery (isolates), – betweenness
• Methods – Surveys, interviews, observations,
log file analysis, computational analysis of matrices
(Hampton &Wellman, 1999; Paolillo, 2001; Wellman, 2001)
Source: Richards, W. (1986). The NEGOPY network analysis program. Burnaby, BC: Department of CommunicaNon, Simon Fraser University. pp.7-‐16
Social Network Theory http://en.wikipedia.org/wiki/Social_network

• Node – “actor” on which relaNonships act; 1-‐mode versus 2-‐mode networks
• Edge – RelaNonship connecNng nodes; can be direcNonal
• Cohesive Sub-‐Group – Well-‐connected group; clique; cluster
• Key Metrics – Centrality (group or individual measure)
• Number of direct connecNons that individuals have with others in the group (usually look at incoming connecNons only)
• Measure at the individual node or group level – Cohesion (group measure)
• Ease with which a network can connect • Aggregate measure of shortest path between each node pair at network level reflects average distance
– Density (group measure) • Robustness of the network • Number of connecNons that exist in the group out of 100% possible
– Betweenness (individual measure) • # shortest paths between each node pair that a node is on • Measure at the individual node level
• Node roles – Peripheral – below average centrality – Central connector – above average centrality – Broker – above average betweenness
SNA 101
E D
F
A
C B
H
G
I C
D E
A B D E
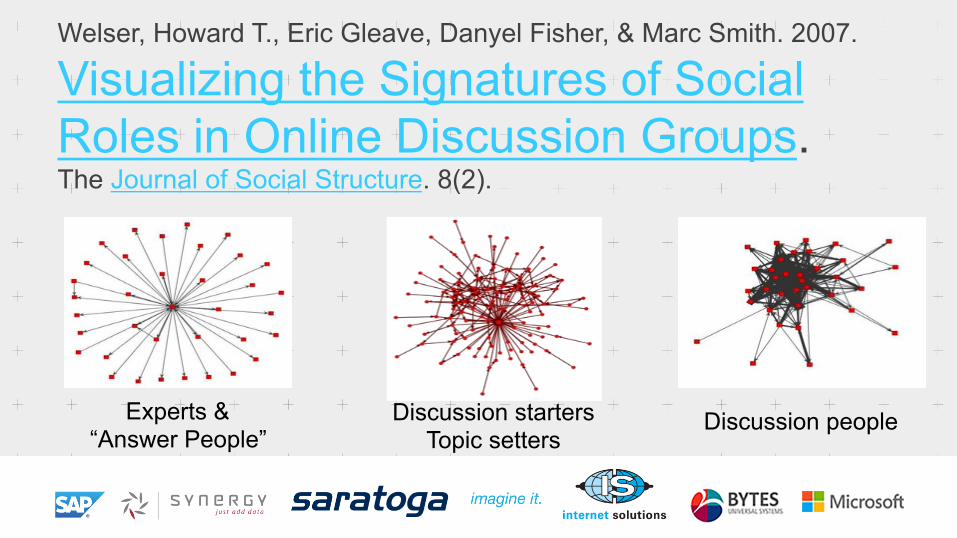
Welser, Howard T., Eric Gleave, Danyel Fisher, & Marc Smith. 2007.
Visualizing the Signatures of Social Roles in Online Discussion Groups. The Journal of Social Structure. 8(2).
Experts & “Answer People”
Discussion starters Topic setters
Discussion people

Mapping MammothBI in Twitter
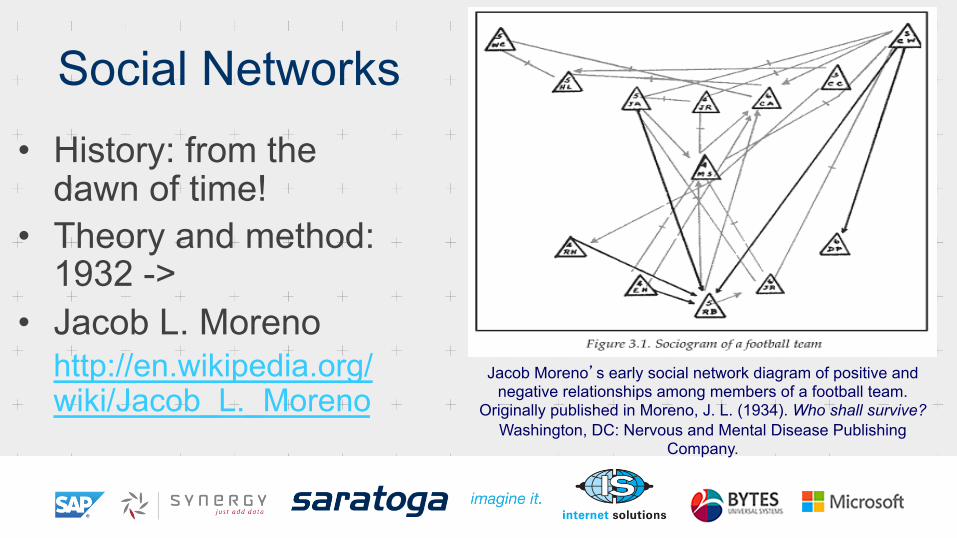
Social Networks • History: from the
dawn of time! • Theory and method:
1932 -> • Jacob L. Moreno
http://en.wikipedia.org/wiki/Jacob_L._Moreno
Jacob Moreno’s early social network diagram of positive and negative relationships among members of a football team.
Originally published in Moreno, J. L. (1934). Who shall survive? Washington, DC: Nervous and Mental Disease Publishing
Company.

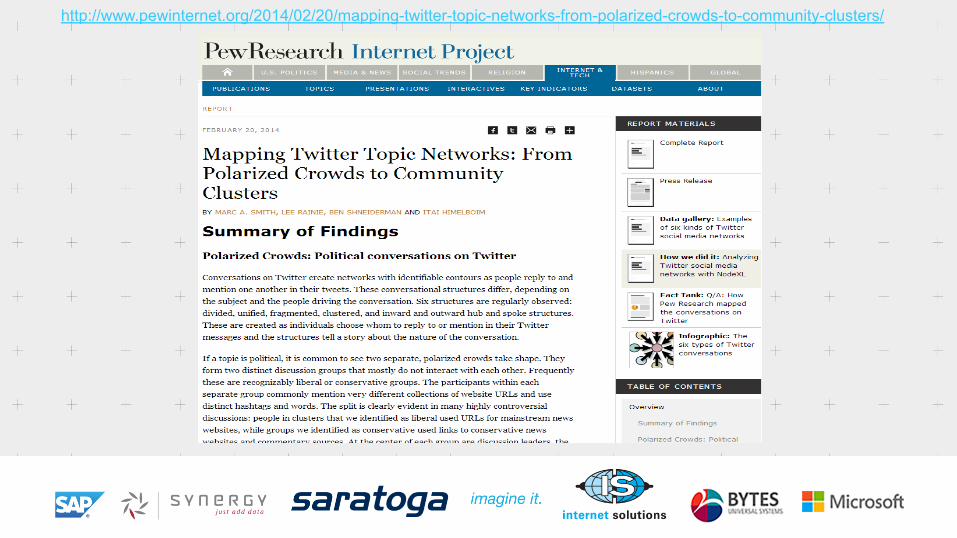
http://www.pewinternet.org/2014/02/20/mapping-twitter-topic-networks-from-polarized-crowds-to-community-clusters/

[Divided] Polarized Crowds
[Unified] Tight Crowd
[Fragmented] Brand Clusters
[Clustered] Community Clusters
[In-Hub & Spoke] Broadcast Network
[Out-Hub & Spoke] Support Network
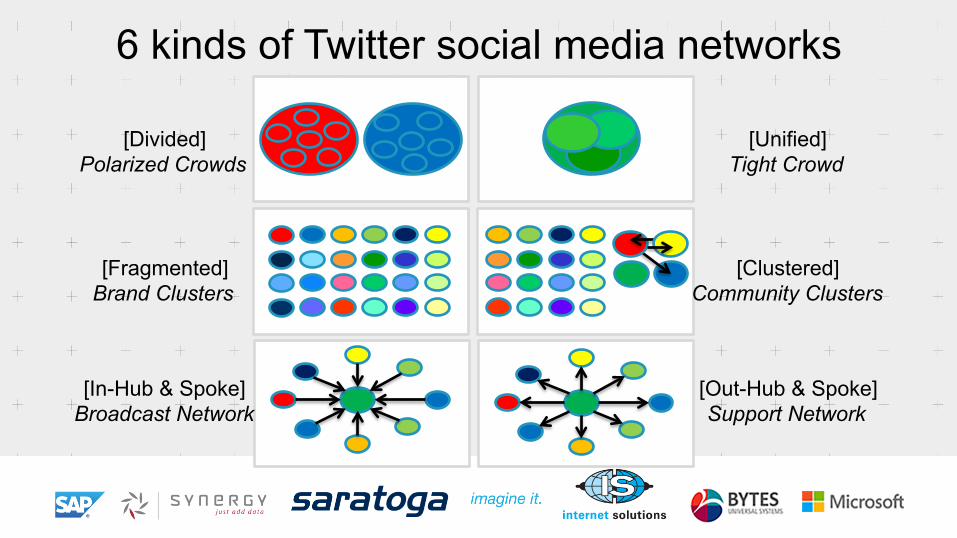
6 kinds of Twitter social media networks

[Divided] Polarized Crowds
[Unified] Tight Crowd
[Fragmented] Brand Clusters
[Clustered] Community Clusters
[In-Hub & Spoke] Broadcast Network
[Out-Hub & Spoke] Support Network
6 kinds of Twitter social media networks

http://www.pewresearch.org/fact-tank/2014/02/20/the-six-types-of-twitter-conversations/
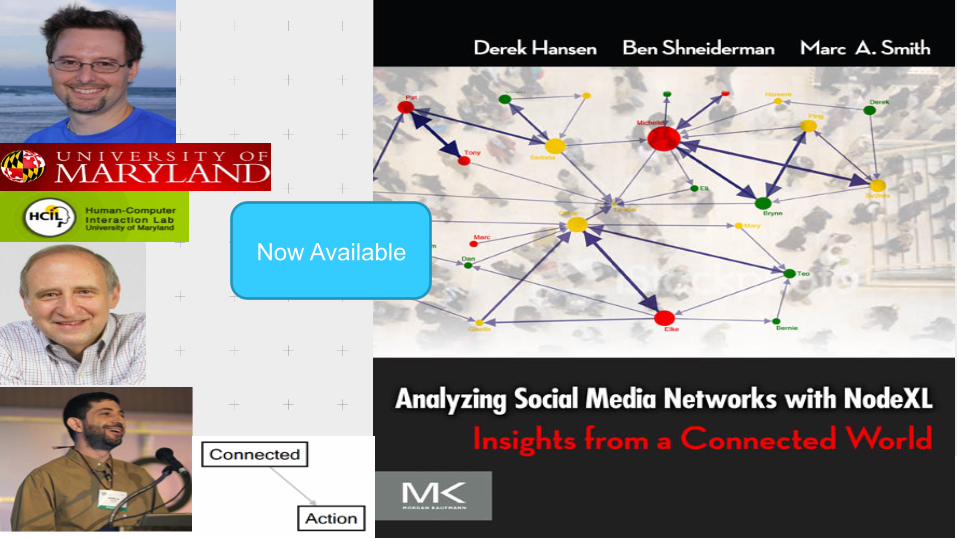
Now Available

Communities in Cyberspace

Social Network Maps Reveal
Key influencers in any topic.
Sub-groups.
Bridges.

Hubs
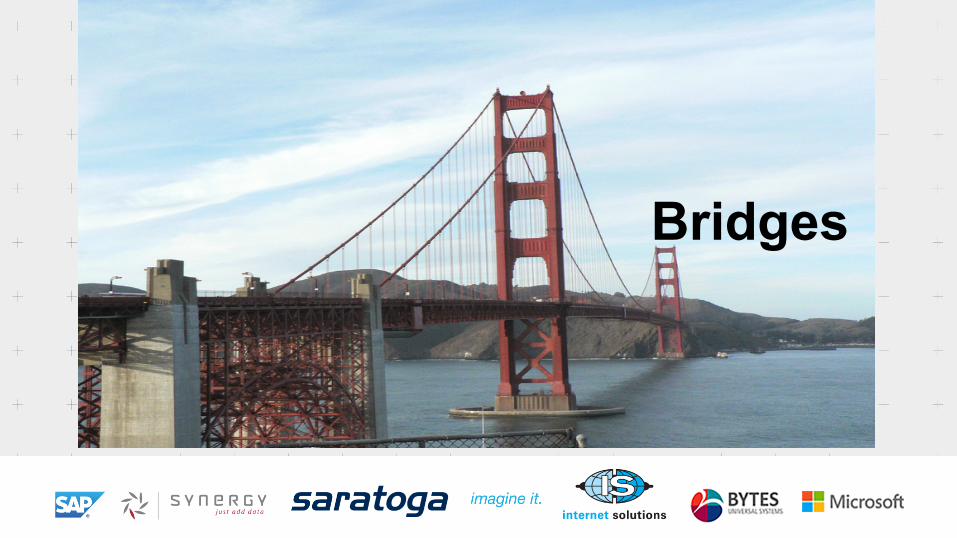
Bridges
http://www.flickr.com/photos/storm-crypt/3047698741

SNA questions for social media:
1. What does my topic network look like? 2. What does the topic I aspire to be look like? 3. What is the difference between #1 and #2? 4. How does my map change as I intervene?
What does #YourHashtag look like?
Who is the mayor of #YourHashtag?
[Divided] Polarized Crowds
[Unified] Tight Crowd
[Fragmented] Brand Clusters
[Clustered] Community Clusters
[In-Hub & Spoke] Broadcast Network
[Out-Hub & Spoke] Support Network
6 kinds of Twitter social media networks

Your social media audience is smaller…
…than the audiences of ten influential
voices.

The “mayor” of your hashtag
• Some people are at the center of the conversation
• “Centrality” is about being in the middle of the discussion – Not “Followers” – Not “Tweets” – Not “RTs” – Not “Mentions”
• The “mayor” has an audience that may be bigger than yours.

Build a collection of mayors
• Map multiple topics – Your brand and company names – Your competitor brands and company names – The names of the activities or locations related to your products
• Identify the top people in each topic • Follow these people
– 30-50% of the time they follow you back • Re-tweet these people (if they did not follow you)
• 30-50% of the time they follow you back
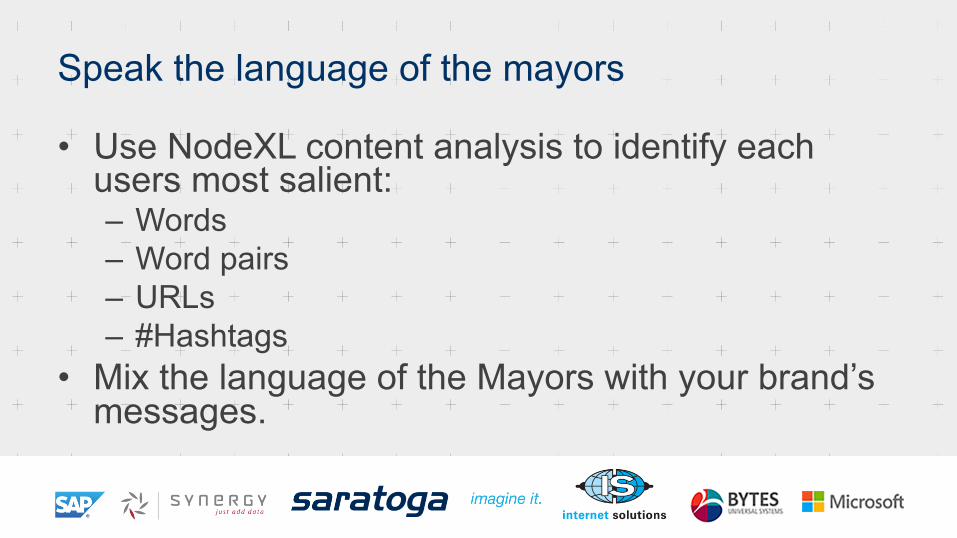
Speak the language of the mayors
• Use NodeXL content analysis to identify each users most salient: – Words – Word pairs – URLs – #Hashtags
• Mix the language of the Mayors with your brand’s messages.
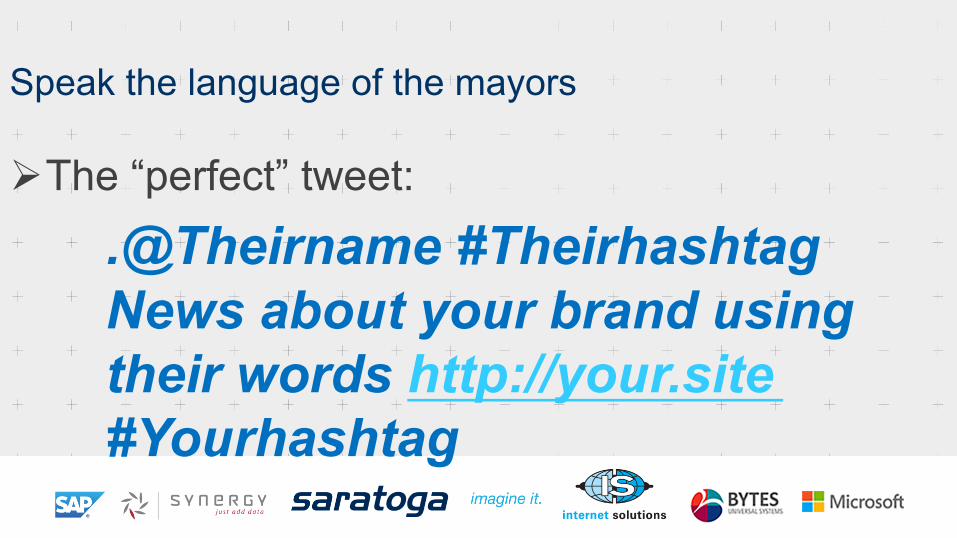
Speak the language of the mayors
Ø The “perfect” tweet:
.@Theirname #Theirhashtag News about your brand using their words http://your.site #Yourhashtag

Speak the language of the mayors
Some shapes are better than others: • The value of Broadcast versus community
network!
• From community to brand!
• Support and why community can be a signal of failure!

Three network phases of social media success
Phase 1: You get an audience Phase 2: Your audience gets an
audience Phase 3: Audience becomes
community
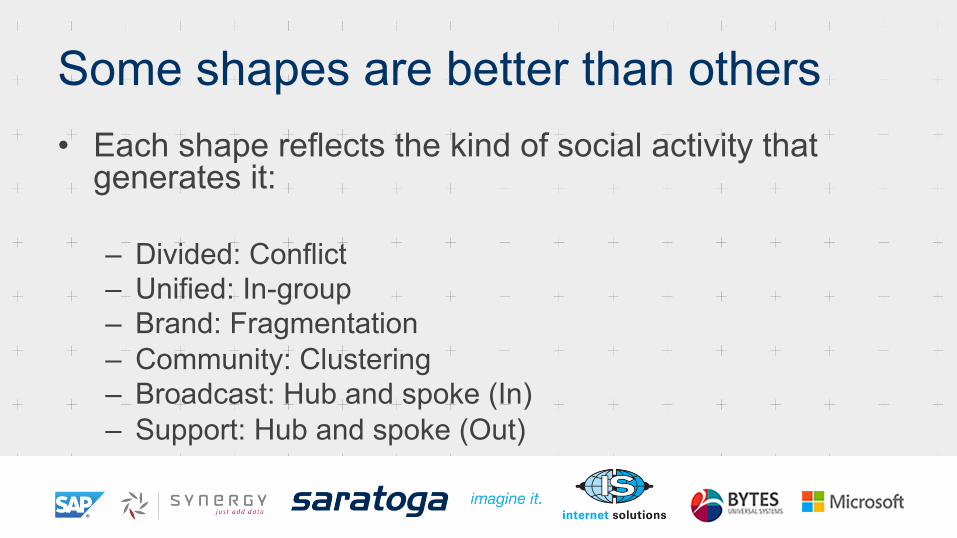
Some shapes are better than others • Each shape reflects the kind of social activity that
generates it:
– Divided: Conflict – Unified: In-group – Brand: Fragmentation – Community: Clustering – Broadcast: Hub and spoke (In) – Support: Hub and spoke (Out)
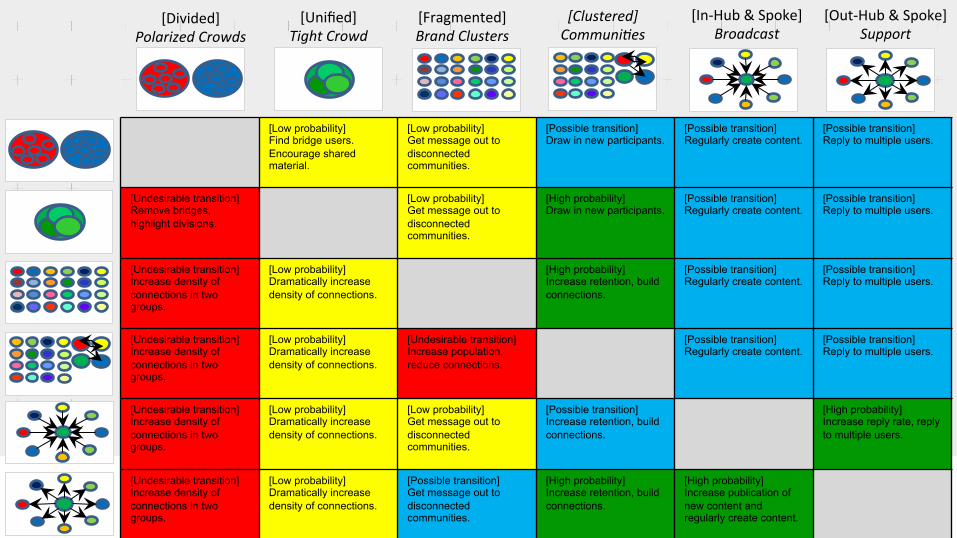
[Divided] Polarized Crowds
[Unified] Tight Crowd
[Fragmented]Brand Clusters
[Clustered] Communi8es
[In-‐Hub & Spoke] Broadcast
[Out-‐Hub & Spoke] Support
[Low probability] Find bridge users. Encourage shared material.
[Low probability] Get message out to disconnected communities.
[Possible transition] Draw in new participants.
[Possible transition] Regularly create content.
[Possible transition] Reply to multiple users.
[Undesirable transition] Remove bridges, highlight divisions.
[Low probability] Get message out to disconnected communities.
[High probability] Draw in new participants.
[Possible transition] Regularly create content.
[Possible transition] Reply to multiple users.
[Undesirable transition] Increase density of connections in two groups.
[Low probability] Dramatically increase density of connections.
[High probability] Increase retention, build connections.
[Possible transition] Regularly create content.
[Possible transition] Reply to multiple users.
[Undesirable transition] Increase density of connections in two groups.
[Low probability] Dramatically increase density of connections.
[Undesirable transition] Increase population, reduce connections.
[Possible transition] Regularly create content.
[Possible transition] Reply to multiple users.
[Undesirable transition] Increase density of connections in two groups.
[Low probability] Dramatically increase density of connections.
[Low probability] Get message out to disconnected communities.
[Possible transition] Increase retention, build connections.
[High probability] Increase reply rate, reply to multiple users.
[Undesirable transition] Increase density of connections in two groups.
[Low probability] Dramatically increase density of connections.
[Possible transition] Get message out to disconnected communities.
[High probability] Increase retention, build connections.
[High probability] Increase publication of new content and regularly create content.
Request your own network map and report
http://connectedaction.net
Monitor your topics with social network maps
• Identify the – Key people – Groups – Top topics
• Locate your social media accounts within the network

How you can help
• Sponsor a feature • Sponsor workshops • Sponsor a student • Schedule training • Sponsor the foundation • Donate your money, code, computation, storage, bandwidth,
data or employee’s time • Help promote the work of the Social Media Research
Foundation