Embed Size (px)
Citation preview
Foreseeing supply and demand for competence
and education with a regional CGE model
Jouko Kinnunen
Bjarne Lindström
Katarina Fellman
26 August 2015
ERSA, Lissabon
Statistics and Research Åland, ÅSUB
The official statistical authority of the Åland Islands
Research institute serving local and other customers
Personnel 10.5 man-years
Annual gross income 0.8 € m.

About the study
• On behalf of the Åland Government (department of
education)
• Meant to be used as a decision support for the
educational planning in the Åland Islands
• The current study was preceeded by an earlier one in
2006 (Palmer and Kinnunen; ÅSUB Report 2006:2)
• Analysis is based on a further developed version of the
CGE model for Åland first presented in Kinnunen (2005)
Outline of the presentation
• Short presentation of the Åland Islands
• Main results & conclusions
• Characteristics of the CGE model
• Presentation of scenarios
• Presentation of some detailed results
• Introduction to PC-Axis result databases

Åland, self-governed archipelago region
in the middle of the Baltic Sea

Ålands makes business of
the pleasures of others...
• Tax free sales on board of passenger ferries in 2013: 249 MEUR, 8.686 EUR/capita
• Internet and other gaming revenues of publicly owned gaming company (paf.com) 78 MEUR, 2.744
EUR/capita in 2012
• Tourism 85 MEUR, 2 965 EUR/capita in 2013
• GDP of Åland in 2012: 1 140 EUR m. Population in 2014: 28 900
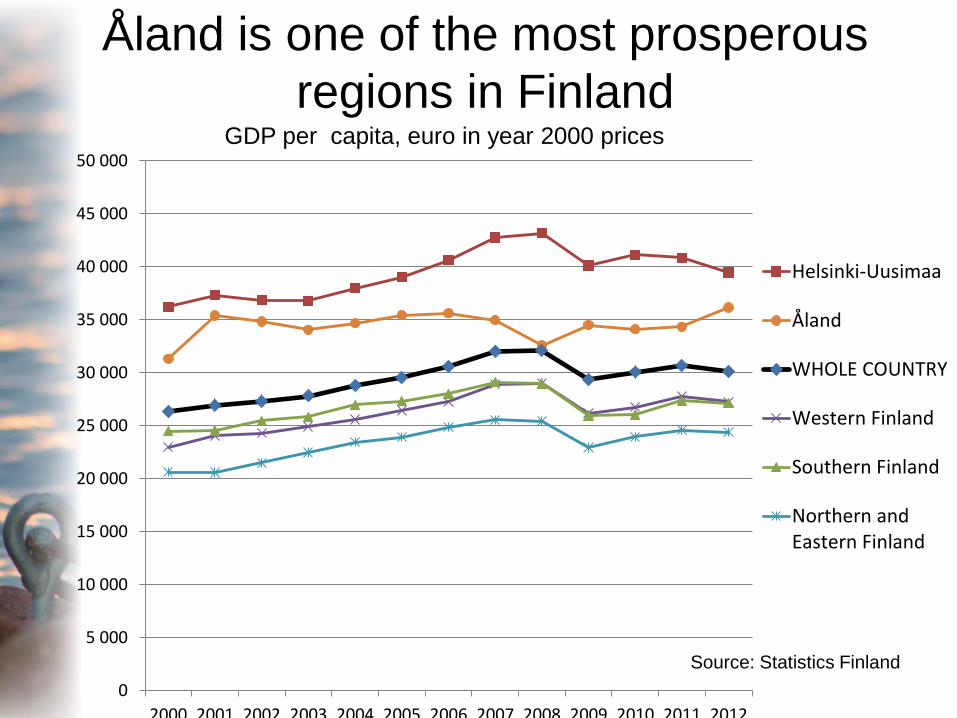
Åland is one of the most prosperous
regions in Finland
Source: Statistics Finland
GDP per capita, euro in year 2000 prices
0
5 000
10 000
15 000
20 000
25 000
30 000
35 000
40 000
45 000
50 000
2000 2001 2002 2003 2004 2005 2006 2007 2008 2009 2010 2011 2012
Helsinki-Uusimaa
Åland
WHOLE COUNTRY
Western Finland
Southern Finland
Northern andEastern Finland

Population growth 1990 = 100
90
95
100
105
110
115
120
125
130
135
1990 1992 1994 1996 1998 2000 2002 2004 2006 2008 2010 2012 2014
Capital region Uusimaa
Åland Islands
Finland

Åland is responsible for the local
educational policies
• 16 municipalities organize primary
education
• Secondary education: preparatory and
vocational within a single school
• Technical university, tertiary education: – Business Administration
– Electrical Engineering
– Health and Caring Sciences
– Hospitality Management
– Information Technology
– Marine Engineering
– Navigation

Main future trends • Ageing: increasing departures from labour market,
population grows more than labour supply
• Low growth in labour demand in total
• Increasing demand for service personnel (trade,
health care)
• Lower participation rate in the future labour market
• Non-traded sector of economy grows
• Demand for higher-skilled labour (post-secondary
educ.) grows more than that of low-skilled labour
• Female occupations have higher growth in
demand than the traditional male ones
• Men tend to undereducate themselves, the
opposite applies for women
Main conclusions • Education in Åland covers rather well the labour
market needs regarding low-skilled (secondary
level) labour
• Higher nr of graduates will be needed within
non-traded service sector (health care, trade
other services) and within IT services
• Highly skilled labour is mainly imported (incl.
return migrants) – migration very important
• Challenges:
– Flexibility
– Structural adjustment
– Policy coordination

CGE model for Åland
• Based on IFPRI Standard Model
• Recursive dynamics
• Imperfect competition
• Detailed demographics
• Endogenous participation rate
• Philips-curve type wage dynamics
• Endogenous migration
• Public demand driven by population size and
age structure
• Household demand affected by the age
structure as well

Dimensions of the model
• One aggregate hhd (in submodule 8 hhds
with different consumption parameters;
grouped by age of ref.person)
• 2 tourist hhds: Finns, RoW tourists
• Public sector: state, regional gov,
municipalities, social security funds
• 15 industries, 17 commodities
• 11 tax/subsidy accounts
• 2 types of labour: low- and high-skilled

Shall we have a look
into the future?

Three paths to future
• Base scenario: continuation of past developments, with some new
ones:
– Sulphur directive: higher fuel costs for sea transport
– Higher municipal taxes, low increases in transfers from state to
government and from government to municipalities
– Increasing demand for specialist occupations
– Ageing increases private demand for health care services
• Growth: higher external demand for Åland’s exports, higher
productivity growth, higher participation rates among workers 45+,
increasing local competition, higher inmigration flows
• Deceleration: even higher fuel costs than under base, low external
demand, lower productivity growth, lower inmigration, same
participation rates than under base

Population

Net migration
Persons

GDP

Dependency ratio, % (20-64)

Employment
of Ålanders
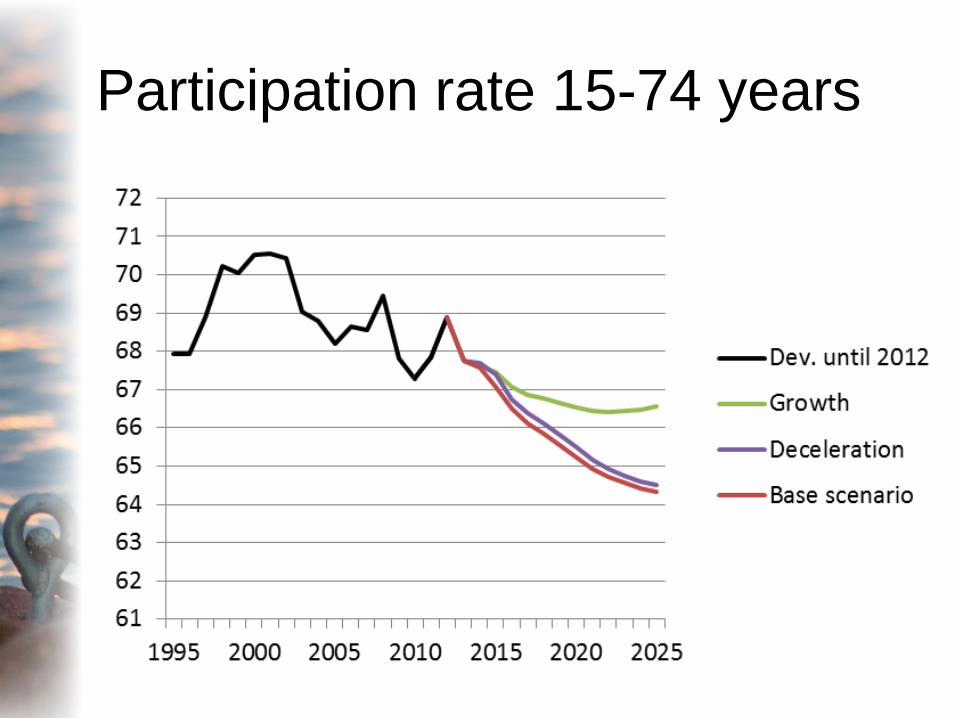
Participation rate 15-74 years

Labour market exits
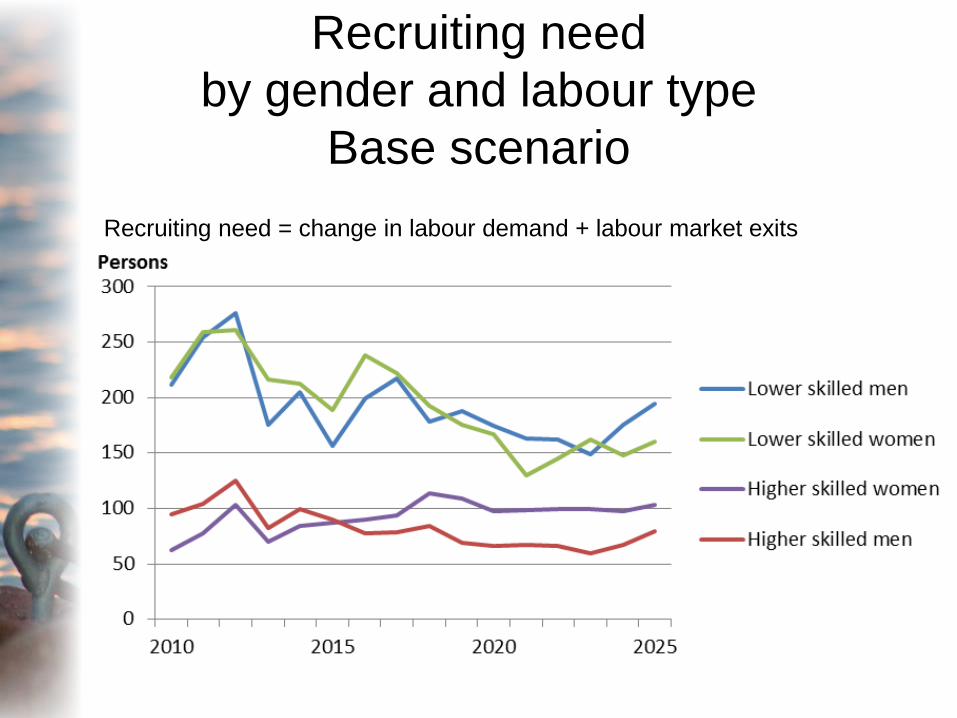
Recruiting need
by gender and labour type
Base scenario
Recruiting need = change in labour demand + labour market exits

Recruiting need by occupation, yearly
averages, base scenario

Recruiting need by field of education,
base scenario

Share of recruiting need covered by
local graduations, per cent
2011-2015 2016-2020 2021-2025
Humanities, arts Base scenario 68,5 48,1 40,9
Humanities, arts Growth 64,2 42,6 37,3
Humanities, arts Deceleration 78,9 49,9 44,1
Business adm. and pol. Sc. Base scenario 45,3 44,4 57,8
Business adm. and pol. Sc. Growth 43,4 40,7 50,1
Business adm. and pol. Sc. Deceleration 50,4 44,7 62,4
Technical sciences Base scenario 67,3 71,6 92,6
Technical sciences Growth 63,8 64,2 78,9
Technical sciences Deceleration 79,7 69,2 101,8
Health and social care Base scenario 56,8 52,3 53,1
Health and social care Growth 54,9 48,5 48,2
Health and social care Deceleration 62,2 52,0 55,9
Service Base scenario 83,3 66,9 69,8
Service Growth 80,0 62,1 64,0
Service Deceleration 96,7 64,4 73,2
General, unknown, other Base scenario 67,4 114,1 168,7
General, unknown, other Growth 63,7 93,1 121,8
General, unknown, other Deceleration 82,6 101,8 208,5
ÅrYear
Detailed results are accessible on the
web as PC-Axis matrices...
PC-Axis files in English

Thank your for your interest!