Embed Size (px)
Citation preview
Crime Mapping & Analysis – Georgia Tech
Crime Mapping & Analysis – Georgia Tech
Jonathan D’CruzJonathan D’Cruz
2
Introduction
• Crime analysis is a law enforcement function that involves systematic analysis for identifying and analyzing patterns and trends in crime and disorder. Information on patterns can help law enforcement agencies deploy resources in a more effective manner, and assist detectives in identifying and apprehending suspects.
Source: http://www.esri.com/library/brochures/pdfs/crime-analysis.pdf
3
Background
• The mission of the Georgia Tech Police Department (GTPD) is listed below: To strive for excellence and integrity in providing a safe and
secure environment and instilling confidence in the Georgia Tech community.
To enforce laws and campus policy, to serve the public, to prevent and detect criminal activity, and to reduce the fears of the public through community interaction and education.
To promote growth and development for the members of the Department.
Source: GTPD Website
4
The “Problem”
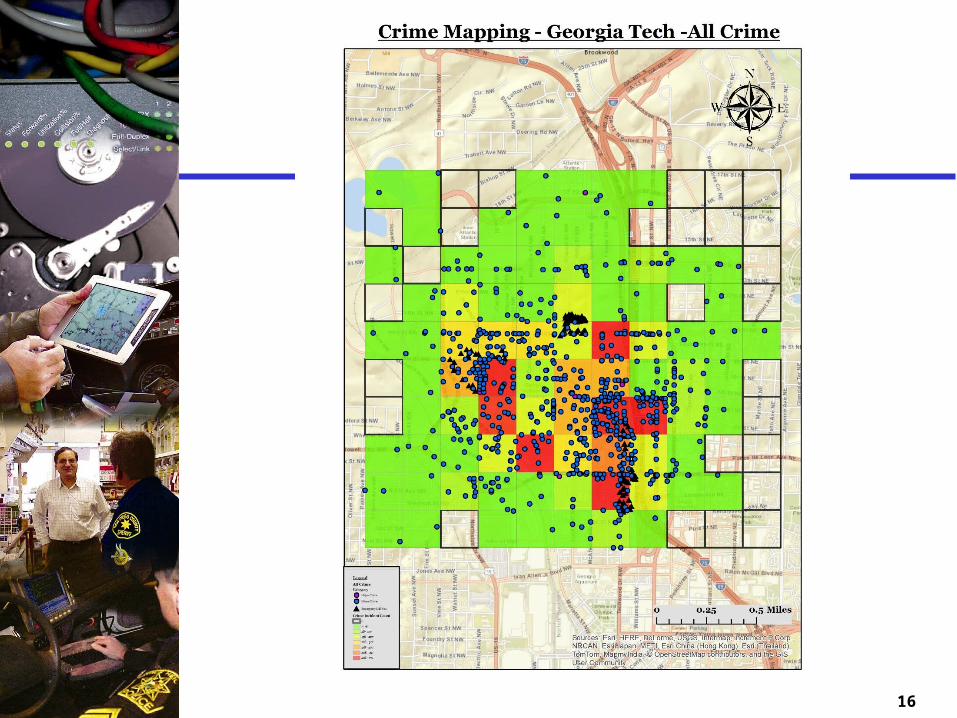
• Crime Mapping is dedicated to helping law enforcement agencies provide the public with valuable information about recent crime activity by neighborhood.
• It is used by analysts in law enforcement agencies to map, visualize, and analyze crime incident patterns.
• Mapping crime, using Geographic Information Systems (GIS), allows crime analysts to identify crime hot spots, along with other trends and patterns.
Source: http://www.esri.com/library/brochures/pdfs/crime-analysis.pdf
5
Objectives
• To map incidents of crime in and around Georgia tech for the period 2010-2015 (To date)
• To identify crime hot spots and other patterns and trends to aid in the efficient deployment of police resources and maximize effectiveness
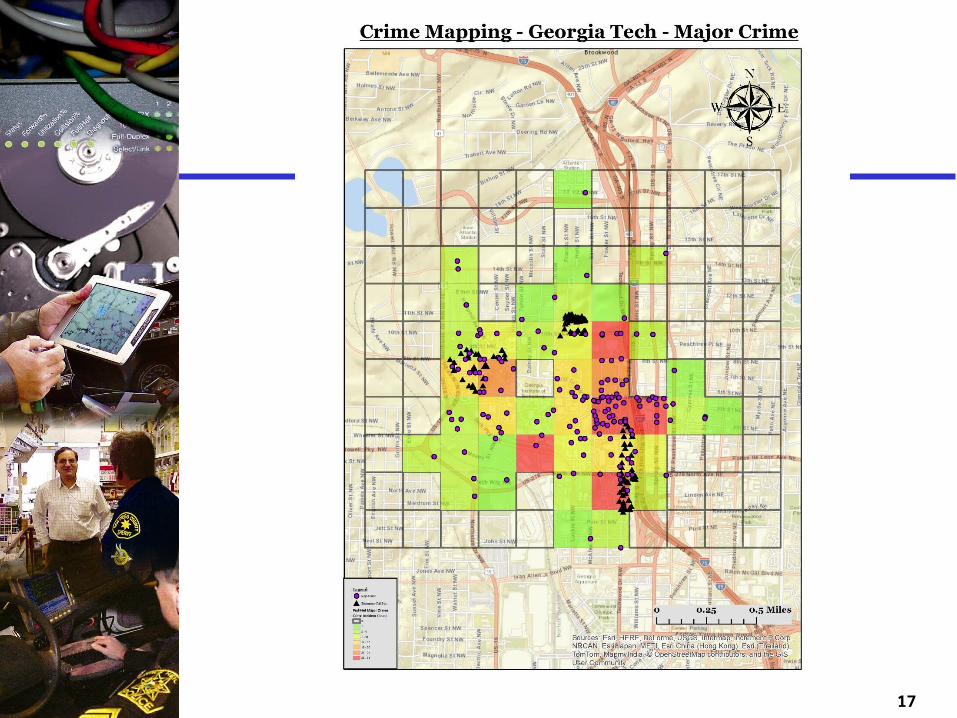
• To identify locations and neighborhoods where major crimes occur (Rape, Sexual Assault, Battery, etc.) and the incidents of criminal activity are high in order to direct police patrols and presence in those affected areas
6
Study Area
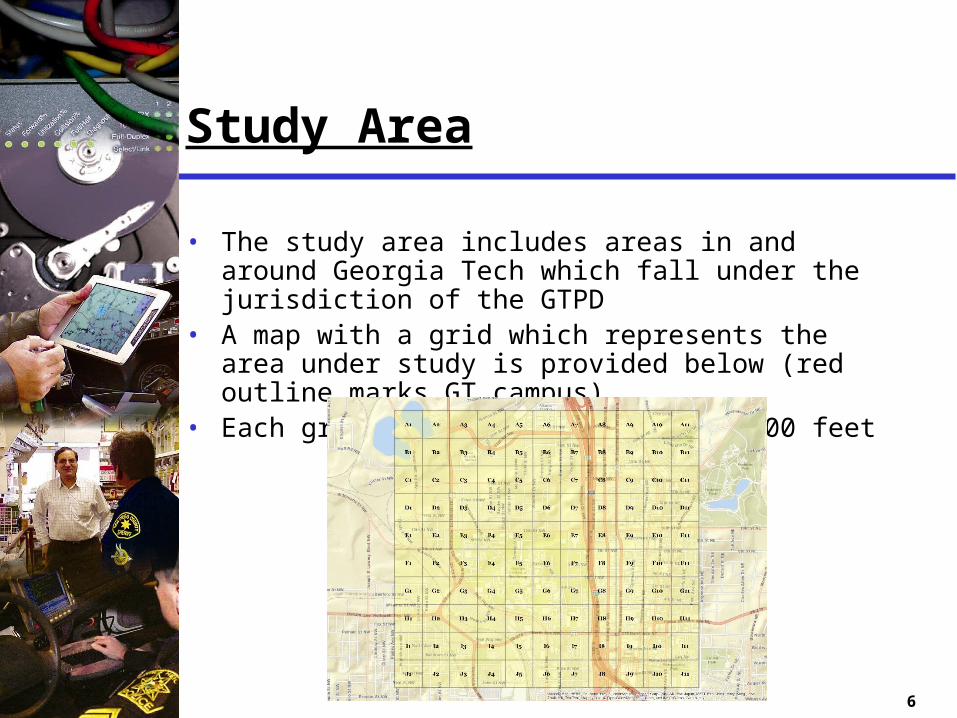
• The study area includes areas in and around Georgia Tech which fall under the jurisdiction of the GTPD
• A map with a grid which represents the area under study is provided below (red outline marks GT campus)
• Each grid has a size 0f 1000 by 1000 feet
7
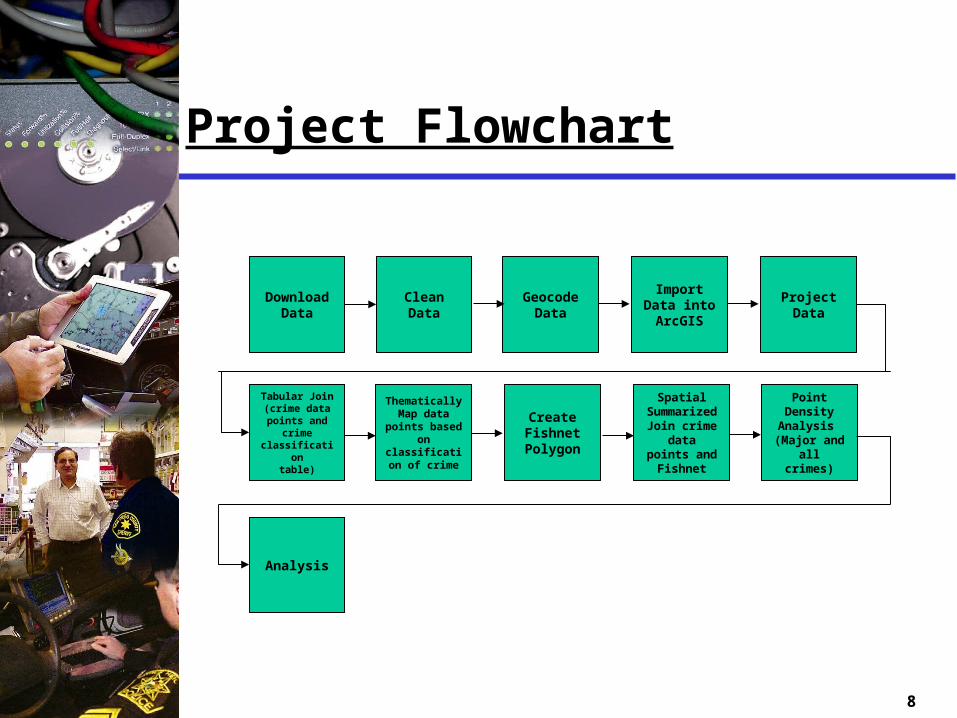
Methods And Procedures
• The data was first downloaded, cleaned, geocoded and imported into ArcGIS
• The data was then projected to NAD 1983 StatePlane Georgia West FIPS 1002 Feet to minimize distortions
• A fishnet was created to provide a frame of reference for the data
• A separate table containing crime categorization data was created and joined to the crime data points table using a simple join
• The crime data points were then thematically mapped based on the category of the crime (Major versus Minor), data was also categorized using select by attributes
• A point density analysis was then run to identify crime hot spots
• A spatial join between the fishnet and crime data points was carried out to identify grids with the highest incidents of crime and a summarized table was create
8
Project Flowchart
Download Data
Project Data
Create Fishnet Polygon
Thematically Map data
points based on
classification of crime
Tabular Join (crime data points and
crime classification
table)
Spatial Summarized Join crime data points and Fishnet
CleanData
Geocode Data
Import Data into ArcGIS
Point Density Analysis
(Major and all crimes)
Analysis
9
Data Used
• The data was downloaded from the GTPD website• The link is given below
http://www.police.gatech.edu/crimeinfo/crimelogs/• The data included incident reports for the years from
2010 to 2015 (to date)• The data set contained the following data
• Incident Date• Incident Time• Offense Description• Case Status• Patrol Zone• Address• Longitude Co-ordinates• Latitude Co-ordinates
10
Data Used
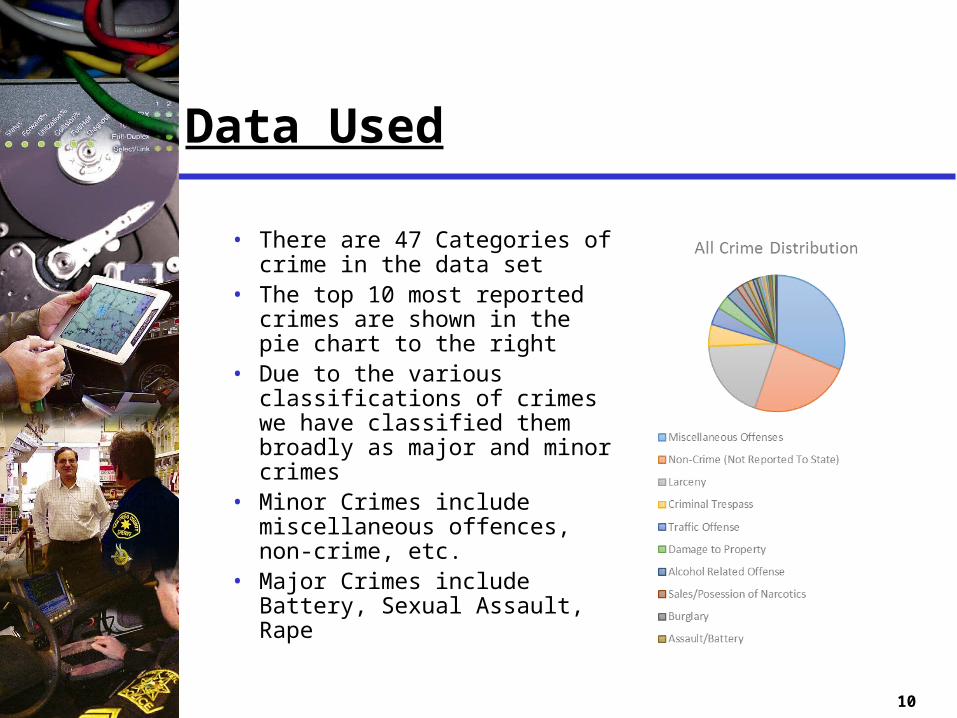
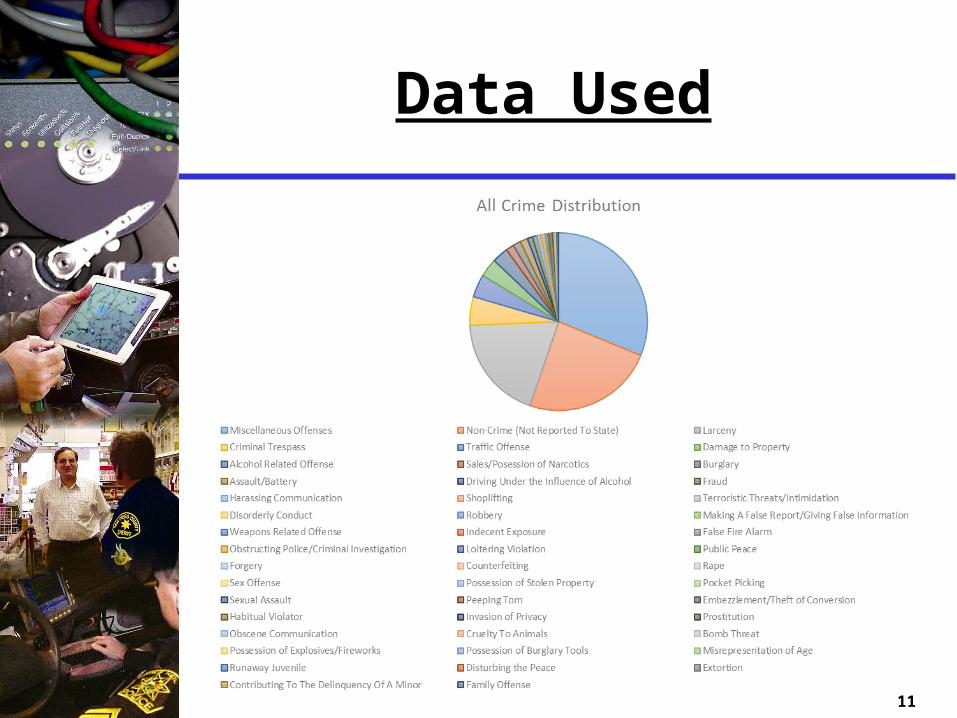
• There are 47 Categories of crime in the data set
• The top 10 most reported crimes are shown in the pie chart to the right
• Due to the various classifications of crimes we have classified them broadly as major and minor crimes
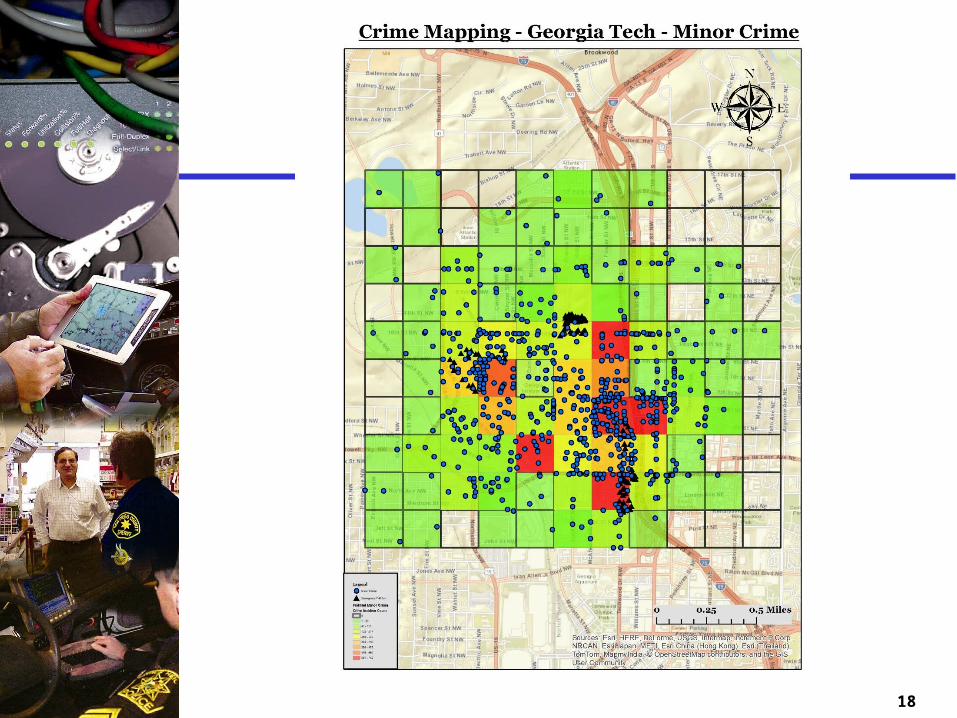
• Minor Crimes include miscellaneous offences, non-crime, etc.
• Major Crimes include Battery, Sexual Assault, Rape
Data Used
11
12
Assumptions/Limitations
• All crime incident reports were treated equally for the first point density analysis which is not true in real life.
• The type of crime should be allocated weightages for a more accurate view of the crime map
• The data is representative of the period 2010-2015 and as such data from previous years would improve the analysis
• That being said crime mapping needs to be conducted periodically (as close to real time) as the map may change with time as patrol routes, population demographics and developments (housing, offices, police station location etc.) change with time
• This is an aggregated analysis over the past few years. This can further be broken down into annual and monthly crime maps.
• For the purpose of simplicity we have conducted an aggregated analysis
• The grid size of the fishnet is 1000 x 1000 Feet
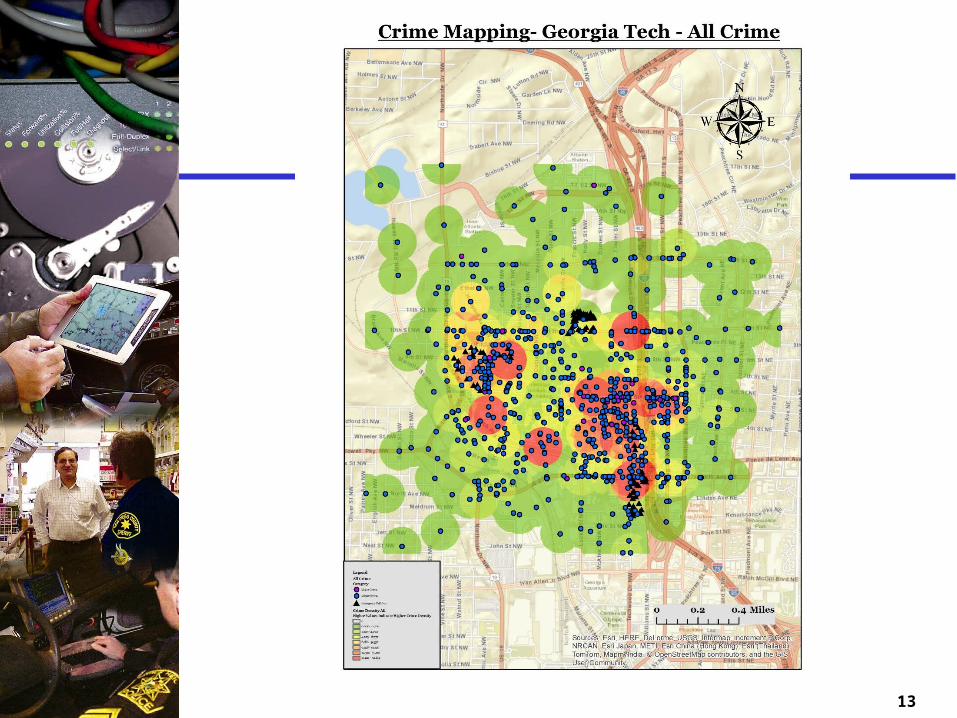
13
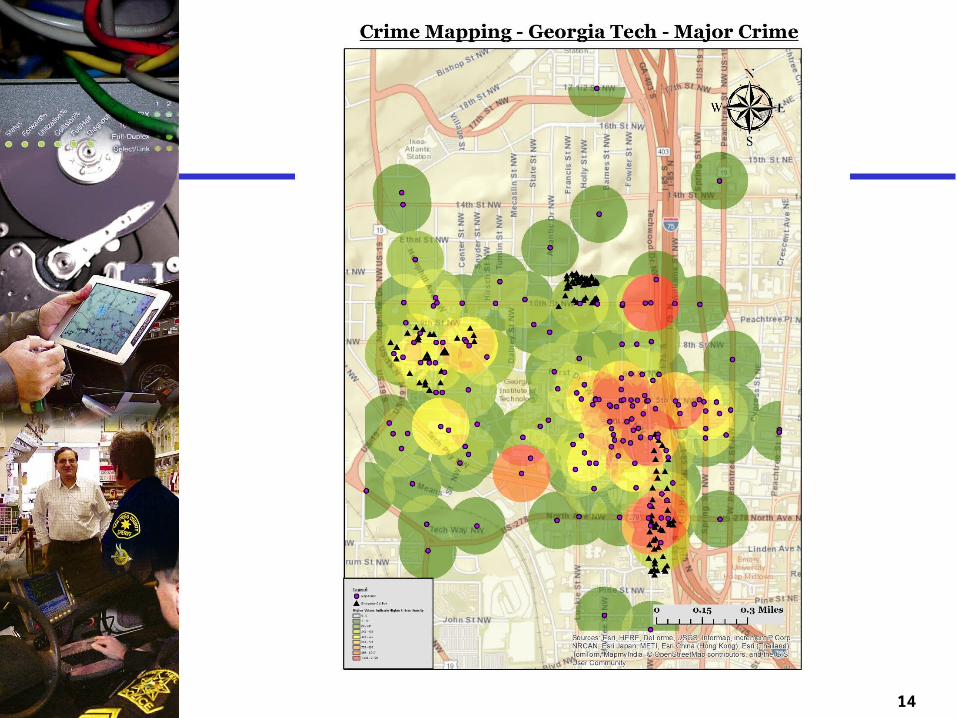
14
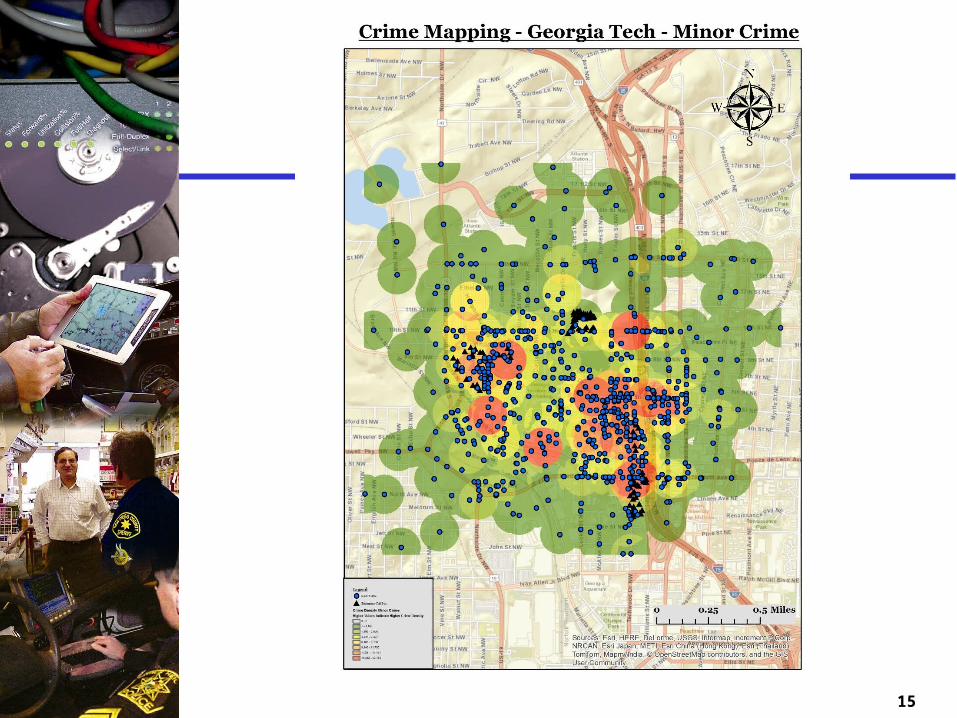
15
16
17
18
19
Results
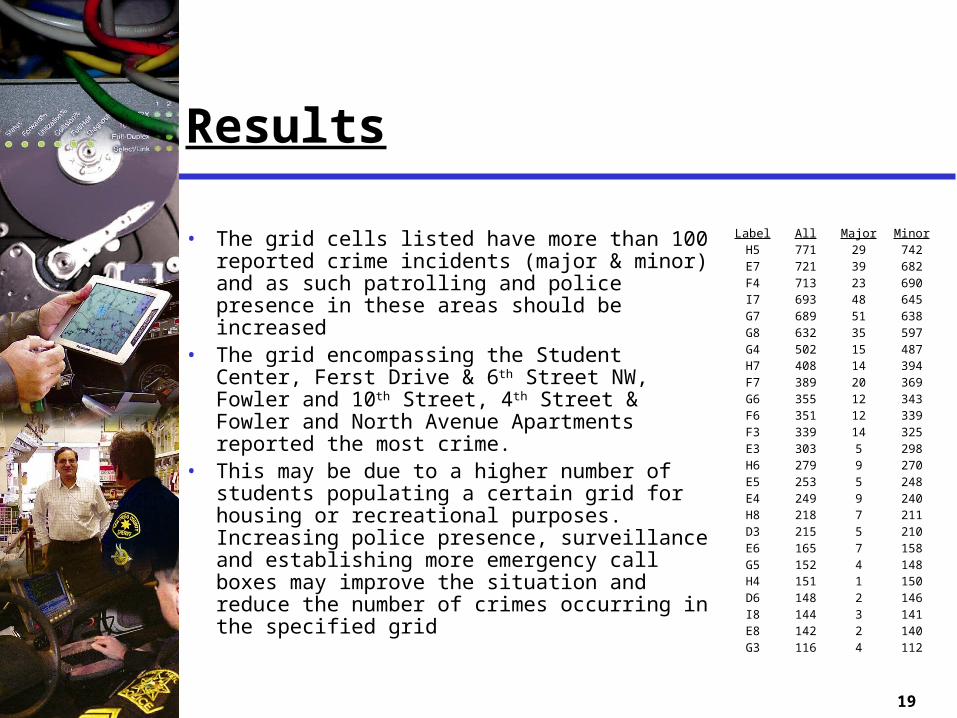
• The grid cells listed have more than 100 reported crime incidents (major & minor) and as such patrolling and police presence in these areas should be increased
• The grid encompassing the Student Center, Ferst Drive & 6th Street NW, Fowler and 10th Street, 4th Street & Fowler and North Avenue Apartments reported the most crime.
• This may be due to a higher number of students populating a certain grid for housing or recreational purposes. Increasing police presence, surveillance and establishing more emergency call boxes may improve the situation and reduce the number of crimes occurring in the specified grid
Label All Major MinorH5 771 29 742E7 721 39 682F4 713 23 690I7 693 48 645G7 689 51 638G8 632 35 597G4 502 15 487H7 408 14 394F7 389 20 369G6 355 12 343F6 351 12 339F3 339 14 325E3 303 5 298H6 279 9 270E5 253 5 248E4 249 9 240H8 218 7 211D3 215 5 210E6 165 7 158G5 152 4 148H4 151 1 150D6 148 2 146I8 144 3 141E8 142 2 140G3 116 4 112
20
Discussion/Recommendations
• We expected to see more reports of crime in and around Home Park. However, we found few incidents of crime in those locations not neglecting miscellaneous offenses and traffic violations
• The data obtained from GTPD was improperly formatted and required cleaning to a high degree
• The PIN code of the area in which the crime is reported should be included in the incident report as it makes geocoding much easier
• The data collated for analysis represents an aggregated data set (2010-2015). However, implementing a temporal analysis (not included in project) displaying the changing point density or grid based crime density can certainly increases the effectiveness of the model
21
Discussion/Recommendations• Creation of a mobile police outpost in grid G7 or H7 may help reduce
crime. • Increase police patrols and presence in cells E7, F4, G4, G7, G8, H5 and
I7. The streets to be patrolled to reduce incidents have been identified as the following: • 10thStreet NW and Fowler Street NW (E7)• McMillian Street NW and Hemphill Avenue NW (F4)• Ferst Drive NW (G4)• 4thStreet NW, 5thStreet NW, Brittain Drive NW and Techwood Drive
NW (G7)• Spring Street NW and 5thStreet NW (G8)• State Street NW and Tech Parkway NW (H5)• US 278 and Centennial Way NW (I7)
• Increase CCTV surveillance in cells E7, F4, G4, G7, G8, H5 and I7. • Revisit data entry best management practices with all department
personnel in order to decrease the number of incorrect data entries. • Conduct an additional temporal crime analysis to provide the department
with a more complete picture of where and when crime is occurring.
Thank You!
22