Embed Size (px)
Citation preview
Crime Mapping and SpatialAnalysis in National Forests
Michael G. Wing and Joanne Tynon
We examined the spatial distribution of crime incidents on USDA Forest Service lands using a geographicinformation system and several spatial analysis techniques. Our primary objective was to examinewhether patterns existed in the spatial distribution of crime and to explore the relationship of patternsto other geographic features using the Forest Service and other databases. We analyzed a databasecontaining over 45,000 spatially referenced crimes such as felonies, infractions, and misdemeanors.Other spatial data layers included transportation networks, administrative boundaries, hydrology,elevation, and digital orthophotographs. Results at a regional scale showed crime densities concentratedin forests adjacent to population centers and transportation corridors. Nearest neighbor, quartic kerneldensity estimation, and quadrat analyses identified crime patterning and hot spots. Our results suggestthat managers can use these spatial techniques as decision support tools to better understand therelationship between natural resources and crime.
Keywords: GIS, geostatistics
C rime mapping has occurred for over100 years but it is only recently thatgeographic information systems
(GIS) have begun to emerge as a standardtool for mapping and analyzing crime occur-rence (Harries 1999). Initially, GIS was usedprimarily as a means of producing digital pinmaps and evidence suggests that this remainsthe most prevalent GIS application forcrime analysis (Mamalian and LaVigne1999). Typically, manual pin maps were af-fixed to the walls of enforcement agenciesand discrete locations of crime were indi-cated with differently colored pushpins todenote crime categories or intensities.
One of the strengths of the GIS is itsability to integrate data from a variety ofsources such that social and environmentalphenomena can be simultaneously analyzed(Wing and Johnson 2001). A wide variety ofdigital tools are now available to collect andfeed data into a GIS database (Wing andKellogg 2004). In crime research, GIS hasbegun to provide pathways to more ad-vanced analytical techniques such as geo-
graphic profiling, crime forecasting/predic-tion, spatial displacement of offenders, hotspot analysis, and exploratory data analysisfor examining and mitigating crime (Harries1999, Anselin et al. 2000, Eck et al. 2000).The application of GIS in crime researchstill is in its infancy, however, and analyticaltechniques are being developed and refined.
Successful GIS products involve havingthe time necessary to collect data and ensurethat data are reliable for analysis (Wing andBettinger 2003). Within the multitude ofpolicing agencies there exists a vast disparityin technological ability (Lersch 2004). Al-though some advanced agencies make use ofautomated vehicle location systems and geo-referenced computer-assisted dispatchingsystems, many others use older systems withlimited implementation of advanced analyt-ical capability. In some remote and rural ar-eas, limited (if any) computerized record-keeping is used. Although some agenciesrequire little effort to move their data intoinformation management systems (and mayeven have limited analytical ability in their
production systems), other agencies expendtremendous effort in digital database cre-ation. Some agencies such as the USDA For-est Service still rely on manual entry frompaper records.
Technological advancements compelagencies to address resource managementchallenges more efficiently. Aging infra-structure is being supplanted as many orga-nizations move toward a digitally based in-cident reporting system. Modern systemsare designed to capture location informationwith greater precision and to rely less on pro-prietary data storage systems, making theirdata much more accessible.
National Forest CrimeResearch into the nature of crime in na-
tional forests is a recent phenomenon. In anillustrative study conducted with Forest Ser-vice law enforcement officers (LEO),Chavez and Tynon (2000) uncovered sev-eral crime categories: urban-associated crime(e.g., arson, body dumping, domestic vio-lence, drive-by shooting, gang activity, mur-der, rape and sexual assault, and suicide); as-sault (e.g., personal assault, criminalproperty damage, and threats against prop-erty); drug activity (e.g., marijuana cultiva-tion, meth labs, meth chemical dumps, andarmed defense of crops); and takeover or vi-olence perpetrated by members of extremistand nontraditional groups (e.g., sataniccults, white power groups, EarthFirst!, sur-vivalists, and militia/supremacy groups).The findings were supported by later studiesconducted at different Forest Service sites(Chavez et al. 2004, Tynon and Chavez2006).
Forest Service LEOs face challenges tocrime prevention from a variety of fronts.
Journal of Forestry • September 2006 293
AB
ST
RA
CT
geospatial technologies
Many LEOs are geographically isolated, es-pecially in western states where LEOs patrolan average of 378,000 ac alone and backup isroutinely an hour or more away (Tynon etal. 2001). LEOs rely on support fromcounty sheriffs’ offices, Special Weaponsand Tactics teams, drug task force members,and the border patrol. Law enforcementagreements between the Forest Service andother law enforcement entities can result inseveral agencies tracking crime, potentiallycreating confusion and inefficiencies. Whencrime data are collected by non-Forest Ser-vice law enforcement, they are not specifi-cally earmarked to national forest lands, theyare not included in the Forest Service crimedatabase, and they are not available for anal-ysis. Geographical isolation, understaffedlaw enforcement, and multiple law enforce-ment jurisdictions contribute to crime onnational forests going unnoticed, being un-derreported, or reported elsewhere.
The Forest Service created the Law En-forcement and Investigations AttainmentReporting System (LEIMARS) as a digitalrepository for reporting crime incidents(Tynon and Chavez 2006). LEIMARS con-tains not only investigative information, butalso features the latitude and longitude co-ordinates of crime incidents, serving as a GISdatabase. It remains the best and only avail-able source of crime statistics for the entire781,000 km2 (193 million ac) of national
forests and grasslands in the Forest Servicesystem.
Using GIS as an investigative tool, weconducted spatial analyses of crime inci-dents on Forest Service lands. Our primaryobjective was to examine whether patternsexisted in the spatial distribution of crimeand to explore the relationship of patterns toother landscape features. In addition, we ex-amined how crime violation types were dis-tributed at various administrative levels.Our investigation of national forest crimeintensities and crime types provides insightinto the magnitude of crime impacts on aregional, forest, and special managementunit level. To our knowledge, there are noother published studies using LEIMARS forthe spatial analysis of crime in a national for-est setting.
MethodsWe analyzed Forest Service LEIMARS
data for Region 6 incidents reported in cal-endar years (CYs) 2003 and 2004. The Re-gion 6 database contained over 45,000 spa-tially referenced crime incidents, coveringsuch crimes as felonies, infractions, and mis-demeanors. We obtained the LEIMARS da-tabase in a shapefile format and also ob-tained spatial data layers representing roads,individual national forest boundaries, hy-drology, elevation, and color digital or-thophotographs of Region 6. We registeredall spatial data layers to a common spatial
projection to facilitate reliable comparisonsbetween all data layers. We used ArcGIS(Environmental Systems Research Institute,Inc., Redlands, CA) and Crimestat (Ned Le-vine and Associates, Houston, TX and theNational Institute for Justice, Washington,DC) spatial software for our processing andanalyses. Although the spatial analyses tech-niques we used were originally developed forurban crime applications, we show they alsocan be applied in a national forest setting.See Eck et al. (2005) for a description ofthese and other software packages for analyz-ing spatial crime data.
In this study we used several techniquesto identify crime hot spots. Harries (1999)defines a hot spot as “a condition indicatingsome form of clustering in a spatial distribu-tion” (p. 112). Others have defined hot spotsmore specifically but three hot spot criteriagenerally are acknowledged: frequency, ge-ography, and time. We based our hot spotanalysis on the spatial aggregations of crimeoccurrence over a 2-year period within vari-ous administrative and spatial boundaries.
ResultsResults are first reported for Forest Ser-
vice Region 6, which includes all nationalforests within Washington and Oregon. Wethen reported results for the Siuslaw Na-tional Forest (located within western Ore-gon), and for a Siuslaw National Forest spe-cial management unit, the Oregon DunesNational Recreation Area (ODNRA).
Forest Service Region 6. Forest ServiceRegion 6 consists of approximately 112,396km2 (43,396 sq mi) in Washington and Or-egon, representing 14.4% of land in the en-tire Forest Service system. Of the over45,000 spatially referenced crime incidentslinked to Region 6, we located 40,003crimes within the regional boundary (Figure1A). The Region 6 map shows the majortransportation corridors for the area, the na-tional forest boundaries, and crime event lo-cations. At this small map scale additionalmap features would not be readily discern-ible. The middle section of Region 6 runsnorth to South, roughly along the Cascademountain range. This area shows a concen-tration of crime occurrences or crime hotspots, particularly in the area just east of theheavily populated Seattle-Tacoma region ofWashington south to central Oregon. Otherareas of concentrated crime occurrences arejust west of Seattle, along the ColumbiaRiver Gorge National Scenic Area, portionsof the Oregon coast, and parts of northeast-
Figure 1. (A) Crime locations and (B) quartic kernel density analysis in Forest Service Region6.
294 Journal of Forestry • September 2006
ern Oregon. Areas of relatively few crimeevents are in the northeastern portion ofWashington and south central Oregon.These areas also are not in close proximity tomajor population centers.
Point maps such as the one in Figure 1are limited because multiple events may bemapped on top of one another. In addition,map scales can confound interpretations be-cause points may not be visible because ofclustering. Several spatial analytical tech-niques are available to assist in the interpre-tation of crime intensities.
To draw inferences about spatial pat-terning in Region 6, we conducted a nearestneighbor analysis on the distribution ofcrime locations. Nearest neighbor analysisdescribes the distribution of a set of pointsrelative to one another and assumes thatpoints are referenced to a map coordinatesystem. A nearest neighbor analysis com-pares an observed set of distances betweenpoints with distances that would be drawnfrom a randomly distributed set of points.Results determine whether observed pointdistances are systematic, random, or clus-tered (Krebs 1999). Our results indicatedthat crimes in Region 6 were significantlyclustered (Nearest Neighbor Index [NNI] �0.21; P � 0.01).
Nearest neighbor analysis does not ex-plain where clustering occurs (Chainey andRatcliffe 2005). Therefore, we ran a quartickernel density estimation to create a contin-uous surface representing the density ofcrimes distributed across Region 6 (Figure1B). The kernel density estimation illus-trates variation in the grouping of crime lo-cations across an area (Chainey et al. 2002).Our kernel density results for Region 6showed crime hot spots that strongly corre-spond to those visible in the point locationmap panel. Although crime hot spots can beinferred through both visual examination ofdiscrete point locations and kernel densityestimation, the kernel density approach re-sults in an easier visual identification of hotspots.
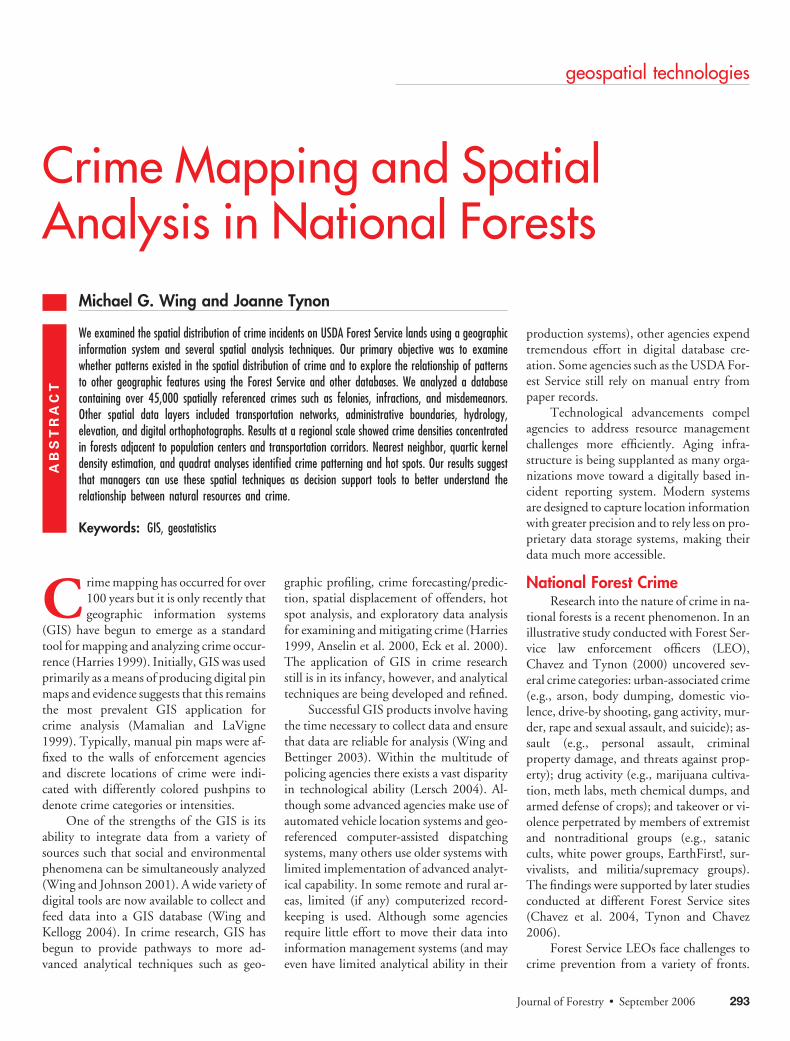
Siuslaw National Forest. Quartic ker-nel density analysis revealed several hot spotsin the Siuslaw National Forest, which is nearOregon’s Pacific coastline. The Siuslaw Na-tional Forest consists of approximately3,345 km2 (1,292 sq mi). However, the areafor the Siuslaw National Forest minus pri-vate inholdings is approximately 2,536 km2
(979 sq mi). There were 4,763 logged crimeswithin the Siuslaw National Forest duringCYs 2003 and 2004 (Figure 2). This repre-
sents 11.9% of all crimes reported in ForestService Region 6.
The Siuslaw National Forest mapshows the national forest boundary, majortransportation corridors, major cities, andcrime event locations. Several urban popula-tion centers can be seen East of the SiuslawNational Forest, along Interstate highway 5.Crime hot spots appear to be concentratedin those portions of the Siuslaw NationalForest that border the southern coastline.This is where ODNRA is located. TheODNRA runs parallel to Oregon’s sceniccoastal highway, US Route 101.
Our nearest neighbor analysis resultsindicated that crimes in the Siuslaw Na-tional Forest were significantly clustered(NNI � 0.14; P � 0.01). Our kernel den-sity estimation identified three distinctcrime clusters, with one hot spot in thenorthern section and two in the ODNRA(Figure 2).
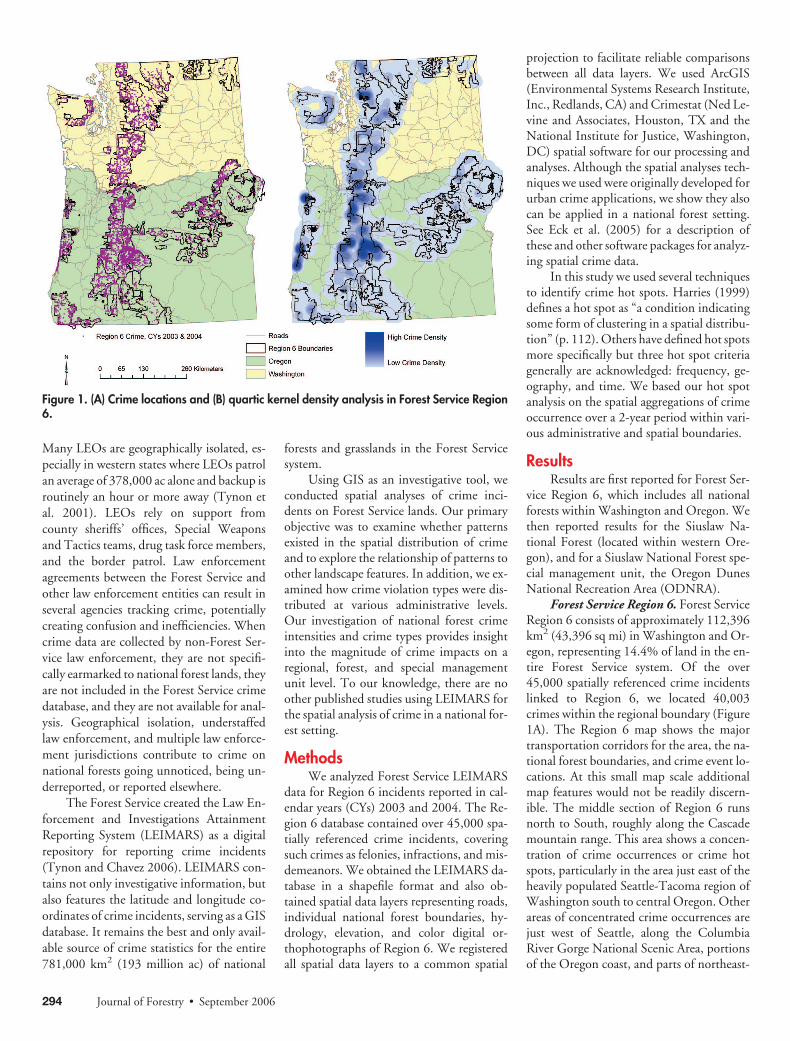
ODNRA. The ODNRA consists of ap-proximately 141 km2 (54 sq mi). The sizeestimate for ODNRA minus private inhold-ings is approximately 125 km2 (48 sq mi).There were 2,114 logged crimes within theadministrative boundaries of the ODNRA(Figure 3). This represents 44.4% of all
crimes reported in the Siuslaw National For-est and 5.3% of all crimes in Region 6.
The ODNRA map shows the adminis-trative boundaries, major transportationcorridors, major cities, water bodies, andcrime locations (Figure 3). The ODNRA isbound in the north and south by large pop-ulation centers and flanked on the easternside by several smaller cities. One crime hotspot is just below the midpoint of theODNRA, and to a lesser extent, the mostsouthern portion of the ODNRA. Most hotspots appear to be concentrated in thenorthern portion of the ODNRA, adjacentto two population centers and two popularinland fishing destinations.
Nearest neighbor analysis results indi-cated that crimes in the ODNRA were sig-nificantly clustered (NNI � 0.18; P �0.01). Kernel density estimation identifiedfour distinct crime hot spots, two groupedclosely together in the northern portion andtwo in the southern portion separated by ap-proximately 10 km (Figure 3). The northernhot spots appear to have stronger crime den-sities.
Figure 2. Crime locations including quartickernel density analysis for the Siuslaw Na-tional Forest.
Figure 3. Crime locations including quartickernel density analysis for the ODNRA.
Journal of Forestry • September 2006 295
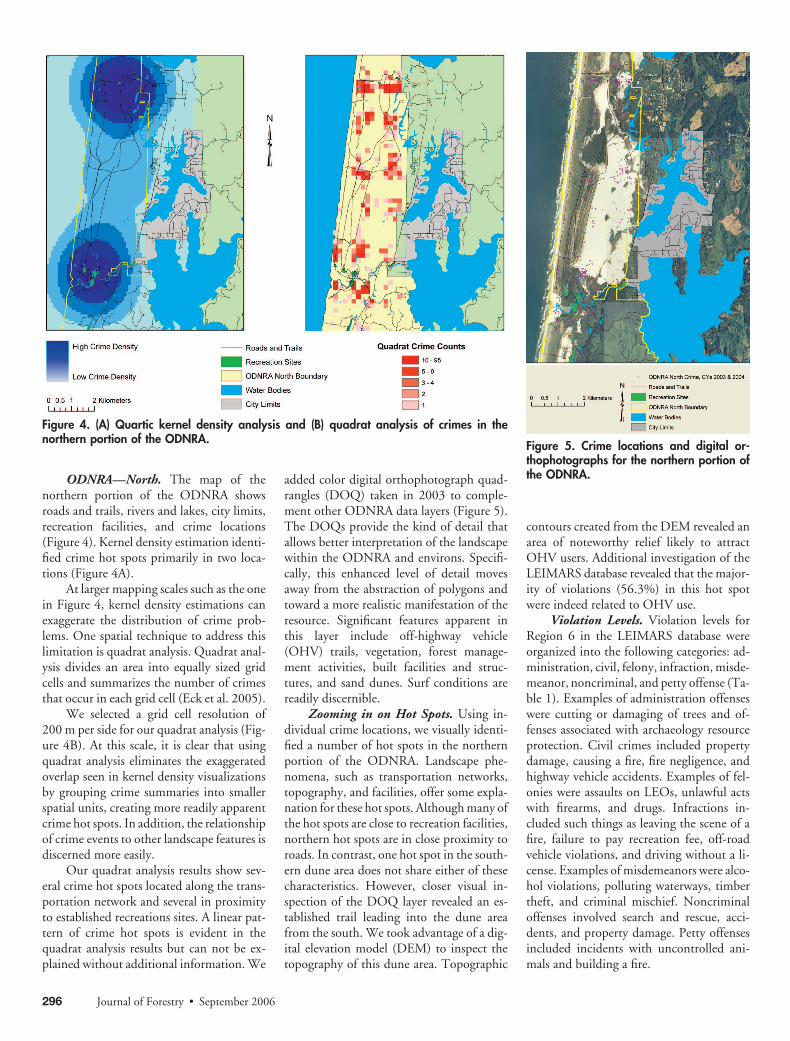
ODNRA—North. The map of thenorthern portion of the ODNRA showsroads and trails, rivers and lakes, city limits,recreation facilities, and crime locations(Figure 4). Kernel density estimation identi-fied crime hot spots primarily in two loca-tions (Figure 4A).
At larger mapping scales such as the onein Figure 4, kernel density estimations canexaggerate the distribution of crime prob-lems. One spatial technique to address thislimitation is quadrat analysis. Quadrat anal-ysis divides an area into equally sized gridcells and summarizes the number of crimesthat occur in each grid cell (Eck et al. 2005).
We selected a grid cell resolution of200 m per side for our quadrat analysis (Fig-ure 4B). At this scale, it is clear that usingquadrat analysis eliminates the exaggeratedoverlap seen in kernel density visualizationsby grouping crime summaries into smallerspatial units, creating more readily apparentcrime hot spots. In addition, the relationshipof crime events to other landscape features isdiscerned more easily.
Our quadrat analysis results show sev-eral crime hot spots located along the trans-portation network and several in proximityto established recreations sites. A linear pat-tern of crime hot spots is evident in thequadrat analysis results but can not be ex-plained without additional information. We
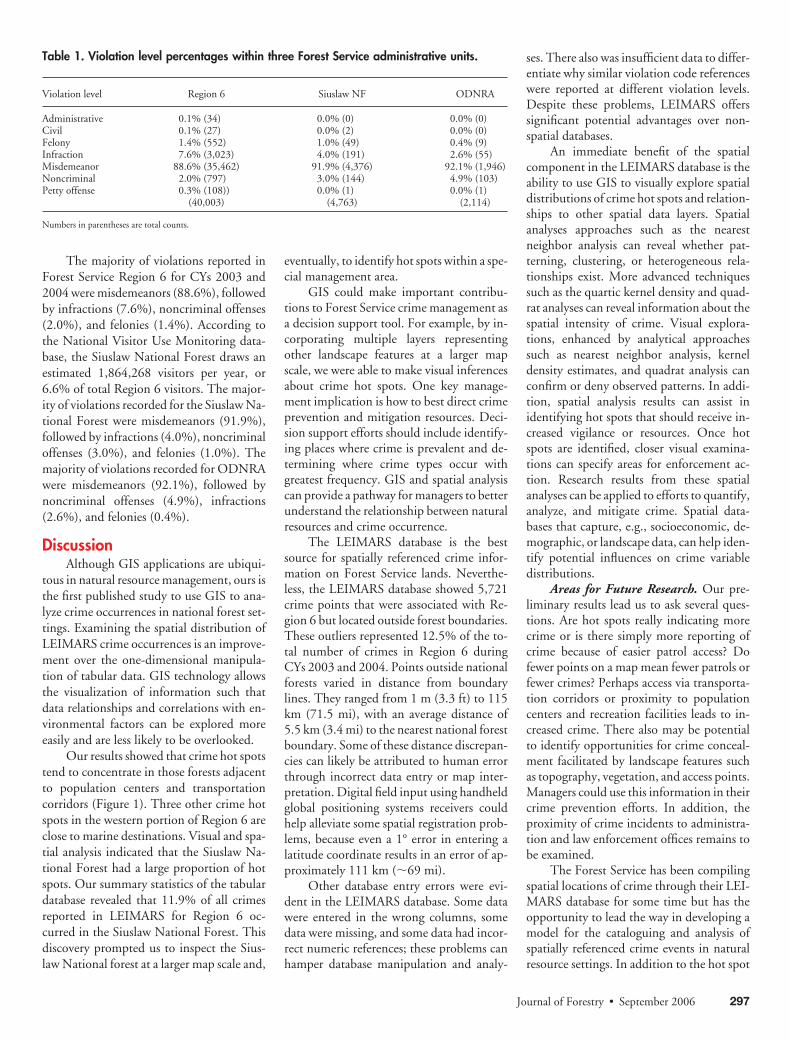
added color digital orthophotograph quad-rangles (DOQ) taken in 2003 to comple-ment other ODNRA data layers (Figure 5).The DOQs provide the kind of detail thatallows better interpretation of the landscapewithin the ODNRA and environs. Specifi-cally, this enhanced level of detail movesaway from the abstraction of polygons andtoward a more realistic manifestation of theresource. Significant features apparent inthis layer include off-highway vehicle(OHV) trails, vegetation, forest manage-ment activities, built facilities and struc-tures, and sand dunes. Surf conditions arereadily discernible.
Zooming in on Hot Spots. Using in-dividual crime locations, we visually identi-fied a number of hot spots in the northernportion of the ODNRA. Landscape phe-nomena, such as transportation networks,topography, and facilities, offer some expla-nation for these hot spots. Although many ofthe hot spots are close to recreation facilities,northern hot spots are in close proximity toroads. In contrast, one hot spot in the south-ern dune area does not share either of thesecharacteristics. However, closer visual in-spection of the DOQ layer revealed an es-tablished trail leading into the dune areafrom the south. We took advantage of a dig-ital elevation model (DEM) to inspect thetopography of this dune area. Topographic
contours created from the DEM revealed anarea of noteworthy relief likely to attractOHV users. Additional investigation of theLEIMARS database revealed that the major-ity of violations (56.3%) in this hot spotwere indeed related to OHV use.
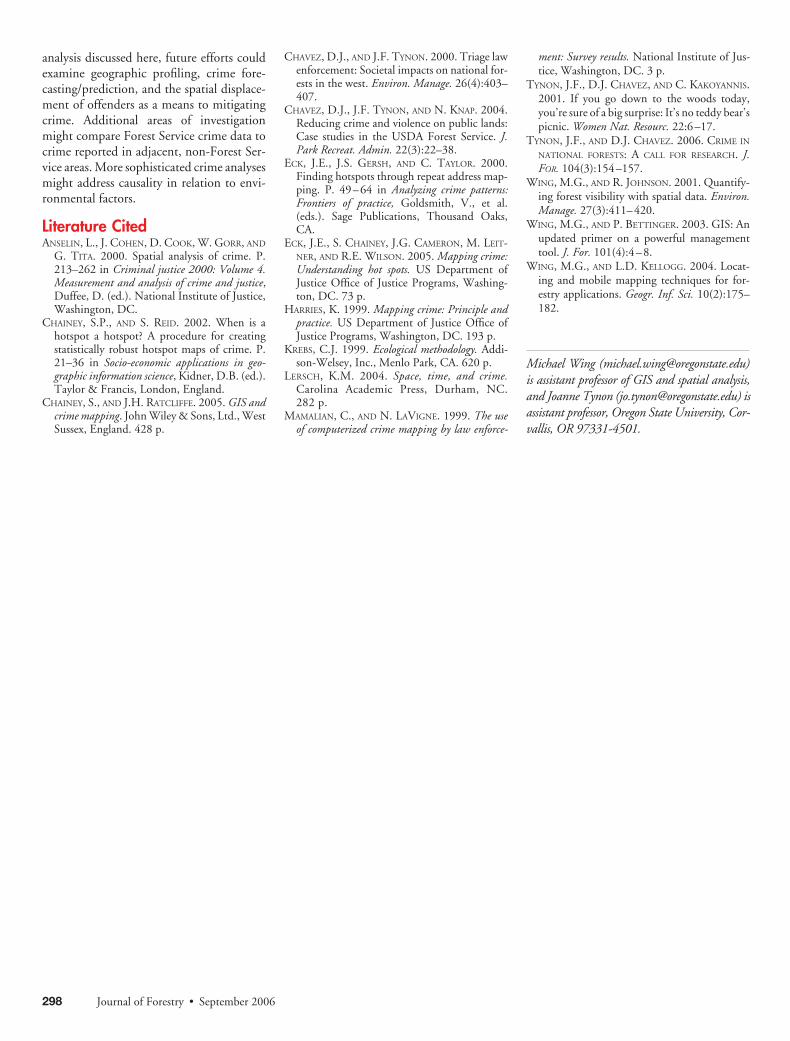
Violation Levels. Violation levels forRegion 6 in the LEIMARS database wereorganized into the following categories: ad-ministration, civil, felony, infraction, misde-meanor, noncriminal, and petty offense (Ta-ble 1). Examples of administration offenseswere cutting or damaging of trees and of-fenses associated with archaeology resourceprotection. Civil crimes included propertydamage, causing a fire, fire negligence, andhighway vehicle accidents. Examples of fel-onies were assaults on LEOs, unlawful actswith firearms, and drugs. Infractions in-cluded such things as leaving the scene of afire, failure to pay recreation fee, off-roadvehicle violations, and driving without a li-cense. Examples of misdemeanors were alco-hol violations, polluting waterways, timbertheft, and criminal mischief. Noncriminaloffenses involved search and rescue, acci-dents, and property damage. Petty offensesincluded incidents with uncontrolled ani-mals and building a fire.
Figure 4. (A) Quartic kernel density analysis and (B) quadrat analysis of crimes in thenorthern portion of the ODNRA. Figure 5. Crime locations and digital or-
thophotographs for the northern portion ofthe ODNRA.
296 Journal of Forestry • September 2006
The majority of violations reported inForest Service Region 6 for CYs 2003 and2004 were misdemeanors (88.6%), followedby infractions (7.6%), noncriminal offenses(2.0%), and felonies (1.4%). According tothe National Visitor Use Monitoring data-base, the Siuslaw National Forest draws anestimated 1,864,268 visitors per year, or6.6% of total Region 6 visitors. The major-ity of violations recorded for the Siuslaw Na-tional Forest were misdemeanors (91.9%),followed by infractions (4.0%), noncriminaloffenses (3.0%), and felonies (1.0%). Themajority of violations recorded for ODNRAwere misdemeanors (92.1%), followed bynoncriminal offenses (4.9%), infractions(2.6%), and felonies (0.4%).
DiscussionAlthough GIS applications are ubiqui-
tous in natural resource management, ours isthe first published study to use GIS to ana-lyze crime occurrences in national forest set-tings. Examining the spatial distribution ofLEIMARS crime occurrences is an improve-ment over the one-dimensional manipula-tion of tabular data. GIS technology allowsthe visualization of information such thatdata relationships and correlations with en-vironmental factors can be explored moreeasily and are less likely to be overlooked.
Our results showed that crime hot spotstend to concentrate in those forests adjacentto population centers and transportationcorridors (Figure 1). Three other crime hotspots in the western portion of Region 6 areclose to marine destinations. Visual and spa-tial analysis indicated that the Siuslaw Na-tional Forest had a large proportion of hotspots. Our summary statistics of the tabulardatabase revealed that 11.9% of all crimesreported in LEIMARS for Region 6 oc-curred in the Siuslaw National Forest. Thisdiscovery prompted us to inspect the Sius-law National forest at a larger map scale and,
eventually, to identify hot spots within a spe-cial management area.
GIS could make important contribu-tions to Forest Service crime management asa decision support tool. For example, by in-corporating multiple layers representingother landscape features at a larger mapscale, we were able to make visual inferencesabout crime hot spots. One key manage-ment implication is how to best direct crimeprevention and mitigation resources. Deci-sion support efforts should include identify-ing places where crime is prevalent and de-termining where crime types occur withgreatest frequency. GIS and spatial analysiscan provide a pathway for managers to betterunderstand the relationship between naturalresources and crime occurrence.
The LEIMARS database is the bestsource for spatially referenced crime infor-mation on Forest Service lands. Neverthe-less, the LEIMARS database showed 5,721crime points that were associated with Re-gion 6 but located outside forest boundaries.These outliers represented 12.5% of the to-tal number of crimes in Region 6 duringCYs 2003 and 2004. Points outside nationalforests varied in distance from boundarylines. They ranged from 1 m (3.3 ft) to 115km (71.5 mi), with an average distance of5.5 km (3.4 mi) to the nearest national forestboundary. Some of these distance discrepan-cies can likely be attributed to human errorthrough incorrect data entry or map inter-pretation. Digital field input using handheldglobal positioning systems receivers couldhelp alleviate some spatial registration prob-lems, because even a 1° error in entering alatitude coordinate results in an error of ap-proximately 111 km (�69 mi).
Other database entry errors were evi-dent in the LEIMARS database. Some datawere entered in the wrong columns, somedata were missing, and some data had incor-rect numeric references; these problems canhamper database manipulation and analy-
ses. There also was insufficient data to differ-entiate why similar violation code referenceswere reported at different violation levels.Despite these problems, LEIMARS offerssignificant potential advantages over non-spatial databases.
An immediate benefit of the spatialcomponent in the LEIMARS database is theability to use GIS to visually explore spatialdistributions of crime hot spots and relation-ships to other spatial data layers. Spatialanalyses approaches such as the nearestneighbor analysis can reveal whether pat-terning, clustering, or heterogeneous rela-tionships exist. More advanced techniquessuch as the quartic kernel density and quad-rat analyses can reveal information about thespatial intensity of crime. Visual explora-tions, enhanced by analytical approachessuch as nearest neighbor analysis, kerneldensity estimates, and quadrat analysis canconfirm or deny observed patterns. In addi-tion, spatial analysis results can assist inidentifying hot spots that should receive in-creased vigilance or resources. Once hotspots are identified, closer visual examina-tions can specify areas for enforcement ac-tion. Research results from these spatialanalyses can be applied to efforts to quantify,analyze, and mitigate crime. Spatial data-bases that capture, e.g., socioeconomic, de-mographic, or landscape data, can help iden-tify potential influences on crime variabledistributions.
Areas for Future Research. Our pre-liminary results lead us to ask several ques-tions. Are hot spots really indicating morecrime or is there simply more reporting ofcrime because of easier patrol access? Dofewer points on a map mean fewer patrols orfewer crimes? Perhaps access via transporta-tion corridors or proximity to populationcenters and recreation facilities leads to in-creased crime. There also may be potentialto identify opportunities for crime conceal-ment facilitated by landscape features suchas topography, vegetation, and access points.Managers could use this information in theircrime prevention efforts. In addition, theproximity of crime incidents to administra-tion and law enforcement offices remains tobe examined.
The Forest Service has been compilingspatial locations of crime through their LEI-MARS database for some time but has theopportunity to lead the way in developing amodel for the cataloguing and analysis ofspatially referenced crime events in naturalresource settings. In addition to the hot spot
Table 1. Violation level percentages within three Forest Service administrative units.
Violation level Region 6 Siuslaw NF ODNRA
Administrative 0.1% (34) 0.0% (0) 0.0% (0)Civil 0.1% (27) 0.0% (2) 0.0% (0)Felony 1.4% (552) 1.0% (49) 0.4% (9)Infraction 7.6% (3,023) 4.0% (191) 2.6% (55)Misdemeanor 88.6% (35,462) 91.9% (4,376) 92.1% (1,946)Noncriminal 2.0% (797) 3.0% (144) 4.9% (103)Petty offense 0.3% (108)) 0.0% (1) 0.0% (1)
(40,003) (4,763) (2,114)
Numbers in parentheses are total counts.
Journal of Forestry • September 2006 297
analysis discussed here, future efforts couldexamine geographic profiling, crime fore-casting/prediction, and the spatial displace-ment of offenders as a means to mitigatingcrime. Additional areas of investigationmight compare Forest Service crime data tocrime reported in adjacent, non-Forest Ser-vice areas. More sophisticated crime analysesmight address causality in relation to envi-ronmental factors.
Literature CitedANSELIN, L., J. COHEN, D. COOK, W. GORR, AND
G. TITA. 2000. Spatial analysis of crime. P.213–262 in Criminal justice 2000: Volume 4.Measurement and analysis of crime and justice,Duffee, D. (ed.). National Institute of Justice,Washington, DC.
CHAINEY, S.P., AND S. REID. 2002. When is ahotspot a hotspot? A procedure for creatingstatistically robust hotspot maps of crime. P.21–36 in Socio-economic applications in geo-graphic information science, Kidner, D.B. (ed.).Taylor & Francis, London, England.
CHAINEY, S., AND J.H. RATCLIFFE. 2005. GIS andcrime mapping. John Wiley & Sons, Ltd., WestSussex, England. 428 p.
CHAVEZ, D.J., AND J.F. TYNON. 2000. Triage lawenforcement: Societal impacts on national for-ests in the west. Environ. Manage. 26(4):403–407.
CHAVEZ, D.J., J.F. TYNON, AND N. KNAP. 2004.Reducing crime and violence on public lands:Case studies in the USDA Forest Service. J.Park Recreat. Admin. 22(3):22–38.
ECK, J.E., J.S. GERSH, AND C. TAYLOR. 2000.Finding hotspots through repeat address map-ping. P. 49–64 in Analyzing crime patterns:Frontiers of practice, Goldsmith, V., et al.(eds.). Sage Publications, Thousand Oaks,CA.
ECK, J.E., S. CHAINEY, J.G. CAMERON, M. LEIT-NER, AND R.E. WILSON. 2005. Mapping crime:Understanding hot spots. US Department ofJustice Office of Justice Programs, Washing-ton, DC. 73 p.
HARRIES, K. 1999. Mapping crime: Principle andpractice. US Department of Justice Office ofJustice Programs, Washington, DC. 193 p.
KREBS, C.J. 1999. Ecological methodology. Addi-son-Welsey, Inc., Menlo Park, CA. 620 p.
LERSCH, K.M. 2004. Space, time, and crime.Carolina Academic Press, Durham, NC.282 p.
MAMALIAN, C., AND N. LAVIGNE. 1999. The useof computerized crime mapping by law enforce-
ment: Survey results. National Institute of Jus-tice, Washington, DC. 3 p.
TYNON, J.F., D.J. CHAVEZ, AND C. KAKOYANNIS.2001. If you go down to the woods today,you’re sure of a big surprise: It’s no teddy bear’spicnic. Women Nat. Resourc. 22:6–17.
TYNON, J.F., AND D.J. CHAVEZ. 2006. CRIME IN
NATIONAL FORESTS: A CALL FOR RESEARCH. J.FOR. 104(3):154–157.
WING, M.G., AND R. JOHNSON. 2001. Quantify-ing forest visibility with spatial data. Environ.Manage. 27(3):411–420.
WING, M.G., AND P. BETTINGER. 2003. GIS: Anupdated primer on a powerful managementtool. J. For. 101(4):4–8.
WING, M.G., AND L.D. KELLOGG. 2004. Locat-ing and mobile mapping techniques for for-estry applications. Geogr. Inf. Sci. 10(2):175–182.
Michael Wing ([email protected])is assistant professor of GIS and spatial analysis,and Joanne Tynon ([email protected]) isassistant professor, Oregon State University, Cor-vallis, OR 97331-4501.
298 Journal of Forestry • September 2006