Embed Size (px)
Citation preview
Youth Segment as driver of Mobile Data Revenues –Questionable ?
Hypothesis : If Youth is a key driver for Mobile Data growth – then Youth Unemploymentshould be strongly and inversely Correlated to Data % ARPU
Regression analysis preliminary results = Possibly NO Relationship / At Best a very WEAKcorrelation….
Saravanan SFreelance Consultant – Telecom Strategy & [email protected]
5 June 2015
Many thanks to John Mathew for Stats fundaes andadvise on the Regression analysis…

Mobile Data Marketers and Mobile Operators swear by “youth” as the key driver for MobileData usage and growth. The question : Is this for REAL? – Or is this one more mobile marketingshibboleth, repeated by so many for so long, that it is now an article of faith…

Hypothesis for Analysis : IF Youth are a key driver for Mobile Data Use, THEN – Changes inYouth Unemployment levels (and hence their disposable income levels) should Affect theGrowth in Data% of ARPU across markets / countries.
• There is hardly any real hard Value data points / information on Mobile Data Spend by Youth – in any market.Sure there are lots of hours of use / apps use / etc.. – but NO $ Values…
• Thankfully, the last decade has also seen some serious and significant changes to key parameters that driveYouth Disposable income and therefore spend on Mobiles / Mobile Data – i.e. Youth Unemployment Rates..From Spain / Greece / South Africa with ~50% youth unemployment to Sub 10 % youth unemployment incountries like Japan / Switzerland / China– we should expect to see – significant variations in youthunemployment levels leading to major differences In youth disposable income and therefore Spend on MobileData
• Given wide variations of $ GDP / Capita across markets , Pricing variations, volatile Forex rate changes,differences in start date for Tech roll out / device availability, etc… - it was decided to use Data% ARPU as theTarget Outcome parameter rather than using $ Data ARPU.
• Time series data on Technology roll out and Service Coverage, Service and Device Penetrations clearly show that– the Years by themselves was going to be a critical driver of Mobile Data % ARPU trends and needed to beincluded as an independent variable in any regression analysis.
• We also looked at GDP / Capita itself as a possible variable affecting Data % ARPU for Mobiles.
• There is one major source for “noise” within the data that we need to remember however. The Mobile Data %ARPU is sourced from Merrill Lynch Wireless Matrix reports – which traditionally have only provided a mergedSMS + Mobile Data combined % of ARPU – rather than a pure Mobile Data% value. The SMS data thereforecontaminates the input data and cleansing it at a future date may lead to changes to the results of this analysis.

Regression Analysis… - All Countries – on Year and Youth Unemployment %age change effecton Data% ARPU Change vs. Baseline… - P-value of 15% Youth Unemployment is NOTsignificantly correlated to Data% ARPU….
Regression Testing only Year and Youth Unemployment
P-Value = 0.152 >> 0.05
NO CORRELATION BETWEEN YOUTH UNEMPLOYMENT ANDDATA % ARPU

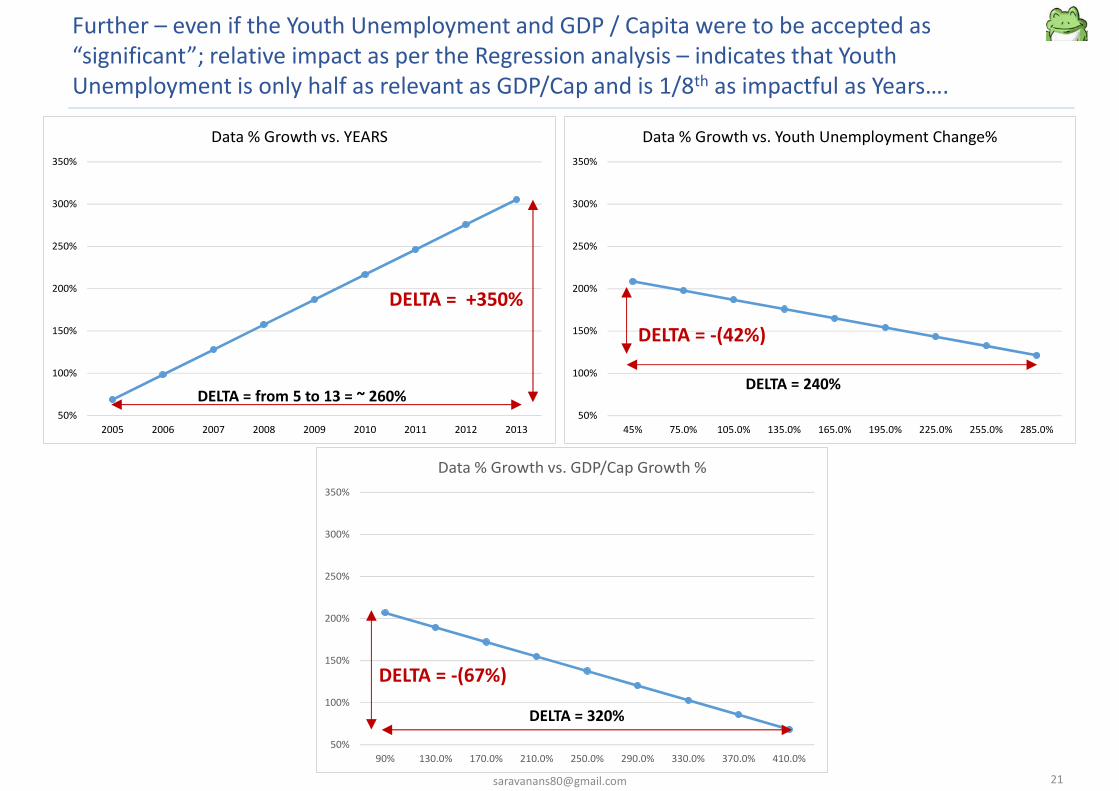
Further – even if the Youth Unemployment and GDP / Capita were to be accepted as“significant”; relative impact as per the Regression analysis – indicates that YouthUnemployment is only half as relevant as GDP/Cap and is 1/8th as impactful as Years….
50%
100%
150%
200%
250%
300%
350%
45% 75.0% 105.0% 135.0% 165.0% 195.0% 225.0% 255.0% 285.0%
Data % Growth vs. Youth Unemployment Change%
DELTA = 240%
DELTA = -(42%)
50%
100%
150%
200%
250%
300%
350%
2005 2006 2007 2008 2009 2010 2011 2012 2013
Data % Growth vs. YEARS
DELTA = +350%
DELTA = from 5 to 13 = ~ 260%
50%
100%
150%
200%
250%
300%
350%
90% 130.0% 170.0% 210.0% 250.0% 290.0% 330.0% 370.0% 410.0%
Data % Growth vs. GDP/Cap Growth %
DELTA = 320%
DELTA = -(67%)

Results of Analysis : While there may remain a few questions and definitely a need for cleanerdata to repeat this analysis over a larger sample; it appears that Youth Segment IS NOT a keydriver of Mobile Data Revenues..
• Preliminary Visual Checks indicate – there may be a case for further analysis – Although there is NO CONSISTENCYto the overall Trend seen.
• ALSO – Any such relationship if found has to be Negative – i.e. Inverse Relationship between Youth Unemploymentvs. Data % ARPU. That makes sense – since higher the youth unemployment, the less money they would have tospend on Mobile Data. Any positive correlation is likely to be an error.
• Regression Analysis carried out with Data% ARPU baselined to 100% for Year 2005 – versus Year; YouthUnemployment baselined to 2005 and GDP/Capita also baselined to 2005.
• Initial Regression with Power of 1 equation hypothesis result was mixed and confusing.• Additional analysis therefore done to :
• Separate the data for OECD and Emerging Markets and check if there is any correlation within context of thedifferent types of markets…
• Include Quadratic in the regression• Final results seem to indicate :
• 90% plus confidence level – Youth Unemployment has little or NO impact on Data % ARPU – in OECD andemerging markets
• Hypothesis that Youth segment is a key determinant of Mobile Data Spend $ Growth is questionable.
• Clearly – the Data used has some serious limitations (Data% includes SMS; Non-labour pool youth (eg. Collegegoers) not included; etc..) and the sampling pool may need to be widened as well.
• However – for now – it appears – Youth MAY NOT BE A KEY DRIVER FOR REAL $ MOBILE DATA REVENUES..

Base Data and Sources : Youth Unemployment – OECD and World Bank Reports….
5%
10%
15%
20%
25%
30%
35%
40%
45%
50%
55%
60%
2005 2006 2007 2008 2009 2010 2011 2012 2013
Youth Unemployment Data - Source - OECD and World Bank ReportsGreeceSpainSouth AfricaItalyPortugalPolandFranceBelgiumSwedenIndonesiaUnited KingdomFinlandTurkeyChileNew ZealandUnited StatesBrazilRussiaCanadaDenmarkAustraliaMalaysiaNetherlandsIsraelIndiaPRC ChinaKoreaMexicoAustriaNorwaySwitzerlandGermanyJapan
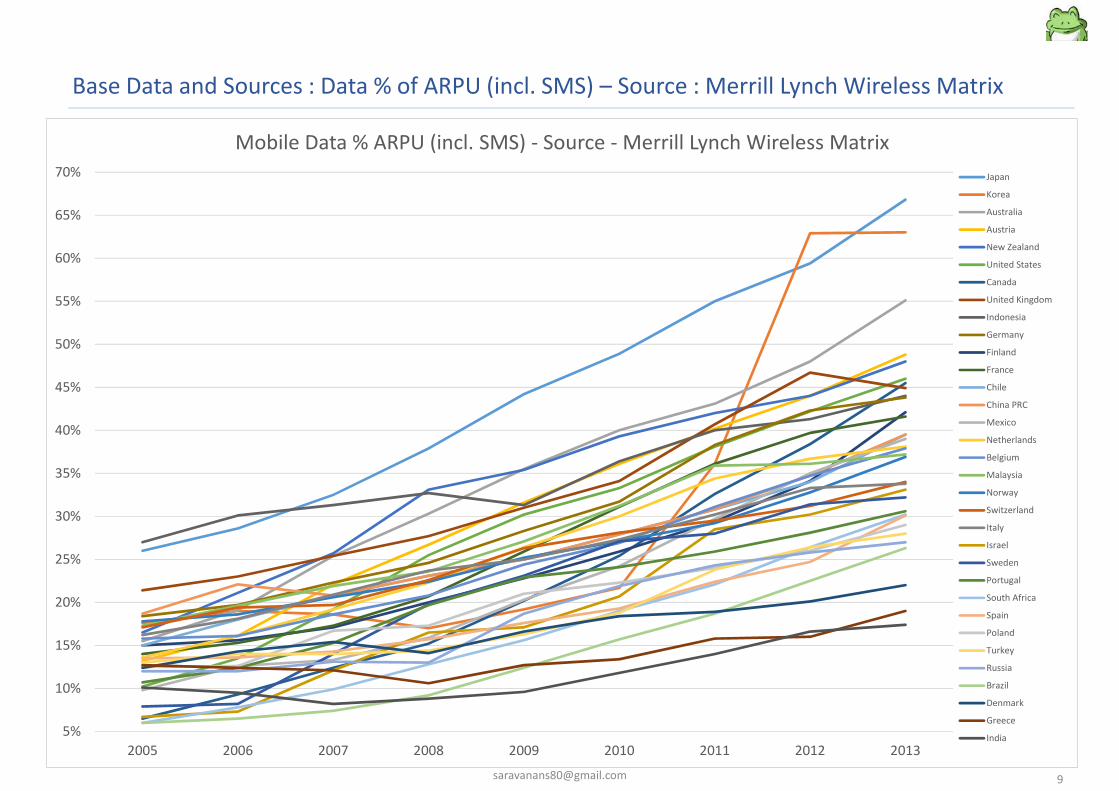
Base Data and Sources : Data % of ARPU (incl. SMS) – Source : Merrill Lynch Wireless Matrix
5%
10%
15%
20%
25%
30%
35%
40%
45%
50%
55%
60%
65%
70%
2005 2006 2007 2008 2009 2010 2011 2012 2013
Mobile Data % ARPU (incl. SMS) - Source - Merrill Lynch Wireless MatrixJapan
Korea
Australia
Austria
New Zealand
United States
Canada
United Kingdom
Indonesia
Germany
Finland
France
Chile
China PRC
Mexico
Netherlands
Belgium
Malaysia
Norway
Switzerland
Italy
Israel
Sweden
Portugal
South Africa
Spain
Poland
Turkey
Russia
Brazil
Denmark
Greece
India

Base Data and Sources : GDP per Capita in $ ‘000s – Source : World Bank
0
5
10
15
20
25
30
35
40
45
50
55
60
65
70
75
80
85
90
95
100
105
2005 2006 2007 2008 2009 2010 2011 2012 2013
GDP per Capita Current $'000s - Source - World Bank Statistics
Norway
Switzerland
Australia
Sweden
Denmark
United States
Canada
Netherlands
Austria
Finland
Belgium
Germany
France
New Zealand
United Kingdom
Japan
Israel
Italy
Spain
Korea
Greece
Portugal
Chile
Russia
Poland
Brazil
Turkey
Malaysia
Mexico
South Africa
China PRC
Indonesia
India

Level 1 Analysis – Year-wise variations in % Youth Unemployment by Country vs. Mobile Data %ARPU by Country – Both Sorted based on CY2013 Youth Unemployment…Visual Check : May be – Very may be – there is a correlation… - needs to be tested…
5%
15%
25%
35%
45%
55%
65%
Japa
nG
erm
any
Switz
erla
ndN
orw
ayAu
stria
Mex
ico
Kore
aCh
ina
PRC
Indi
aIs
rael
Net
herla
nds
Mal
aysi
aAu
stra
liaDe
nmar
kCa
nada
Russ
iaBr
azil
Uni
ted
Stat
esN
ew Z
eala
ndCh
ileTu
rkey
Finl
and
Uni
ted
King
dom
Indo
nesia
Swed
enBe
lgiu
mFr
ance
Pola
ndPo
rtug
alIta
lySo
uth
Afric
aSp
ain
Gre
ece
Trends in Youth Unemployment vs. Trends in Data % of ARPU - All Countries in Sample - Sorted byAbsolute level of Youth Unemployment (CY 2013)
2005 2006 2007
2008 2009 2010
2011 2012 2013
YouthUnemployment %
Mobile Data%of ARPU

5%
15%
25%
35%
45%
55%
65%
Indo
nesi
aPo
land
Ger
man
yIs
rael
Braz
ilCh
ileN
orw
ayJa
pan
Russ
iaTu
rkey
Aust
riaKo
rea
Switz
erla
ndM
alay
sia
Indi
aFi
nlan
dCa
nada
Chin
a PR
CSw
eden
Aust
ralia
Net
herla
nds
Belg
ium
Mex
ico
Sout
h Af
rica
Fran
ceU
nite
d St
ates
Den
mar
kN
ew Z
eala
ndU
nite
d Ki
ngdo
mIta
lyPo
rtug
alG
reec
eSp
ain
Trends in Youth Unemployment vs. Trends in Data % of ARPU - All Countries in Sample Sorted by RelativeImprovement (DELTA) in Youth Unemployment (2013 vs. 2005)
2005 2006 2007
2008 2009 2010
2011 2012 2013
Level 1 Analysis – Check based on Sorting on Relative Improvement in Youth Unemployment(CY2013 vs. CY2005) vs. Improvement in Mobile Data % ARPU ( Spread over years)…Visual Check : NO CORRELATION AT ALL…. – In terms of Variance to Variance…
Youth Unemployment %
Mobile Data% of ARPU
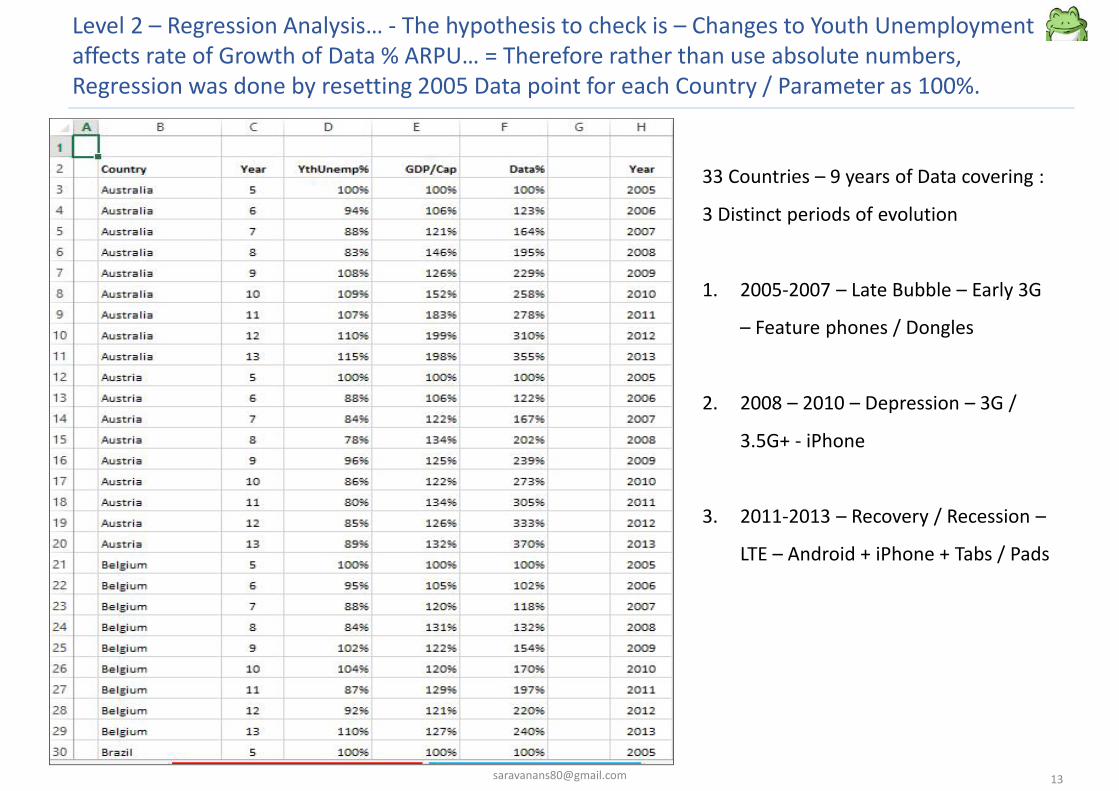
Level 2 – Regression Analysis… - The hypothesis to check is – Changes to Youth Unemploymentaffects rate of Growth of Data % ARPU… = Therefore rather than use absolute numbers,Regression was done by resetting 2005 Data point for each Country / Parameter as 100%.
33 Countries – 9 years of Data covering :
3 Distinct periods of evolution
1. 2005-2007 – Late Bubble – Early 3G
– Feature phones / Dongles
2. 2008 – 2010 – Depression – 3G /
3.5G+ - iPhone
3. 2011-2013 – Recovery / Recession –
LTE – Android + iPhone + Tabs / Pads
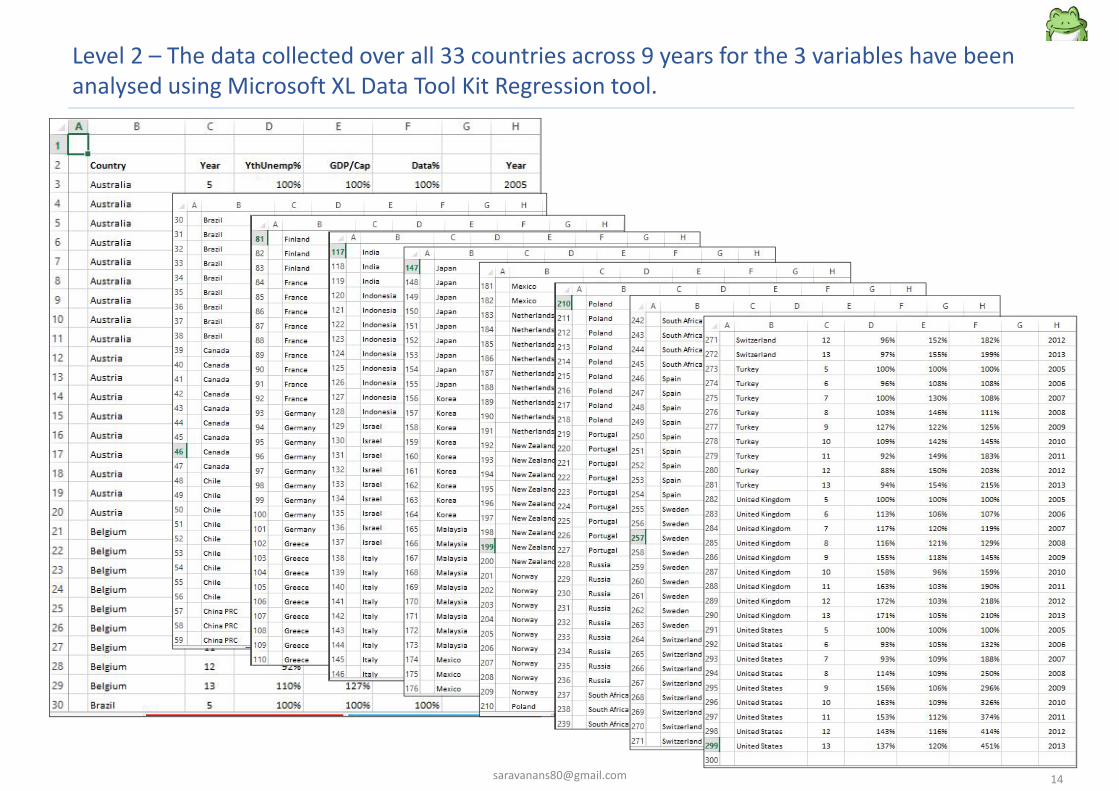
Level 2 – The data collected over all 33 countries across 9 years for the 3 variables have beenanalysed using Microsoft XL Data Tool Kit Regression tool.
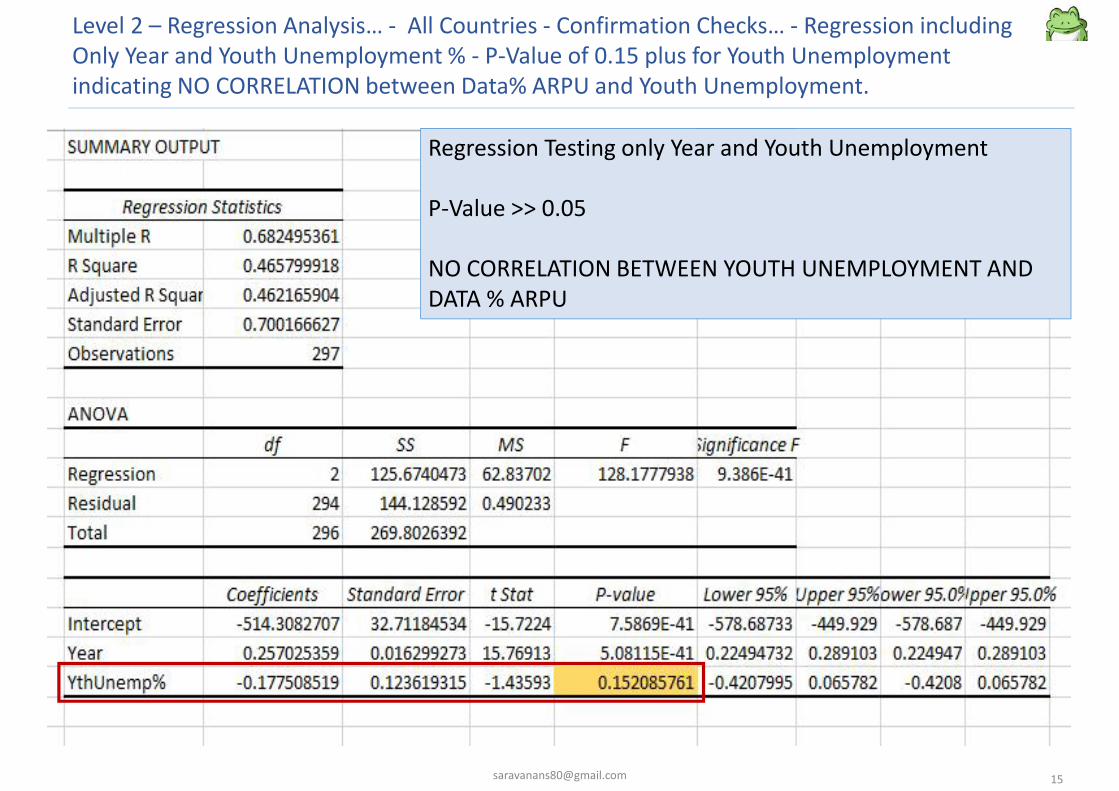
Level 2 – Regression Analysis… - All Countries - Confirmation Checks… - Regression includingOnly Year and Youth Unemployment % - P-Value of 0.15 plus for Youth Unemploymentindicating NO CORRELATION between Data% ARPU and Youth Unemployment.
Regression Testing only Year and Youth Unemployment
P-Value >> 0.05
NO CORRELATION BETWEEN YOUTH UNEMPLOYMENT ANDDATA % ARPU
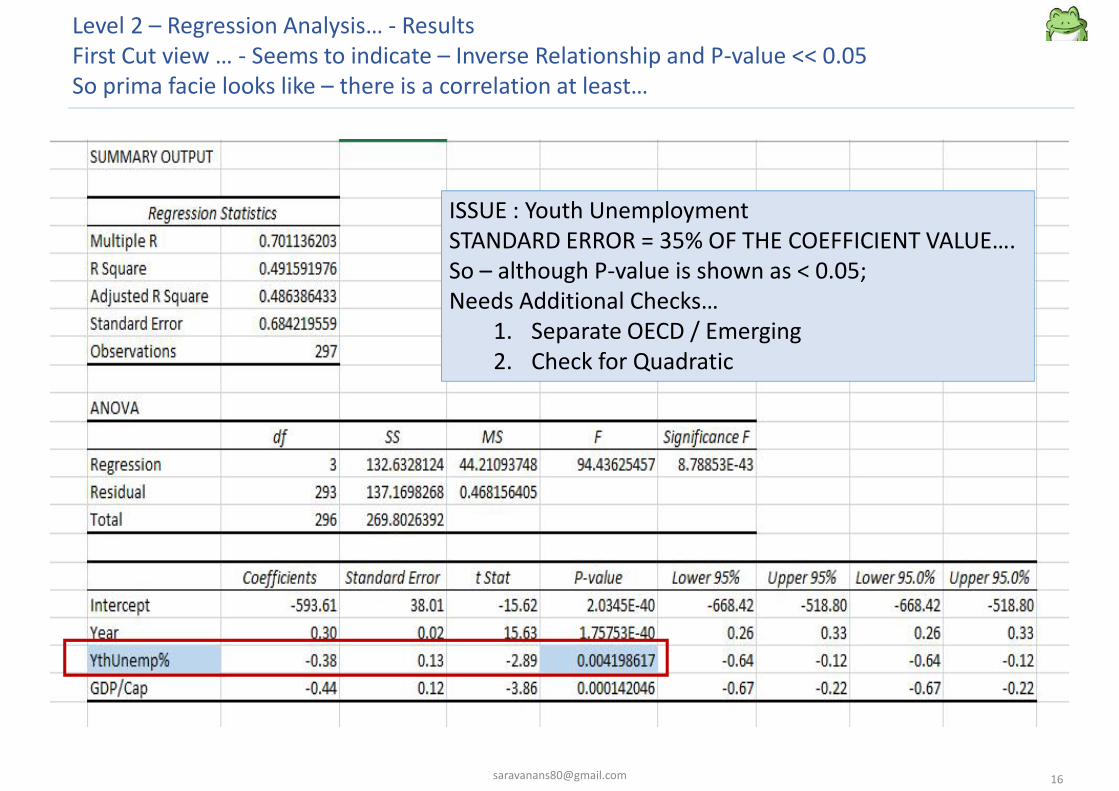
Level 2 – Regression Analysis… - ResultsFirst Cut view … - Seems to indicate – Inverse Relationship and P-value << 0.05So prima facie looks like – there is a correlation at least…
ISSUE : Youth UnemploymentSTANDARD ERROR = 35% OF THE COEFFICIENT VALUE….So – although P-value is shown as < 0.05;Needs Additional Checks…
1. Separate OECD / Emerging2. Check for Quadratic
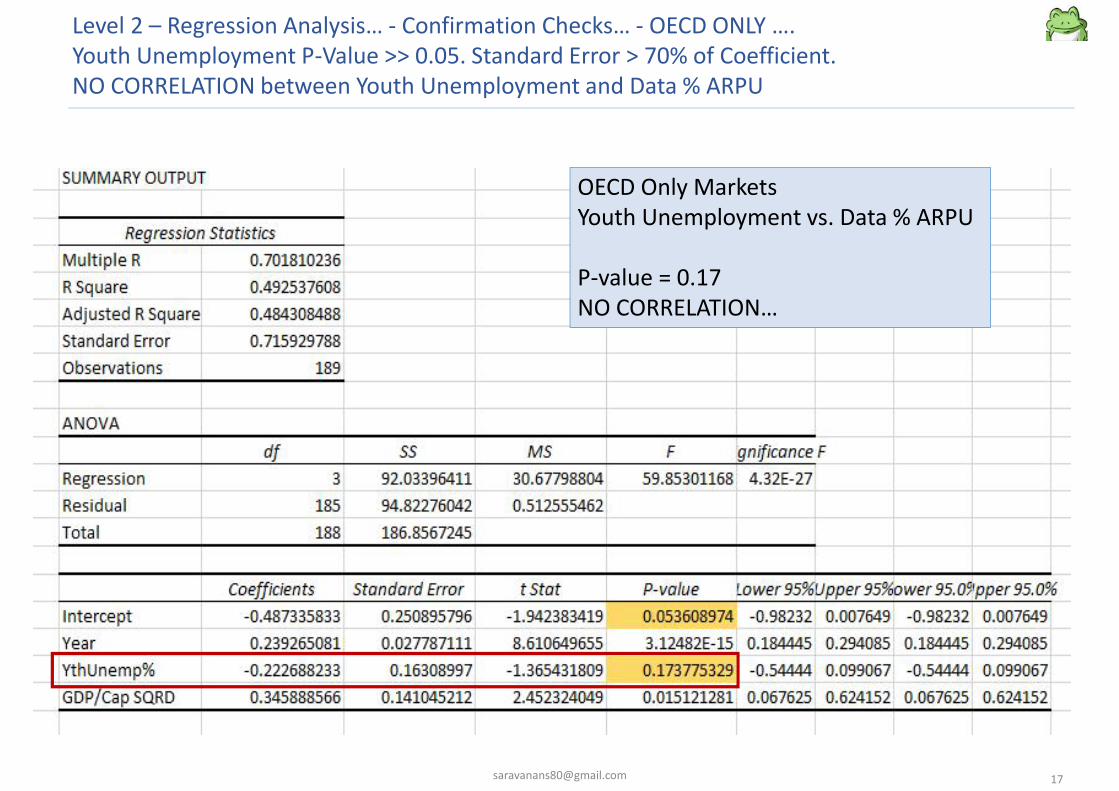
Level 2 – Regression Analysis… - Confirmation Checks… - OECD ONLY ….Youth Unemployment P-Value >> 0.05. Standard Error > 70% of Coefficient.NO CORRELATION between Youth Unemployment and Data % ARPU
OECD Only MarketsYouth Unemployment vs. Data % ARPU
P-value = 0.17NO CORRELATION…
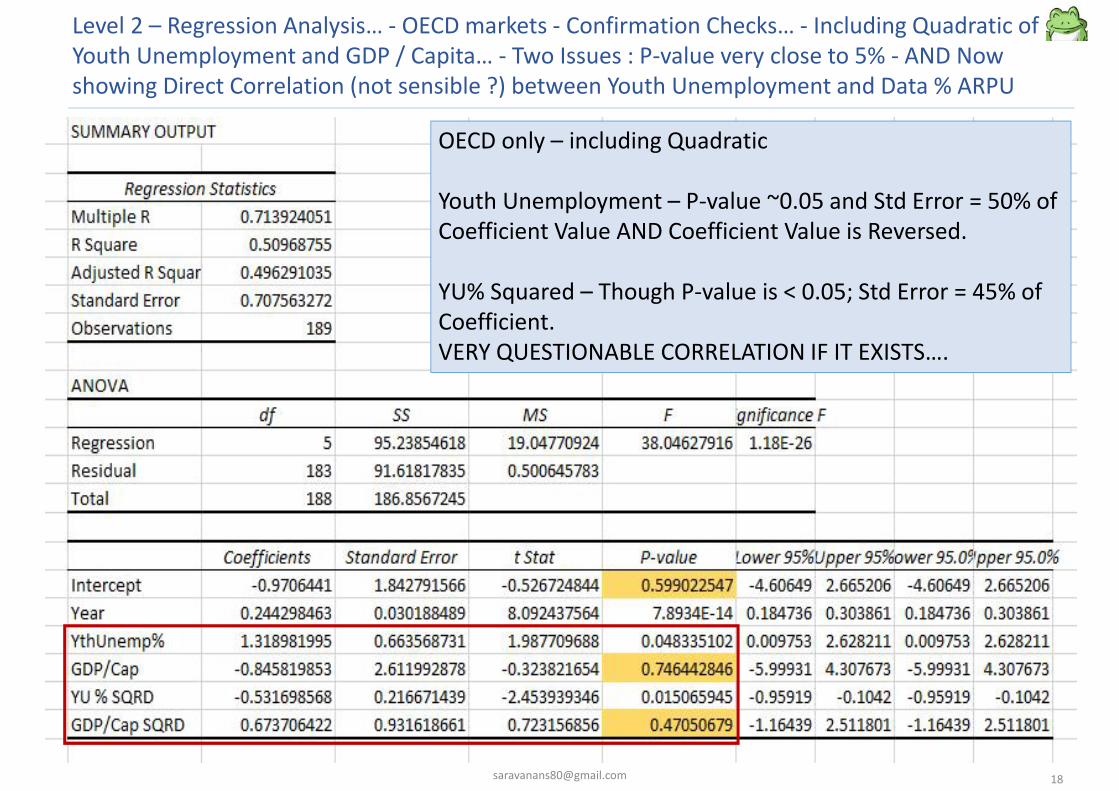
Level 2 – Regression Analysis… - OECD markets - Confirmation Checks… - Including Quadratic ofYouth Unemployment and GDP / Capita… - Two Issues : P-value very close to 5% - AND Nowshowing Direct Correlation (not sensible ?) between Youth Unemployment and Data % ARPU
OECD only – including Quadratic
Youth Unemployment – P-value ~0.05 and Std Error = 50% ofCoefficient Value AND Coefficient Value is Reversed.
YU% Squared – Though P-value is < 0.05; Std Error = 45% ofCoefficient.VERY QUESTIONABLE CORRELATION IF IT EXISTS….

Level 2 – Regression Analysis… - Emerging Market Confirmation Checks… using Year and YouthUnemployment only – P-value of 0.125 >> 0.05 No Correlation between Data % ARPU andYouth Unemployment.
Emerging Market – Year and Youth Unemployment only
P-value >> 0.05 – i.e. No Significant Correlation at allbetween Youth Unemployment and Data % ARPU

Level 2 – Regression Analysis… - Emerging Market Confirmation Checks… - Emerging Marketsonly // Youth Unemployment P-Value > 0.05. Standard Error > 70% of Coefficient.NO CORRELATION between Youth Unemployment and Data % ARPU
Emerging Market – including Quadratic – all 3parameters
Youth Unemployment and YU% Squared (quadratic) areboth having P-Value > 0.05..
Confirmed - No CORRELATION between YouthUnemployment and Data% ARPU in Emerging Markets
Further – even if the Youth Unemployment and GDP / Capita were to be accepted as“significant”; relative impact as per the Regression analysis – indicates that YouthUnemployment is only half as relevant as GDP/Cap and is 1/8th as impactful as Years….
50%
100%
150%
200%
250%
300%
350%
45% 75.0% 105.0% 135.0% 165.0% 195.0% 225.0% 255.0% 285.0%
Data % Growth vs. Youth Unemployment Change%
DELTA = 240%
DELTA = -(42%)
50%
100%
150%
200%
250%
300%
350%
2005 2006 2007 2008 2009 2010 2011 2012 2013
Data % Growth vs. YEARS
DELTA = +350%
DELTA = from 5 to 13 = ~ 260%
50%
100%
150%
200%
250%
300%
350%
90% 130.0% 170.0% 210.0% 250.0% 290.0% 330.0% 370.0% 410.0%
Data % Growth vs. GDP/Cap Growth %
DELTA = 320%
DELTA = -(67%)