Embed Size (px)
Citation preview

FACULTY BENEFITS COMMITTEE OVERVIEW
OF CONTRIBUTIONS REPORTMARCH 17, 2015

RECOMMENDATIONS 1REFINE DEFINITION OF EMPLOYEE CONTRIBUTION
Insurance Coverage Overall
Include New Fees as Part of the Employee Contribution
• Out of Pocket Expenses• Deductibles• Coinsurance• Surcharges
Penn State Contribution
73%
Employee Contribution
18%
Employee (Other)
9%
• Recommendation 1 provides that the university will include non traditional expenses (out of pocket expenses, deductibles, coinsurance and surcharges) in its calculation of employee contributions.

RECOMMENDATIONS 2REITERATING 1998 JOINT COMMITTEE ON BENEFITS AGREEMENT
Penn State Contribution
80%
Employee Contribution
20% Penn State Contribution
70%
Employee Contribution
30%
Insurance Coverage for Employees Insurance Coverage for Dependents
• Recommendation 2 asserts that the university should continue to support faculty benefits consistent with the principles established in the 1998 Joint Committee on Benefits agreement.

RECOMMENDATIONS 3: END STEEP SALARY INDEXINGFLAT BENEFITS CONTRIBUTIONS MODEL (2010)
0%
1%
2%
3%
4%
5%
6%
7%
8%
9%
10%
No Indexing (2010)
$0
$50
$100
$150
$200
$250
No Indexing (2010)
• In 2010 all employees paid a set contribution to participate in the university healthcare system.
Monthly Contribution Contribution as a Percent of Income

MODEST SALARY INDEXING BASED ON THE AUGUST 30, 2011 SENATE REPORT
• Employee contribution for healthcare based on annual base salary;
• Those making $45,000 or less will contribute the flat percentage as indicated on the chart;
• Those making over $45,000 will contribute a percentage that has been modeled by actuarial experts; the basic premise of the model is that the more an individual earns, the more the individual will pay toward healthcare;
• This model provides for a cap of the employee contribution at an annual base salary of $121,000;
• Monthly and annual savings for employees would be significant for the majority of faculty and staff based on this model.
• In August of 2011, the Faculty Benefits committee reported on a plan to index contributions to income.

RECOMMENDATIONS 3: END STEEP SALARY INDEXINGMODEST SALARY INDEXING MODEL (2012)
0%
1%
2%
3%
4%
5%
6%
7%
8%
9%
10%
No Indexing (2010) Modest Indexing (2012)
$0
$50
$100
$150
$200
$250
No Indexing (2010) Modest Indexing (2012)
• The August 2011 modest indexing plan was implemented in 2012.
Monthly Contribution Contribution as a Percent of Income
0%
1%
2%
3%
4%
5%
6%
7%
8%
9%
10%
Modest Indexing (2012) Steep Indexing (2014)
$0
$50
$100
$150
$200
$250
Modest Indexing (2012) Steep Indexing (2014)
RECOMMENDATIONS 3: END STEEP SALARY INDEXINGSTEEP SALARY INDEXING MODEL (2014)
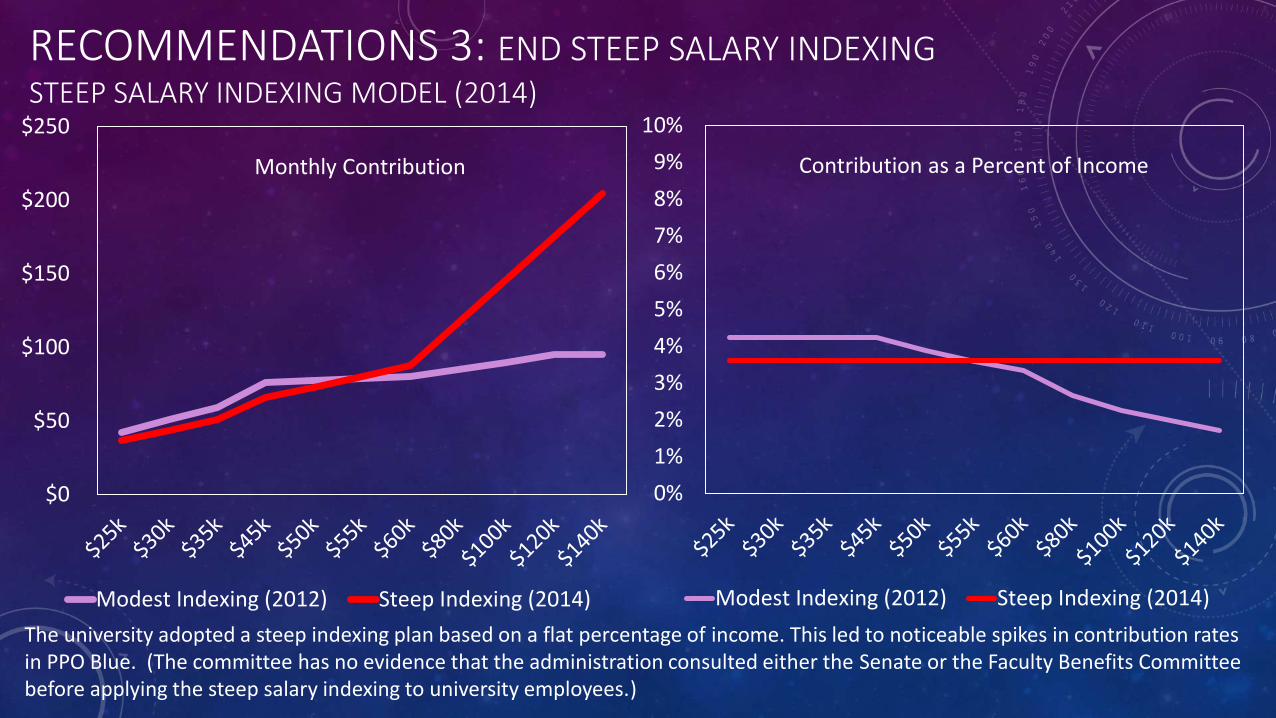
The university adopted a steep indexing plan based on a flat percentage of income. This led to noticeable spikes in contribution rates in PPO Blue. (The committee has no evidence that the administration consulted either the Senate or the Faculty Benefits Committee before applying the steep salary indexing to university employees.)
Monthly Contribution Contribution as a Percent of Income

RECOMMENDATIONS 3: END STEEP SALARY INDEXINGCALLS FOR A RETURN TO MODEST INDEXING PLAN
0%
1%
2%
3%
4%
5%
6%
7%
8%
9%
10%
Modest Indexing (2012)
$0
$50
$100
$150
$200
$250
Modest Indexing (2012)
• Recommendation 3 calls on the university to return to the modest indexing agreed to in 2011.
Monthly Contribution Contribution as a Percent of Income
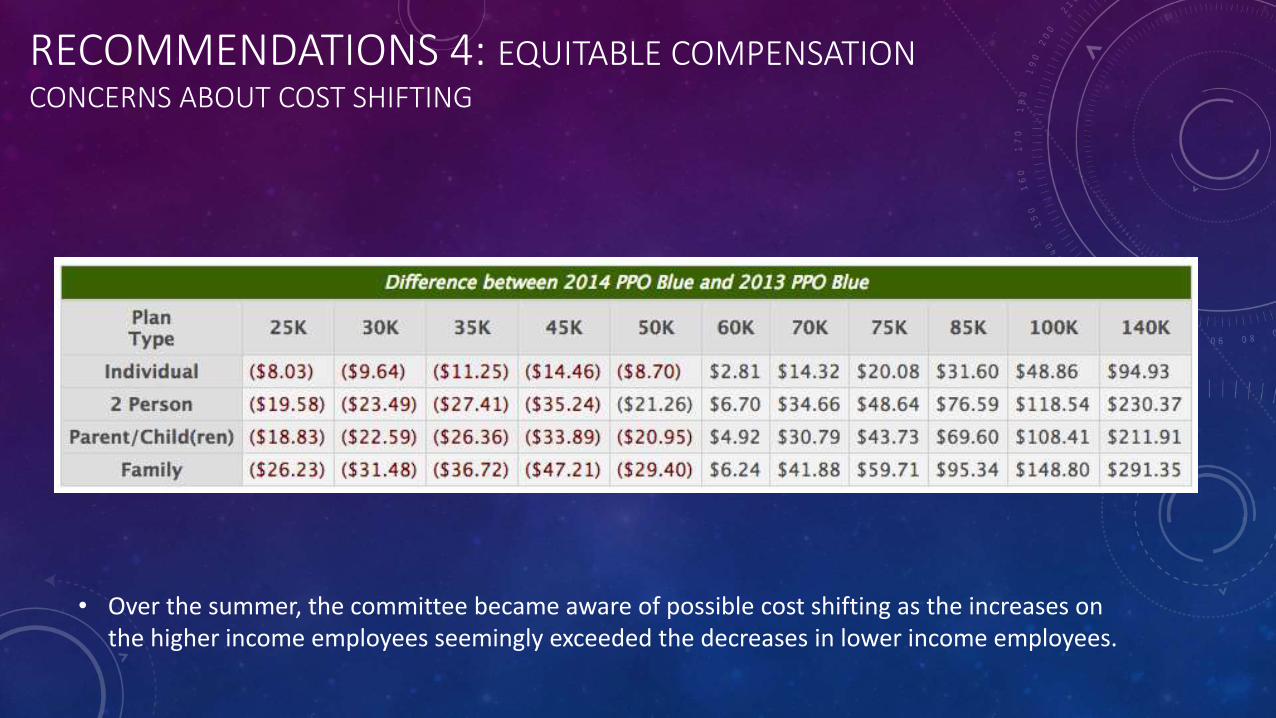
• Over the summer, the committee became aware of possible cost shifting as the increases on the higher income employees seemingly exceeded the decreases in lower income employees.
RECOMMENDATIONS 4: EQUITABLE COMPENSATIONCONCERNS ABOUT COST SHIFTING

Income 25K 30K 35K 45K 50K 60K 70K 75K 85K 100K 140K Total
PPO Blue
Employee Only -$40,000 -$50,000 -$130,000 -$57,000 -$31,000 $46,000 $37,000 $78,000 $108,000 $203,000 $196,000 $360,000
Employee + Spouse -$22,000 -$37,000 -$116,000 -$55,000 -$24,000 $43,000 $44,000 $96,000 $159,000 $405,000 $395,000 $888,000
Employee + Child(ren) -$15,000 -$30,000 -$81,000 -$29,000 -$19,000 $26,000 $21,000 $45,000 $73,000 $128,000 $76,000 $195,000
Family -$62,000 -$92,000 -$295,000 -$130,000 -$78,000 $130,000 $104,000 $290,000 $449,000 $870,000 $675,000 $1,861,000
Subtotal -$139,000 -$209,000 -$622,000 -$271,000 -$152,000 $245,000 $206,000 $509,000 $789,000 $1,606,000 $1,342,000 $3,304,000
Income 25K 30K 35K 45K 50K 60K 70K 75K 85K 100K 140K Total
PPO Blue
Employee Only
-$1,393,000.00 $4,697,000.00
360,000
Employee + Spouse 888,000
Employee + Child(ren) 195,000
Family 1,861,000
Subtotal (139,000) (209,000) (622,000) (271,000) (152,000) 245,000 206,000 509,000 789,000 1,606,000 1,342,000 3,304,000
RECOMMENDATIONS 4: EQUITABLE COMPENSATIONINCREASES DID INDEED EXCEED DECREASES IN PPO BLUE
• HR confirmed that in 2014, the University raised rates in the PPO Blue plan by $3.3 million.
Income 25K 30K 35K 45K 50K 60K 70K 75K 85K 100K 140K Total
PPO Blue
Employee Only
-$1,393,000.00 $4,697,000.00
360,000
Employee + Spouse 888,000
Employee + Child(ren) 195,000
Family 1,861,000
Subtotal (139,000) (209,000) (622,000) (271,000) (152,000) 245,000 206,000 509,000 789,000 1,606,000 1,342,000 3,304,000
RECOMMENDATIONS 4: EQUITABLE COMPENSATIONWHERE DID THE MONEY GO?
PPO Savings
Employee Only
-$760,000.00 -$2,310,000.00
(503,000)
Employee + Spouse (416,000)
Employee + Child(ren) (172,000)
Family (1,979,000)
Subtotal (36,000) (63,000) (234,000) (151,000) (276,000) (318,000) (176,000) (318,000) (376,000) (651,000) (471,000) (3,070,000)
Total (175,000) (272,000) (856,000) (422,000) (428,000) (73,000) 30,000 191,000 413,000 955,000 871,000 234,000
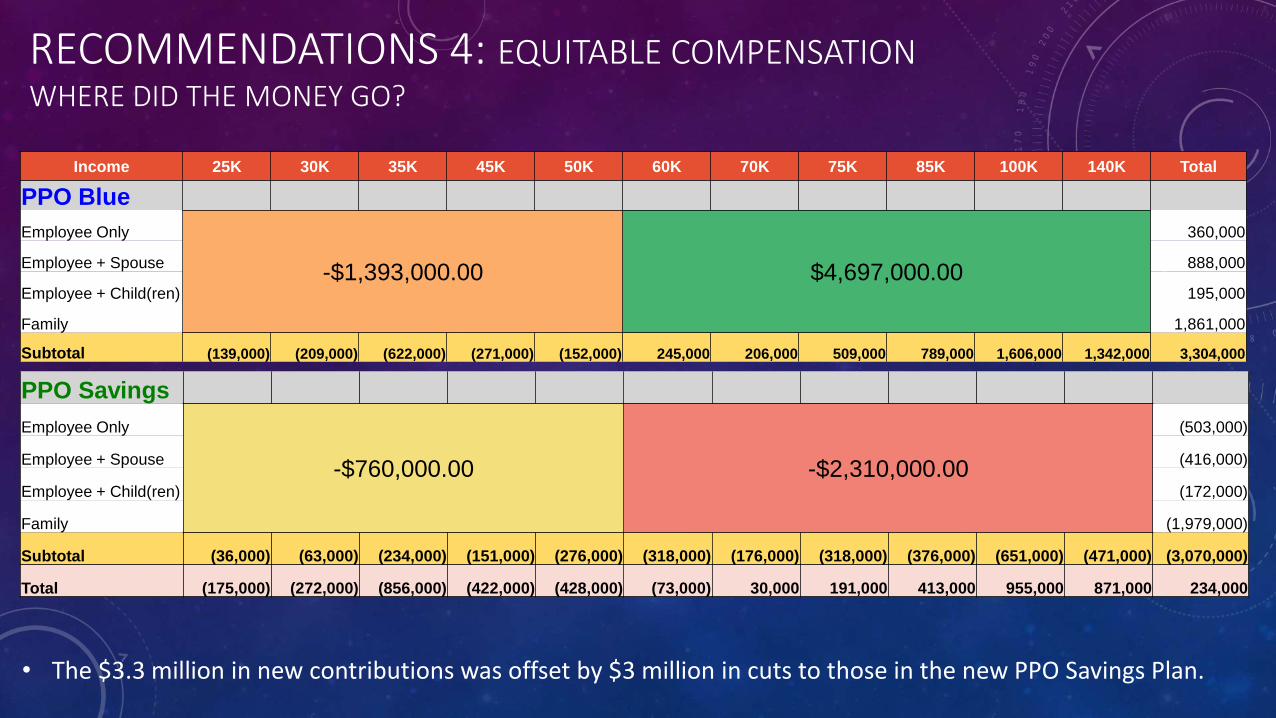
• The $3.3 million in new contributions was offset by $3 million in cuts to those in the new PPO Savings Plan.

Roughly $3 million in higher premiums paid by most PPO Blue members is effectively subsidizing (with artificially low contribution rates) the 17% of university employees in the PPO Savings plan.
PPO BlueTraditionalInsurance
83%*
PPO Savings
High DeductibleInsurance
17%*
RECOMMENDATIONS 4: EQUITABLE COMPENSATIONTHE IMPACT OF THE COST SHIFTING
$
*Approximate percentage of employees in each health insurance system.

Employees Earning $140k PSU Employee
Plan Type True Cost Contribution Contribution
Individual only $515.04 $310.87 $204.17
Two Person $1,159.25 $663.42 $495.83
Parent/Child(ren) $1,115.78 $656.11 $459.67
Family $1,494.18 $860.68 $633.50
CALCULATING PENN STATE’S TRUE CONTRIBUTION
True Cost = $515.04 per month
Employee Contribution = $204.17 per month
PSU’s Contribution = $310.87 per month
• To assess the cost shifting, the committee calculated the university’s per person contribution by subtracting the employee contribution from the true cost of the insurance.
PROVIDING FOR EQUITABLE COMPENSATIONPlan by Income Bracket
Employees Earning $25,000Plan Type
Individual only
Two Person
Parent/Child(ren)
Family
Employees Earning $60,000Plan Type
Individual only
Two Person
Parent/Child(ren)
Family
Employees Earning $100,000Plan Type
Individual only
Two Person
Parent/Child(ren)
Family
Employees Earning $140kPlan Type
Individual only
Two Person
Parent/Child(ren)
Family
PSU Employee
True Cost Contribution Contribution Emp %
$515.04 $478.58 $36.46 7.1%
$1,159.25 $1,070.71 $88.54 7.6%
$1,115.78 $1,033.70 $82.08 7.4%
$1,494.18 $1,381.05 $113.13 7.6%
PSU Employee
True Cost Contribution Contribution Emp %
$515.04 $427.54 $87.50 17.0%
$1,159.25 $946.75 $212.50 18.3%
$1,115.78 $918.78 $197.00 17.7%
$1,494.18 $1,222.68 $271.50 18.2%
PSU Employee
True Cost Contribution Contribution Emp %
$515.04 $369.21 $145.83 28.3%
$1,159.25 $805.08 $354.17 30.6%
$1,115.78 $787.45 $328.33 29.4%
$1,494.18 $1,041.68 $452.50 30.3%
PSU Employee
True Cost Contribution Contribution Emp %
$515.04 $310.87 $204.17 39.6%
$1,159.25 $663.42 $495.83 42.8%
$1,115.78 $656.11 $459.67 41.2%
$1,494.18 $860.68 $633.50 42.4%
PPO Blue (Current)
PSU Employee
True Cost Contribution Contribution Emp %
$461.62 $451.20 $10.42 2.3%
$1,030.67 $1,005.46 $25.21 2.4%
$994.52 $971.19 $23.33 2.3%
$1,309.18 $1,276.89 $32.29 2.5%
PSU Employee
True Cost Contribution Contribution Emp %
$461.62 $436.62 $25.00 5.4%
$1,030.67 $970.17 $60.50 5.9%
$994.52 $938.52 $56.00 5.6%
$1,309.18 $1,231.68 $77.50 5.9%
PSU Employee
True Cost Contribution Contribution Emp %
$461.62 $419.95 $41.67 9.0%
$1,030.67 $929.84 $100.83 9.8%
$994.52 $901.19 $93.33 9.4%
$1,309.18 $1,180.01 $129.17 9.9%
PSU Employee
True Cost Contribution Contribution Emp %
$461.62 $403.29 $58.33 12.6%
$1,030.67 $859.50 $171.17 16.6%
$994.52 $863.85 $130.67 13.1%
$1,309.18 $1,128.35 $180.83 13.8%
PPO Savings (Current)
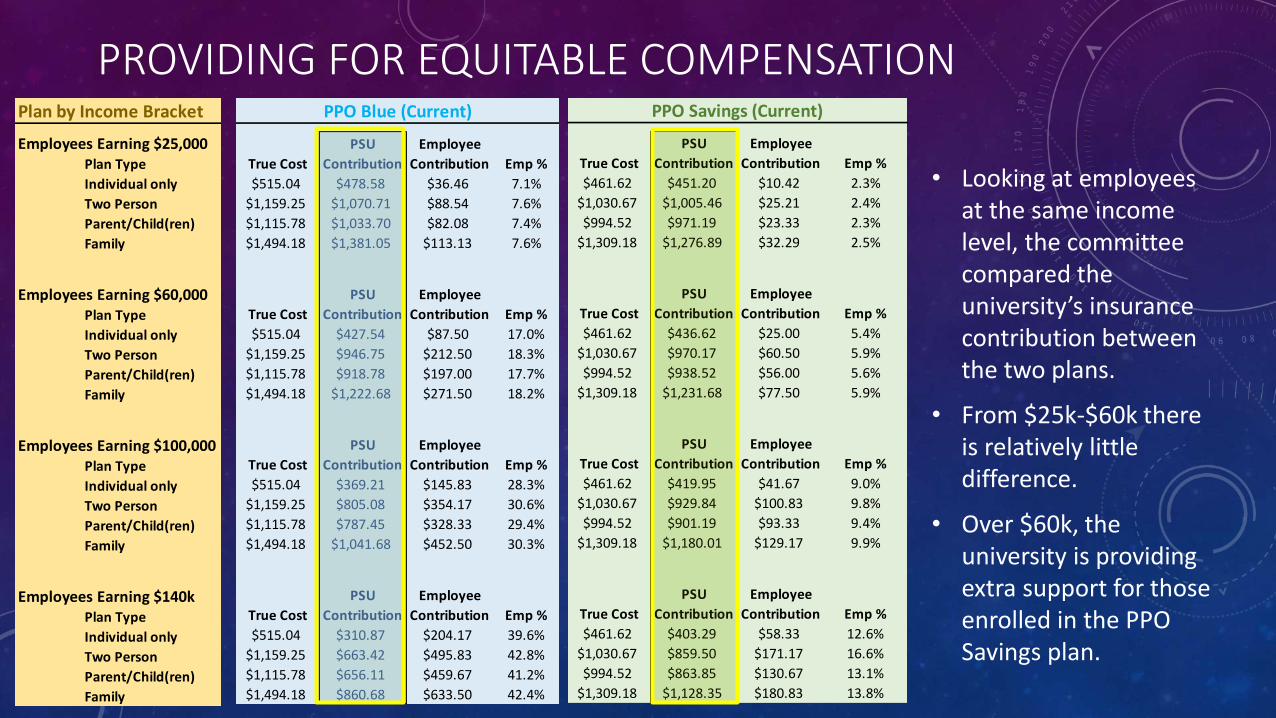
• Looking at employees at the same income level, the committee compared the university’s insurance contribution between the two plans.
• From $25k-$60k there is relatively little difference.
• Over $60k, the university is providing extra support for those enrolled in the PPO Savings plan.

INCENTIVIZING EMPLOYEES TO ABANDON TRADITIONAL HEALTH INSURANCE
Employees Earning $140kPlan Type
Individual only
Two Person
Parent/Child(ren)
Family
PSU Employee
True Cost Contribution Contribution
$515.04 $310.87 $204.17
$1,159.25 $663.42 $495.83
$1,115.78 $656.11 $459.67
$1,494.18 $860.68 $633.50
PSU Employee
True Cost Contribution Contribution
$461.62 $403.29 $58.33
$1,030.67 $859.50 $171.17
$994.52 $863.85 $130.67
$1,309.18 $1,128.35 $180.83
PSU Contribution PSU Contribution
Blue vs. Savings Blue vs. Savings
-$92.42 -$1,109.04
-$196.08 -$2,352.96
-$207.74 -$2,492.88
-$267.67 -$3,212.04
PPO Blue (Traditional) PPO Savings (High Deductible)
Employees Earning $140kPlan Type
Individual only
Two Person
Parent/Child(ren)
Family
• The greatest gap falls at or above the $140k level. The university is providing an extra $1100-$3200 compensation for those enrolled in the PPO Savings plan.
Diff Monthly Diff Yearly

PROVIDING FOR EQUITABLE COMPENSATION
4.3 Eliminating the Differences in Penn State Contributions by Health Plan and Income*
Plan by Income Bracket Monthly Difference Annual Difference
Employees Earning $25,000 PSU Employee PSU Employee PSU Contribution PSU Contribution
Plan Type True Cost Contribution Contribution Emp % True Cost Contribution Contribution Emp % Blue vs. Savings Blue vs. Savings
Individual only $515.04 $476.14 $38.90 7.6% $461.62 $476.14 -$14.52** -3.1% $0.00 $0.00
Two Person $1,159.25 $1,064.90 $94.35 8.1% $1,030.67 $1,064.90 -$34.23** -3.3% $0.00 $0.00
Parent/Child(ren) $1,115.78 $1,028.13 $87.65 7.9% $994.52 $1,028.13 -$33.61** -3.4% $0.00 $0.00
Family $1,494.18 $1,371.78 $122.40 8.2% $1,309.18 $1,371.78 -$62.60** -4.8% $0.00 $0.00
Employees Earning $60,000 PSU Employee PSU Employee PSU Contribution PSU Contribution
Plan Type True Cost Contribution Contribution Emp % True Cost Contribution Contribution Emp % Blue vs. Savings Blue vs. Savings
Individual only $515.04 $429.14 $85.90 16.7% $461.62 $429.14 $32.48 7.0% $0.00 $0.00
Two Person $1,159.25 $950.87 $208.38 18.0% $1,030.67 $950.87 $79.80 7.7% $0.00 $0.00
Parent/Child(ren) $1,115.78 $922.26 $193.52 17.3% $994.52 $922.26 $72.26 7.3% $0.00 $0.00
Family $1,494.18 $1,224.26 $269.92 18.1% $1,309.18 $1,224.26 $84.92 6.5% $0.00 $0.00
Employees Earning $100,000 PSU Employee PSU Employee PSU Contribution PSU Contribution
Plan Type True Cost Contribution Contribution Emp % True Cost Contribution Contribution Emp % Blue vs. Savings Blue vs. Savings
Individual only $515.04 $384.07 $130.97 25.4% $461.62 $384.07 $77.55 16.8% $0.00 $0.00
Two Person $1,159.25 $841.63 $317.62 27.4% $1,030.67 $841.63 $189.04 18.3% $0.00 $0.00
Parent/Child(ren) $1,115.78 $820.77 $295.01 26.4% $994.52 $820.77 $173.75 17.5% $0.00 $0.00
Family $1,494.18 $1,082.20 $411.98 27.6% $1,309.18 $1,082.20 $226.98 17.3% $0.00 $0.00
Employees Earning $140,000 PSU Employee PSU Employee PSU Contribution PSU Contribution
Plan Type True Cost Contribution Contribution Emp % True Cost Contribution Contribution Emp % Blue vs. Savings Blue vs. Savings
Individual only $515.04 $343.60 $171.44 33.3% $461.62 $343.60 $118.02 25.6% $0.00 $0.00
Two Person $1,159.25 $732.86 $426.39 36.8% $1,030.67 $732.86 $297.81 28.9% $0.00 $0.00
Parent/Child(ren) $1,115.78 $729.68 $386.10 34.6% $994.52 $729.68 $264.84 26.6% $0.00 $0.00
Family $1,494.18 $955.47 $538.71 36.1% $1,309.18 $955.47 $353.71 27.0% $0.00 $0.00
PPO Blue (Revised) PPO Savings (Revised) • Recommendation 4 proposes that the university provide equitable compensation to all employees within the same income bracket.
• Regardless of their chosen plan, the university would provide identical support for employees at the same income bracket.
• Table 4.3 estimates the impact of ending the indirect subsidy of the PPO Savings plan.

PSU Employee
True Cost Contribution Contribution
$515.04 $343.60 $171.44
$1,159.25 $732.86 $426.39
$1,115.78 $729.68 $386.10
$1,494.18 $955.47 $538.71
Employees Earning $140kPlan Type
Individual only
Two Person
Parent/Child(ren)
Family
PSU Employee
True Cost Contribution Contribution
$461.62 $343.60 $118.02
$1,030.67 $732.86 $297.81
$994.52 $729.68 $264.84
$1,309.18 $955.47 $353.71
Employees Earning $140kPlan Type
Individual only
Two Person
Parent/Child(ren)
Family
PSU Contribution PSU Contribution
Blue vs. Savings Blue vs. Savings
$0.00 $0.00
$0.00 $0.00
$0.00 $0.00
$0.00 $0.00
PPO Blue (Traditional) PPO Savings (High Deductible)
Diff Monthly Diff Yearly• Ending the indirect subsidy of
the PPO Savings plan would permit contributions to reflect market prices.
• Without the subsidy, the PPO Savings plan would increase in price, but still remain less expensive overall.
RECOMMENDATIONS 4: EQUITABLE COMPENSATIONENDING COST SHIFTING BETWEEN PPO BLUE AND PPO SAVINGS

Plan by Income Bracket
Employees Earning $25,000Plan Type
Individual only
Two Person
Parent/Child(ren)
Family
Employees Earning $60,000Plan Type
Individual only
Two Person
Parent/Child(ren)
Family
Employees Earning $100,000Plan Type
Individual only
Two Person
Parent/Child(ren)
Family
Employees Earning $140kPlan Type
Individual only
Two Person
Parent/Child(ren)
Family
PSU Employee
True Cost Contribution Contribution Emp %
$515.04 $478.58 $36.46 7.1%
$1,159.25 $1,070.71 $88.54 7.6%
$1,115.78 $1,033.70 $82.08 7.4%
$1,494.18 $1,381.05 $113.13 7.6%
PSU Employee
True Cost Contribution Contribution Emp %
$515.04 $427.54 $87.50 17.0%
$1,159.25 $946.75 $212.50 18.3%
$1,115.78 $918.78 $197.00 17.7%
$1,494.18 $1,222.68 $271.50 18.2%
PSU Employee
True Cost Contribution Contribution Emp %
$515.04 $369.21 $145.83 28.3%
$1,159.25 $805.08 $354.17 30.6%
$1,115.78 $787.45 $328.33 29.4%
$1,494.18 $1,041.68 $452.50 30.3%
PSU Employee
True Cost Contribution Contribution Emp %
$515.04 $310.87 $204.17 39.6%
$1,159.25 $663.42 $495.83 42.8%
$1,115.78 $656.11 $459.67 41.2%
$1,494.18 $860.68 $633.50 42.4%
PPO Blue (Current)
PSU Employee
True Cost Contribution Contribution Emp %
$461.62 $451.20 $10.42 2.3%
$1,030.67 $1,005.46 $25.21 2.4%
$994.52 $971.19 $23.33 2.3%
$1,309.18 $1,276.89 $32.29 2.5%
PSU Employee
True Cost Contribution Contribution Emp %
$461.62 $436.62 $25.00 5.4%
$1,030.67 $970.17 $60.50 5.9%
$994.52 $938.52 $56.00 5.6%
$1,309.18 $1,231.68 $77.50 5.9%
PSU Employee
True Cost Contribution Contribution Emp %
$461.62 $419.95 $41.67 9.0%
$1,030.67 $929.84 $100.83 9.8%
$994.52 $901.19 $93.33 9.4%
$1,309.18 $1,180.01 $129.17 9.9%
PSU Employee
True Cost Contribution Contribution Emp %
$461.62 $403.29 $58.33 12.6%
$1,030.67 $859.50 $171.17 16.6%
$994.52 $863.85 $130.67 13.1%
$1,309.18 $1,128.35 $180.83 13.8%
PPO Savings (Current)
• Using the table (Left) as a model, Recommendation 5 requires HR to provide an annual report on the per dollar support for health insurance by income bracket and by health plan.
• This creates transparency, revealing if the university is providing extra compensation to employees enrolled in a favored insurance plan.
RECOMMENDATIONS 5: REPORTING REQUIREMENTREQUIRES HR TO REPORT ON PER DOLLAR SUPPORT


![[jodi & monica] Research Proposal Presentaiton](https://img.pdfslide.us/doc/110x75/577cc4df1a28aba7119aba27/jodi-monica-research-proposal-presentaiton.jpg)