Embed Size (px)
Citation preview

VDC Research WebcastVDC Research Webcast
Staying Ahead of the Joneses:Retail Automation in 2010Retail Automation in 2010
July 2010
AutoID & Transaction Automation PracticeChris Rezendes, Executive Vice President
July 2010
,

Recording Available
These slides are from a webcast presented on 07/28/10. p
A full audio recording is available for download at:
http://www.vdcresearch.com/market_research/autoid/freeresearch.aspx#
1 – 2010 VDC Research Group, Inc.Auto ID & Transaction Automation Practice

VDC Research
Complimentary insights & marketing data on the retail and transaction p y g gautomation technology markets is available at:
www vdcresearch comwww.vdcresearch.com
2 – 2010 VDC Research Group, Inc.Auto ID & Transaction Automation Practice

Today’s Speakers
• Chris Rezendes, Executive Vice President, Chris has 19 years experience in embedded, industrial, defense and other mission
critical and high available technology industries
He has more than 14 years experience in senior management and leadership positions at a number of IT systems and professional services organizations
During that time Chris has initiated or expanded coverage of a number of markets that VDC covers today
Ch i h d i d f h l d d h l i Chris has advised many of the largest and most respected technology companies in a number of technology segments worldwide
Chris is a graduate of Harvard University
3 – 2010 VDC Research Group, Inc.Auto ID & Transaction Automation Practice
Recalling Our Context … Still Turbulent
Consumer Demand for Value and
Disposable Income and Value and
ServiceConsumer Credit
Point of Service:Delivery
Point ofDecision
Point of Service:
Selection
Point of Sale
Decision/ Service and Sale Merging Functionallyg g y
Fragmenting Physically
4 – 2010 VDC Research Group, Inc.Auto ID & Transaction Automation Practice
Operate in One Niche, Deal With Them All …
• The retail market continues to pulse with fragmentation and consolidation in parallel, Traditional values in service and next generation business models
So too do the markets for retail automation technologies
• The technologies supporting retailers might be thought of within the context of traditional, ne t gen or bridgingnext-gen, or bridging POS terminals might generally be considered ‘traditional’
IDDS is one of the most challenging ‘next gen’ retail solutions
And many other technologies , including Kiosks, might be considered ‘bridging’And many other technologies , including Kiosks, might be considered bridging
• And as retailers make decisions about investing in one technology or another, ROI comparisons across technologies are forcing niche suppliers to deal with broader market implications – and broad-line suppliers to carefully modify their approaches They are being compared much more often today than 5 years agoThey are being compared much more often today than 5 years ago
When they are installed, they are being integrated much more often than 5 years ago
• Retail automation suppliers need frameworks to balance the need to focus with the need to operate successfully in these complex contexts
• We are going to focus on POS Terminals, Kiosks and IDDS to illustrate these ideas
5 – 2010 VDC Research Group, Inc.Auto ID & Transaction Automation Practice

Survey Demographics – Big Chairs, Mixed Roles
• High citation rate of top execs is largely, Survey Respondent Title That Best D ib C t P iti but not completely, indicative of many
lower Tier organizations in the sample
• More than a few top executives from Tier 2 accounts responded to the survey …
VP Operations
5.1%
CIO2.6%
CFO / VP of Finance
1.6%
Describes Current Position
reinforcing the thesis that a range of retail automation investments are Becoming more strategic than operational; and
Within the operational domain, more criticalNon-IT Director /
Other10.0%
• The Non-IT Directors include a mix of front-end and back-end managers Logistics
Marketing
Director / Manager
33.1%
IT Director / Manager
22.5% g
Merchandising
PromotionsPresident /
CEO / Owner25.1%
6 – 2010 VDC Research Group, Inc.Auto ID & Transaction Automation Practice
Survey Demographics – Bit of a Skew to Tier 2
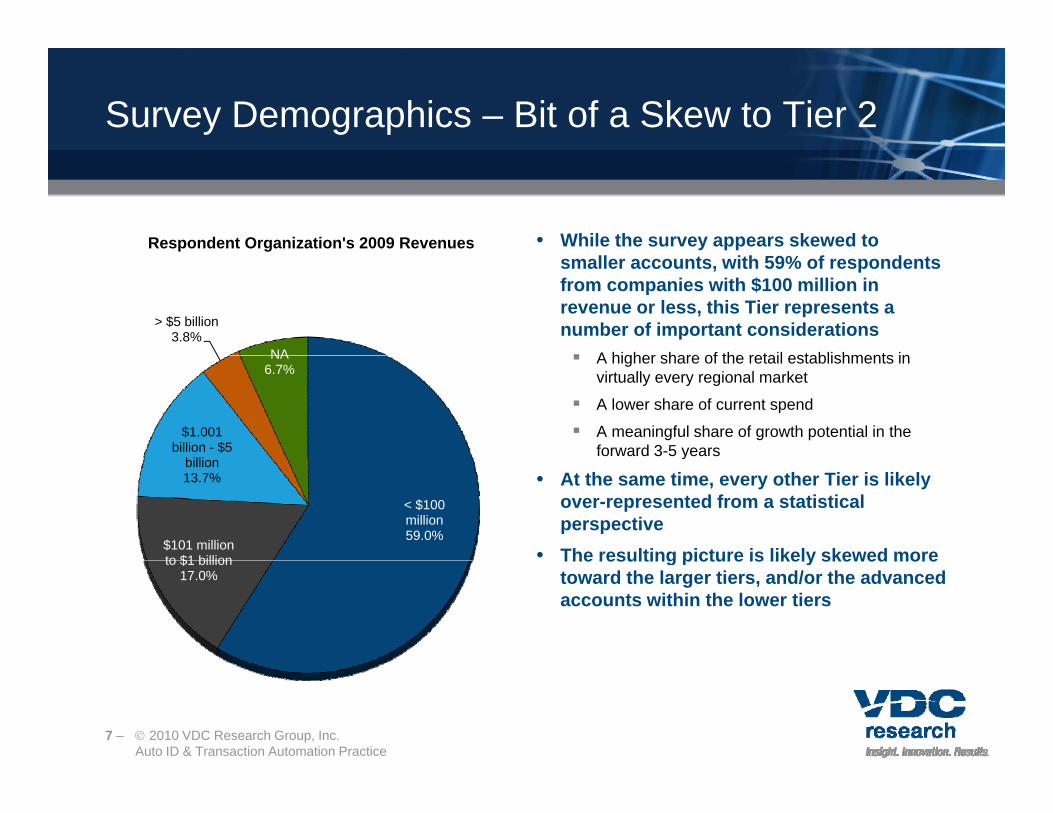
• While the survey appears skewed to Respondent Organization's 2009 Revenuessmaller accounts, with 59% of respondents from companies with $100 million in revenue or less, this Tier represents a number of important considerations A higher share of the retail establishments in
> $5 billion3.8%
NA A higher share of the retail establishments in virtually every regional market
A lower share of current spend
A meaningful share of growth potential in the forward 3-5 years
$1.001 billion - $5
billi
NA6.7%
y
• At the same time, every other Tier is likely over-represented from a statistical perspective
• The resulting picture is likely skewed more
< $100 million59.0%
$101 million to $1 billion
billion13.7%
The resulting picture is likely skewed more toward the larger tiers, and/or the advanced accounts within the lower tiers
to $1 billion17.0%
7 – 2010 VDC Research Group, Inc.Auto ID & Transaction Automation Practice

Survey Demographics – Broad vertical sample
Respondent Organization Classification • The retail segment mix is affording us the
Drug Store/
Mass Merchant
4.2%
Gasoline/ Petrol/
Convenience Store4.0%
Lodging3.0%
opportunity to explore some trending on specific technologies in niche markets
• Specialty continues to be producing upbeat performance. If this continues, t h l li ill d
Other15.1%
Dining
Drug Store/ Pharmacy
5.1%
technology suppliers will need more visibility here
• Department stores are leading the charge with respect to ‘changing the rules’ to draw and convert What technologies are
Department Store12.1%
Specialty
DIY/ Home Improvement
6.7%
Dining6.5%
draw and convert. What technologies are they relying on?
p yHard Goods
12.0%
Grocery/ Supermarket
9.0%Entertainment7.6%
Specialty Soft Goods
7.6%
Travel7.2%
6%
8 – 2010 VDC Research Group, Inc.Auto ID & Transaction Automation Practice
Current /Planned Usage – Solid Next-gen Growth
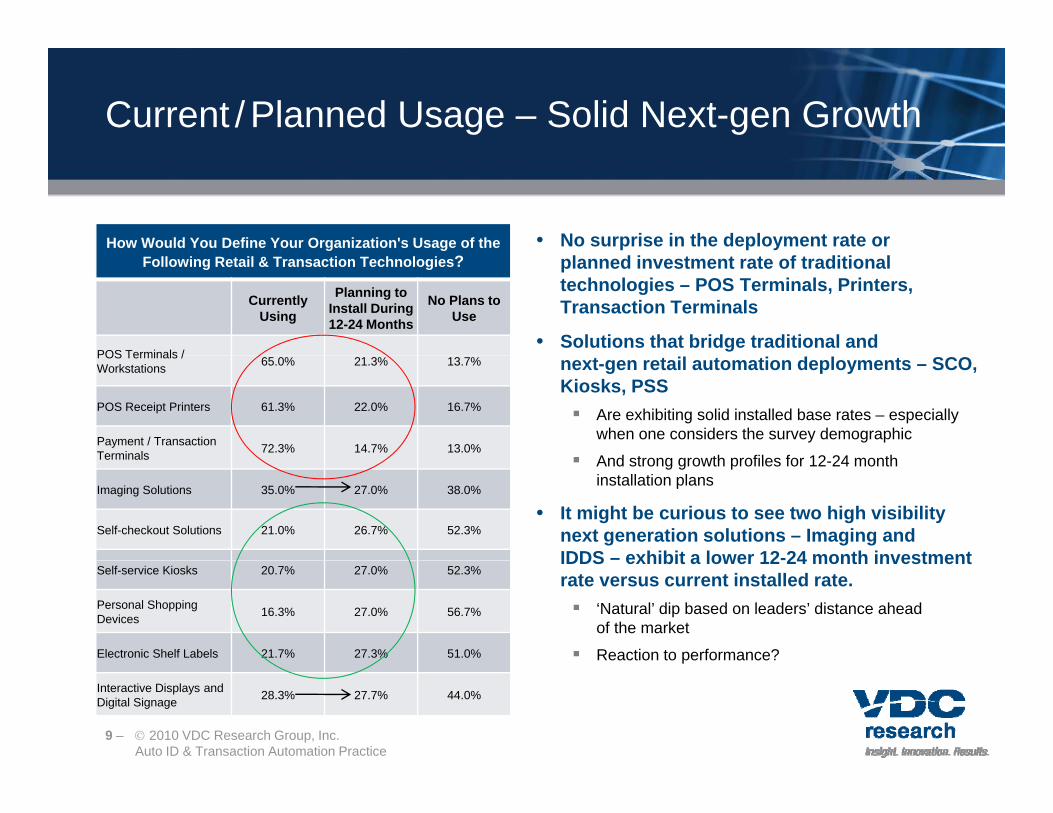
• No surprise in the deployment rate or How Would You Define Your Organization's Usage of the planned investment rate of traditional technologies – POS Terminals, Printers, Transaction Terminals
• Solutions that bridge traditional and
Following Retail & Transaction Technologies?
Currently Using
Planning to Install During 12-24 Months
No Plans to Use
POS Terminals / next-gen retail automation deployments – SCO, Kiosks, PSS Are exhibiting solid installed base rates – especially
when one considers the survey demographic
And strong gro th profiles for 12 24 month
POS Terminals / Workstations 65.0% 21.3% 13.7%
POS Receipt Printers 61.3% 22.0% 16.7%
Payment / Transaction Terminals 72.3% 14.7% 13.0%
And strong growth profiles for 12-24 month installation plans
• It might be curious to see two high visibility next generation solutions – Imaging and IDDS – exhibit a lower 12-24 month investment
Terminals
Imaging Solutions 35.0% 27.0% 38.0%
Self-checkout Solutions 21.0% 26.7% 52.3%
IDDS exhibit a lower 12 24 month investment rate versus current installed rate. ‘Natural’ dip based on leaders’ distance ahead
of the market
Reaction to performance?
Self-service Kiosks 20.7% 27.0% 52.3%
Personal Shopping Devices 16.3% 27.0% 56.7%
Electronic Shelf Labels 21.7% 27.3% 51.0% p
Interactive Displays and Digital Signage 28.3% 27.7% 44.0%
9 – 2010 VDC Research Group, Inc.Auto ID & Transaction Automation Practice

Investment Being Driven by Metrics
• This data was collected in Q2 2010 … What Were the Primary Adoption Drivers for Your Organization's Retail & during the past 45 days!
• Cost reduction is still the number 1 driver –an indicator that retailers have no visibility to stability?
3.95
O
Cost Savings
for Your Organization s Retail & Transaction Automation Technologies?
• Operations improvement – a fuzzy term –continues to rise on these lists of drivers. It is being driven in part by advances in business intelligence (BI) solutions3.49
3.73
3.90
Customer Empowerment
Sales Uplift
Operations Improvement
• Sales uplift, rated #3, and the only other factor with a rating higher than 3.5 on a 5.0 scale, remains the elusive, holy grail of ROI for many of these solutions3.20
3.32
Multi-Channel Synchronization
Industry Compliance
• Compliance – both customer and government – received relatively low ratings. This, and a relative absence of reference to PCI, leads us to believe that thi i t d i i t i l i t t
2.98
3.17
0 1 2 3 4 5
DKN
Government Compliance
this is not driving material investment 0 1 2 3 4 5
10 – 2010 VDC Research Group, Inc.Auto ID & Transaction Automation Practice
Scale: 1=Low / 5=High

High Cost & Fuzzy ROI Still Holding Markets Back
• ‘Cost’ and ‘No Clear ROI’ were the two Primary Barrier to Investment Comparison most often cited barriers to adoption of
ALL THREE comparison technologies
• However, the rates of citation for POS were much lower than those for Kiosk and IDDS
Primary Barrier to Investment Comparison
POS Terminals Kiosks IDDS
• Another coupled pair of barriers showed up with fair – regularity Compatibility with existing infrastructure
Integration complexity
Cost 1 2 1
No Clear 2 1 2 Integration complexity
• Lack of financing citation in POS as sign of maturity of that market? Commoditization?
• The Kiosk market continues to be plagued b b f i ‘T h l
ROI 2 1 2
• Compatibility w/ Existing Infrastructure
P d t
• Integration Complexity
• Compatibility / E i ti
• Integration Complexity
• Training or Oth by a number of issues – ‘Technology
Immaturity’ – one would not expect from a technology with such age and installed base
• IDDS citation of ‘Training / Other Operational’ i lik l fi i k
Other
• Product Availability
• Lack ofAcceptable Financing
w/ Existing Infrastructure
• Technology Immaturity
Other Operational Hurdles
• Compatibility w/ Existing Infrastructure
is likely confirming a known
11 – 2010 VDC Research Group, Inc.Auto ID & Transaction Automation Practice
Scale: 1=Low / 5=High

Product Selection Driver Comparison
• The table shows the five highest and lowest Leading Product Selection Criteria Comparisonrated product selection criteria against a pre-defined list
• How are these markets behaving similarly? Durability of the solution is the #3/4/5
g p
POSTerminals Kiosk IDDS
• Reliability
• Ease of Use
• Reliability
• ROI
• Other
• Display Size yconsideration. The solutions need to withstand unkind human operation.
Supplier brand is at the bottom of the lists. !?!
Environmental conditions . All deployments are controlled and sheltered
Highest Rated
• Durability
• Connectivity/ Communication
• Expected Life / Duty Cycle
• Touch Screen
• Ergonomics/ Footprint
• Display Size
• Durability
• OS
• Durability
• Ergonomics/ Footprint
controlled and sheltered
• How are these markets behaving differently? Ease of use rated #2 in POS, near the bottom in
Kiosk and IDDS Kiosk shocks us
• Display Size
• Power Consumption
• Packaged Solution
• Compatibility w/ Existing
• Memory
• Ease of Use
• Manufacturer/ Kiosk and IDDS. Kiosk shocks us
• Displays ratings are a key area of risk Kiosk and IDDS responses placed touch and size
very high. POS placed both low
Lowest Rated
• Touch Screen
• Environmental Conditions
• Manufacturer/ Brand
w/ Existing Infrastructure
• Ease of Use
• EnvironmentalConditions
• Manufacturer/
Brand
• Environmental Conditions
• Expected Life/ Duty Cycle
Is there a perceptual barrier to overcome for POS suppliers looking to participate?
Brand
12 – 2010 VDC Research Group, Inc.Auto ID & Transaction Automation Practice

Vendor Selection Driver Comparison
Vendor Selection Criteria Comparison • At last, and island of commonality …
POSTerminals Kiosk IDDS
• Product Quality
• Product Quality
• Product Quality
• There are no substitutes for the four most commonly cited and highest rated requirements: Quality and price
Highest Rated
• Price
• MaintenanceSupport
• Ease of Use of HW
• Ease of Use of HW
• Price
• MaintenanceSupport
• Price
• Ease of Use of HW
• MaintenanceSupport
y p
Ease of use
General support and urgent troubleshooting
• Some myths debunked?POS li d t h b d f• Technical
Trouble-shooting
• Technical Trouble-shooting
Lowest Brand Single Source
POS suppliers need not have a broad range of solutions. Perhaps customers are skilled at shopping best in class fit for their app?
Excellent experiences attached to kiosk vendors are not translating into brand power. Does the
LowestRated Product Variety Brand
Reputation
gSolution Capability
market see these still as one-off projects?
IDDS – and emerging/growth market – is NOT looking for single source solutions? Perhaps they already understand these successful deployments are the sum of parts, and those parts are diverse skills not likely found in one group?
13 – 2010 VDC Research Group, Inc.Auto ID & Transaction Automation Practice

Channel Preferences Comparison
• The POS market remains heavily Channel Migration Comparisonreliant on the direct channel
• Direct and Other are the only two expected to grow, with Other made up largely of IT vendor and ISV citations
74 3%
75.7%
75.0%
100.0%
69.0%
89.7%
Dealer/ Distributor
HW Manufacturer
• Catalog citation rates are plummeting across all three technologies …
• The Kiosk market looks to be returning a bit to its earlier channel
54.1%
74.3%
41 7%
70.8%
62.1%
65.5%
E-Commerce/ W b/ I t t
System Integrator
st buto
IDDSFuture returning a bit to its earlier channel
sourcing preferences with: Direct expected to grow from 58.3% to
100.0%
Low or marginal value-adding channels 51.4%
54.1%
33.3%
41.7%
34.5%
41.4%VAR
Web/ InternetKioskFuturePOSFuture
g gplummeting
• IDDS channel sourcing really does look a mixed bag – but a learned one Continued high direct citation
5.4%
23.0%
0.0%
29.2%
3.4%
0% 20% 40% 60% 80% 100%
Other
Catalog
g
Sharp growth in highest value-add ISI channel
0% 20% 40% 60% 80% 100%
14 – 2010 VDC Research Group, Inc.Auto ID & Transaction Automation Practice
What is to be Done?
• Recognize and leverage your strengths – above your brand – in alignment with the COMMON key product and vendor selection criteria
• On the product side, be specific, differentiated and relevant Durability, but operational, NOT environmental
Brand appears not to matter but we cannot say do not lead with it But we will say be wary of howBrand … appears not to matter, but we cannot say do not lead with it. But, we will say, be wary of how
• You must staff, develop and promote the following initiatives ROI. Still not clear. The market is still not convinced. We have a lot of work yet to do here
Integration/ compatibility challenges – are there new product opportunities? Brand-worthy processes?
Communications/ network management capabilities. Wireline and wireless. It drives the issue above
• Study how some of the differences in requirements and preferences across technical segments can be as powerful as the differences across vertical segments In general, the retail automation supplier community has done well drilling down, or double clicking into g pp y g g
verticals, segments and niches
However, some challenges exist in the different perceptions / values placed on common components across multiple solutions
Consider the display in POS versus the display in Kiosk versus the display in IDDS
15 – 2010 VDC Research Group, Inc.Auto ID & Transaction Automation Practice
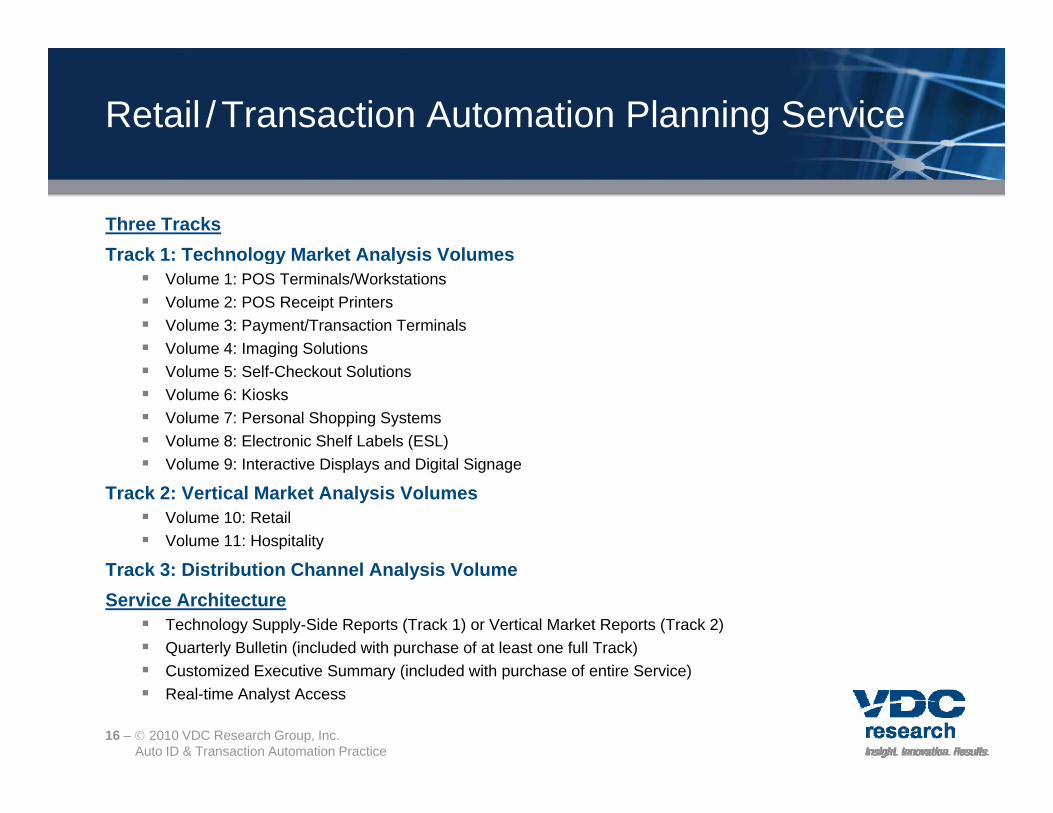
Retail / Transaction Automation Planning Service
Three TracksTrack 1: Technology Market Analysis VolumesTrack 1: Technology Market Analysis Volumes
Volume 1: POS Terminals/Workstations Volume 2: POS Receipt Printers Volume 3: Payment/Transaction Terminals Volume 4: Imaging Solutionsg g Volume 5: Self-Checkout Solutions Volume 6: Kiosks Volume 7: Personal Shopping Systems Volume 8: Electronic Shelf Labels (ESL)
S Volume 9: Interactive Displays and Digital Signage
Track 2: Vertical Market Analysis Volumes Volume 10: Retail Volume 11: Hospitality
Track 3: Distribution Channel Analysis VolumeService Architecture
Technology Supply-Side Reports (Track 1) or Vertical Market Reports (Track 2) Quarterly Bulletin (included with purchase of at least one full Track) Customized Executive Summary (included with purchase of entire Service) Real-time Analyst Access
16 – 2010 VDC Research Group, Inc.Auto ID & Transaction Automation Practice

Primary Research & Market Model Highlights
Target Communities Approximate Sample Size
Phone Interviews Retail automation equipment suppliers N = 150 (+50%)Phone Interviews Retail automation equipment suppliers N = 150 (+50%)
Web-based Interviews End users, retailers, VARs/integrators, distributors N > 600 (+20%)
Study Publication Date Actual Market Size /Supplier Share Forecast Market Size
Service Year 2010 2009 2010-2014
17 – 2010 VDC Research Group, Inc.Auto ID & Transaction Automation Practice

Founding Sponsor Benefits & Schedule
• Service Schedule: Founding Sponsor enrollment: through January 29, 2010 Deliverables begin with Q1 Bulletin, with major reports: April thru September 2010 Planning discussions with early subscribers: through February 2010g y g y Monthly status reports: begin January 2010 Interim findings by volume one month prior to publication of each final report volume
• Founding sponsors receive the following benefits:Founding sponsors receive the following benefits: Opportunity to provide input on the study architecture, scope, direction Monthly updates and real-time qualitative findings of interest at each major milestone
throughout the execution phase of the studyg y Discounts from standard post-publication prices Executive presentation that walks your team through the research sponsored
18 – 2010 VDC Research Group, Inc.Auto ID & Transaction Automation Practice

Q&A Session
Thank You for Attending this VDC Webinar
For more information about VDC Research coverage of the global markets for retail and transaction automation technologies – including the 2010 Retail Automation Market Intelligence Service please contact:Retail Automation Market Intelligence Service – please contact:
Tom WimmerDirector, Auto ID and Transaction Automation Technologies Practicet i @ d h | 630 279 [email protected] | 630-279-7959
Chris RezendesExecutive Vice Presidentj @ d h | 508 653 9000 t [email protected] | 508-653-9000 ext.120
19 – 2010 VDC Research Group, Inc.Auto ID & Transaction Automation Practice