Embed Size (px)
Citation preview

April 18, 2023
Effective Cost Transparency from Imperfect DataTodd Tucker – TBM Council/Apptio
Kevin Teets – Apptio
Deb Krueger – State of Iowa

© 2014 Apptio, All rights reserved.2

© 2014 Apptio, All rights reserved.3
The Importance of Why

© 2014 Apptio, All rights reserved.4
“Why” Questions in IT?
Why is IT so expensive?
Why can’t we approve that additional investment?
Why are we spending so much on maintaining what we have…and so little on innovation?
Why does it cost more for IT to provide a
server than for Amazon to rent us one?
(And WHY does it take so long?)
Why do we keep adding
more infrastructure?
Why do we have so many applications?
Why do we need so much tier 1 storage?
© 2014 Apptio, All rights reserved.5
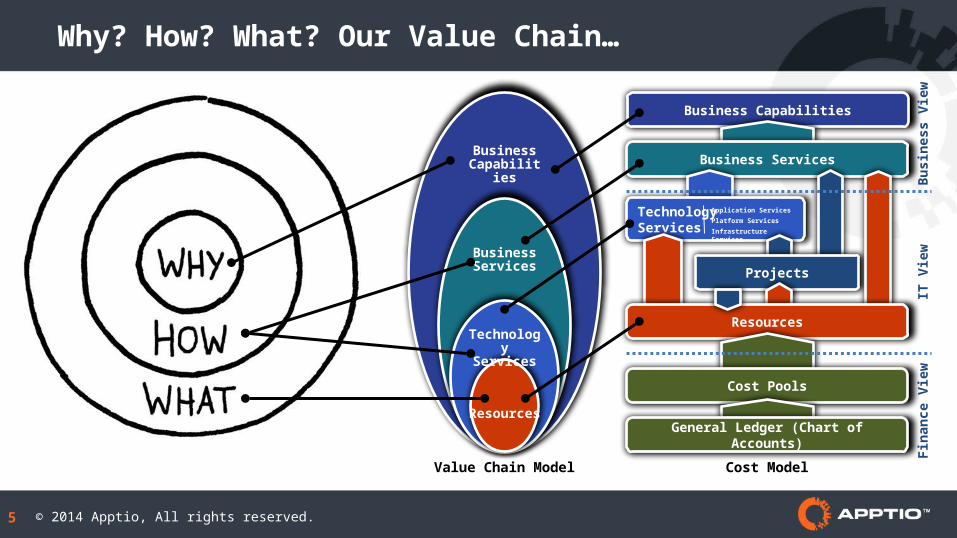
Business Capabilities
Business Services
TechnologyServices
Application Services
Platform Services
Infrastructure Services
Projects
Resources
Fina
nce
View
IT V
iew
Busi
ness
Vie
w
Cost Pools
General Ledger (Chart of Accounts)
Cost Model
Business Capabilities
BusinessServices
TechnologyServices
Resources
Value Chain Model
Why? How? What? Our Value Chain…

© 2014 Apptio, All rights reserved.6
IT Cost Transparency is not about
What does IT cost? It’s about…
WHY does IT cost what it does?
– and –
HOW can we use our money and other resources to create MORE VALUE?

Transparency Every Business Needs For Fact-Based Decisions
© 2014 Apptio, All rights reserved7“We knew more visibility would enable a change in culture and facilitate more accountability. Every CIO should have the level of transparency that enables action.”
HAROLD BOUTIN, Senior Vice President of IT Strategy and Effectiveness, Equifax
A P P L I C A T I O N S
What does it cost to provide each product and service?
S E R V I C E S B U S I N E S S U N I T S
L A B O RV E N D O R S
S P E N D D A T A Q U A L I T Y110010011001010110
P R O J E C T S
I T T O W E R S
What are the costs and KPIs of our key business disciplines?
Who is consuming how much of what?

What Questions Can You Answer with Transparency?
A P P L I C A T I O N S A N D S E R V I C E S B U S I N E S S U N I T S
What is driving the costs of our top 10 apps? What are project vs. run costs for these apps? What are cost levers for reducing cost of this app?
APPLICATIONS
Which cloud services are we spending most on? What is our cost per vendor for this service? How do our IaaS costs compare to Amazon’s?
SERVICES
What is our investment level per BU? What does it cost to deliver these apps to this BU? Where do we spend the most per employee?
BUSINESS UNITS
How much are we investing for innovation? How are we performing against project KPIs? Which projects are exceeding planned resources?
PROJECTS
What is driving our run costs? What is our cost per GB of tier 1 storage vs. peers? Are we trending toward greater cost-efficiency?
IT TOWER
What types of vendors are we spending most on? Are we leveraging preferred providers? How are we doing against spend targets?
VENDORS
Which costs are within our control? Where are largest sources of plan variance? What is driving plan variance?
SPEND
What is driving labor costs by role, location? How are we doing against our staffing plan? Where are we using our staff?
LABOR
Where are our cost blind spots? Which data from what systems don’t line up? Which data is getting stale?
DATA QUALITY
F O U N D A T I O N
110010011001010110
© 2014 Apptio, All rights reserved7
FINANCEITEXECS
TOWER, APP &SERVICE OWNERS
BUSINESS

Where and When Would Better Cost Transparency Have An Impact For You?
© 2014 Apptio, All rights reserved9
Questions from the business Initiative (M&A, ERP migration…) Business Case Infra choices by app teams Requests for capacity
Quarterly Business Reviews Annual IT and Business Planning Project Portfolio Prioritization Exec / Leadership Meetings Capital Review Board Demand Planning
ANNUAL AND QUARTER
Plan variance analysis Management reporting on
progress against targets
MONTHLY AD HOC

© 2014 Apptio, All rights reserved.10
The Business Value of Transparency
Clorox Co. has promoted CIO Ralph Loura to senior vice president and added him to the company’s executive committee.
“We’re a 100-year-old company andfor the first time IT is represented onthe executive committee directly,” hesaid.
One way Mr. Loura has been able to help shift the thinking about IT at Clorox is by using a model of financial transparency and fiscal discipline known as technology business management.
– Rachel King, Wall Street Journalhttp://bit.ly/WSJClorox20140426
Ralph LouraSVP and CIO
The Clorox Company

© 2014 Apptio, All rights reserved.11
What Does This Have to Do with Data?

Plan CapEx/OpEx Run/Grow/Transform Fixed/Variable Location/Regions Month/Quarter/Year
Cost Centers Accounts
General Ledger Line Item Detail
B R E A K O U T S
Standard IT Cost Categories
Application 1 Application 2Application 3 Application 4
Application & Integration Delivery ServicesHosting Services Professional Services
Client Computing
Communication & CollaborationConnectivity End-user Support
Records Management Business-Driven Initiatives Infrastructure InitiativesProcess Initiatives Compliance Initiatives
Your Applications Technology Services End User Services Project Services
COST TRANSPARENCY: APPLICATIONS AND SERVICES
Design & Develop Buy, Build & Deliver Market & Sell Service Customer Shared Services
BUSINESS CAPABILITIES
Business Unit 1 Business Unit 2 Business Unit 3 Business Unit 4COST TRANSPARENCY: BUSINESS UNITS
= Peer Benchmarks Available
Hardware Software Internal Labor External Labor Facilities/Overhead Outside Service
FOUNDATIONApptio TBM Unified Model™(ATUM™)
IT TOWERS & SUB-TOWERS
COST POOLS
DataCenter
ComputeIT
OperationsVoice
NetworkDeliveryServices
Security &Compliance
UserServices
DataNetwork
Storage ApplicationIT
Management
COST TRANSPARENCY: FOUNDATION
Wintel ServersLinux ServersUnix Servers
Locations
Mainframe
Tier 1Tier 2Tier 3Tier 4
Office LANDC LAN
WANInternet
MAN
Voice premiseWide Area Voice
Call Center
Project MgntClient Mgmt
PCsMobile DeviceService DeskField Service
App DevApp SupportQA (Testing)Middleware
Software Lic.
IT Mgmt & AdminIT Finance
IT Vendor Mgmt
Ops CenterService Mgmt
SecurityCompliance
Disaster Recov.Architecture

© 2014 Apptio, All rights reserved13
Data and Allocation Methods (Example)
Hardware Software Internal Labor External Labor Facilities/Overhead Outside Service
FOUNDATIONApptio TBM Unified Model™(ATUM™)
IT TOWERS & SUB-TOWERS
COST POOLS
DataCenter
ComputeIT
OperationsVoice
NetworkDeliveryServices
Security &Compliance
UserServices
DataNetwork
Storage ApplicationIT
Management
FOUNDATION
= Peer Benchmarks Available
WintelLinuxUnix
Locations
Mainframe
Tier 1Tier 2Tier 3Tier 4
Office LANDC LAN
WANInternet
MAN
Voice premiseVoice WANCall Center
Project MgntClient Mgmt
WorkstationMobile DeviceService DeskField Service
DevelopmentSupport
QA (Testing)Middleware
Software Lic.
IT Mgmt & AdminIT Finance
IT Vendor Arch.
Ops CenterService Mgnt
SecurityCompliance
Disaster Recov.
Sub-Tower Composition by Cost PoolUsed to configure mappings & allocations from your unique GL
Linux Hardware: Dev, Test & Prod Servers, Internal Storage… Linux Software: Operating System, Virtualization… Linux Labor: Engineering, Tech Support
Unit Metrics Per physical server, per logical server, per CPU, per CPU Core
Sub-Tower to Application AllocationAllocation Data Good: App & server team estimates (top 20 apps) Better: Server list with supported apps (e.g. top 20 apps) Best: Server performance by app ID
Allocation Methods Assumptive: Appx % of all LINUX used by each app; or Data: 1:1 relationship of server to app; or Data: 1-many relationship, weight by avg. CPU usage
Linux

Challenges of Creating Cost TransparencyTRIGGERS
Month end close Forecasts Project financial QBRs Ad hoc questions
MANIPULATE DATA
Clean and manipulate Create joins and mapping Find data problems
110010011001010110
3
BUILDREPORTS
Create pivots Build graphs Find data problems
5
MAINTAINCOST MODEL
Build vLookups Debug Formulas Find data problems
4VERSIONCONTROL!
ORGCHANGE!
UpdateOwn CostSpreadsheets
DATASOURCECHANGE!
VALIDATE/CLARIFY6
Timing and categorizations What cost went where? Why is that in MY costs?
FINANCE
High:$3.8m
Low:$180k
DATAOWNERS
High:$225k
Low:$18k
DEPARTMENT OWNERS
High:$108k
Low:$11k
ITEXECUTIVES
High:$130k
Low:$11k
PROVIDE DATA
Extract Validate
2110010011001
Explain Fill gaps
PUBLISH REPORTS
Trick Excel into makingwaterfall charts
Annotate and distribute
7
REQUESTDATA
1 Prompt IT and corporate for data extracts
ANSWER QUESTIONS9
Answer requires more granularity or different slices
Answer requires more dats (may become a “study”)
ASK QUESTIONS8
Why did costs. KPIs change? What does this include? I need to see this slices by… What it…?
?
The cost of staff time spent on manual IT cost analysis shows wide range of breadth, scope across Global 2000 IT orgs

© 2014 Apptio, All rights reserved.15
Which Comes First: Transparency or Good Data?
“There's no better way to focus and prioritize your cleaning up data like assigning costs to it. If you know that your ‘unknown’ is costing you a lot of money each month, you‘ll choose do something about it.”
– Lance WarnerTBM ArchitectFirst American Financial
Award for Business Transformation: First American FinancialTBM Conference 2013

April 18, 2023
Cost Transparency at State of Iowa

© 2014 Apptio, All rights reserved.17
Mission: Provide Iowans unified, comprehensive, value-driven administrative services
Responsible for infrastructure IT services to Executive branch agencies
Goal of reducing the cost of government by 15%
Consolidation of executive branch IT infrastructure functions is in focus
Federal law requires all services sold to agencies be at a net zero recovery
State agencies could approve/disapprove of certain rates charged by DAS-ITE
Department of Management oversees rate setting, determines if rate changes are allowable
IT has proven more difficult for users of financial information to understand
Why Cost Transparency at State of Iowa
April 18, 2023
Working with Imperfect Data

© 2014 Apptio, All rights reserved.19
Introduction
1. TBM ADVISORS –MISSION STATEMENT
2. WHY AM I TALKING ABOUT DATA QUALITY?
3. WHAT YOU WILLGET OUT OF TODAY’S PRESENTATION?

© 2014 Apptio, All rights reserved.20
Challenges
Don’t want to start TBMbecause of poor data quality
Do not have confidence in the level of data quality to defend the allocations within the Apptio model
START NOW!“A journey of a thousand miles beginswith a single step.”– Lao-tsu, The Way of Lao-tsu – Chinese philosopher (604 BC – 531 BC)
EMBRACE FAILURE!“Ever tried? Ever failed? No matter, try again,fail again, fail better.”– Samuel Beckett – Irish author, dramatist, novelist in France (1906 – 1989)
© 2014 Apptio, All rights reserved.21
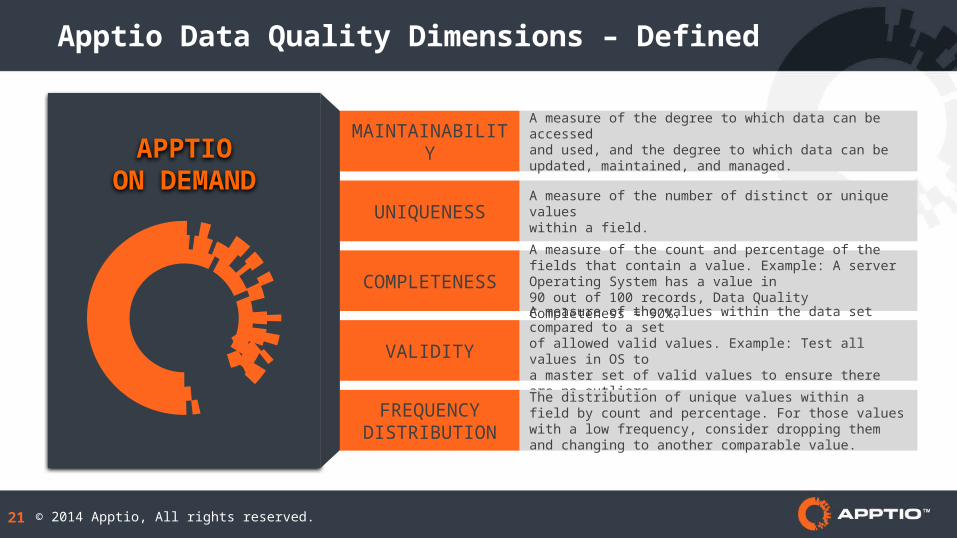
Apptio Data Quality Dimensions – Defined
MAINTAINABILITYA measure of the degree to which data can be accessed and used, and the degree to which data can be updated, maintained, and managed.
UNIQUENESS A measure of the number of distinct or unique values within a field.
COMPLETENESSA measure of the count and percentage of the fields that contain a value. Example: A server Operating System has a value in 90 out of 100 records, Data Quality Completeness = 90%.
VALIDITYA measure of the values within the data set compared to a setof allowed valid values. Example: Test all values in OS to a master set of valid values to ensure there are no outliers.
FREQUENCYDISTRIBUTION
The distribution of unique values within a field by count and percentage. For those values with a low frequency, consider dropping them and changing to another comparable value.
APPTIOON DEMAND

© 2014 Apptio, All rights reserved.22
Data Quality Ecosystem
Data Governance
Ownership (TBMO)
Data Advisor
Data Sources
Data Stewards
Change Management
Automation & ADM
Monitoring / Measurement
Data Quality
© 2014 Apptio, All rights reserved.23
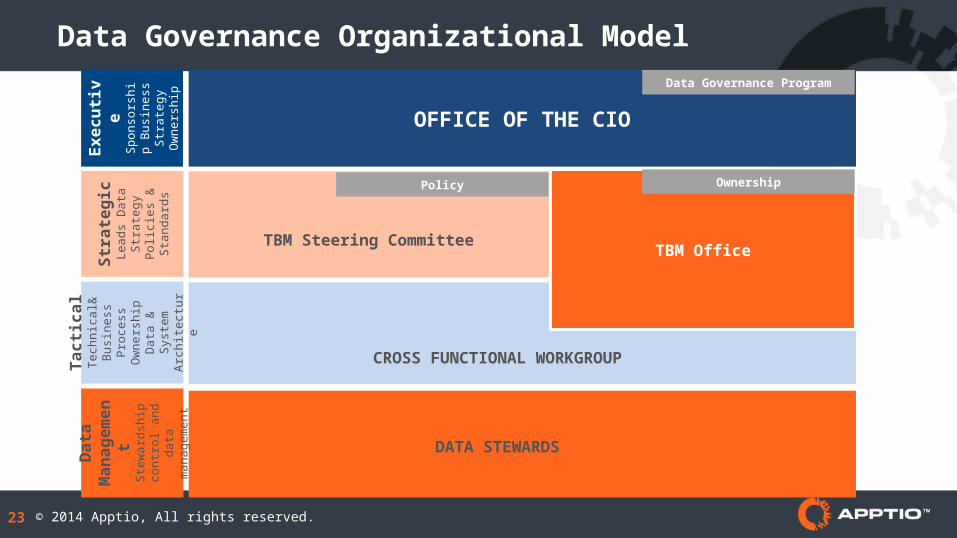
Data Governance Organizational Model
OFFICE OF THE CIOE
xe
cu
tiv
eS
pon
sors
hip
B
usin
ess
S
tra
teg
y O
wn
ers
hip
Str
ate
gic
Le
ads
Dat
a
Str
ate
gy
Pol
icie
s &
S
tan
da
rds
Tac
tic
al
Tech
nic
al&
B
usin
ess
P
roce
ss
Ow
ne
rsh
ip
Dat
a &
Sys
tem
A
rch
itect
ure
Da
ta
Ma
na
ge
me
nt
Ste
wa
rdsh
ip
cont
rol a
nd d
ata
m
an
ag
eme
nt
Data Governance Program
TBM Steering CommitteeTBM Office
CROSS FUNCTIONAL WORKGROUP
DATA STEWARDS
OwnershipPolicy

© 2014 Apptio, All rights reserved.24
Data Advisor
Data Advisor defines the data that you need to
build out each component within
Apptio, effectively acting as the Master Data set
for each source.

© 2014 Apptio, All rights reserved.25
Data Quality Integration into Change Management
Change Management
• Maintainability• Uniqueness• Completeness• Validity• Frequency Distribution

© 2014 Apptio, All rights reserved.26
Apptio Adaptive Data Management
DISPARATE RAW DATA
• Data checks• Parse, filter• De-dupe
• Create• Change• Join
• Auto-discover sourcedata relationships
• Map source tomodel objects
• Visualize relationships
VALIDATEAND CLEANSE
RELATEENRICH
RULES-BASED TRANSFORMATION
DATA INFERENCE
MODELS & ANALYSES
EXTRACT
Connectors(Cloud or On-Prem)
CORRELATED MAPPED DATA• Continuously adapts
to changing data and analytics needs
• Data chain of custody preserved and documented
• Less time on data prep, more time on analysis and decisions
DATA QUALITY DIMENSIONS

© 2014 Apptio, All rights reserved.27
Data Mapper
Data Advisor Master Data fields that
support our Out of the Box content
Customer data that is mapped to Master Data which enables
the fastest configuration
possible

© 2014 Apptio, All rights reserved.28
Data Foundations
Data Strategy
Data Governance
Source Systems
Data Quality Dimensions
Adaptive Data Management
Data Quality Index
Tra
nspa
renc
y
Ownership
Apps
GL
Completeness
Servers
Maintainabilty
Labor
Validity
Frequency Distribution
= DQ Ave % * Impact $$

© 2014 Apptio, All rights reserved.29
Data Quality Workflow

© 2014 Apptio, All rights reserved.30
Data Quality Dimensions – Dashboard
Drill into any KPI for additional
detail

© 2014 Apptio, All rights reserved.31
Data Quality Dimensions – Maintainability
Answer 3 questions
to evaluate
score

© 2014 Apptio, All rights reserved.32
Data Quality Dimensions – Uniqueness
Total number of duplicate records

© 2014 Apptio, All rights reserved.33
Data Quality Dimensions – Completeness
# blanks per column

© 2014 Apptio, All rights reserved.34
Data Quality Dimensions – Completeness
Slice into each column
to discover the rows causing
the errors
Export out for remediation
Row count is the same as # blanks
above

© 2014 Apptio, All rights reserved.35
Data Quality Dimensions – Validity
First – configure Settings
Invalid cells are based
on values set in Settings

© 2014 Apptio, All rights reserved.36
Data Quality Dimensions – Validity Settings
Instructions
Values that are new and
have not been assigned

© 2014 Apptio, All rights reserved.37
Data Quality Dimensions – Validity Settings
Assign “Valid” or “Invalid”
as appropriate. These values serve as the
“Master” lookup values
Change values and click
Save before moving on

© 2014 Apptio, All rights reserved.38
Data Quality Dimensions – Validity
# Invalid values per
column
Compare against
expected values

© 2014 Apptio, All rights reserved.39
Data Quality Dimensions – Frequency Distribution
Instructions and overview of calculation

© 2014 Apptio, All rights reserved.40
Data Quality Dimensions – Frequency Distribution
Review Threshold
Row number
Set Threshold
Value

© 2014 Apptio, All rights reserved.41
Data Quality Dimensions – Frequency Distribution
Adjust slicer settings and
insert Threshold Rows KPI to review items for inspection

© 2014 Apptio, All rights reserved.42
Data Quality Maturity

April 18, 2023
Data Quality Journey at The State of Iowa

© 2014 Apptio, All rights reserved.44
Data comes from many different and varied systems
HRIS, general ledger system, MS Project, eDAS, etc.
Buy in is important!
Culture change comes from executive decision that transparency is important
Transparency cuts both ways:
view into financial data, which can be powerful and useful for asking for rate increases
shines a flashlight onto data quality (or lack thereof…)
Many stakeholders can have strong opinions about the data
Don’t wait to begin transparency efforts due to data quality
Data Quality Is a Sensitive Subject

© 2014 Apptio, All rights reserved.45
Explained that financial data isn't 'perfect' and gets better with everyone's help
Managers have responsibility to review financial information
Managers ask for help where numbers disagree with their 'gut' feelings
Sometimes the financial data shows:
something that might have been forgotten or…
the financial data and/or allocations need to be adjusted
Iterative process – no financial report is considered above question
Roadmap to Improve Data Quality

© 2014 Apptio, All rights reserved.46
Semi-annual inventory of servers, ports, racks
Ease the burden of reporting in ledger to having the costing tool (Apptio) provide the costing analysis
Allow billing to have additional 5 days each month to perform
trend analysis
review additions/deletions to prior month's file
Build good relationships with technicians, so coding changes can be made
Restrict access to 'master' data files
Bring in software to build a CMDB (implementing ServiceNow)
Monthly reconciliations to billing files and ledger to assure pass-through costs are recovered
Outcomes to Date

April 18, 2023
Building Trust in Our Data

© 2014 Apptio, All rights reserved.48
Steps to Improve Trust in the Data
Beta test new models or major changes
Be transparent about data quality Account for every dollar Ensure report consumers
understand: how the costs were allocated how to interpret the reports what changes they can make
Provide drill downs in your reporting

April 18, 2023
Where To Learn More

© 2014 Apptio, All rights reserved.50
Apptio Resource Center
Top 5 Reasons for Avoiding IT Cost Transparency (May 6 Webcast)http://bit.ly/apptiomaywebinar
Key Considerations in Data Model Whitepaperhttp://bit.ly/apptiokcdmwp
Case Studies:AutoTrader Group (http://bit.ly/apptioatg2014)
CME Group (http://bit.ly/apptiocmeg2014)
Freddie Mac (http://bit.ly/apptiofreddie2014)
Product Info:Cost Transparency Foundation (http://bit.ly/apptioctfds)
Source Data Guide (http://bit.ly/apptiosdrg201404)

© 2014 Apptio, All rights reserved.51
TBM Council
TBM Conference in Miami
Workgroups CXO peer groups for vertical
industries: FSI, Insurance, Health, CME, Energy, High-Tech
CFO of IT, Planning & Strategy, and Enterprise Architecture
TBM Book
TBM Index
LinkedIn Forum(http://bit.ly/TBMGenMembers) www.TBMCouncil.org

TBM Conf 2014 Miami – fountain blue
2014
MiamiTBMconference.org
October 28-30