Embed Size (px)
Citation preview
Toll Free: 877-309-2074
Access Code: 442-619-949International: Click “telephone” in audio section, then click “additional numbers”
Solving 21st Century App Performance Problems Without 21 People
Please Standby:
Webcast to Begin Shortly!
Unable to listen via your speakers? Dial in.
Tweet your thoughts & questions using #APMLive

Westfield Application Performance Management with Dynatrace
Brian Bemiller
Leader - Service Oriented Architecture [email protected]
Who am I?
• Leader - SOA/Middleware Team
• Asset owners of 200+ production services and middleware tools that help enable them (ESB, Web Services Gateway, MQ)
• Why am I so interested in Application Performance Management?
What Westfield used to consider
“complex”
Current Westfield Legacy Systems
- Policy administration and quoting systems
- Claims management system
- Business Intelligence systems
- Enterprise Service Bus
- Approximately 80 enterprise services
Example: Quoting a policy
- Most functionality housed within the app/databases
- 3-5 enterprise services calls per quote
- Vendor web service calls were ad hoc
- Direct connection between quoting and policy admin systems
Troubleshooting – “The quoting system is slow” – Call 4 to 6 people
- Bad code in the application?
- Services or Middleware performance issues (never)?
- Policy processing system slowness?
- Infrastructure, memory, CPU problems?
Then came “IMPACT”
“IMPACT”• IMPACT = Replace legacy claims system
• 120+ new enterprise services
• New ESB flows to handle attachments and large messages
• New suite of Electronic Content Management Tools
• 20+ vendor integrations
• Cross system authentication tools
• New operational data store
• Integration with payments system
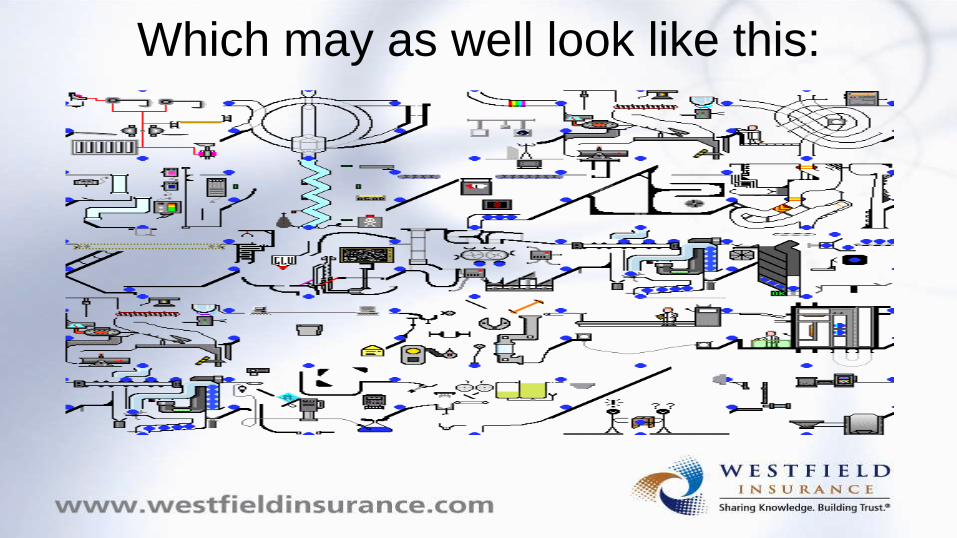
Which may as well look like this:
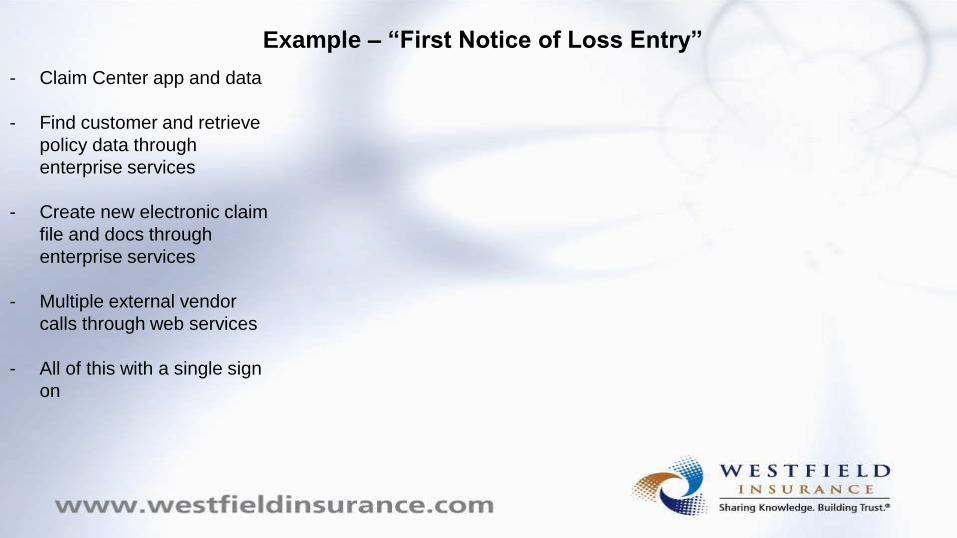
Example – “First Notice of Loss Entry”
- Claim Center app and data
- Find customer and retrieve
policy data through
enterprise services
- Create new electronic claim
file and docs through
enterprise services
- Multiple external vendor
calls through web services
- All of this with a single sign
on
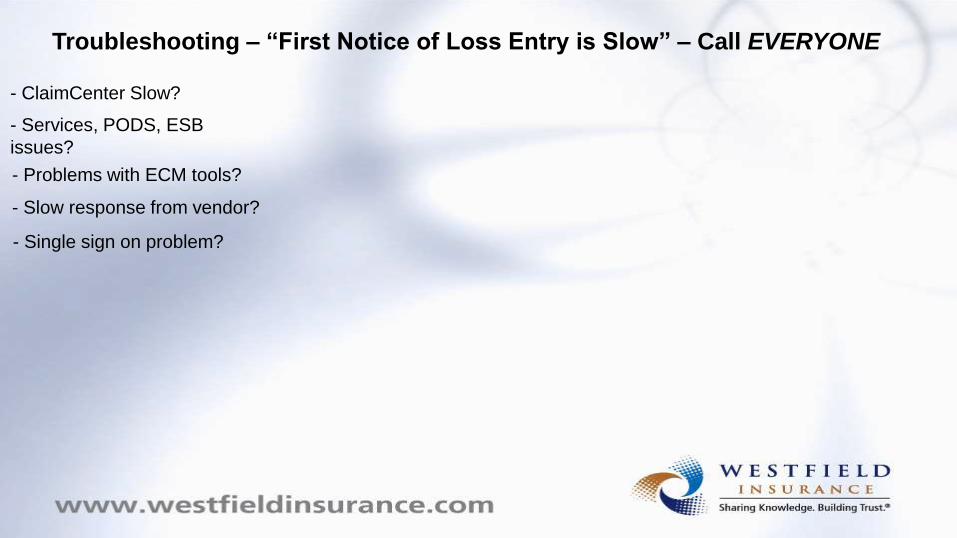
Troubleshooting – “First Notice of Loss Entry is Slow” – Call EVERYONE
- ClaimCenter Slow?
- Services, PODS, ESB
issues?
- Problems with ECM tools?
- Slow response from vendor?
- Single sign on problem?

Which may as well look like this:
Enter Dynatrace
Application Performance Management
“APM tools are aimed at rapid problem triage and root
cause isolation in distributed environments. Although
performance statistics for all application components are
readily available, the real value is in the deep level
analysis, problem detection and alerting available for every
transaction.” - Me, at night, putting this together
Gartner’s 5 Dimensions of APM
• Deep Dive Component Monitoring
• Runtime Application Architecture
• End User Experience
• Business Transaction Management
• Analytics and Reporting
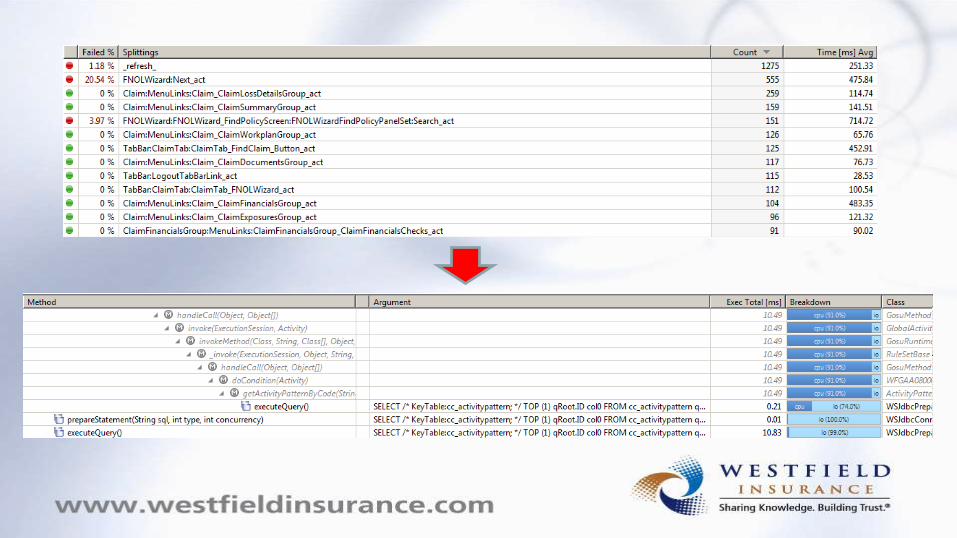
Deep Dive Component Monitoring
• Called “PurePaths” in Dynatrace
• More than just monitoring…
• Every transaction is recorded.
• Performance hotspots for dashboard and reporting purposes.
• Detailed Alerts
Deep Dive Component Monitoring - Wins
Examples in a two week sample:
– 3rd party site – Certificate expired
– 3rd party site – Slow response/timeouts
– Two minute “death spiral” and timeout issue in Testing
– Incorrect service name in ESB
3rd Party Site - Unavailable
Our certificate to a third party vendor expired, silently breaking our
connection to retrieve credit score data. We didn’t know about it for 3
weeks because our consumers handled it as if we just couldn’t find the
data (normal).
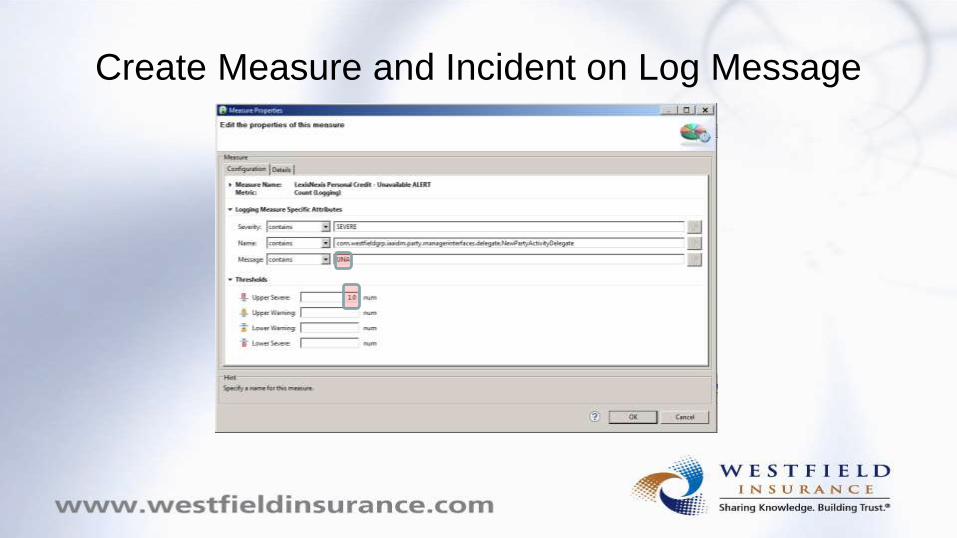
Create Measure and Incident on Log Message

Email Alert Working – Fixed it
3rd Party Site - Timeouts
While proactively monitoring using Dynatrace, we noticed a significant
performance degradation in our predictive underwriting application,
causing multiple timeouts.
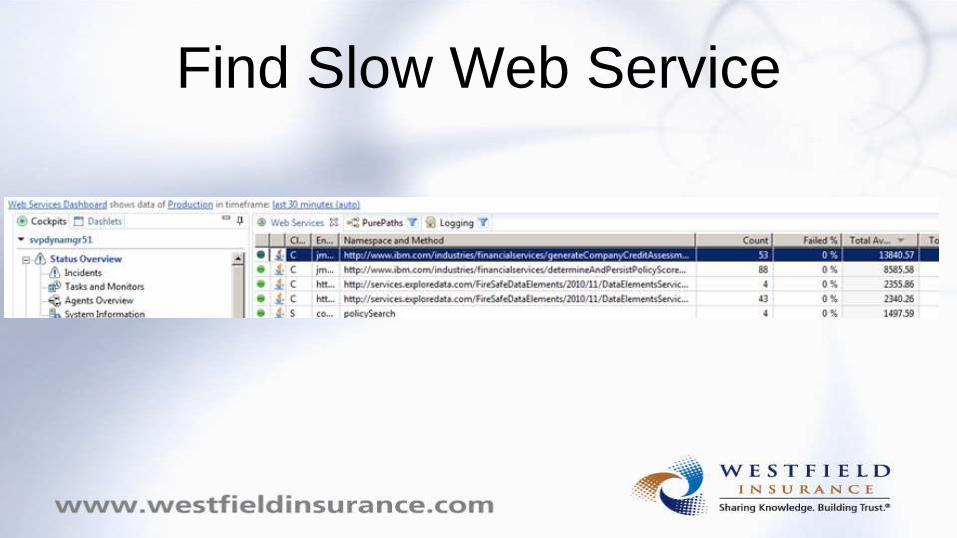
Find Slow Web Service
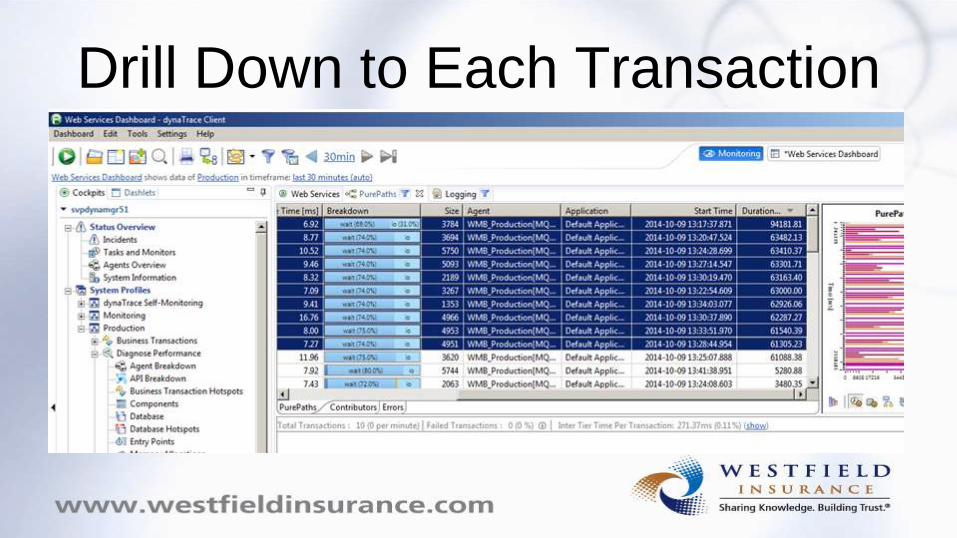
Drill Down to Each Transaction
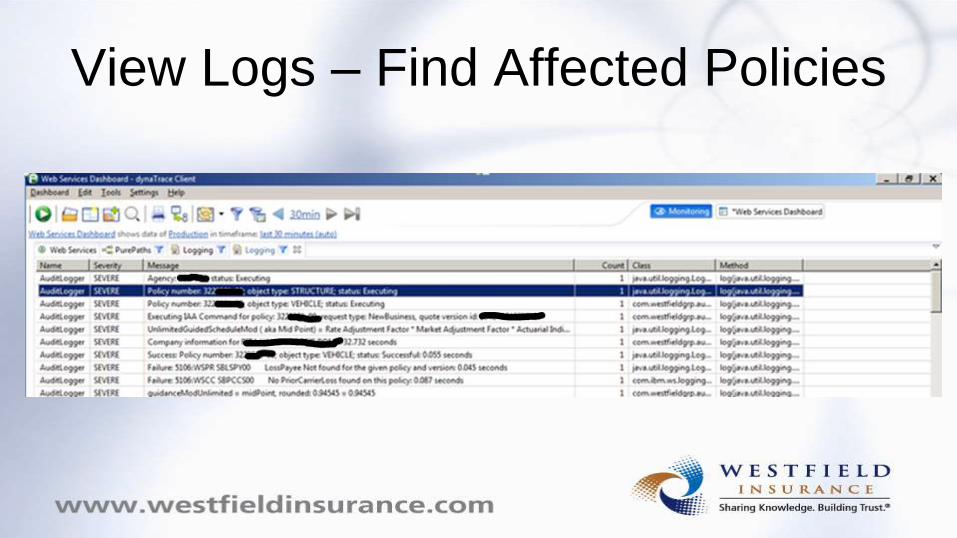
View Logs – Find Affected Policies

Contacted Vendor – Fixed Policies
Two minute death spiral
Users were clicking buttons in claims system, waiting two minutes, then
timing out. There were over 20 people in a chat looking at the entire
architecture.
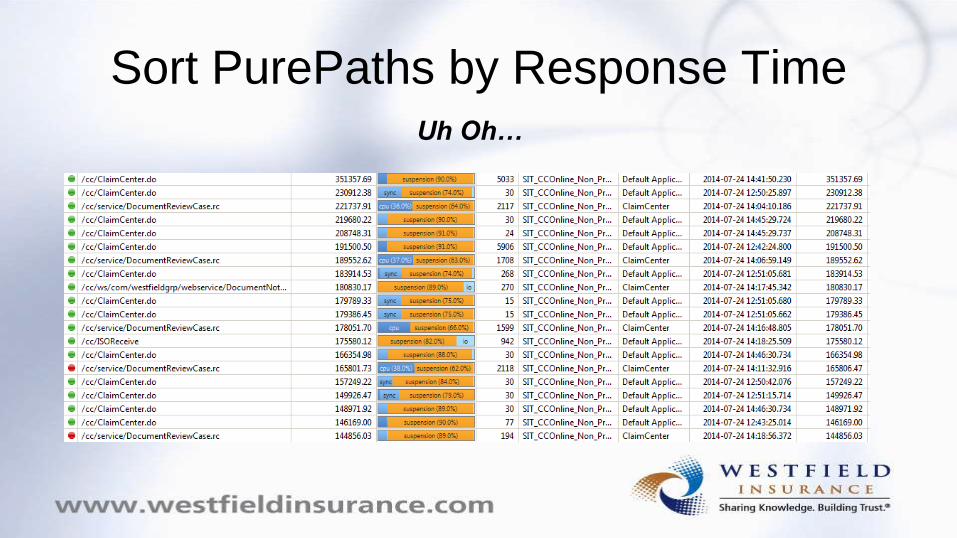
Sort PurePaths by Response TimeUh Oh…
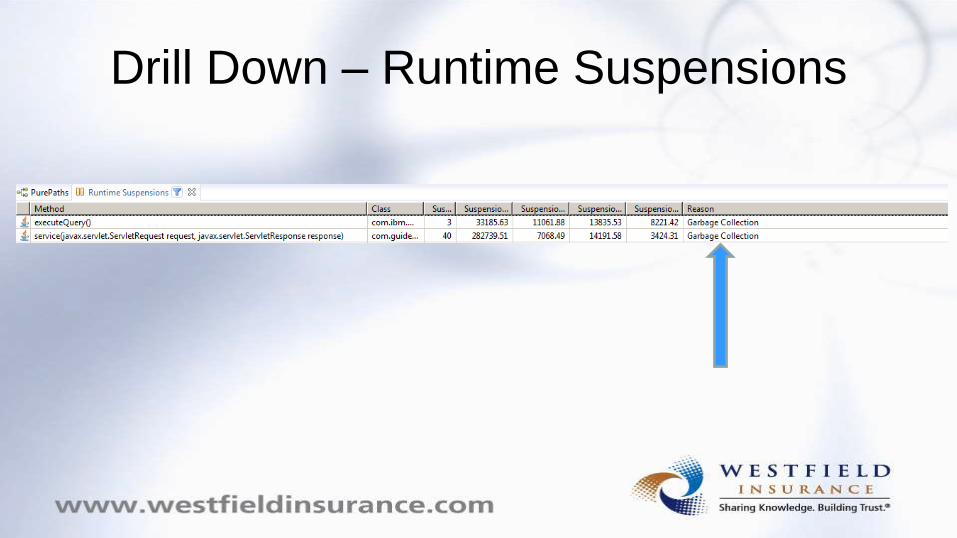
Drill Down – Runtime Suspensions
Deploy Issue – Fixed it
Incorrect Service Name in ESB
We experienced a timeout waiting for a response from our auto
damage estimate vendor via our claims management system.
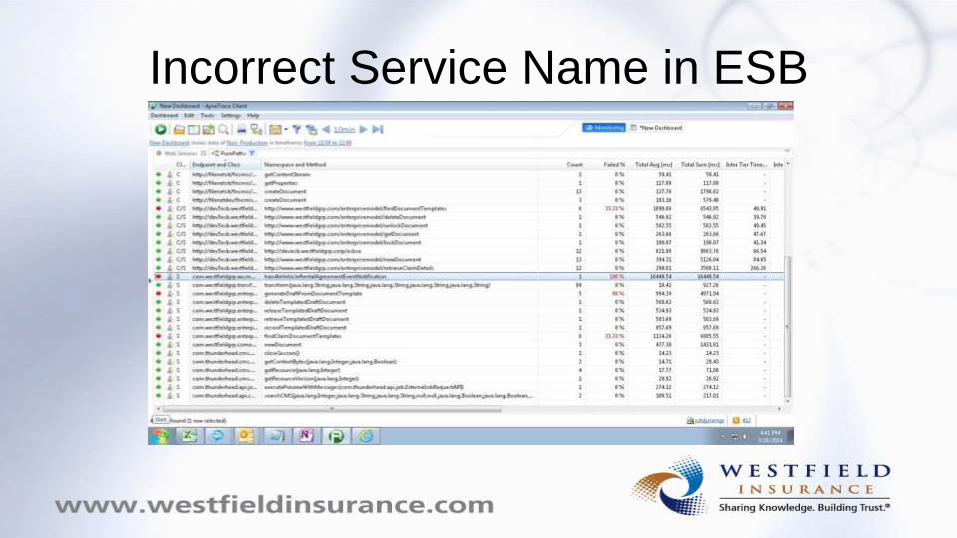
Incorrect Service Name in ESB
Update ESB Routing – Fixed it
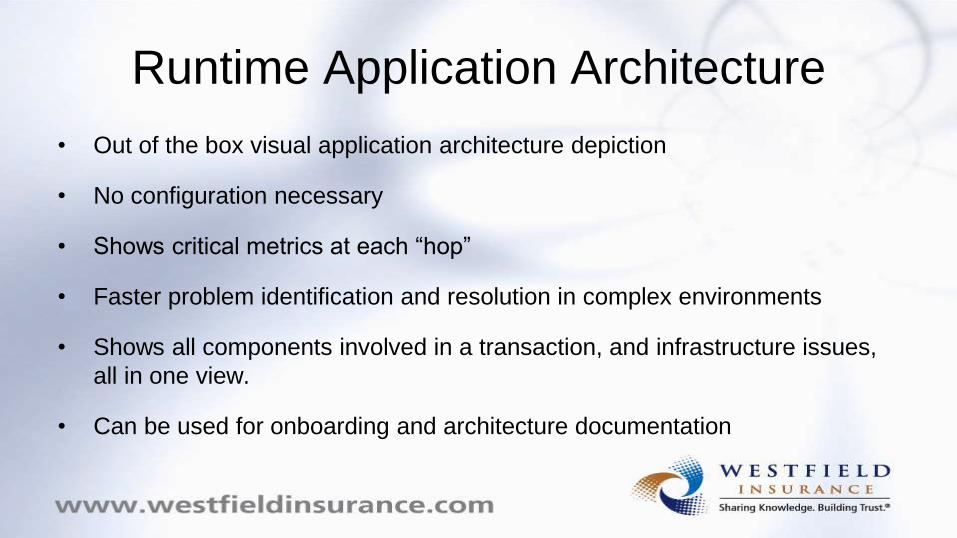
Runtime Application Architecture
• Out of the box visual application architecture depiction
• No configuration necessary
• Shows critical metrics at each “hop”
• Faster problem identification and resolution in complex environments
• Shows all components involved in a transaction, and infrastructure issues,
all in one view.
• Can be used for onboarding and architecture documentation
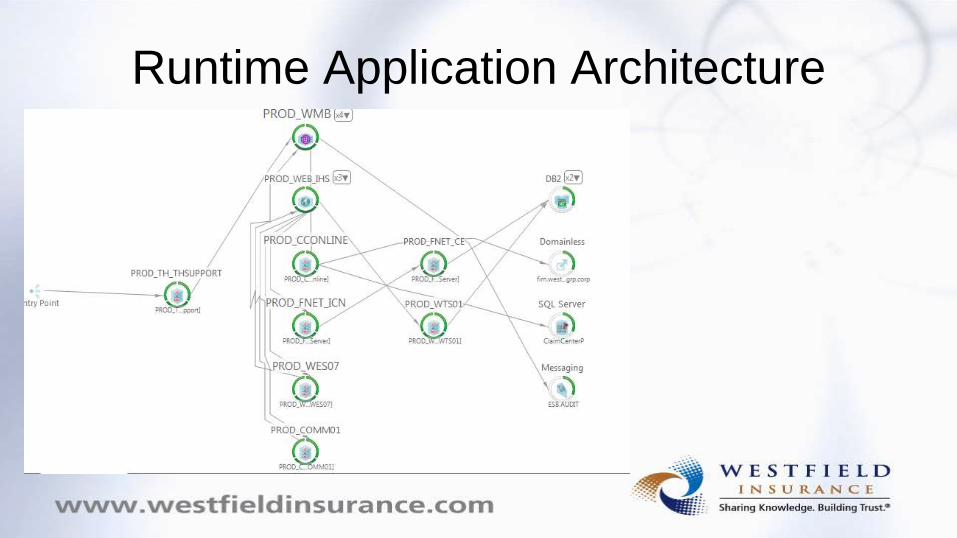
Runtime Application Architecture
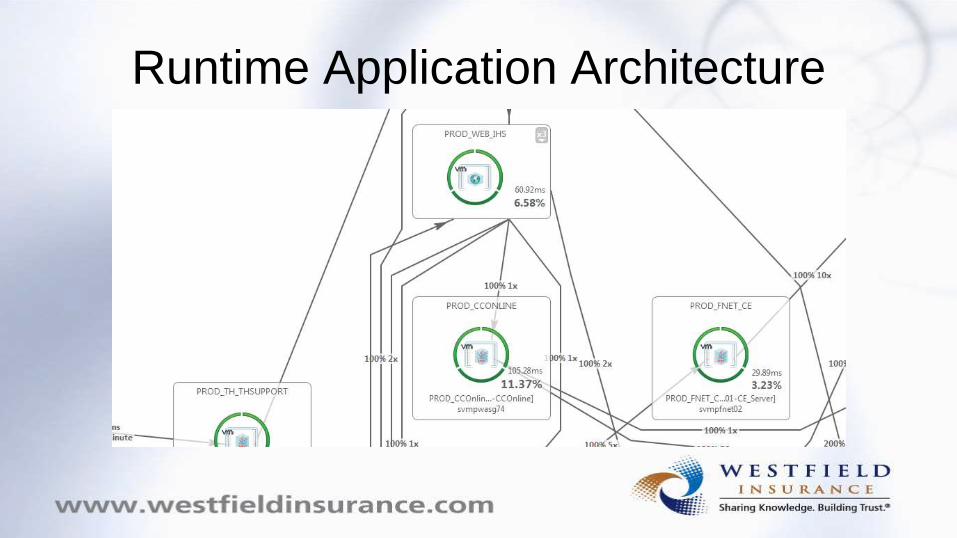
Runtime Application Architecture
Rating Engine and IMPACT
Performance Testing
Initial performance testing of our newly purchased Rating Engine software,
which was integrated to and from legacy systems using a variety of web
services showed degradation from our current architecture.
Initial performance tests for the entire IMPACT architecture under expected
load uncovered a large number of performance bottlenecks.
With Dynatrace, here’s how easy it is to find. Imagine finding without it.
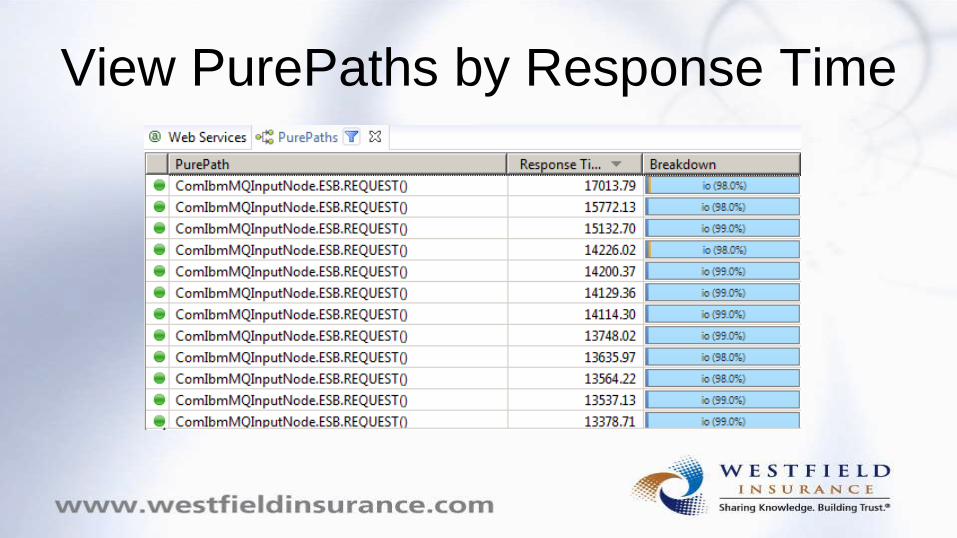
View PurePaths by Response Time
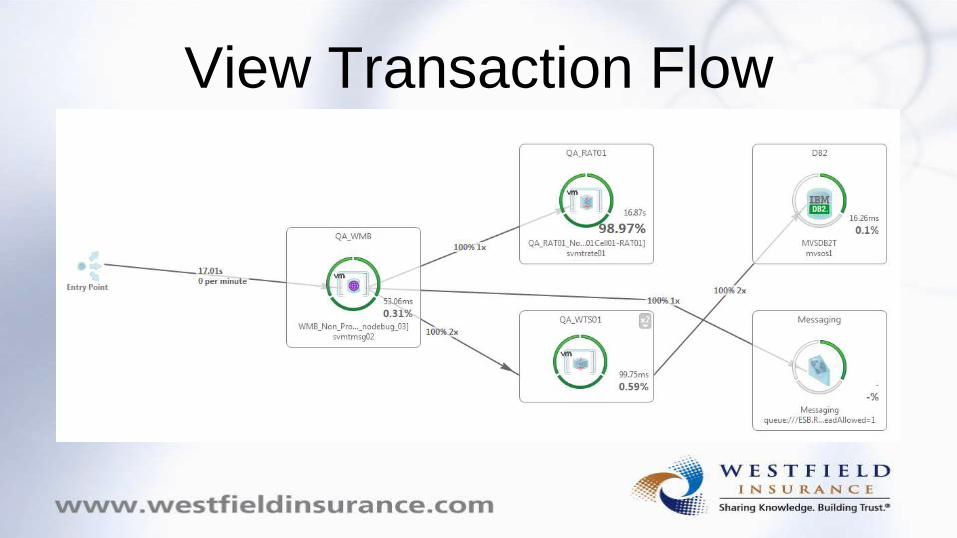
View Transaction Flow
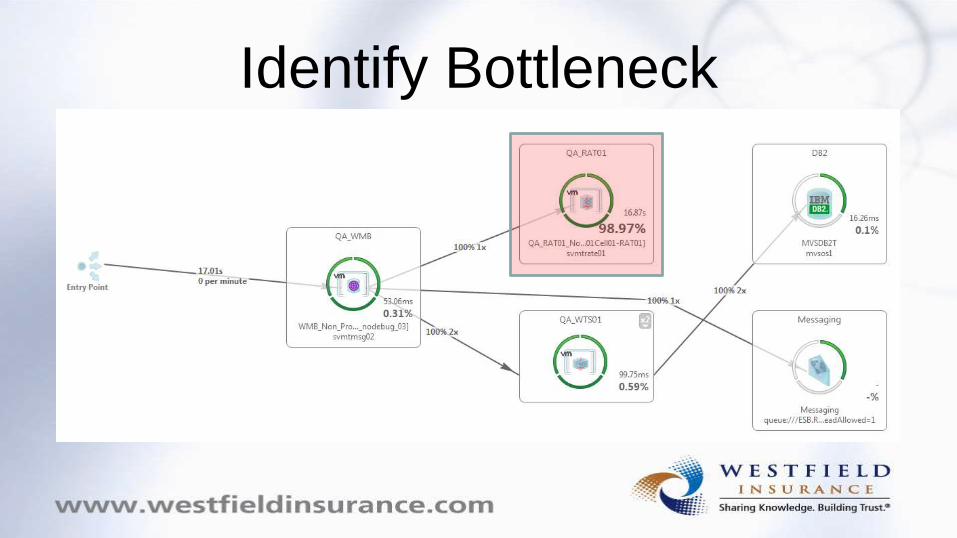
Identify Bottleneck

Fix Bottleneck!
End User Monitoring
• Ability to see each user’s unique visit to your application
• Insight into browser usage, JavaScript performance, user location
and statistics by location
• Can identify unintended user experience trends
• Eases troubleshooting for external users
• Enables deep dive from user click to method/SQL level
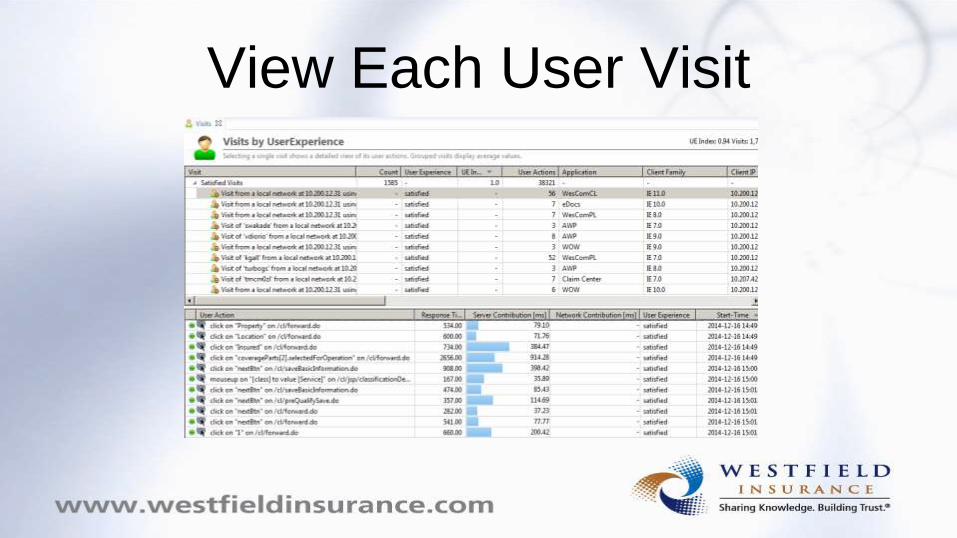
View Each User Visit
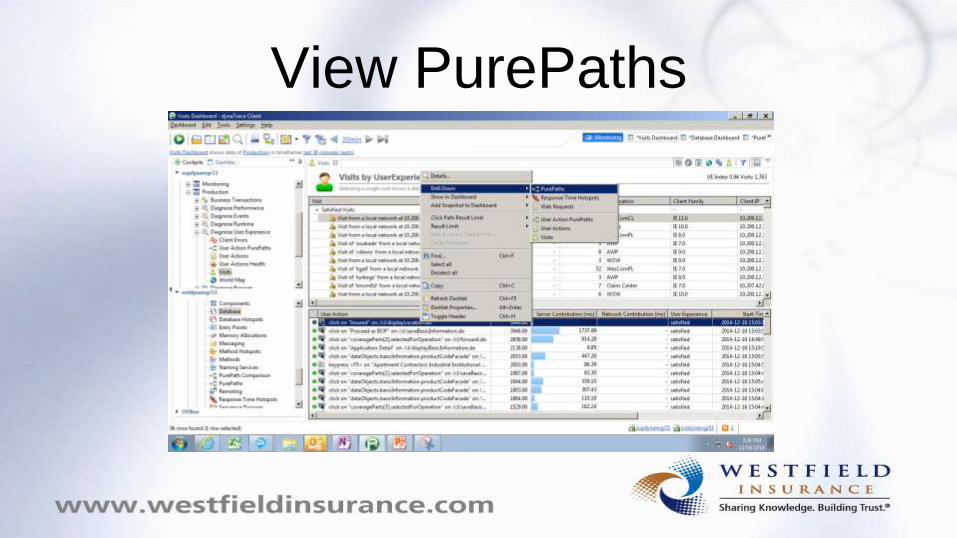
View PurePaths
Business Transaction Management
• Roll up multiple transactions/page actions into one “Business
Transaction” for tracking
• Example: First Notice of Loss Entry occurs over multiple screens.
APM tools can correlate these screens to show meaningful metrics
about how many FNOLs happen in a day, how many are
successfully, failures, time, etc…
Analytics Reporting
• Dashboards and reports that measure KPIs
• All the data mentioned can be monitored for analytic purposes
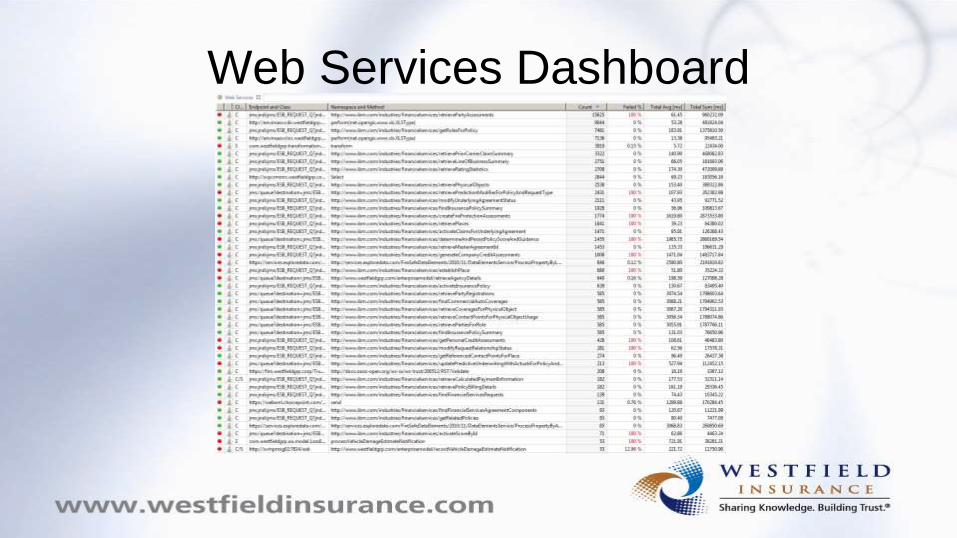
Web Services Dashboard

APM at Westfield
Westfield APM Tips
Even the fanciest tool shouldn’t take the place of sound troubleshooting
steps:
• Always learn from your fixes
• Know the actual issue/error/symptom that is present before digging
in.
• Avoid troubleshooting everything!
• Evaluate and use Dynatrace
Future Trends
• Can’t afford to troubleshoot by committee
• APM teams are being created
• Westfield Command Center Process

Questions?

Final slide if people can’t stop
looking at Lionel Richie

Questions?


![Real-time weather updates via Crowdsourcing TEAM [E] Smart Weather App Solving weather together](https://img.pdfslide.us/doc/110x75/5a4d1b0e7f8b9ab05998d12f/real-time-weather-updates-via-crowdsourcing-team-e-smart-weather-app-solving.jpg)