Embed Size (px)
Citation preview
1 | © 2015 Pure Storage Inc.
NAND FLASH DEEP DIVE Vaughn Stewart VP, Enterprise Architect, Pure Storage [email protected] | @vStewed | vaughnstewart.com
REDESIGNING STORAGE INFRASTRUCTURE

2 | © 2015 Pure Storage Inc.
~30% of workloads not virtualized
30-60% of VI admin’s time spent tending storage
Outages and downtime due to physical infrastructure
DISK STORAGE LIMITS VIRTUALIZATION
3 | © 2015 Pure Storage Inc.
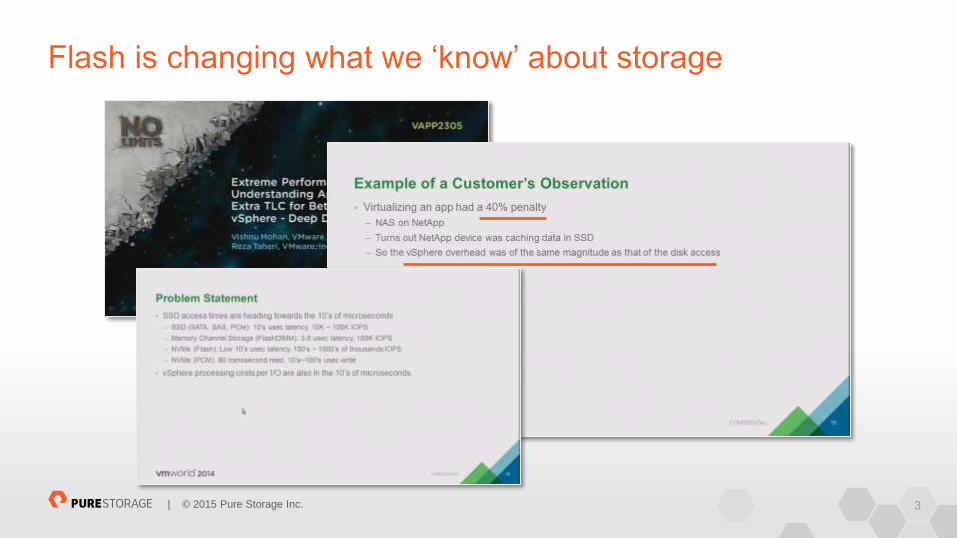
Flash is changing what we ‘know’ about storage
4 | © 2015 Pure Storage Inc.
Top questions around all-flash arrays
1: I don’t need the performance of an All-Flash Array (AFA)
2: I cant afford an AFA
3: How do I benchmark an AFA
5 | © 2015 Pure Storage Inc.
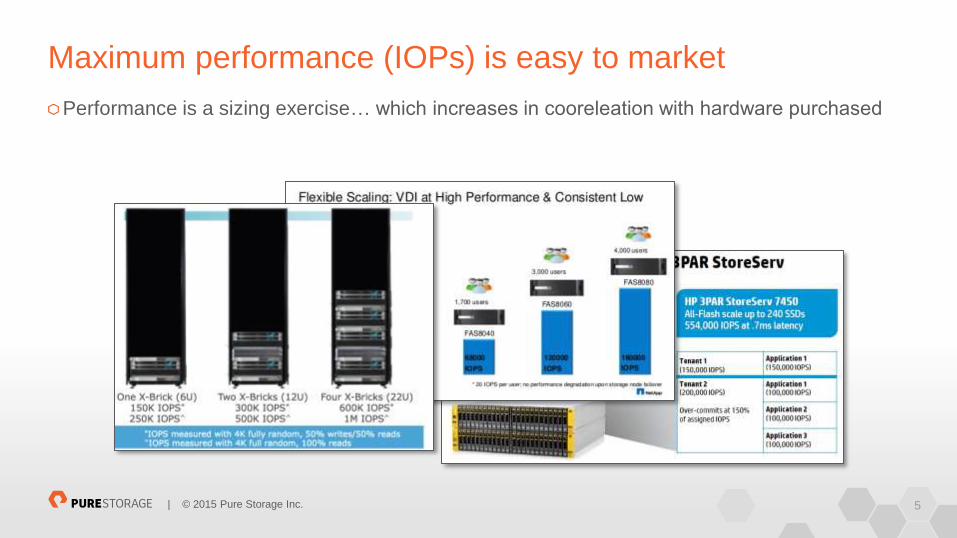
Maximum performance (IOPs) is easy to market
Performance is a sizing exercise… which increases in cooreleation with hardware purchased
6 | © 2015 Pure Storage Inc.
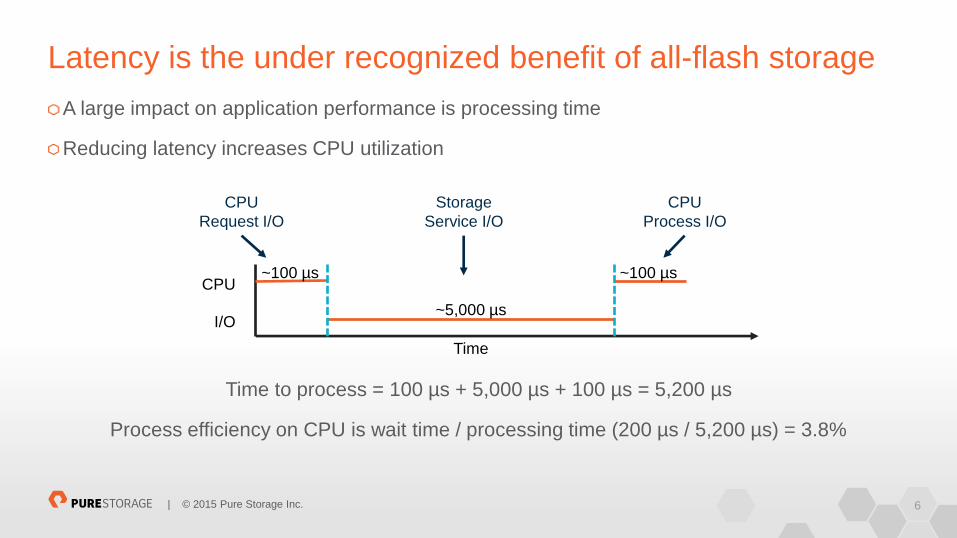
A large impact on application performance is processing time
Reducing latency increases CPU utilization
Time to process = 100 µs + 5,000 µs + 100 µs = 5,200 µs
Process efficiency on CPU is wait time / processing time (200 µs / 5,200 µs) = 3.8%
Latency is the under recognized benefit of all-flash storage
~100 µs ~100 µs
~5,000 µs
Time
CPU
I/O
CPU
Request I/O
CPU
Process I/O
Storage
Service I/O
7 | © 2015 Pure Storage Inc.
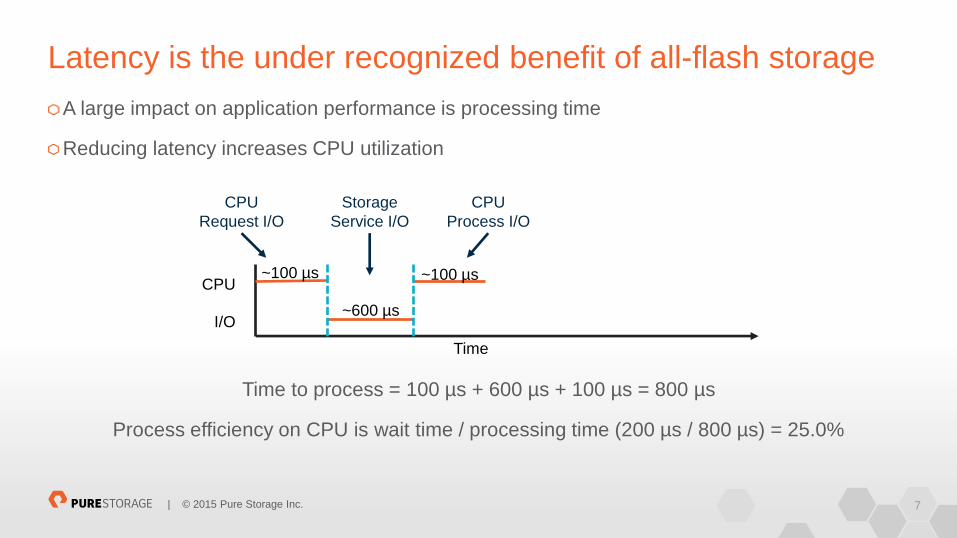
A large impact on application performance is processing time
Reducing latency increases CPU utilization
Time to process = 100 µs + 600 µs + 100 µs = 800 µs
Process efficiency on CPU is wait time / processing time (200 µs / 800 µs) = 25.0%
Latency is the under recognized benefit of all-flash storage
~100 µs ~100 µs
~600 µs
Time
CPU
I/O
CPU
Request I/O
CPU
Process I/O
Storage
Service I/O

8 | © 2015 Pure Storage Inc.
A large impact on application performance is processing time
Reducing latency increases CPU utilization
Conclusion: all-flash storage optimizes CPU allowing for more IOPs per host (accelerate business) or the reduction in the # of hosts (reduce capex)
Latency is the under recognized benefit of all-flash storage
Avg. Disk Latency 5ms 10ms 15ms 20ms 30ms
CPU Utilization Benefit 6.6X 12.8X 19.1X 25.3X 37.9X
9 | © 2015 Pure Storage Inc.
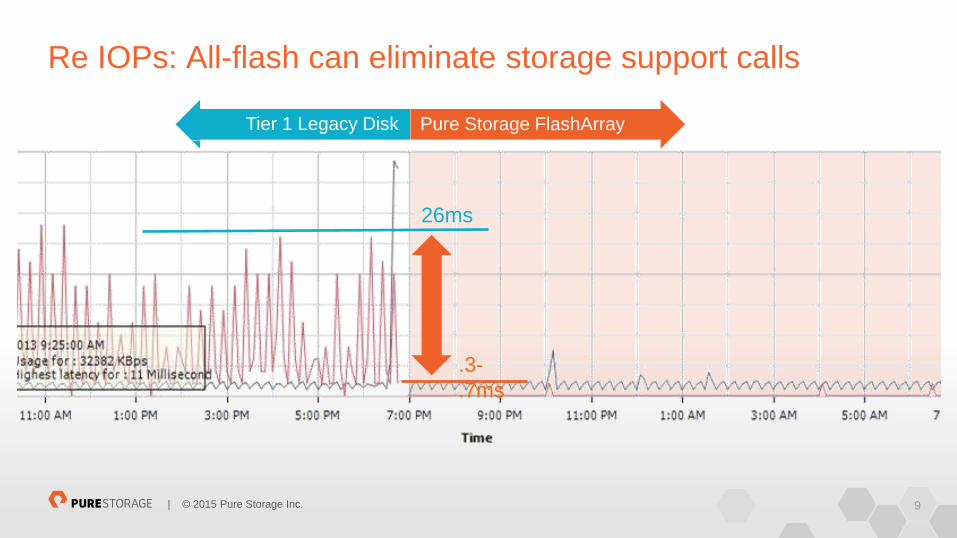
Re IOPs: All-flash can eliminate storage support calls
Tier 1 Legacy Disk Pure Storage FlashArray
26ms
.3-
.7ms

10 | © 2015 Pure Storage Inc. Source: ESG report on Pure Storage resilience with converged, virtualized workloads
Including Horizon View, Oracle, Exchange, and other VM workloads -- simultaneously
Large scale databases Desktop virtualization Business critical apps
Everything consolidated No performance impact
1500 high-performance virtual desktops
Flash provides the power to consolidate every workload
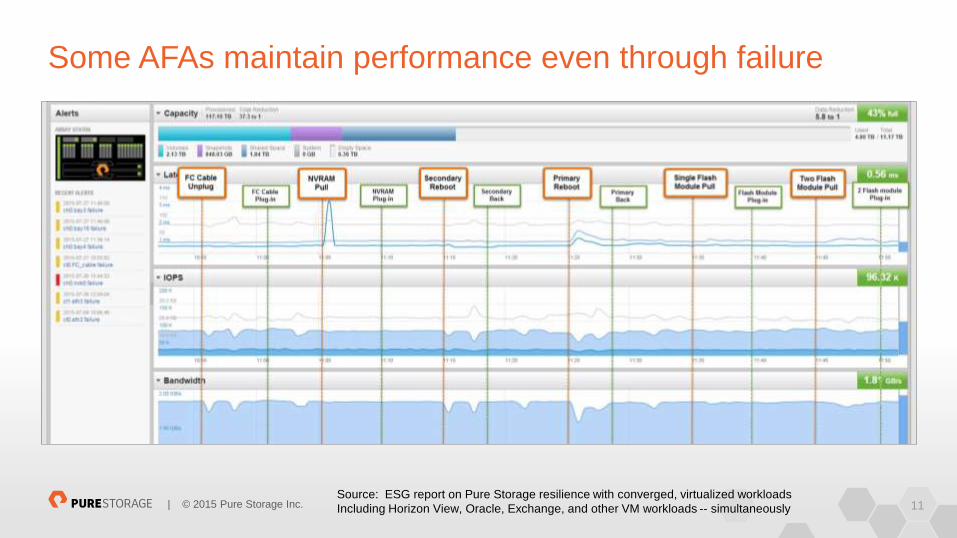
11 | © 2015 Pure Storage Inc. Source: ESG report on Pure Storage resilience with converged, virtualized workloads
Including Horizon View, Oracle, Exchange, and other VM workloads -- simultaneously
Some AFAs maintain performance even through failure
12 | © 2015 Pure Storage Inc.
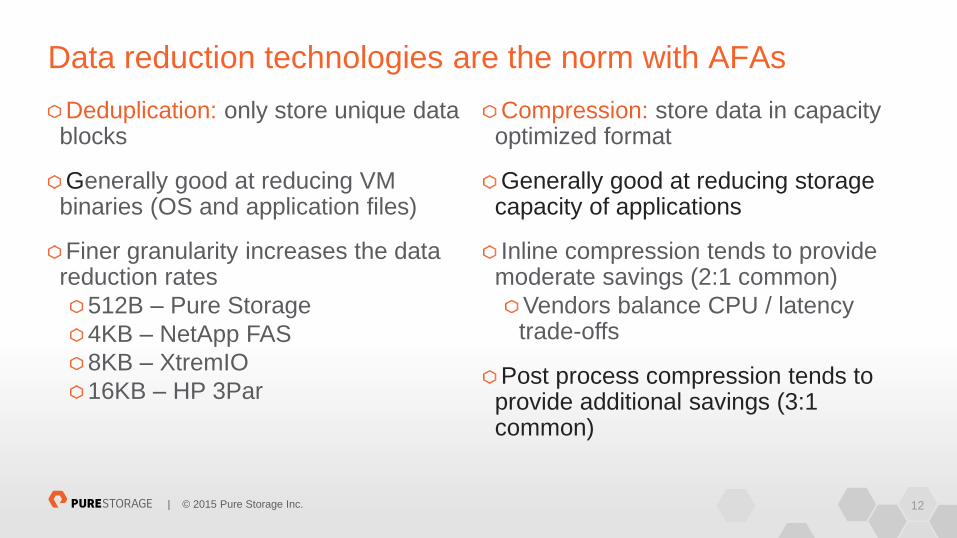
Data reduction technologies are the norm with AFAs
Deduplication: only store unique data blocks
Generally good at reducing VM binaries (OS and application files)
Finer granularity increases the data reduction rates
512B – Pure Storage
4KB – NetApp FAS
8KB – XtremIO
16KB – HP 3Par
Compression: store data in capacity optimized format
Generally good at reducing storage capacity of applications
Inline compression tends to provide moderate savings (2:1 common)
Vendors balance CPU / latency trade-offs
Post process compression tends to provide additional savings (3:1 common)

13 | © 2015 Pure Storage Inc.
Thin provisioning: a data reduction technology?
Thin provisioning is a dynamic provisioning mechanism Eliminates the need to pre-allocate storage capacity
Some applications force thick provisioning Some arrays provide pattern removal to ensure thin provisioning
Question calculating thin provisioning in storage savings ratios
LUN
Data
LUN
Data
LUN
Data
2:
1
3:
1
4:
1
Unchanged
data capacity
14 | © 2015 Pure Storage Inc.
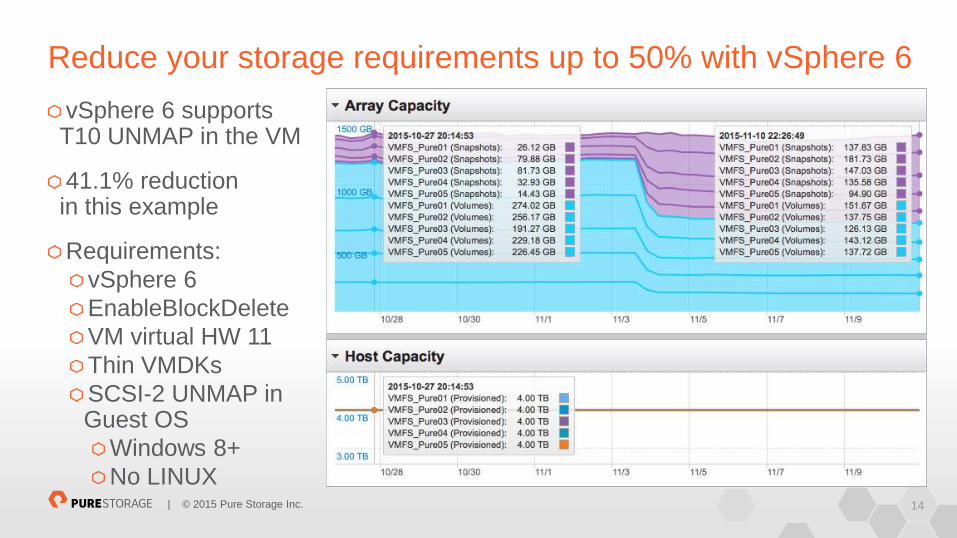
Reduce your storage requirements up to 50% with vSphere 6
vSphere 6 supports T10 UNMAP in the VM
41.1% reduction in this example
Requirements:
vSphere 6
EnableBlockDelete
VM virtual HW 11
Thin VMDKs
SCSI-2 UNMAP in Guest OS
Windows 8+
No LINUX

15 | © 2015 Pure Storage Inc.
Effective $/GB is the modern cost of storage
16 | © 2015 Pure Storage Inc.
The Objective

17 | © 2015 Pure Storage Inc.
Absurd Testing
18 | © 2015 Pure Storage Inc.
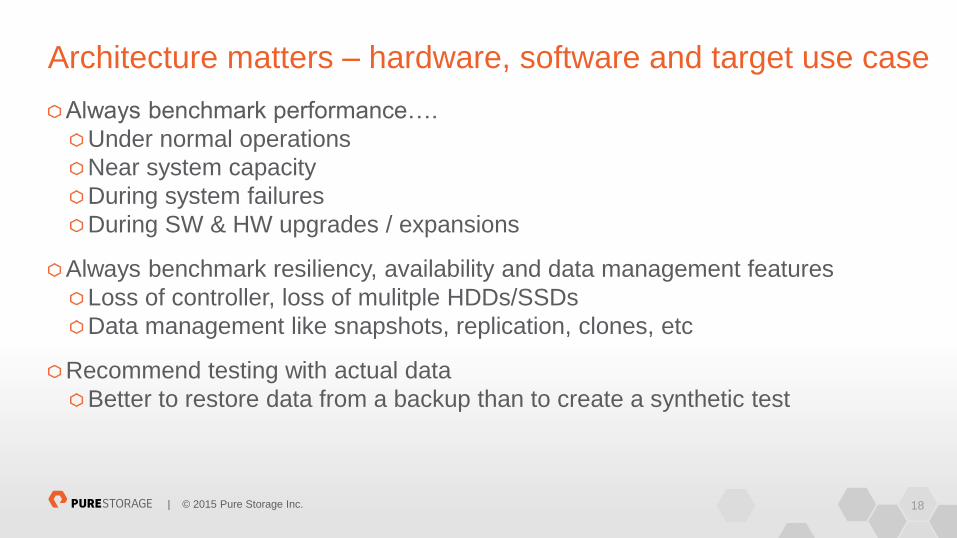
Architecture matters – hardware, software and target use case
Always benchmark performance….
Under normal operations
Near system capacity
During system failures
During SW & HW upgrades / expansions
Always benchmark resiliency, availability and data management features
Loss of controller, loss of mulitple HDDs/SSDs
Data management like snapshots, replication, clones, etc
Recommend testing with actual data
Better to restore data from a backup than to create a synthetic test
19 | © 2015 Pure Storage Inc.
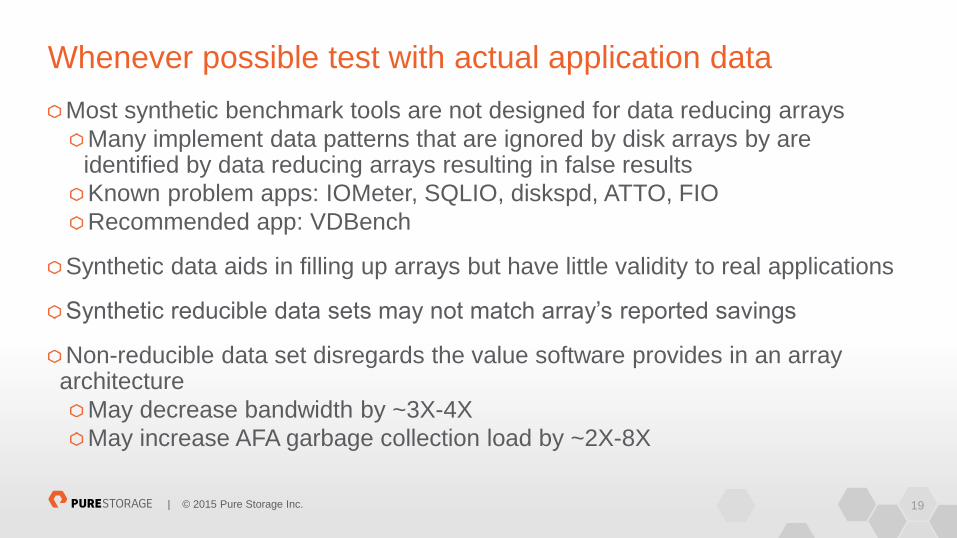
Whenever possible test with actual application data
Most synthetic benchmark tools are not designed for data reducing arrays
Many implement data patterns that are ignored by disk arrays by are identified by data reducing arrays resulting in false results
Known problem apps: IOMeter, SQLIO, diskspd, ATTO, FIO
Recommended app: VDBench
Synthetic data aids in filling up arrays but have little validity to real applications
Synthetic reducible data sets may not match array’s reported savings
Non-reducible data set disregards the value software provides in an array architecture
May decrease bandwidth by ~3X-4X
May increase AFA garbage collection load by ~2X-8X
20 | © 2015 Pure Storage Inc.
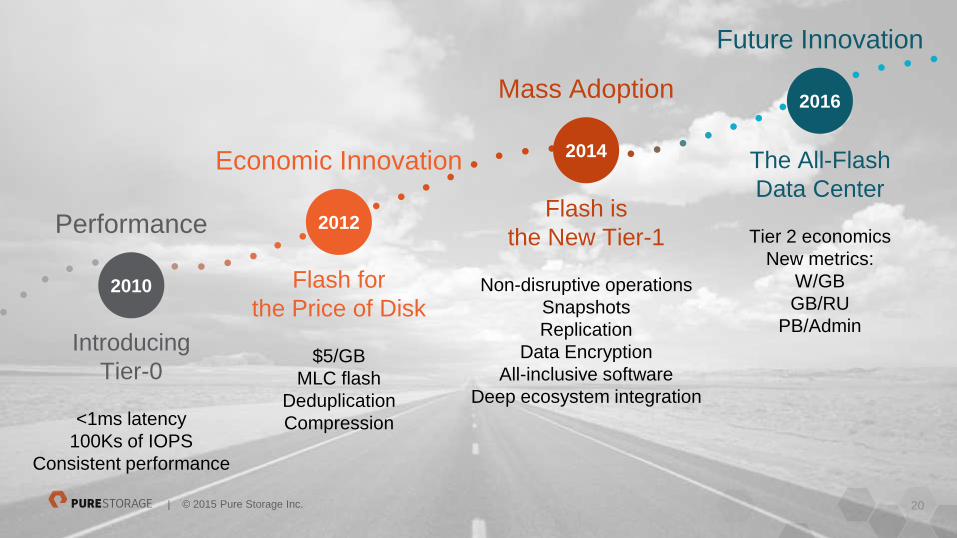
Flash for
the Price of Disk
$5/GB
MLC flash
Deduplication
Compression
2012
Economic Innovation
Flash is
the New Tier-1
Non-disruptive operations
Snapshots
Replication
Data Encryption
All-inclusive software
Deep ecosystem integration
2014
Mass Adoption
The All-Flash
Data Center
Tier 2 economics
New metrics:
W/GB
GB/RU
PB/Admin
2016
Future Innovation
Introducing
Tier-0
<1ms latency
100Ks of IOPS
Consistent performance
2010
Performance
21 | © 2015 Pure Storage Inc.
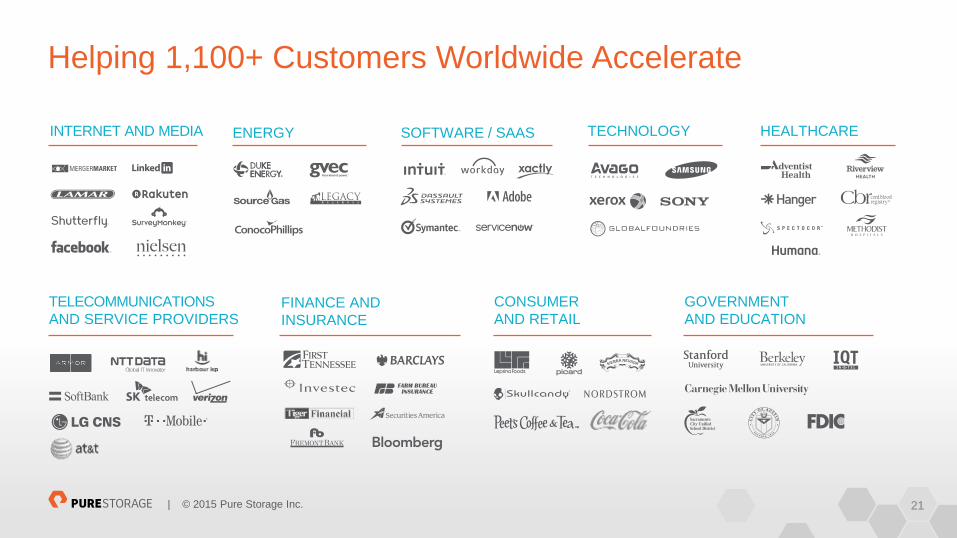
Helping 1,100+ Customers Worldwide Accelerate
21
INTERNET AND MEDIA HEALTHCARE
CONSUMER
AND RETAIL
TELECOMMUNICATIONS
AND SERVICE PROVIDERS
SOFTWARE / SAAS TECHNOLOGY
FINANCE AND
INSURANCE
GOVERNMENT
AND EDUCATION
ENERGY
22 | © 2015 Pure Storage Inc.
For more information, please visit purestorage.com
Thank You