Embed Size (px)
Citation preview
© 2015 IBM Corporation
AAI-1917: Monitoring and Diagnostic Tools for Java and JavaScript
Chris Bailey: STSM, IBM Runtime Monitoring

2
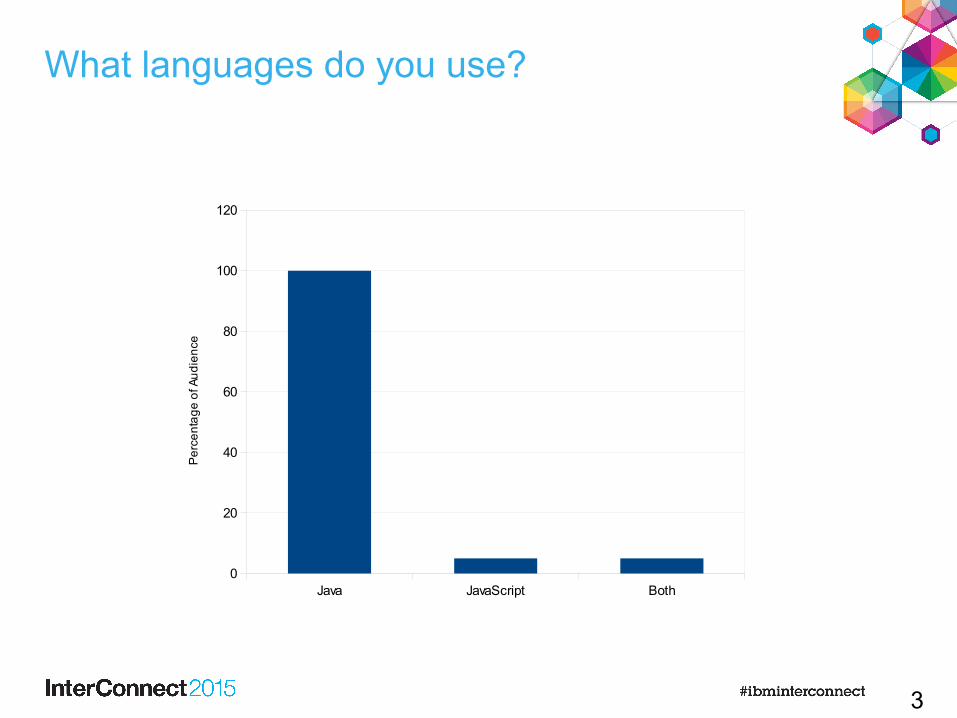
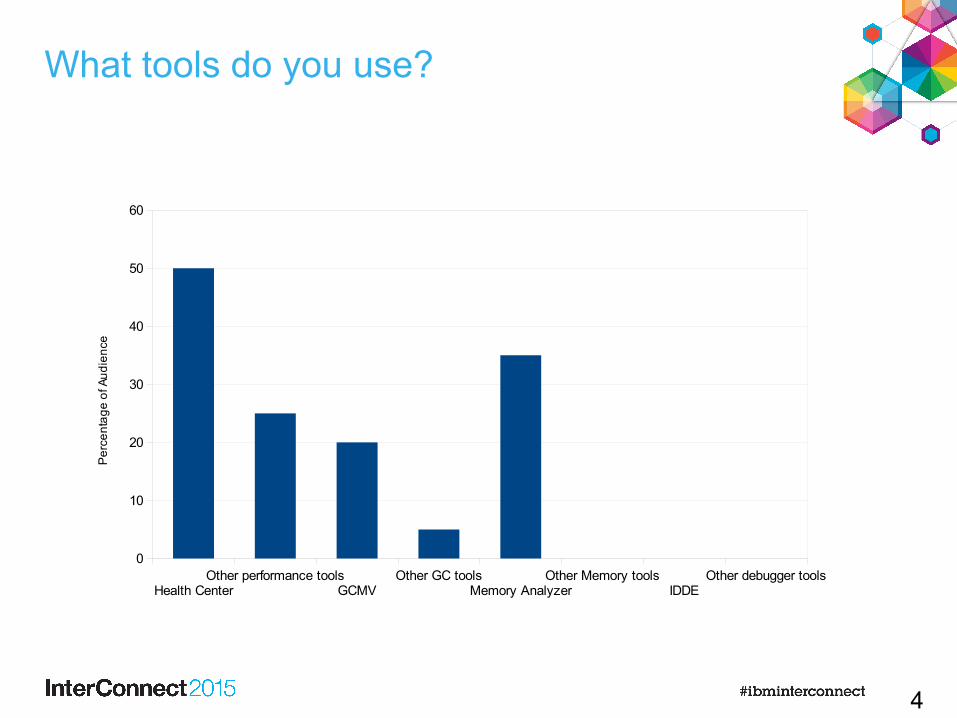
A Quick Survey
3
Java JavaScript Both0
20
40
60
80
100
120P
erc
en
tag
e o
f Au
die
nce
What languages do you use?
4
Health CenterOther performance tools
GCMVOther GC tools
Memory AnalyzerOther Memory tools
IDDEOther debugger tools
0
10
20
30
40
50
60
Pe
rce
nta
ge
of A
ud
ien
ce
What tools do you use?
5
Chris BaileySTSM, IBM Runtime Monitoring and Diagnostics Architect
- 14 years working with Java and JVM technologies- 1 year working with Node.js and V8
Recent work focus:- Java monitoring, diagnostics and troubleshooting- Java integration into the cloud- JavaScript monitoring, diagnostics and troubleshooting
My contact information:- [email protected] http://www.linkedin.com/in/chrisbaileyibm- http://www.slideshare.net/cnbailey/- @Chris__Bailey
Introduction to the Speaker
6
● Introduce the IBM tools for monitoring, debugging and diagnosing problems
● Provide understand of the capabilities of each tool
● Show how the tools can be used to solve real problems
Goals of the talk
7
Tools Overview
8
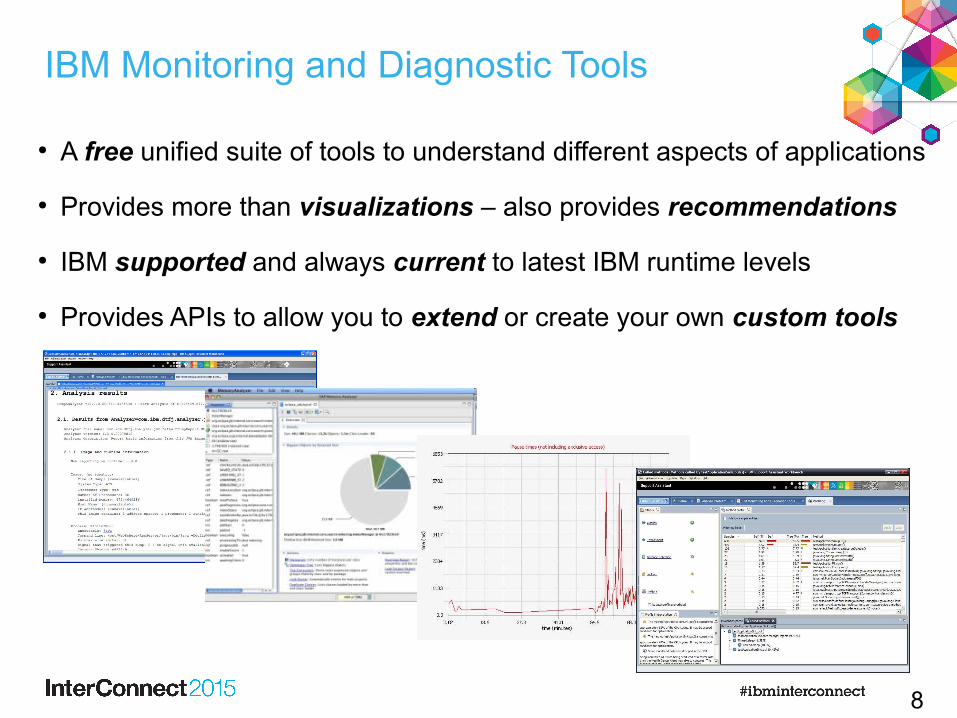
● A free unified suite of tools to understand different aspects of applications
● Provides more than visualizations – also provides recommendations
● IBM supported and always current to latest IBM runtime levels
● Provides APIs to allow you to extend or create your own custom tools
IBM Monitoring and Diagnostic Tools
9
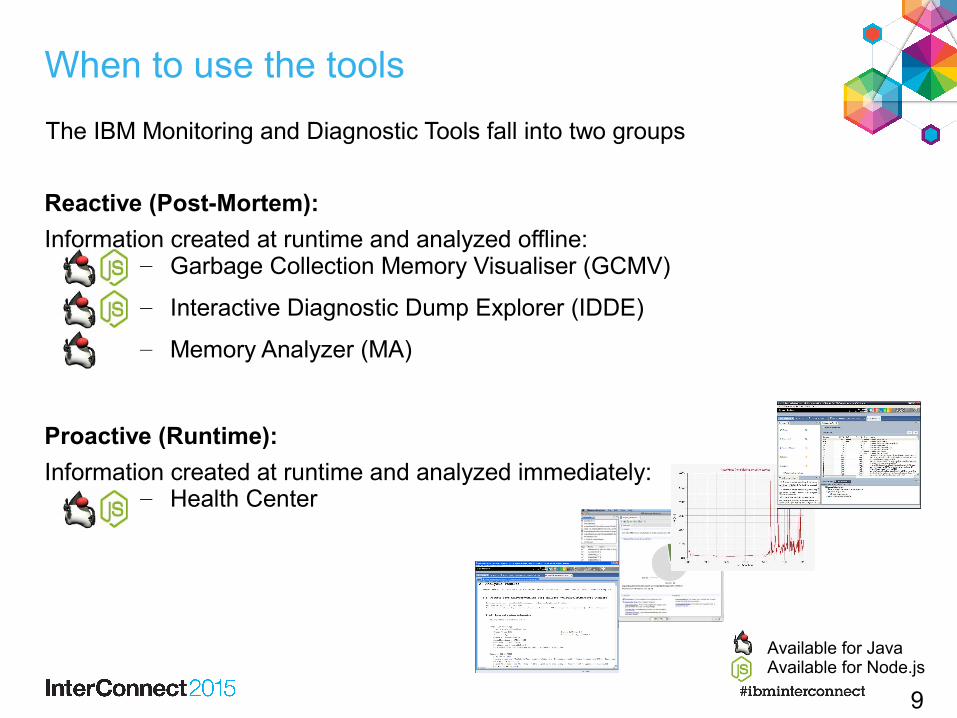
The IBM Monitoring and Diagnostic Tools fall into two groups
Reactive (Post-Mortem):
Information created at runtime and analyzed offline:– Garbage Collection Memory Visualiser (GCMV)
– Interactive Diagnostic Dump Explorer (IDDE)
– Memory Analyzer (MA)
Proactive (Runtime):
Information created at runtime and analyzed immediately:– Health Center
When to use the tools
Available for JavaAvailable for Node.js
10
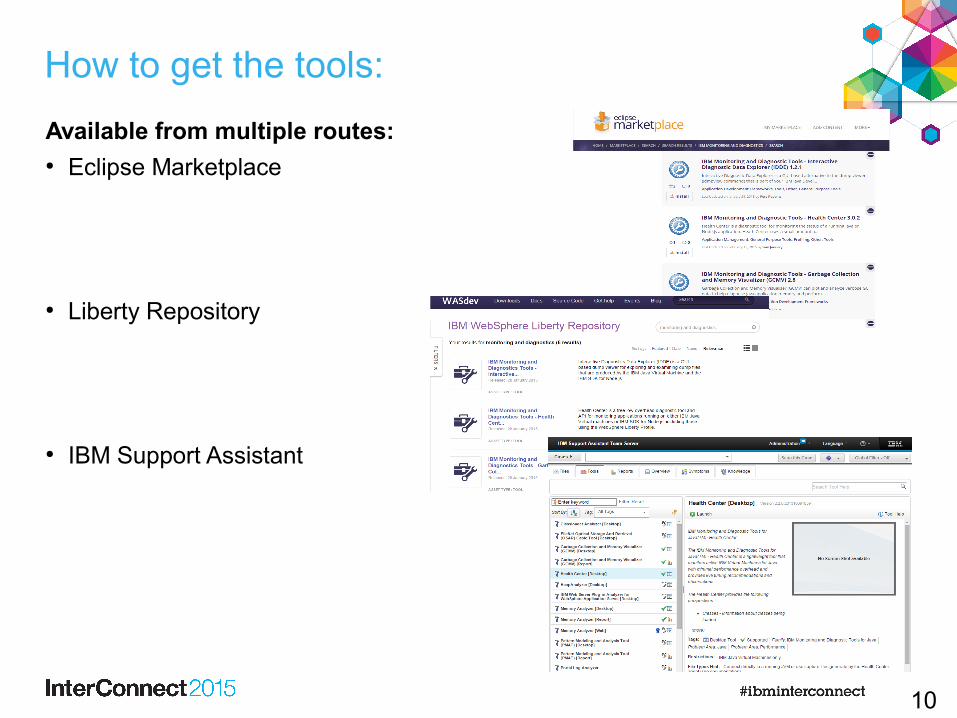
How to get the tools:
Available from multiple routes:● Eclipse Marketplace
● Liberty Repository
● IBM Support Assistant
11
Reactive Tools(Post-Mortem)
12
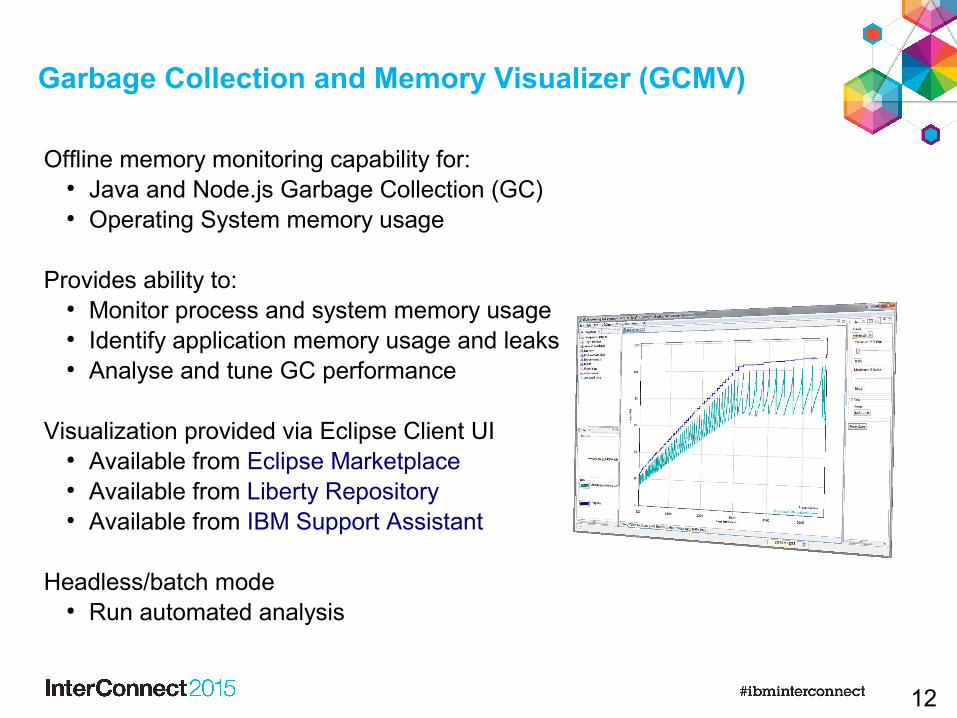
Offline memory monitoring capability for:● Java and Node.js Garbage Collection (GC)● Operating System memory usage
Provides ability to:● Monitor process and system memory usage● Identify application memory usage and leaks● Analyse and tune GC performance
Visualization provided via Eclipse Client UI● Available from Eclipse Marketplace● Available from Liberty Repository● Available from IBM Support Assistant
Headless/batch mode ● Run automated analysis
Garbage Collection and Memory Visualizer (GCMV)
13
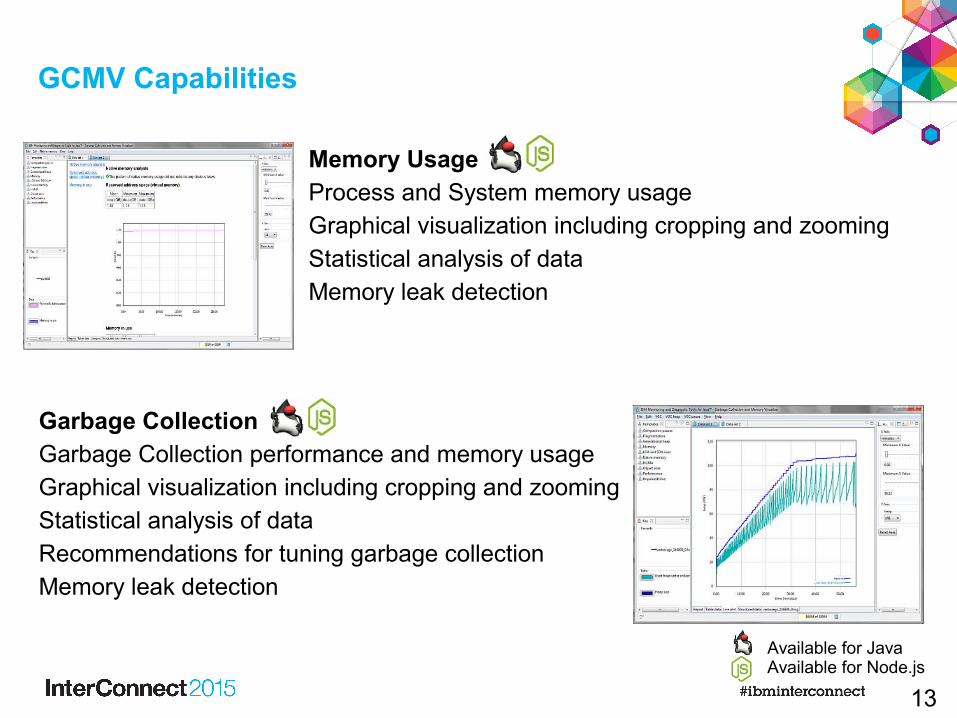
GCMV Capabilities
Available for JavaAvailable for Node.js
Garbage CollectionGarbage Collection performance and memory usageGraphical visualization including cropping and zoomingStatistical analysis of dataRecommendations for tuning garbage collectionMemory leak detection
Memory Usage Process and System memory usageGraphical visualization including cropping and zoomingStatistical analysis of dataMemory leak detection
14
#!/bin/shPID=$1INTERVAL=3
# Echo time at start of monitoring.echo timestamp = `date +%s`
# Echo the interval frequency.echo "ps interval = $INTERVAL"
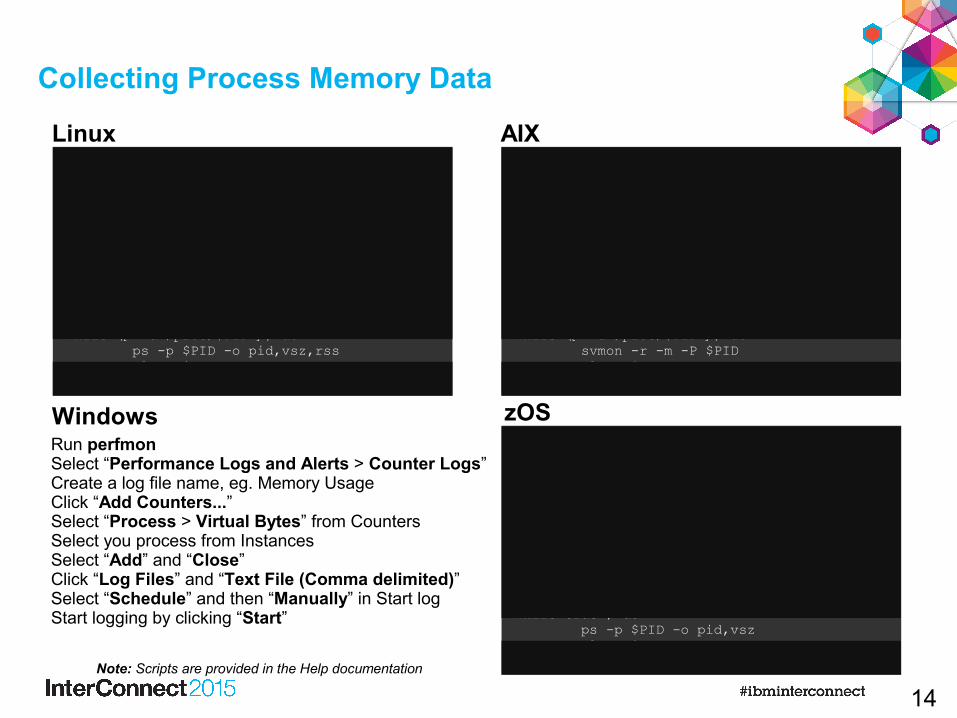
# Run the system command at intervals.while ([ -d /proc/$PID ]) do ps -p $PID -o pid,vsz,rss sleep $INTERVALdone
#!/bin/shPID=$1INTERVAL=3
# Echo time at start of monitoring.echo timestamp = `date +%s`
# Echo the interval frequency.echo "svmon interval = $INTERVAL"
# Run the system command at intervals.while ([ -d /proc/$PID ]) do svmon -r -m -P $PID sleep $INTERVALdone
#!/bin/shPID=$1INTERVAL=3
# Echo time at start of monitoring.echo timestamp = `date +%s`
# Echo the interval frequency.echo "svmon interval = $INTERVAL"
# Run the system command at intervals.while true ; do ps -p $PID -o pid,vsz sleep $INTERVALdone
Run perfmonSelect “Performance Logs and Alerts > Counter Logs”Create a log file name, eg. Memory UsageClick “Add Counters...”Select “Process > Virtual Bytes” from CountersSelect you process from InstancesSelect “Add” and “Close”Click “Log Files” and “Text File (Comma delimited)”Select “Schedule” and then “Manually” in Start logStart logging by clicking “Start”
Linux AIX
Windows zOS
Note: Scripts are provided in the Help documentation
Collecting Process Memory Data
15
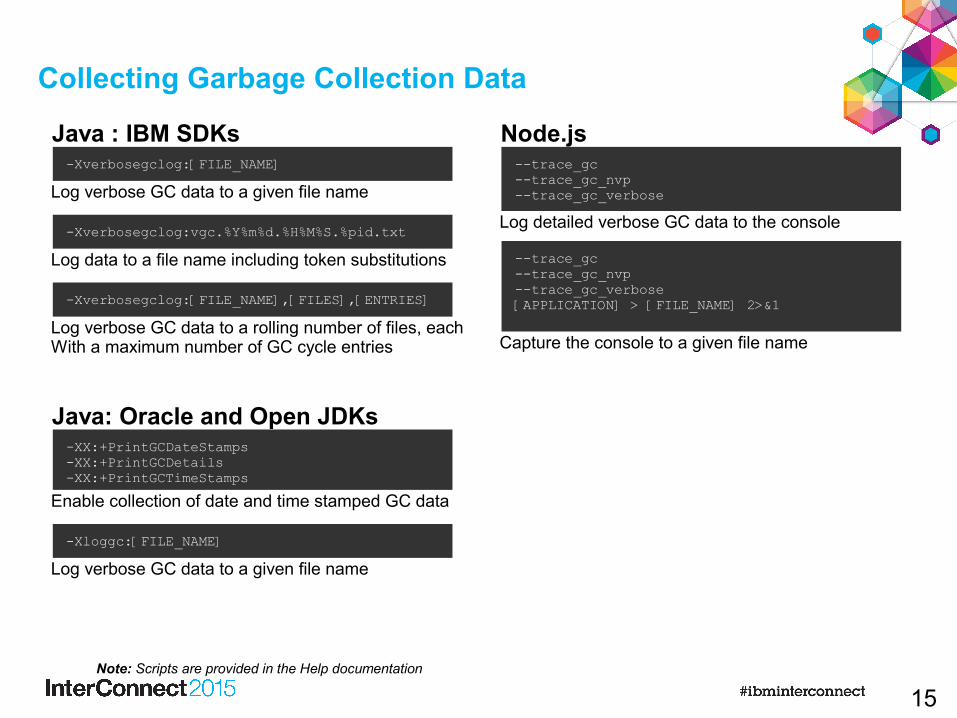
-Xverbosegclog:[FILE_NAME] --trace_gc--trace_gc_nvp--trace_gc_verbose
Java : IBM SDKs Node.js
Java: Oracle and Open JDKs
Note: Scripts are provided in the Help documentation
Log verbose GC data to a given file name
-Xverbosegclog:[FILE_NAME],[FILES],[ENTRIES]
Log verbose GC data to a rolling number of files, eachWith a maximum number of GC cycle entries
-Xverbosegclog:vgc.%Y%m%d.%H%M%S.%pid.txt
Log data to a file name including token substitutions
-XX:+PrintGCDateStamps-XX:+PrintGCDetails-XX:+PrintGCTimeStamps
-Xloggc:[FILE_NAME]
Log verbose GC data to a given file name
Enable collection of date and time stamped GC data
Log detailed verbose GC data to the console
--trace_gc--trace_gc_nvp--trace_gc_verbose[APPLICATION] > [FILE_NAME] 2>&1
Capture the console to a given file name
Collecting Garbage Collection Data
16
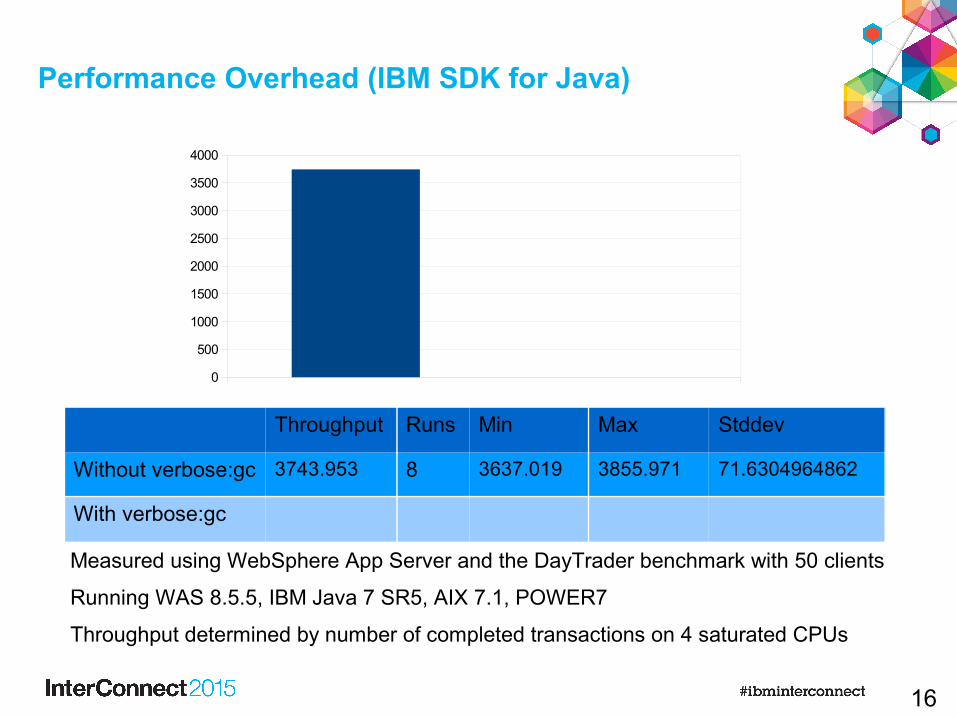
Performance Overhead (IBM SDK for Java)
Measured using WebSphere App Server and the DayTrader benchmark with 50 clients
Running WAS 8.5.5, IBM Java 7 SR5, AIX 7.1, POWER7
Throughput determined by number of completed transactions on 4 saturated CPUs
0
500
1000
1500
2000
2500
3000
3500
4000
Throughput Runs Min Max Stddev
Without verbose:gc 3743.953 8 3637.019 3855.971 71.6304964862
With verbose:gc
17
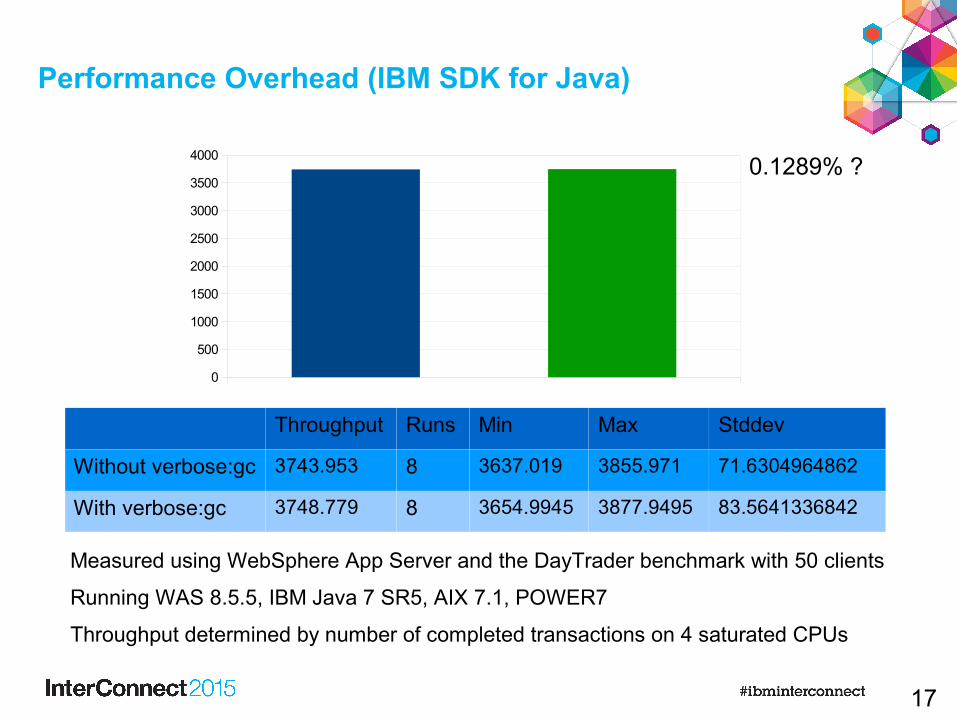
Performance Overhead (IBM SDK for Java)
Measured using WebSphere App Server and the DayTrader benchmark with 50 clients
Running WAS 8.5.5, IBM Java 7 SR5, AIX 7.1, POWER7
Throughput determined by number of completed transactions on 4 saturated CPUs
0
500
1000
1500
2000
2500
3000
3500
4000
Throughput Runs Min Max Stddev
Without verbose:gc 3743.953 8 3637.019 3855.971 71.6304964862
With verbose:gc 3748.779 8 3654.9945 3877.9495 83.5641336842
0.1289% ?
18
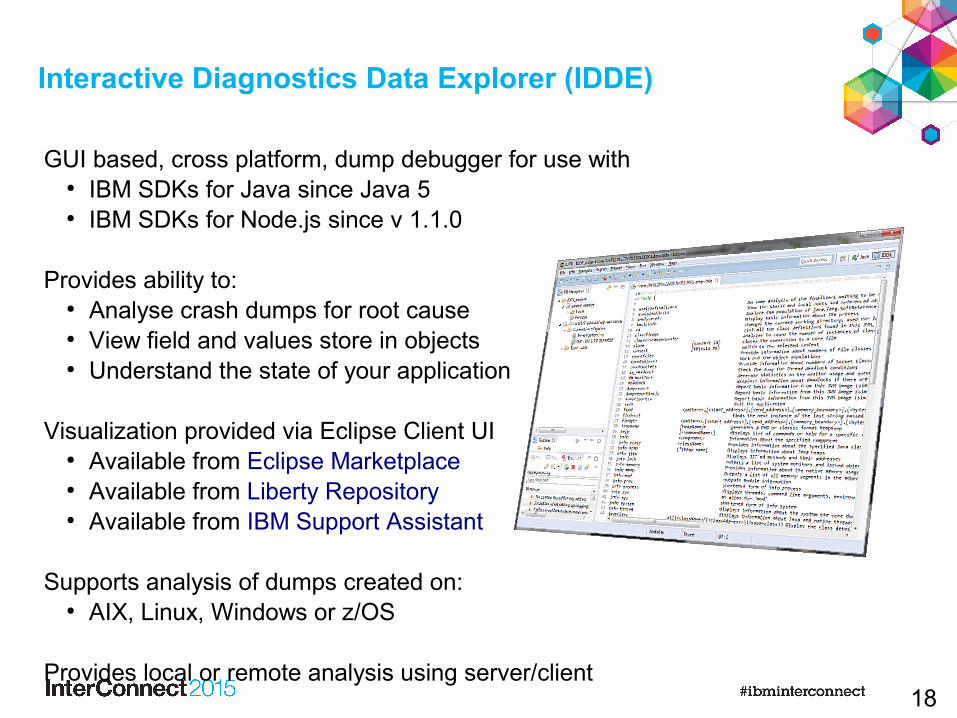
GUI based, cross platform, dump debugger for use with● IBM SDKs for Java since Java 5● IBM SDKs for Node.js since v 1.1.0
Provides ability to:● Analyse crash dumps for root cause● View field and values store in objects● Understand the state of your application
Visualization provided via Eclipse Client UI● Available from Eclipse Marketplace● Available from Liberty Repository● Available from IBM Support Assistant
Supports analysis of dumps created on:● AIX, Linux, Windows or z/OS
Provides local or remote analysis using server/client
Interactive Diagnostics Data Explorer (IDDE)
19
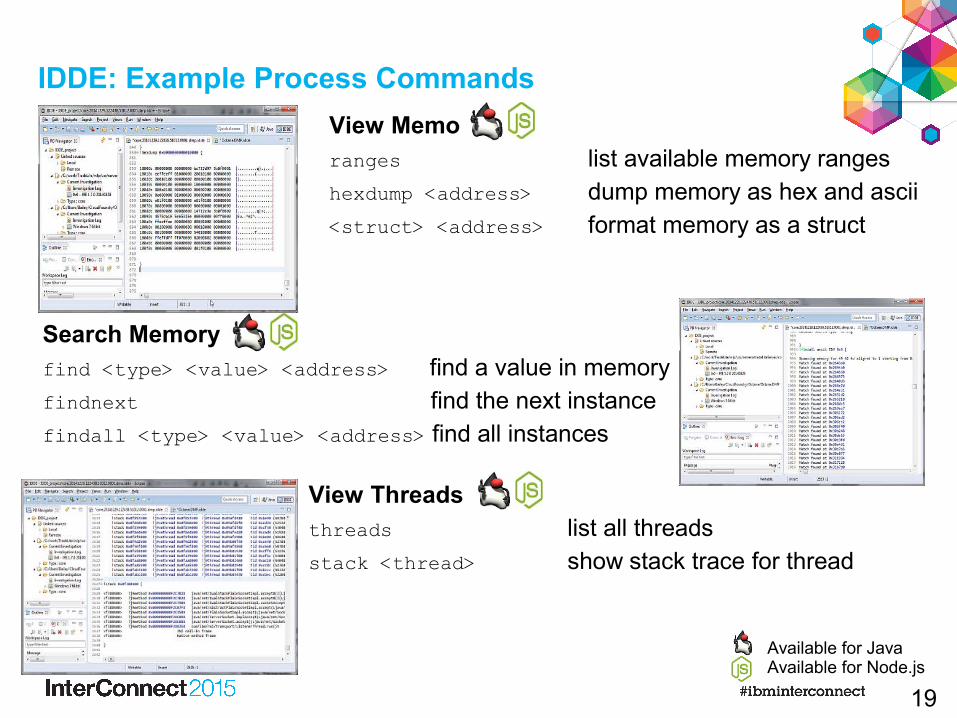
IDDE: Example Process Commands
Available for JavaAvailable for Node.js
Search Memoryfind <type> <value> <address> find a value in memoryfindnext find the next instancefindall <type> <value> <address> find all instances
View Memoryranges list available memory rangeshexdump <address> dump memory as hex and ascii<struct> <address> format memory as a struct
View Threadsthreads list all threadsstack <thread> show stack trace for thread
20
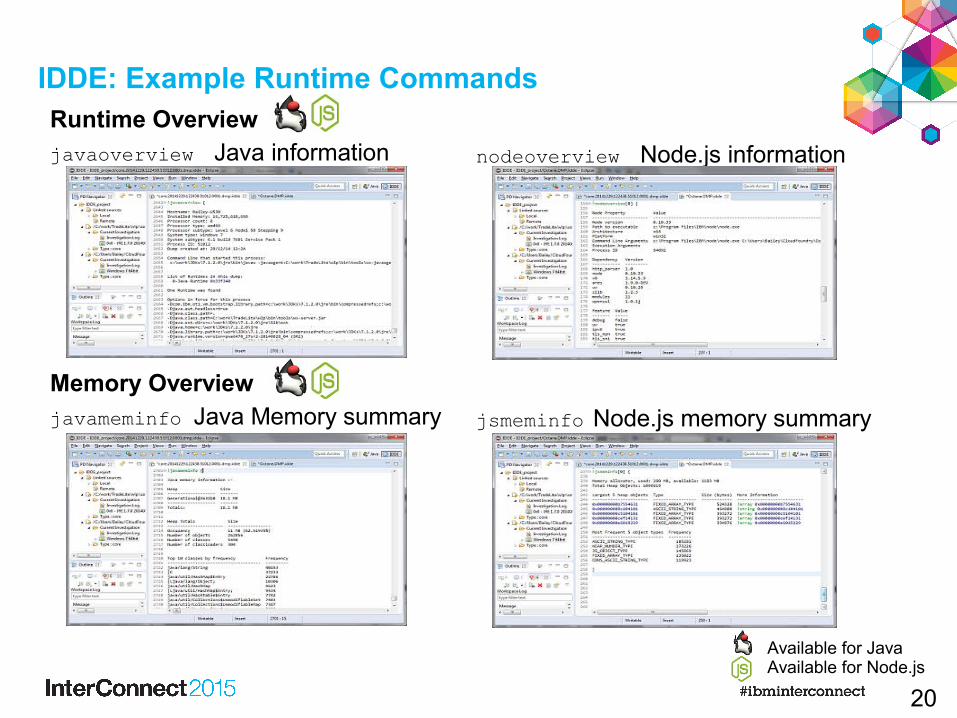
IDDE: Example Runtime Commands
Available for JavaAvailable for Node.js
Runtime Overviewjavaoverview Java information
nodeoverview Node.js information
Memory Overviewjavameminfo Java Memory summary
jsmeminfo Node.js memory summary
21
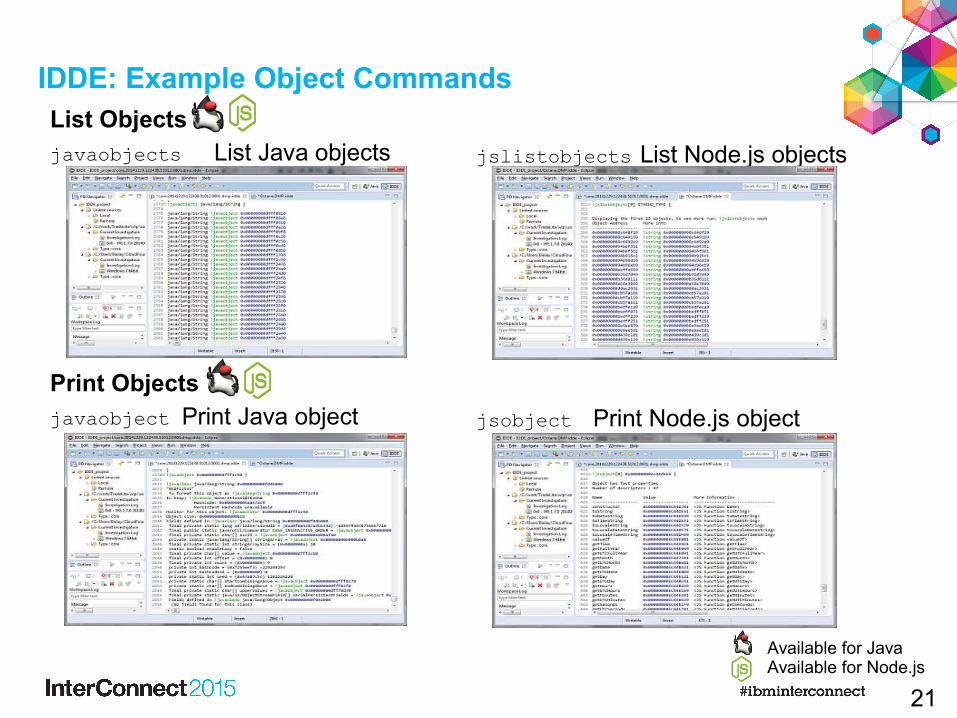
IDDE: Example Object Commands
Available for JavaAvailable for Node.js
List Objectsjavaobjects List Java objects
jslistobjects List Node.js objects
Print Objectsjavaobject Print Java object
jsobject Print Node.js object
22
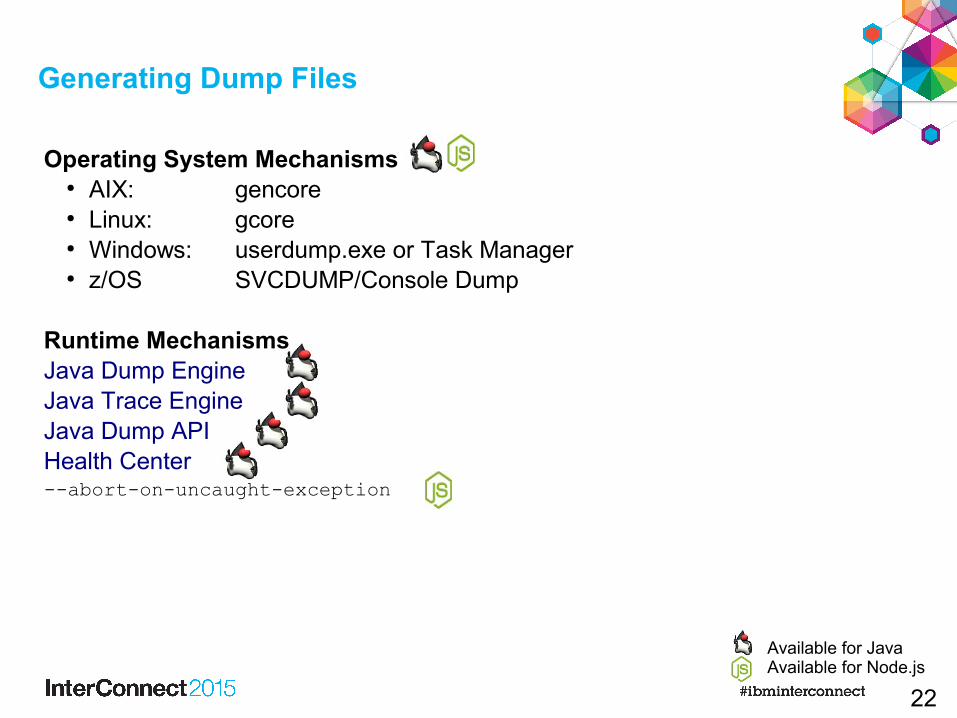
Generating Dump Files
Available for JavaAvailable for Node.js
Operating System Mechanisms● AIX: gencore● Linux: gcore● Windows: userdump.exe or Task Manager● z/OS SVCDUMP/Console Dump
Runtime MechanismsJava Dump EngineJava Trace EngineJava Dump APIHealth Center--abort-on-uncaught-exception
23
0 2000 4000 6000 8000 10000 12000 14000 16000
0
50
100
150
200
250
300
350
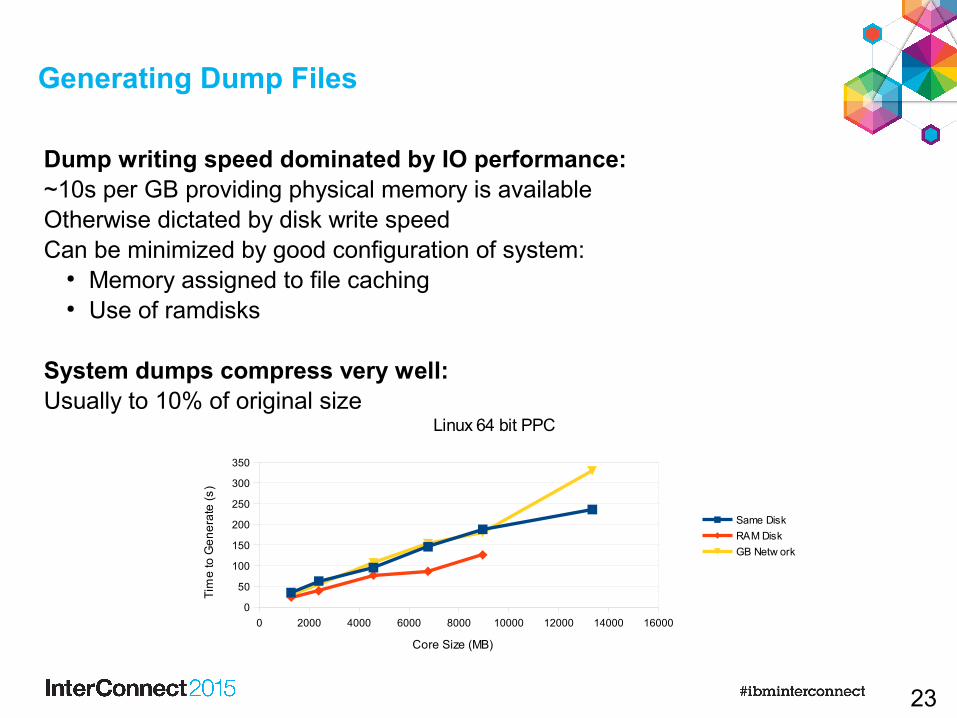
Linux 64 bit PPC
Same Disk
RAM Disk
GB Netw ork
Core Size (MB)
Tim
e to
Ge
ne
rate
(s
)
Generating Dump Files
Dump writing speed dominated by IO performance:~10s per GB providing physical memory is availableOtherwise dictated by disk write speedCan be minimized by good configuration of system:
● Memory assigned to file caching● Use of ramdisks
System dumps compress very well:Usually to 10% of original size
24
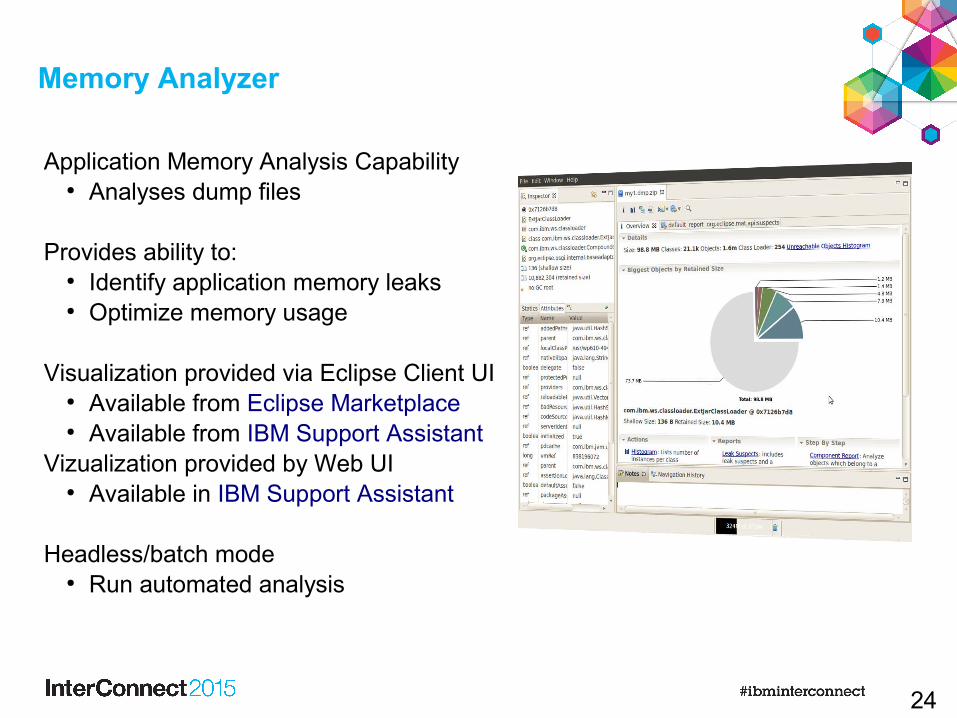
Memory Analyzer
Application Memory Analysis Capability● Analyses dump files
Provides ability to:● Identify application memory leaks● Optimize memory usage
Visualization provided via Eclipse Client UI● Available from Eclipse Marketplace● Available from IBM Support Assistant
Vizualization provided by Web UI● Available in IBM Support Assistant
Headless/batch mode ● Run automated analysis
25
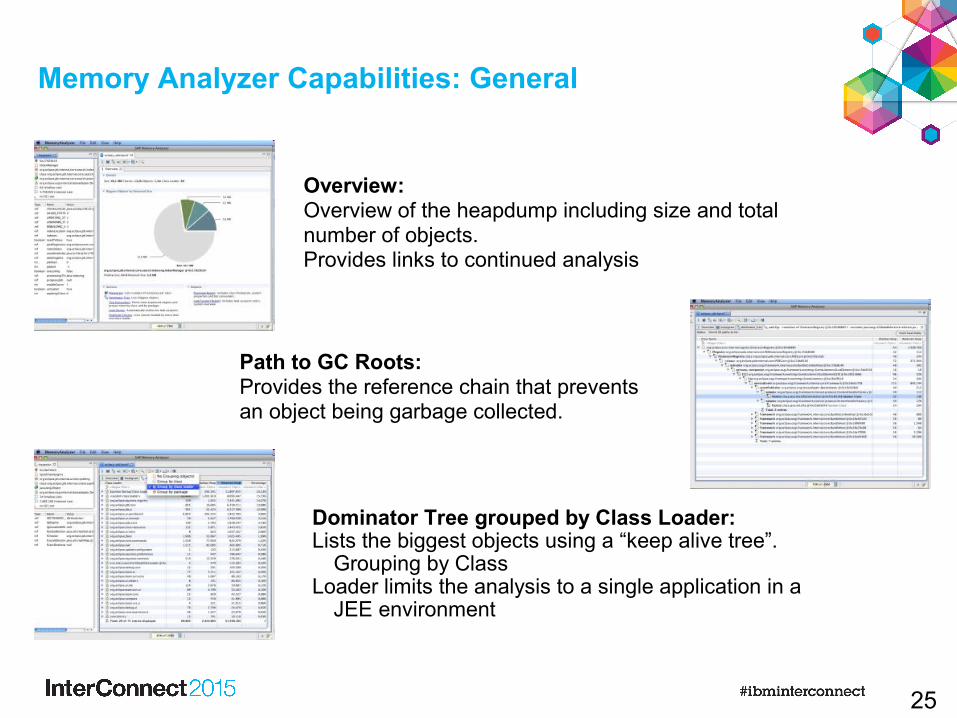
Overview:Overview of the heapdump including size and total number of objects.Provides links to continued analysis
Path to GC Roots:Provides the reference chain that prevents an object being garbage collected.
Dominator Tree grouped by Class Loader:Lists the biggest objects using a “keep alive tree”.
Grouping by ClassLoader limits the analysis to a single application in a
JEE environment
Memory Analyzer Capabilities: General
26
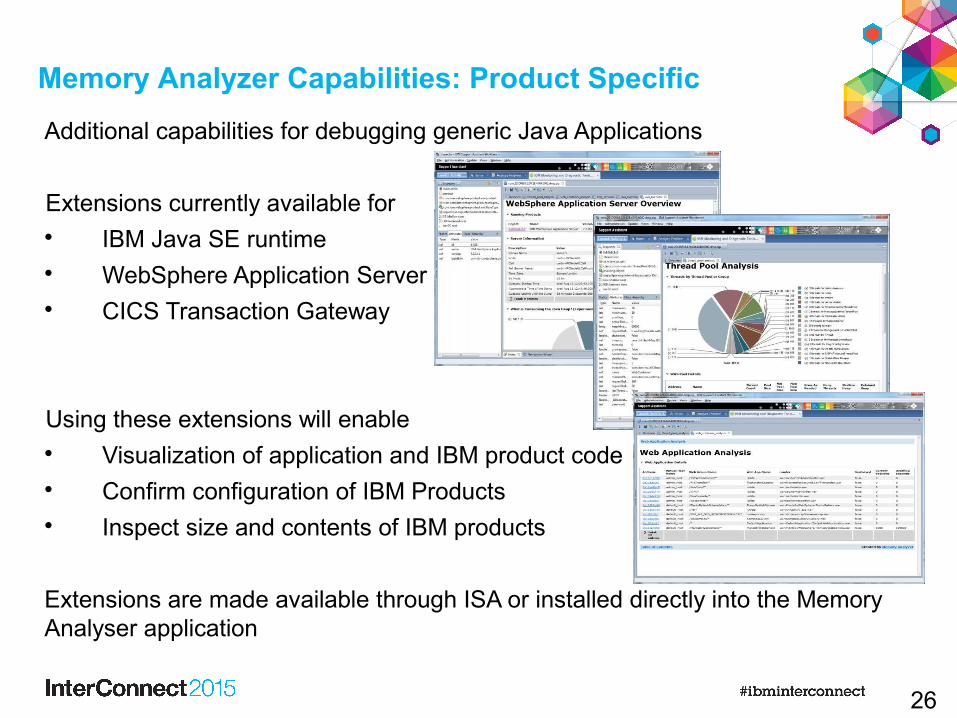
Additional capabilities for debugging generic Java Applications
Extensions currently available for IBM Java SE runtime WebSphere Application Server CICS Transaction Gateway
Using these extensions will enable Visualization of application and IBM product code Confirm configuration of IBM Products Inspect size and contents of IBM products
Extensions are made available through ISA or installed directly into the Memory Analyser application
Memory Analyzer Capabilities: Product Specific
27
Proactive Tools(Runtime)
28
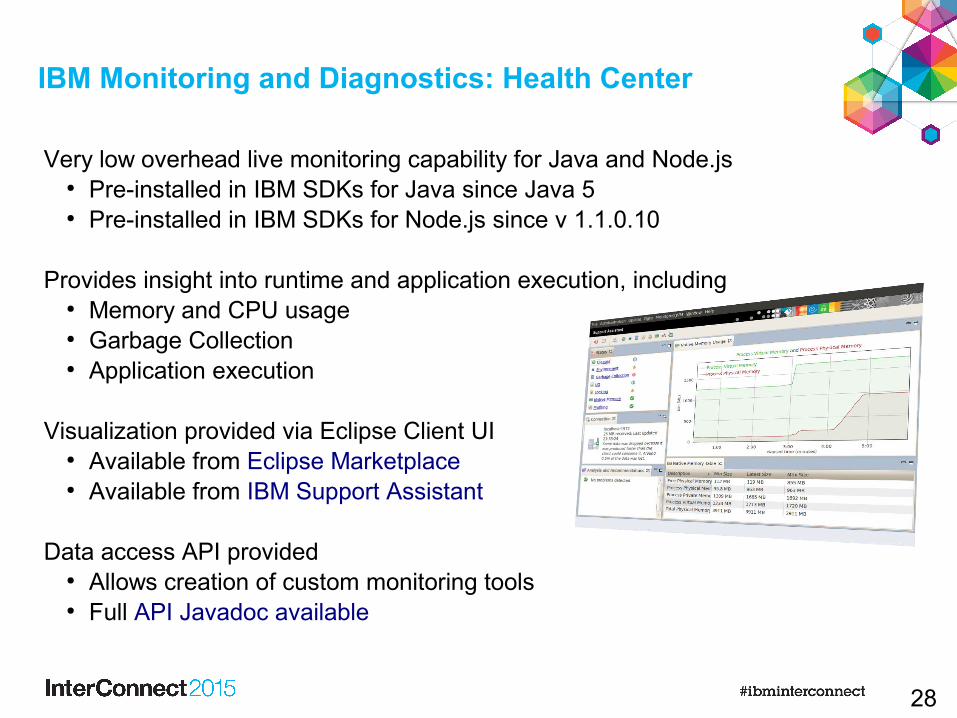
Very low overhead live monitoring capability for Java and Node.js● Pre-installed in IBM SDKs for Java since Java 5● Pre-installed in IBM SDKs for Node.js since v 1.1.0.10
Provides insight into runtime and application execution, including● Memory and CPU usage● Garbage Collection● Application execution
Visualization provided via Eclipse Client UI● Available from Eclipse Marketplace● Available from IBM Support Assistant
Data access API provided● Allows creation of custom monitoring tools● Full API Javadoc available
IBM Monitoring and Diagnostics: Health Center
29
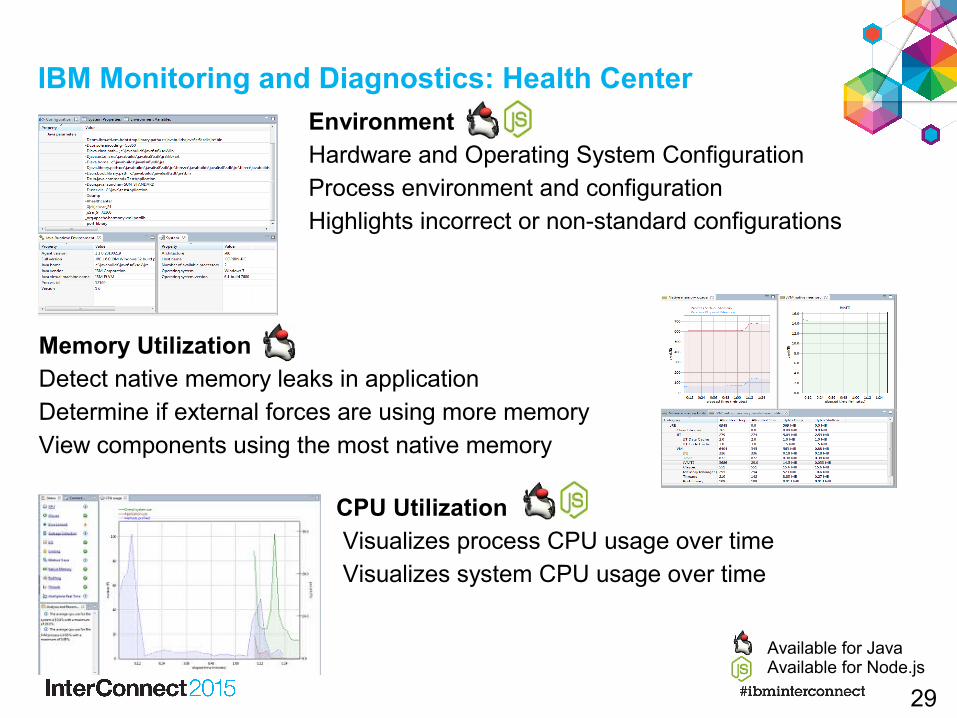
IBM Monitoring and Diagnostics: Health Center
Available for JavaAvailable for Node.js
Memory UtilizationDetect native memory leaks in applicationDetermine if external forces are using more memoryView components using the most native memory
Environment Hardware and Operating System ConfigurationProcess environment and configurationHighlights incorrect or non-standard configurations
CPU Utilization Visualizes process CPU usage over time Visualizes system CPU usage over time
30
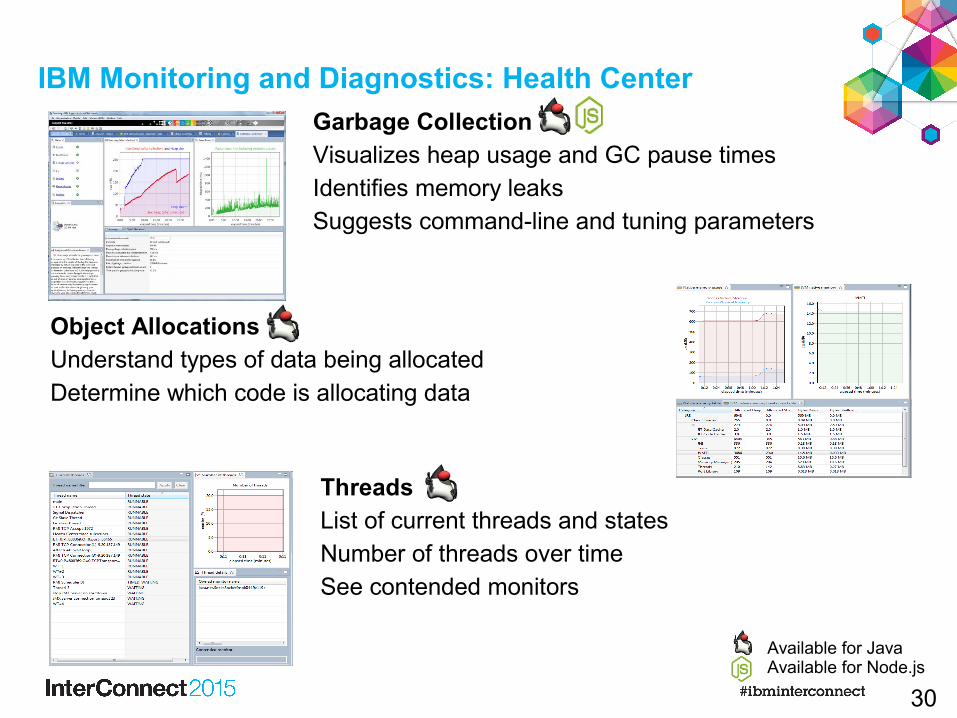
IBM Monitoring and Diagnostics: Health Center
Available for JavaAvailable for Node.js
Object AllocationsUnderstand types of data being allocatedDetermine which code is allocating data
ThreadsList of current threads and statesNumber of threads over timeSee contended monitors
Garbage CollectionVisualizes heap usage and GC pause timesIdentifies memory leaksSuggests command-line and tuning parameters
31
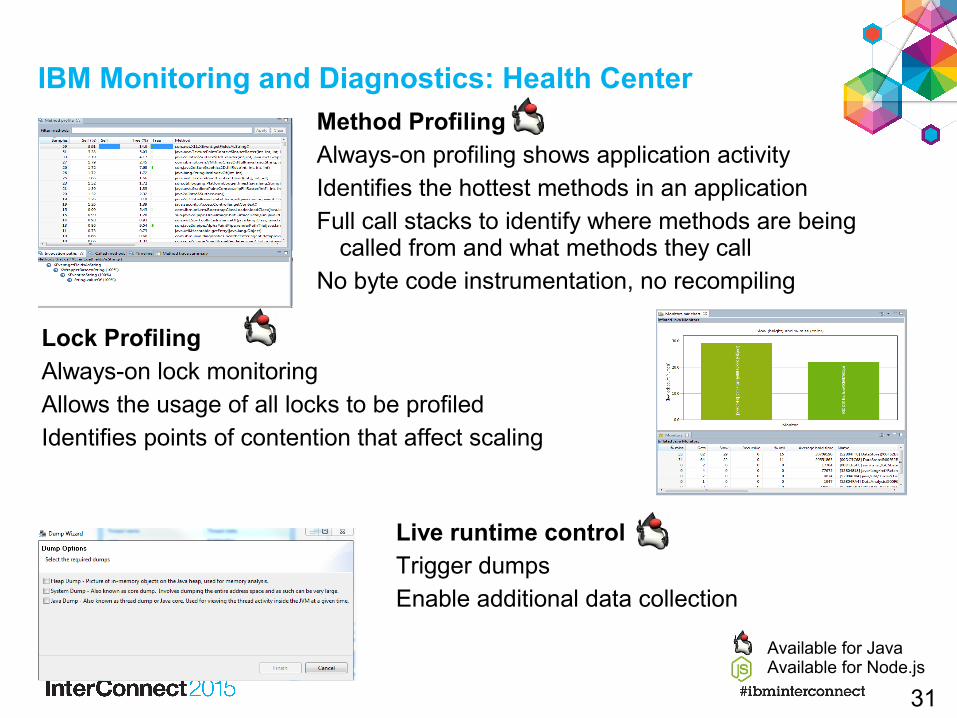
IBM Monitoring and Diagnostics: Health Center
Available for JavaAvailable for Node.js
Lock ProfilingAlways-on lock monitoringAllows the usage of all locks to be profiledIdentifies points of contention that affect scaling
Live runtime controlTrigger dumpsEnable additional data collection
Method ProfilingAlways-on profiling shows application activityIdentifies the hottest methods in an applicationFull call stacks to identify where methods are being
called from and what methods they callNo byte code instrumentation, no recompiling
32
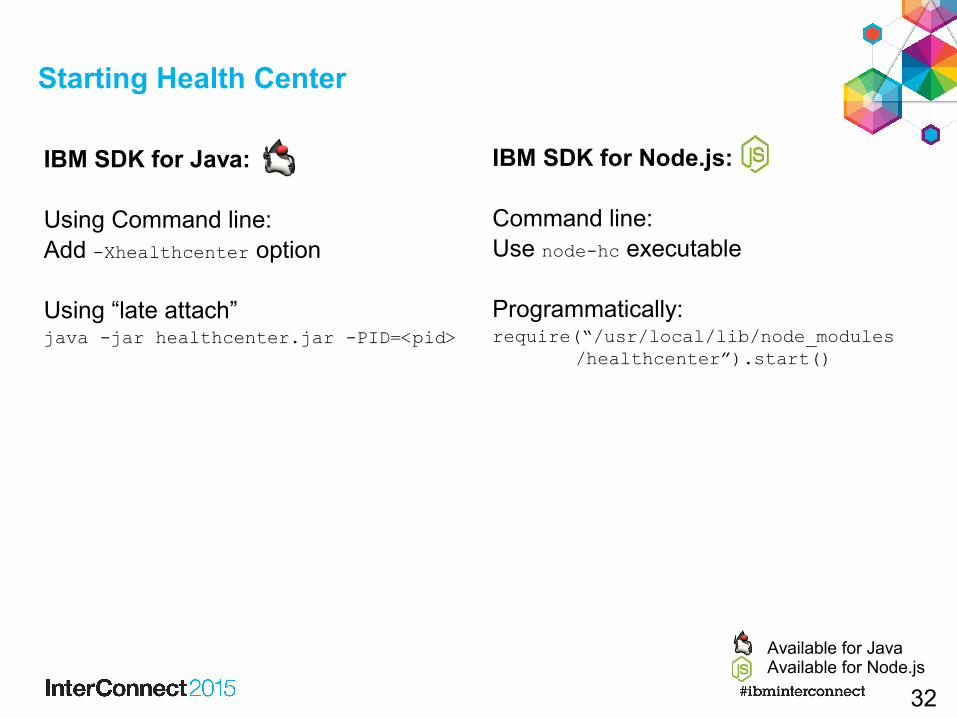
IBM SDK for Java:
Using Command line:Add -Xhealthcenter option
Using “late attach”java -jar healthcenter.jar -PID=<pid>
Starting Health Center
IBM SDK for Node.js:
Command line:Use node-hc executable
Programmatically:require(“/usr/local/lib/node_modules
/healthcenter”).start()
Available for JavaAvailable for Node.js
33
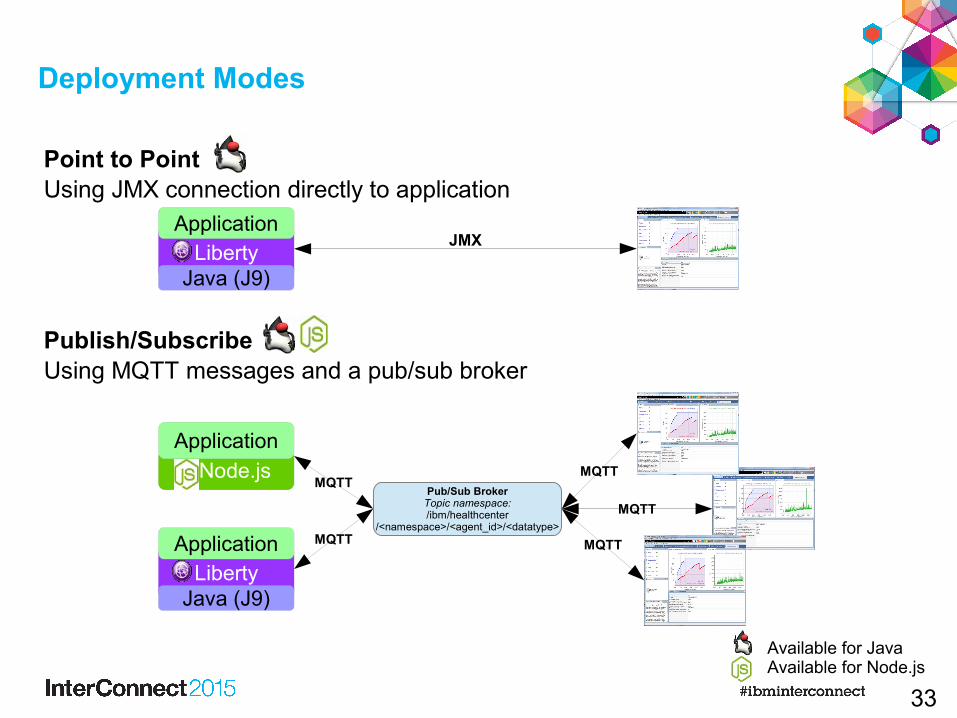
Point to PointUsing JMX connection directly to application
Publish/SubscribeUsing MQTT messages and a pub/sub broker
Deployment Modes
Available for JavaAvailable for Node.js
Pub/Sub BrokerTopic namespace:/ibm/healthcenter
/<namespace>/<agent_id>/<datatype>
Node.js
Application
LibertyJava (J9)
Application
LibertyJava (J9)
ApplicationJMX
MQTT
MQTT
MQTT
MQTT
MQTT
34
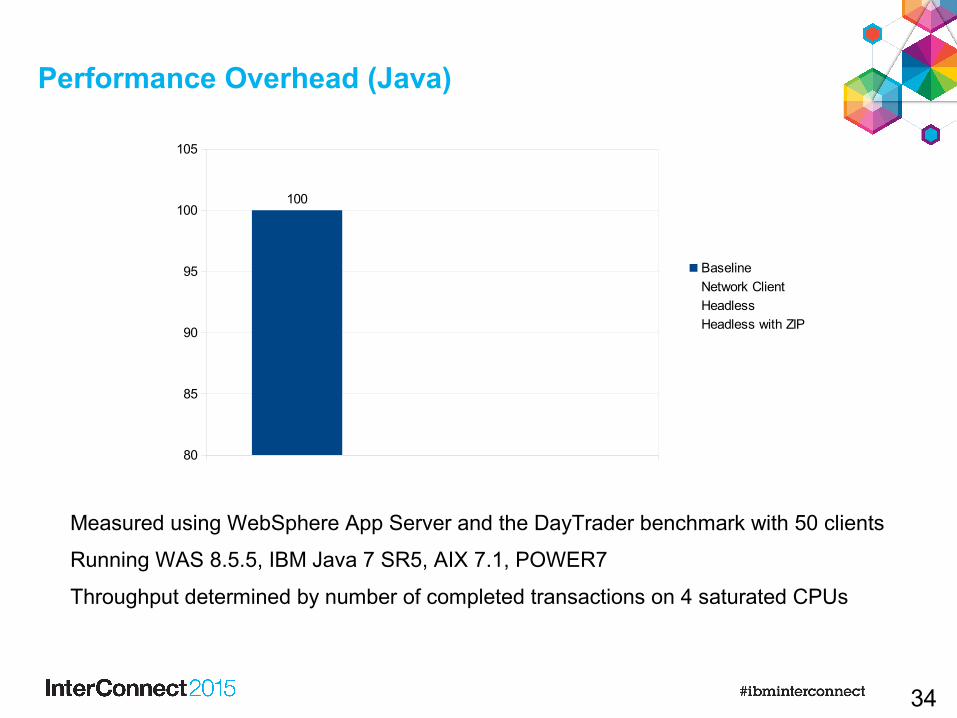
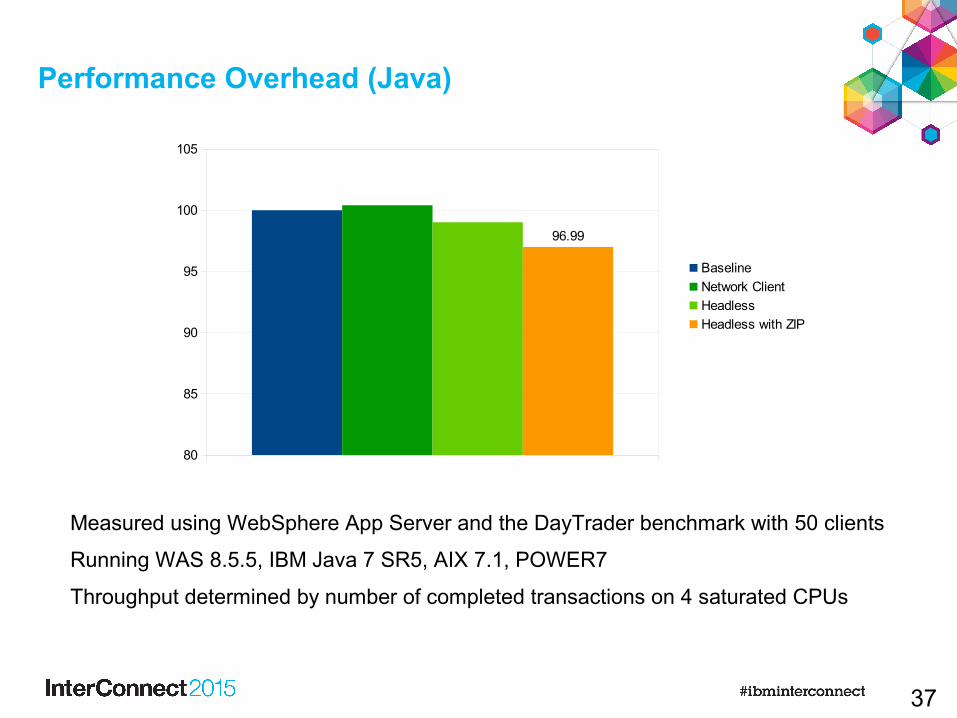
Performance Overhead (Java)
Measured using WebSphere App Server and the DayTrader benchmark with 50 clients
Running WAS 8.5.5, IBM Java 7 SR5, AIX 7.1, POWER7
Throughput determined by number of completed transactions on 4 saturated CPUs
80
85
90
95
100
105
100
Baseline
Network Client
Headless
Headless with ZIP
35
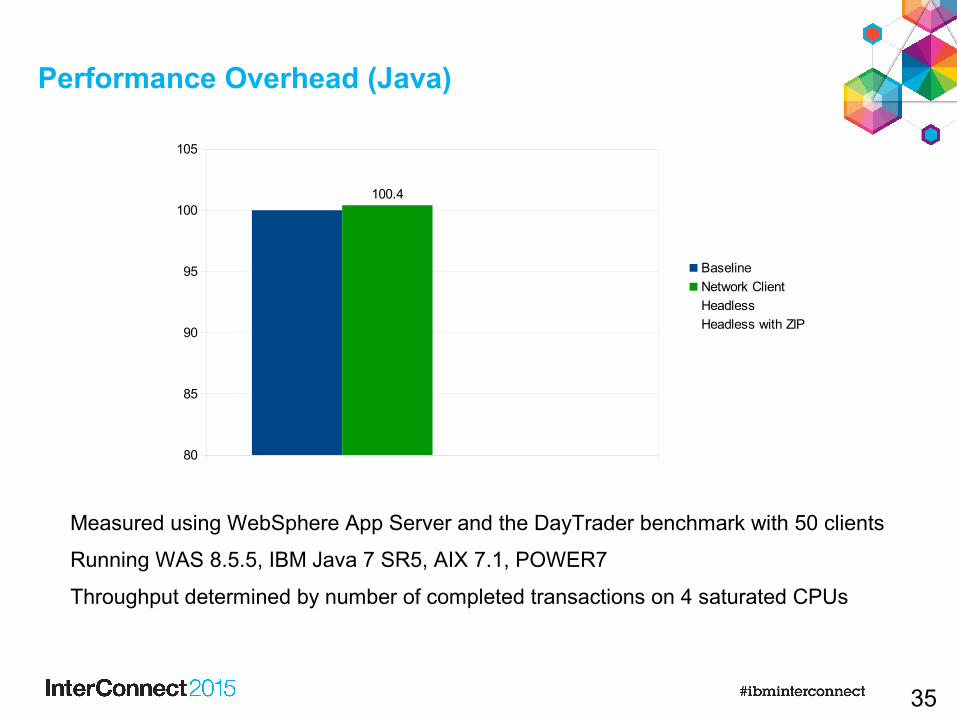
Performance Overhead (Java)
Measured using WebSphere App Server and the DayTrader benchmark with 50 clients
Running WAS 8.5.5, IBM Java 7 SR5, AIX 7.1, POWER7
Throughput determined by number of completed transactions on 4 saturated CPUs
80
85
90
95
100
105
100.4
Baseline
Network Client
Headless
Headless with ZIP
36
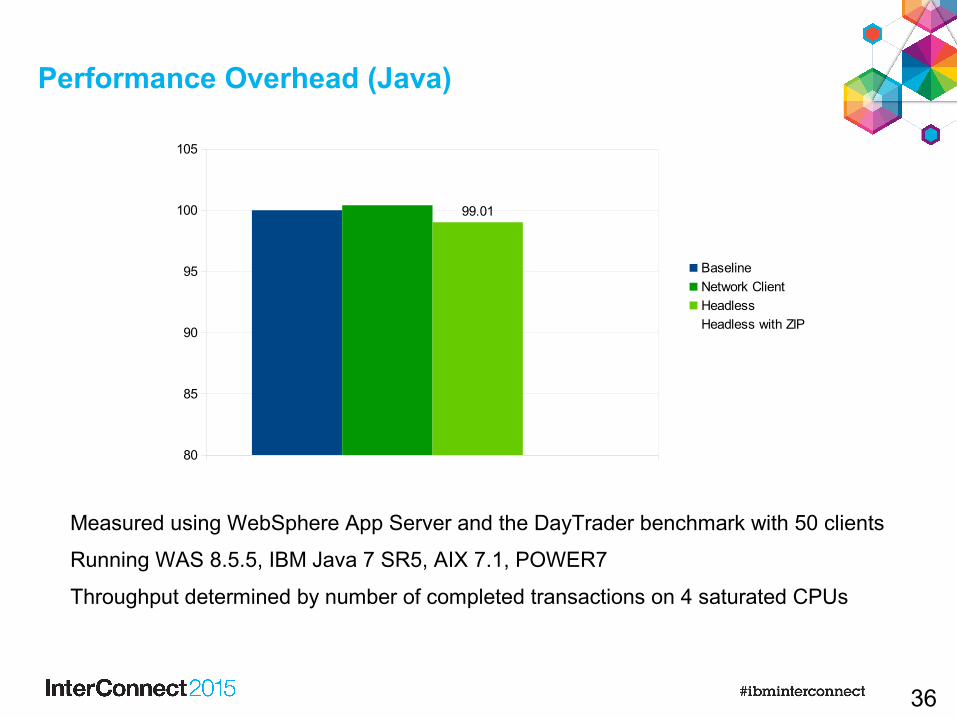
Performance Overhead (Java)
Measured using WebSphere App Server and the DayTrader benchmark with 50 clients
Running WAS 8.5.5, IBM Java 7 SR5, AIX 7.1, POWER7
Throughput determined by number of completed transactions on 4 saturated CPUs
80
85
90
95
100
105
99.01
Baseline
Network Client
Headless
Headless with ZIP
37
Performance Overhead (Java)
Measured using WebSphere App Server and the DayTrader benchmark with 50 clients
Running WAS 8.5.5, IBM Java 7 SR5, AIX 7.1, POWER7
Throughput determined by number of completed transactions on 4 saturated CPUs
80
85
90
95
100
105
96.99
Baseline
Network Client
Headless
Headless with ZIP
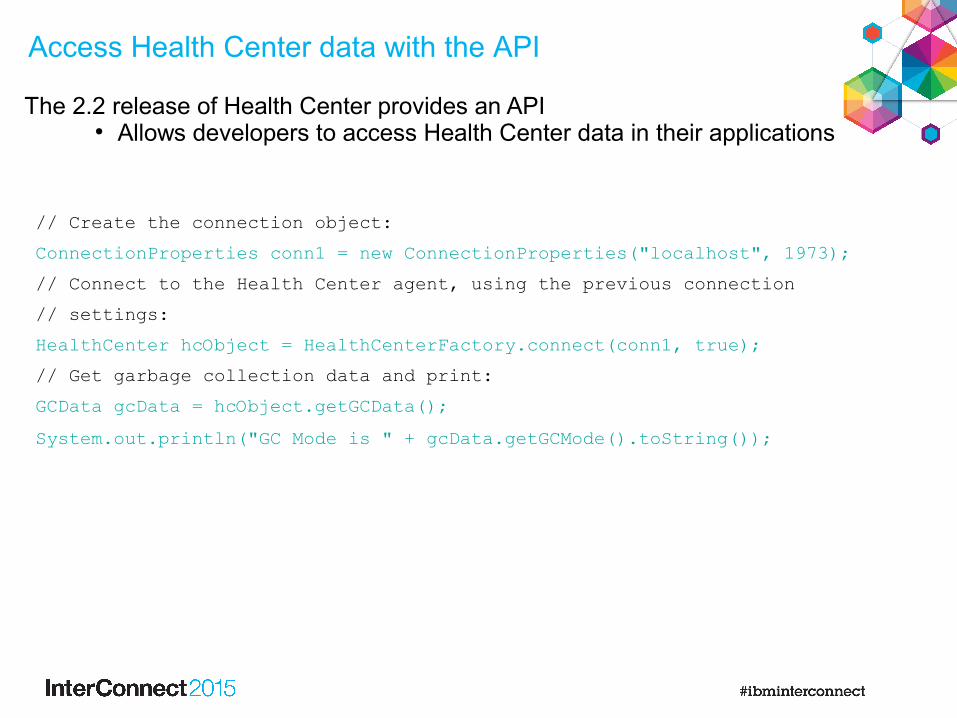
The 2.2 release of Health Center provides an API ● Allows developers to access Health Center data in their applications
// Create the connection object:
ConnectionProperties conn1 = new ConnectionProperties("localhost", 1973);
// Connect to the Health Center agent, using the previous connection
// settings:
HealthCenter hcObject = HealthCenterFactory.connect(conn1, true);
// Get garbage collection data and print:
GCData gcData = hcObject.getGCData();
System.out.println("GC Mode is " + gcData.getGCMode().toString());
Access Health Center data with the API
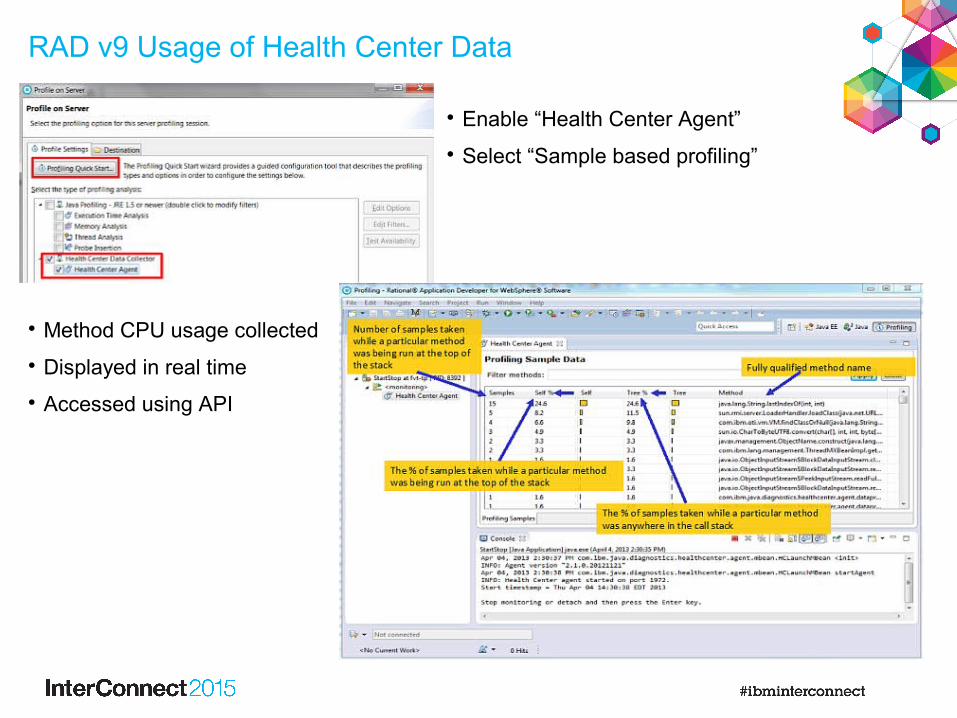
RAD v9 Usage of Health Center Data
Enable “Health Center Agent”
Select “Sample based profiling”
Method CPU usage collected
Displayed in real time
Accessed using API
IBM SupportAssistant 5
41
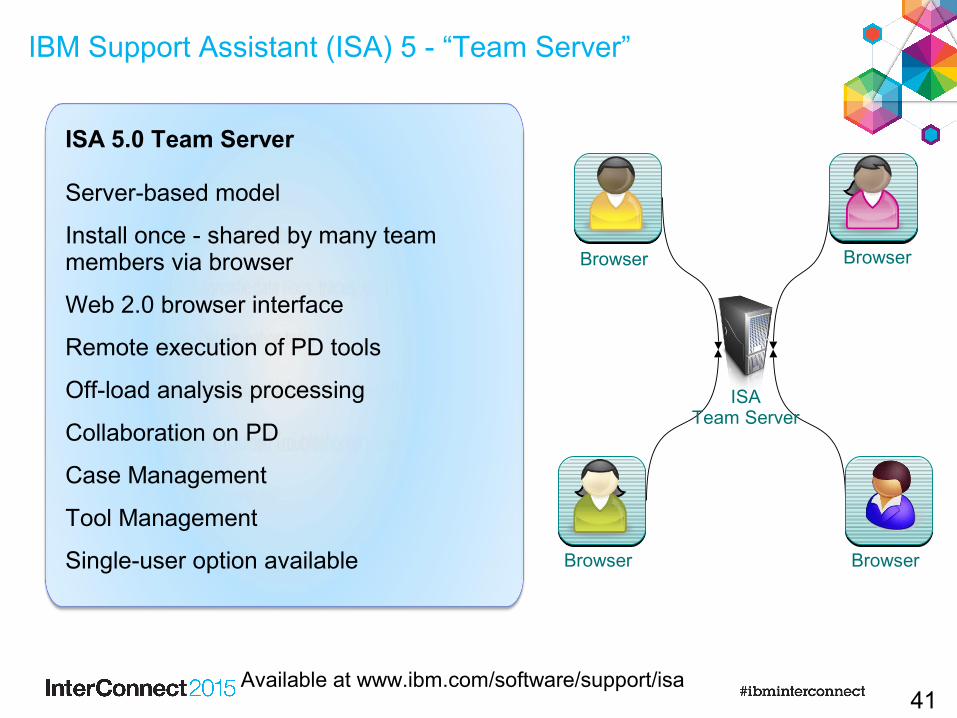
ISA 5.0 Team Server
Server-based model
Install once - shared by many team members via browser
Web 2.0 browser interface
Remote execution of PD tools
Off-load analysis processing
Collaboration on PD
Case Management
Tool Management
Single-user option available
Available at www.ibm.com/software/support/isa
BrowserBrowser
BrowserBrowser
ISATeam Server
IBM Support Assistant (ISA) 5 - “Team Server”
42
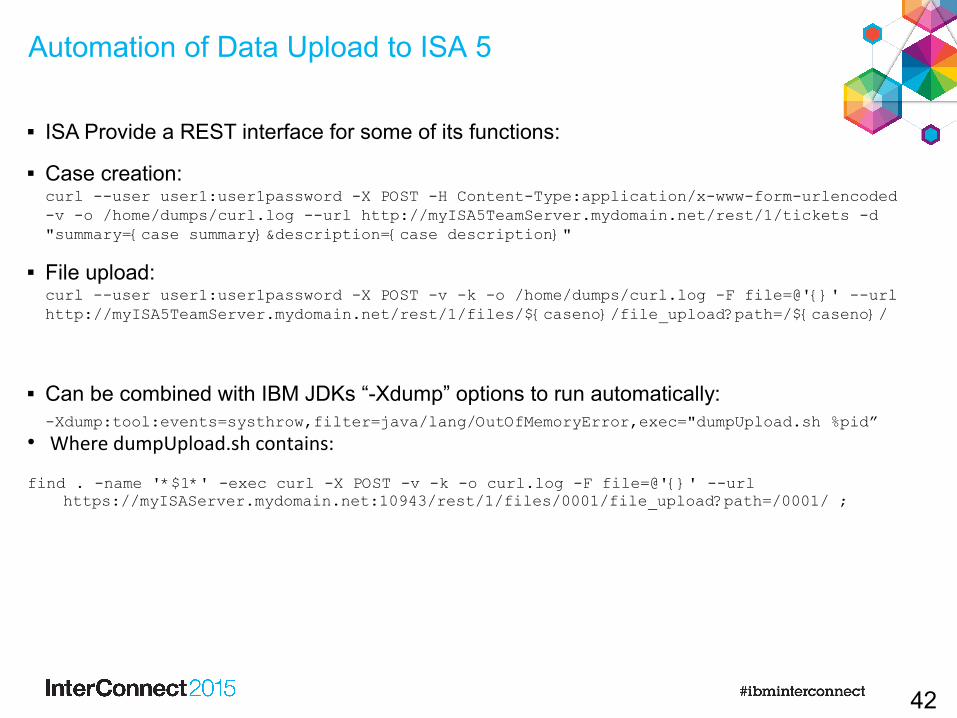
■ ISA Provide a REST interface for some of its functions:
■ Case creation:curl --user user1:user1password -X POST -H Content-Type:application/x-www-form-urlencoded -v -o /home/dumps/curl.log --url http://myISA5TeamServer.mydomain.net/rest/1/tickets -d "summary={case summary}&description={case description}"
■ File upload:curl --user user1:user1password -X POST -v -k -o /home/dumps/curl.log -F file=@'{}' --url http://myISA5TeamServer.mydomain.net/rest/1/files/${caseno}/file_upload?path=/${caseno}/
■ Can be combined with IBM JDKs “-Xdump” options to run automatically:-Xdump:tool:events=systhrow,filter=java/lang/OutOfMemoryError,exec="dumpUpload.sh %pid”
● Where dumpUpload.sh contains:
find . -name '*$1*' -exec curl -X POST -v -k -o curl.log -F file=@'{}' --url https://myISAServer.mydomain.net:10943/rest/1/files/0001/file_upload?path=/0001/ ;
Automation of Data Upload to ISA 5
43
Demo
44
IBM is building a set of integrated monitoring and diagnostic tools– Taking a ground up approach, integrating with the runtime
Working to make these common across runtimes– Remove the need to “learn” how to monitor and diagnose new languages
What Next??
Summary
Notices and DisclaimersCopyright © 2015 by International Business Machines Corporation (IBM). No part of this document may be reproduced or transmitted in any form without written permission from IBM.
U.S. Government Users Restricted Rights - Use, duplication or disclosure restricted by GSA ADP Schedule Contract with IBM.
Information in these presentations (including information relating to products that have not yet been announced by IBM) has been reviewed for accuracy as of the date of initial publication and could include unintentional technical or typographical errors. IBM shall have no responsibility to update this information. THIS document is distributed "AS IS" without any warranty, either express or implied. In no event shall IBM be liable for any damage arising from the use of this information, including but not limited to, loss of data, business interruption, loss of profit or loss of opportunity. IBM products and services are warranted according to the terms and conditions of the agreements under which they are provided.
Any statements regarding IBM's future direction, intent or product plans are subject to change or withdrawal without notice.
Performance data contained herein was generally obtained in a controlled, isolated environments. Customer examples are presented as illustrations of how those customers have used IBM products and the results they may have achieved. Actual performance, cost, savings or other results in other operating environments may vary.
References in this document to IBM products, programs, or services does not imply that IBM intends to make such products, programs or services available in all countries in which IBM operates or does business.
Workshops, sessions and associated materials may have been prepared by independent session speakers, and do not necessarily reflect the views of IBM. All materials and discussions are provided for informational purposes only, and are neither intended to, nor shall constitute legal or other guidance or advice to any individual participant or their specific situation.
It is the customer’s responsibility to insure its own compliance with legal requirements and to obtain advice of competent legal counsel as to the identification and interpretation of any relevant laws and regulatory requirements that may affect the customer’s business and any actions the customer may need to take to comply with such laws. IBM does not provide legal advice or represent or warrant that its services or products will ensure that the customer is in compliance with any law.
Notices and Disclaimers (con’t)
Information concerning non-IBM products was obtained from the suppliers of those products, their published announcements or other publicly available sources. IBM has not tested those products in connection with this publication and cannot confirm the accuracy of performance, compatibility or any other claims related to non-IBM products. Questions on the capabilities of non-IBM products should be addressed to the suppliers of those products. IBM does not warrant the quality of any third-party products, or the ability of any such third-party products to interoperate with IBM’s products. IBM expressly disclaims all warranties, expressed or implied, including but not limited to, the implied warranties of merchantability and fitness for a particular purpose.
The provision of the information contained herein is not intended to, and does not, grant any right or license under any IBM patents, copyrights, trademarks or other intellectual property right.
• IBM, the IBM logo, ibm.com, Bluemix, Blueworks Live, CICS, Clearcase, DOORS®, Enterprise Document Management System™, Global Business Services ®, Global Technology Services ®, Information on Demand, ILOG, Maximo®, MQIntegrator®, MQSeries®, Netcool®, OMEGAMON, OpenPower, PureAnalytics™, PureApplication®, pureCluster™, PureCoverage®, PureData®, PureExperience®, PureFlex®, pureQuery®, pureScale®, PureSystems®, QRadar®, Rational®, Rhapsody®, SoDA, SPSS, StoredIQ, Tivoli®, Trusteer®, urban{code}®, Watson, WebSphere®, Worklight®, X-Force® and System z® Z/OS, are trademarks of International Business Machines Corporation, registered in many jurisdictions worldwide. Other product and service names might be trademarks of IBM or other companies. A current list of IBM trademarks is available on the Web at "Copyright and trademark information" at: www.ibm.com/legal/copytrade.shtml.
Thank You
Your Feedback is Important!
Access the InterConnect 2015 Conference CONNECT Attendee Portal to complete your session surveys from your smartphone,
laptop or conference kiosk.


![JavaScript, HTML, DOM. Java vs JavaScript "When Java applets failed, JavaScript became the 'Language of the Web' by default. [...] It is unfortunate that](https://img.pdfslide.us/doc/110x75/5697bfeb1a28abf838cb7a38/javascript-html-dom-java-vs-javascript-when-java-applets-failed-javascript.jpg)