Embed Size (px)
Citation preview

Business & Manufacturing
Intelligence
Eric A. Erickson, MSEEPresident, E2i, Inc.

Charles Mingus, American Jazz Bassist, composer
2
Making the simple complicated is commonplace; making the complicated simple, awesomely simple, that's creativity.
Making the complicated simple…
3
We live in a very complicated world. We lead complicated lives. We have complicated jobs. The ability to make good decisions rests on the shoulders of those who understand these complicated things and can make sense of them. The rest of us need help.
We must make complication, simple.We need intelligence to do that.

Business & Manufacturing Intelligence
4
What is Business & Manufacturing Intelligence? Methods and tools used to accumulate, aggregate and
analyze data for the purpose of improving processes, strategies and capabilities
Not new concepts but still go unused due to lack of useful low cost tools and an understanding of how to make the complicated, simple

Growth of Data in the World
5

The Reduction of Digital Memory Cost
6

The Reduction of Digital Memory Cost
7
In 1956, IBM built these 3.75 MB hard drives, weighing approximately one ton and leased for $3,200 per month
Massive amounts of Data yet no Knowledge
8
We have so much data that simply viewing it provides us no insights, no understanding no knowledge.

With so much data, finding anything useful is like finding a “needle in a haystack!”
9
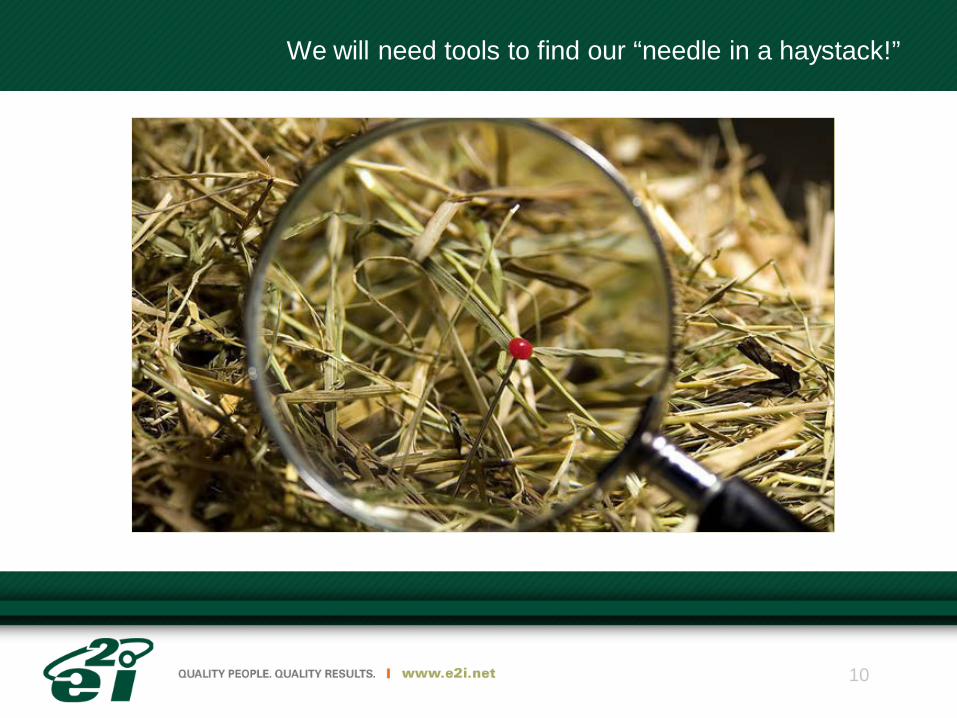
We will need tools to find our “needle in a haystack!”
10

The Business / Manufacturing Intelligence Model
11
The model shows 4 phases of using data to take action.
Transform data into information
Analyze the information to obtain knowledge
Use knowledge to take right actions!
Obtain data after actions

How does BI & MI help a company?
12
BI and MI simplify information discovery and analysis, making it possible for decision-makers at all levels of an organization easily access, analyze and act on information.

Five Core Functions of BI / MI Tools
13
Aggregation
• Able to communicate and collect data from multiple / dissimilar sources
Contextual-ization
• Able to provide a model that transforms raw data into information
Analysis• Enable users to analyze information in a variety of ways
Visual-ization
• Able to report information in multiple formats to maximize understanding
Propagation
• Automatically transfers data between plant-floor and enterprise-level• Information is transparent to all users throughout a business

Data Collection in manufacturing uses a Historian
14
HistorianCollects data from
PLC and SCADA tags and sends to database.
Temp and
Pressure Sensors
System 1 System 2
SAP ServerConnections to the DB
to help construct business metrics.
Database ServerBack-end Data Server
Oracle, SQL Server, etc.
PLCProcesses I/O in Real Time
SCADA/Historian ClientManufacturing personal
use this to trend data, view and acknowledge alarms and obtain data from dashboards
Business PCUses a Web browser to view trends,
reports and dashboard data

Historian Data Collection
15
HistorianCollects data from
PLC and SCADA tags and sends to database.
Temp and
Pressure Sensors
System 1 System 2
SAP ServerConnections to the DB
to help construct business metrics.
Database ServerBack-end Data Server
Oracle, SQL Server, etc.
PLCProcesses I/O in Real Time
SCADA/Historian ClientManufacturing personal
use this to trend data, view and acknowledge alarms and obtain data from dashboards
Business PCUses a Web browser to view trends,
reports and dashboard data

Aggregation
16
Able to communicate and collect data from multiple / dissimilar sources

Contextualization
17
Cycle ID Unit ID Start Time End Time Status Tank ID
263154 CP101 2015-06-22 09:24 2015-06-22 10:26 Pass 224
263160 CP104 2015-06-22 10:29 2015-06-22 11:05 Pass 201
263164 CP105 2015-06-22 11:31 2015-06-22 11:37 Fail 331
263165 CP104 2015-06-22 11:49 2015-06-22 12:46 Pass 337
263171 CP103 2015-06-22 13:35 2015-06-22 15:03 Fail 431
263174 CP101 2015-06-22 13:57 2015-06-22 14:33 Pass 609
263182 CP104 2015-06-22 16:29 2015-06-22 17:04 Pass 558Fail Fail Fail Total Pass Pass Total
Unit ID 2 3 1
CP101 7.68% 7.52% 15.20% 84.80% 84.80%
CP102 6.57% 8.01% 14.58% 85.42% 85.42%
CP103 8.15% 6.82% 14.98% 85.02% 85.02%
CP104 7.14% 6.58% 13.72% 86.28% 86.28%
CP105 7.96% 5.25% 13.22% 86.78% 86.78%
CP106 8.46% 6.49% 14.95% 85.05% 85.05%
CP107 7.46% 9.16% 16.61% 83.39% 83.39%
CP108 9.24% 7.94% 17.18% 82.82% 82.82%
Grand Total 7.84% 7.23% 15.07% 84.93% 84.93%
Analysis
18
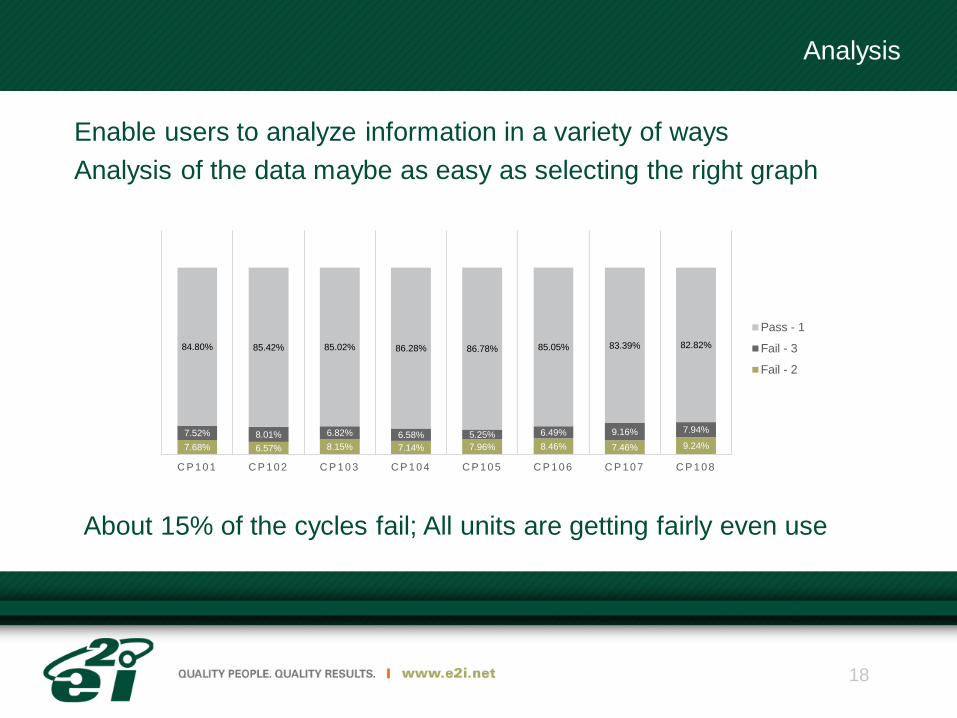
Enable users to analyze information in a variety of waysAnalysis of the data maybe as easy as selecting the right graph
7.68% 6.57% 8.15% 7.14% 7.96% 8.46% 7.46% 9.24%7.52% 8.01% 6.82% 6.58% 5.25% 6.49% 9.16% 7.94%
84.80% 85.42% 85.02% 86.28% 86.78% 85.05% 83.39% 82.82%
C P 1 0 1 C P 1 0 2 C P 1 0 3 C P 1 0 4 C P 1 0 5 C P 1 0 6 C P 1 0 7 C P 1 0 8
Pass - 1
Fail - 3
Fail - 2
About 15% of the cycles fail; All units are getting fairly even use

Visualization
19
Able to report information in multiple formats to maximize understanding.
Visualization
20
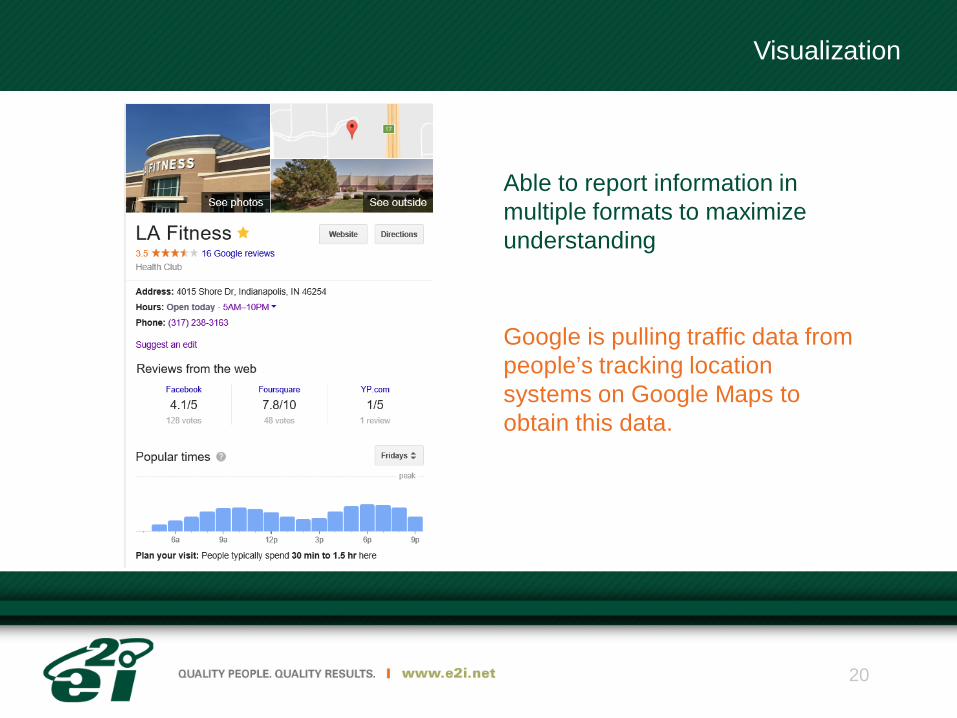
Able to report information in multiple formats to maximize understanding
Google is pulling traffic data from people’s tracking location systems on Google Maps to obtain this data.
Visualization
21
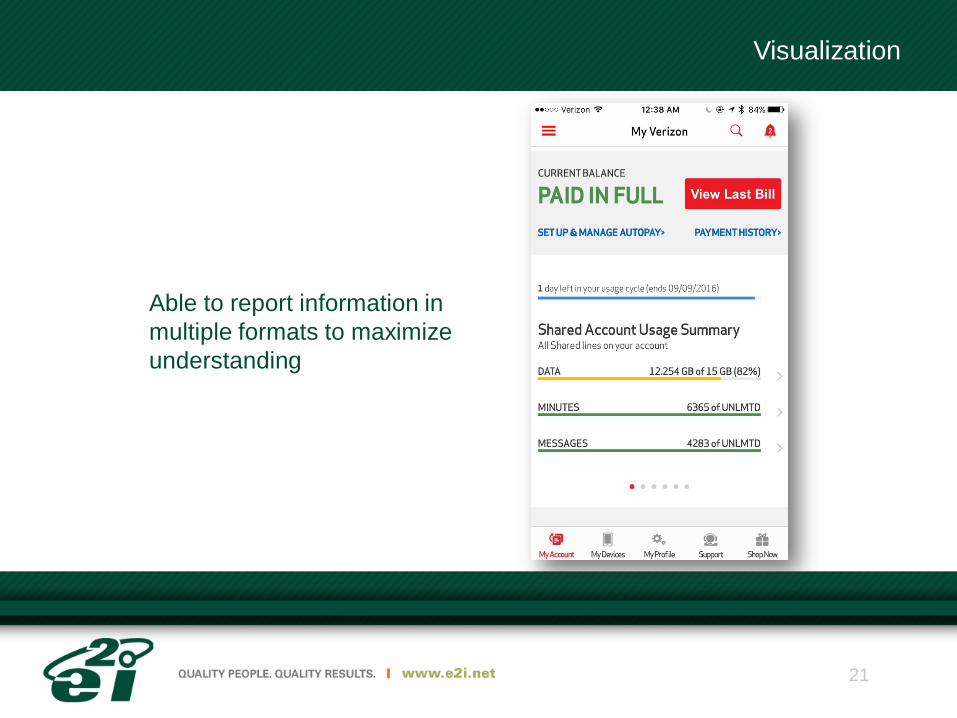
Able to report information in multiple formats to maximize understanding

Propagation
22
HistorianCollects data from
PLC and SCADA tags and sends to database.
Temp and
Pressure Sensors
System 1 System 2
SAP ServerConnections to the DB
to help construct business metrics.
Database ServerBack-end Data Server
Oracle, SQL Server, etc.
PLCProcesses I/O in Real Time
SCADA/Historian ClientManufacturing personal
use this to trend data, view and acknowledge alarms and obtain data from dashboards
Business PCUses a Web browser to view trends,
reports and dashboard data
Automatically transfers data between plant-floor and enterprise-level

BI & MI Benefits
23
Using data management, analysts, operators, engineers and quality control can make better, more informed decisions that improve their businessGive workers quicker responses to business-related queriesTroubleshoot using historical data to identify process issues, e.g. operator error, malfunctionsUncover causes of downtime and lossGain valuable insight into your customer’s behaviorUse stored data to maintain product and business records for product-recall and litigationUse historical data to help analyze and develop process models to develop an optimized processConduct better inventoryFind out what the real manufacturing and business costs are.

Data will continue to grow!
24

Conclusion
25
As data grows, we’ll need more and better tools to tease out the information we need.
To use this data to make good decisions and improve…
We’ll need individuals who can take that information and out of complexity create simplicity.

26
Thank You!