Embed Size (px)
Citation preview

February 2015
Cisco Visual Networking Index (VNI) Update Global Mobile Data Traffic Forecast, 2014–2019
Gonzalo Valverde – Regional Sales Manager Argentina, Uruguay & Paraguay

Cisco Visual Networking Index (VNI) Expanding the Scope of Cisco’s IP Thought Leadership
Cisco® VNI Forecast research is an ongoing initiative to predict global traffic growth. This study focuses on consumer and business mobile data traffic and its key drivers.
Source: Cisco VNI Global Mobile Data Traffic Forecast, 2014–2019
Global Mobile Speed Data
Global Forecast Data
VNI

Global Mobile Data Traffic Drivers
More Mobile
Connections
More Mobile
Users
Faster Mobile
Speeds
More Mobile
Video
Source: Cisco VNI Global Mobile Data Traffic Forecast, 2014–2019
By 2019:
Mobile Momentum Metrics
2014 2019
7.4 Billion 11.5 Billion
2014 2019
1.7 Mbps 4.0 Mbps
2014 2019
4.3 Billion 5.2 Billion
2014 2019
55% of Traffic
72% of Traffic

Overview

By 2019, global mobile data traffic will reach an annual run rate of 292 exabytes per year, up from 30 exabytes in 2014 (nearly 10-fold growth).
292X More than all IP traffic generated in 2000
65 Trillion images (e.g., MMS or Instagram)
6 Trillion video clips (e.g., YouTube)
Source: Cisco VNI Global Mobile Data Traffic Forecast, 2014–2019

Global Mobile Data Traffic Growth / Top-LineGlobal Mobile Data Traffic will Increase 10-Fold from 2014─2019
Source: Cisco VNI Global Mobile Data Traffic Forecast, 2014–2019
57% CAGR 2014–2019
0
5
10
15
20
25
30
2014 2015 2016 2017 2018 2019
10.8 EB
2.5 EB
10.7 EB
6.8 EB
4.2 EB
16.1 EB
24.3 EB
Exabytes
per Month

0
5
10
15
20
25
30
2014 2015 2016 2017 2018 2019
Latin America (LATAM)
Middle East and Africa (MEA)
Central and Eastern Europe (CEE)
Western Europe (WE)
North America (NA)
Asia Pacific (APAC)
Global Mobile Data Traffic Growth / RegionsMEA has the Highest Growth Rate (72%) from 2014–2019APAC will Generate 39% of all Mobile Data Traffic by 2019
Source: Cisco VNI Global Mobile Data Traffic Forecast, 2014–2019
57% CAGR 2014–2019
15.7%
39.1%
9.9%
12.5%
7.3%
14.4%Exabytes
per Month
8.4%
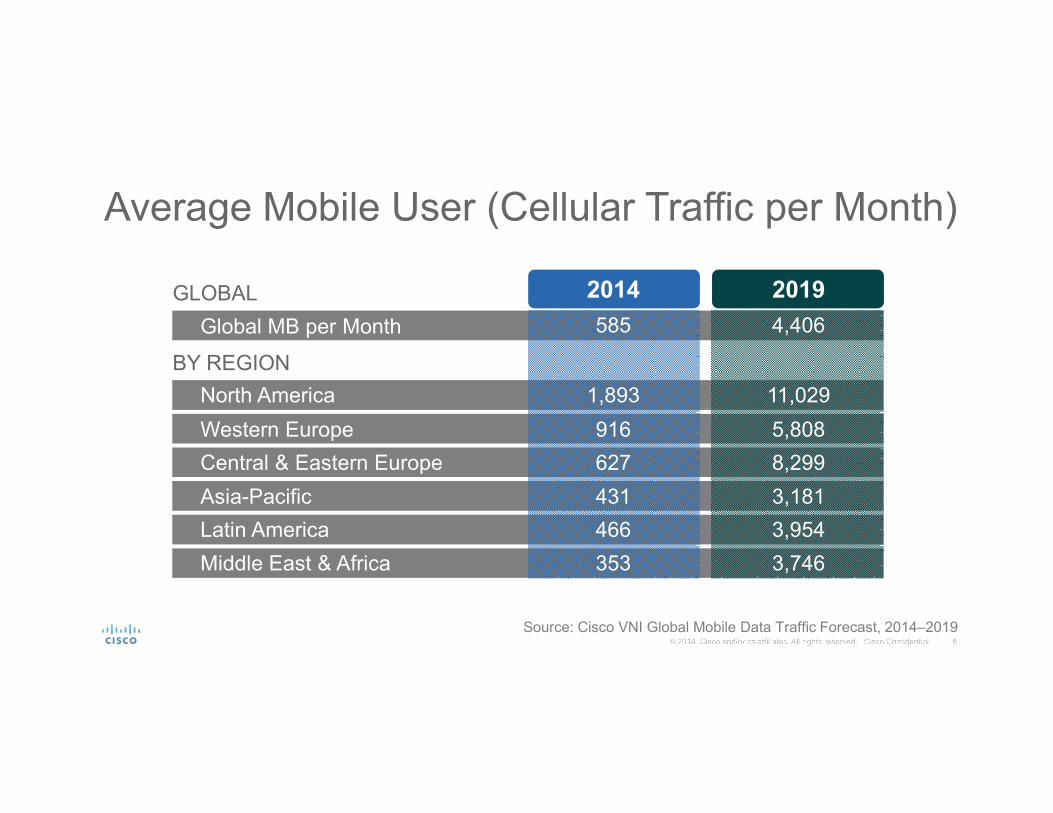
Average Mobile User (Cellular Traffic per Month)
2014 2019GLOBAL
Global MB per Month
BY REGION
North America
Western Europe
Latin America
Central & Eastern Europe
Middle East & Africa
585
1,893
916
431
466
627
353
4,406
11,029
5,808
3,181
3,954
8,299
3,746
Asia-Pacific
Source: Cisco VNI Global Mobile Data Traffic Forecast, 2014–2019

Average Mobile User (Cellular Traffic per Month)Sample Global Usage
Source: Cisco VNI Global Mobile Data Traffic Forecast, 2014–2019
3 Hours of Video
10 Video Calls
3 Hours of Audio
4 App Downloads
30 Hours of Video
10 Video Calls
10 Hours of Audio
20 App Downloads
2014 2019585 MB Traffic/month
4.4 GB Traffic/month

Drivers

Global Mobile UsersFrom 4.3 Billion in 2014 to 5.2 Billion by 2019 at 4.3% CAGRGlobal Mobile Users Growing 4X Faster than Global Population
North America Western Europe Central/Eastern Europe
Latin America Middle East & Africa Asia Pacific
Source: Cisco VNI Global Mobile Data Traffic Forecast, 2014–2019
2014: 294 M
2019: 320 M
CAGR 1.7%
2014: 367 M
2019: 383 M
CAGR 0.8%
2014: 382 M
2019: 407 M
CAGR 1.3%
2014: 427 M
2019: 497 M
CAGR 3.1%
2014: 561 M
2019: 799 M
CAGR 7.3%
2014: 2,228 M
2019: 2,844 M
CAGR 5.0%

Global Mobile Device and ConnectionsFrom 7.4 Billion in 2014 to 11.5 Billion by 2019 at 9% CAGR
North America Western Europe Central/Eastern Europe
Latin America Middle East & Africa Asia Pacific
Source: Cisco VNI Global Mobile Data Traffic Forecast, 2014–2019
2014: 432 M
2019: 1,155 M
CAGR 21.7%
2014: 612 M
2019: 1,179 M
CAGR 14.0%
2014: 690 M
2019: 1,025 M
CAGR 8.2%
2014: 770 M
2019: 997 M
CAGR 5.3%
2014: 1,200 M
2019: 1,676 M
CAGR 6.9%
2014: 3,733 M
2019: 5,439 M
CAGR 7.8%

Global Mobile Speed GrowthAverage Mobile Speed Will Double from 1.7 Mbps (2014) to 3.9 Mbps (2019)
North America Western Europe Central/Eastern Europe
Latin America Middle East & Africa Asia Pacific
Source: Cisco VNI Global Mobile Data Traffic Forecast, 2014–2019
2.27-fold Growth
2.8 to 6.4 Mbps
2.3-fold Growth
2.0 to 4.7 Mbps
2.27-fold Growth
1.6 to 3.7 Mbps
2.1-fold Growth
1.4 to 2.9 Mbps
3.6-fold Growth
0.6 to 2.1 Mbps
1.7-fold Growth
2.0 to 3.1 Mbps

Global Mobile Video TrafficBy 2019, Video Will Drive 72% of Mobile Traffic, Up from 55% in 2014
North America Western Europe Central/Eastern Europe
Latin America Middle East & Africa Asia Pacific
Source: Cisco VNI Global Mobile Data Traffic Forecast, 2014–2019
75% of traffic by 2019
54% CAGR
74% of traffic by 2019
56% CAGR
70% of traffic by 2019
83% CAGR
72% of traffic by 2019
69% CAGR
68% of traffic by 2019
84% CAGR
71% of traffic by 2019
67% CAGR

Global Mobile Data TrafficMobile Data Traffic will Increase Nearly 10-Fold from 2.5 EB/month in 2014 to 24.3 EB/month by 2019
North America Western Europe Central/Eastern Europe
Latin America Middle East & Africa Asia Pacific
6.8-fold Growth
563 to 3,823 PB/mo
7.1-fold Growth
341 to 2,414 PB/mo
14.4-fold Growth
242 to 3,496 PB/mo
10.1-fold Growth
201 to 2,035 PB/mo
15.3-fold Growth
199 to 3,043 PB/mo
9.7-fold Growth
977 to 9,503 PB/mo
Source: Cisco VNI Global Mobile Data Traffic Forecast, 2014–2019

Top Trends

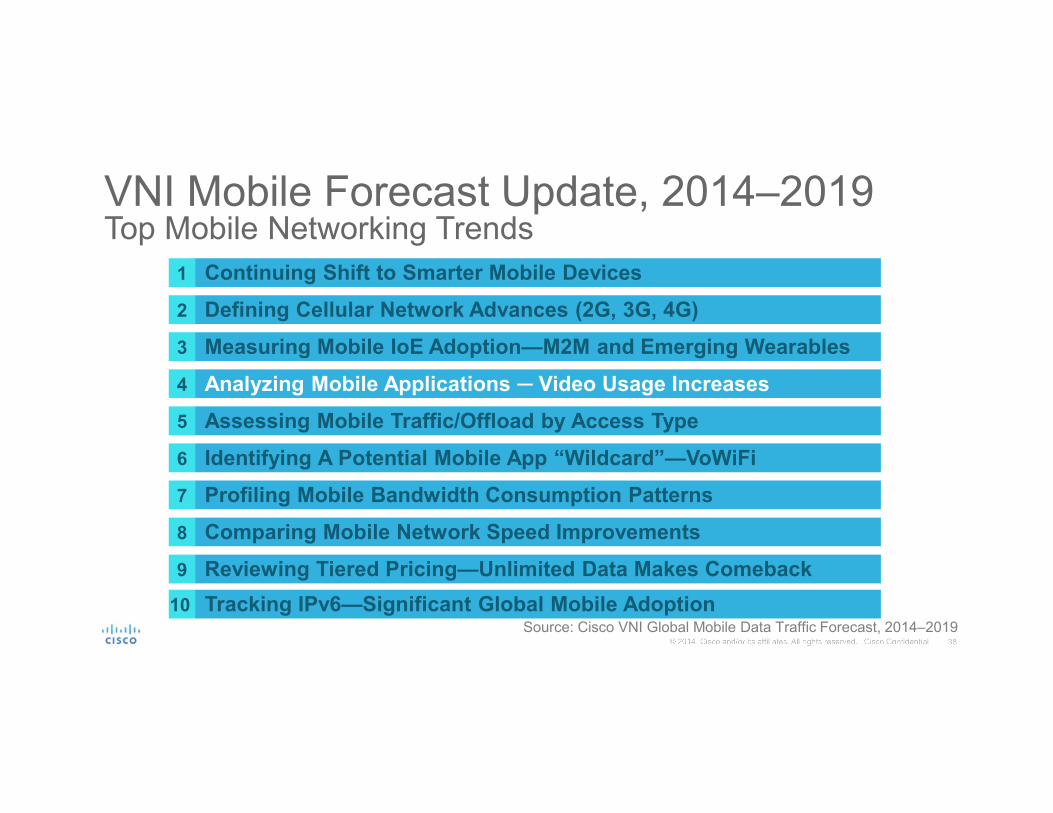
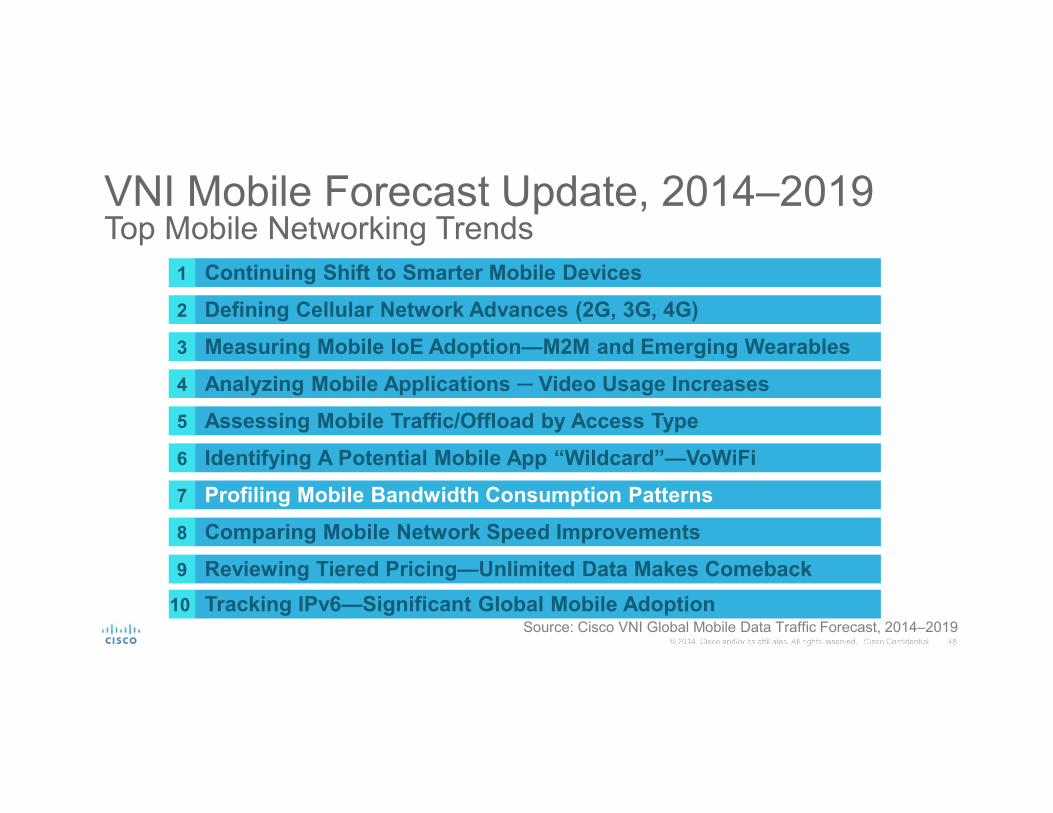
VNI Mobile Forecast Update, 2014–2019 Top Mobile Networking Trends
1 Continuing Shift to Smarter Mobile Devices
2 Defining Cellular Network Advances (2G, 3G, 4G)
3 Measuring Mobile IoE Adoption—M2M and Emerging Wearables
4 Analyzing Mobile Applications ─ Video Usage Increases
5 Assessing Mobile Traffic/Offload by Access Type
6 Identifying A Potential Mobile App “Wildcard”—VoWiFi
7 Profiling Mobile Bandwidth Consumption Patterns
8 Comparing Mobile Network Speed Improvements
9 Reviewing Tiered Pricing—Unlimited Data Makes Comeback
Source: Cisco VNI Global Mobile Data Traffic Forecast, 2014–2019
10 Tracking IPv6—Significant Global Mobile Adoption

Global Mobile Device Growth by TypeBy 2019, Smartphones Will Attain Largest Share to Reach Nearly 40%
0
2
4
6
8
10
12
2014 2015 2016 2017 2018 2019
Other Portable Devices (0.2%,0.2%) Tablets (1%,3%)
Laptops (3%,2%) M2M (7%,28%)
Smartphones (29%,40%) Non-Smartphones (61%,27%)
9% CAGR 2014–2019
Source: Cisco VNI Global Mobile Data Traffic Forecast, 2014–2019
Billions of
Devices
* Figures (n) refer to 2014, 2019 device share

Global Growth of Smart Mobile Devices & ConnectionsBy 2019, Smart Devices will Have 54% Share of Total Devices & Connections
9% CAGR 2014–2019
Source: Cisco VNI Global Mobile Data Traffic Forecast, 2014–2019
Billions of
Devices
0
2
4
6
8
10
12
14
2014 2015 2016 2017 2018 2019
Non-smart Devices and Connections
Smart Devices and Connections
54%49%
43%37%31%26%
46%
51%57%
63%69%
74%
* Smart devices are those having advanced multi-media/computing capabilities with a minimum of 3G connectivity.

Global Growth of Smart Mobile Devices & ConnectionsBy 2019, Smart Devices will Have 59% Share of Total Connections
7% CAGR 2014–2019
Source: Cisco VNI Global Mobile Data Traffic Forecast, 2014–2019
Billions of
Devices
0
2
4
6
8
10
12
2014 2015 2016 2017 2018 2019
Non-smart Devices and Connections
Smart Devices and Connections
59%52%
44%37%31%26%
41%
48%56%
63%69%
74%
* Smart devices are those having advanced multi-media/computing capabilities with a minimum of 3G connectivity.
*Excludes LPWA

Smart Devices & Connections SharePercent of Total Mobile Devices & Connections
Source: Cisco VNI Global Mobile Data Traffic Forecast, 2014–2019
2014 2019
Global
BY REGION
North America
Western Europe
Asia-Pacific
Central & Eastern Europe
Middle East & Africa
26%
72%
48%
20%
24%
18%
11%
59%
89%
78%
61%
56%
62%
41%
Latin America
*Excludes LPWA

Globally, in 2014, a smart device generated 22 timesmore traffic than a non-smart device.
* Smart devices are those having advanced multi-media/computing capabilities with a minimum of 3G connectivity.

Global Impact of Smart Devices & Connections on Mobile TrafficBy 2019, Smart Devices Will Have 97% Share of Traffic
0
5
10
15
20
25
30
2014 2015 2016 2017 2018 2019
Non-smart Traffic
Smart Traffic
97%
95%
94%
92%90%
88%12%
3%
5%
6%
8%
10%
57% CAGR 2014–2019
Source: Cisco VNI Global Mobile Data Traffic Forecast, 2014–2019
Exabytes
per Month

Smart Devices & Connections Traffic SharePercent of Total Mobile Devices & Connections Traffic
Source: Cisco VNI Global Mobile Data Traffic Forecast, 2014–2019
2014 2019
Global
BY REGION
North America
Western Europe
Asia-Pacific
Central & Eastern Europe
Middle East & Africa
88%
99%
95%
85%
86%
77%
78%
97%
100%
99%
98%
96%
96%
93%
Latin America

VNI Mobile Forecast Update, 2014–2019 Top Mobile Networking Trends
1 Continuing Shift to Smarter Mobile Devices
2 Defining Cellular Network Advances (2G, 3G, 4G)
3 Measuring Mobile IoE Adoption—M2M and Emerging Wearables
4 Analyzing Mobile Applications ─ Video Usage Increases
5 Assessing Mobile Traffic/Offload by Access Type
6 Identifying A Potential Mobile App “Wildcard”—VoWiFi
7 Profiling Mobile Bandwidth Consumption Patterns
8 Comparing Mobile Network Speed Improvements
9 Reviewing Tiered Pricing—Unlimited Data Makes Comeback
Source: Cisco VNI Global Mobile Data Traffic Forecast, 2014–2019
10 Tracking IPv6—Significant Global Mobile Adoption

0.0
1.0
2.0
3.0
4.0
5.0
6.0
2014 2015 2016 2017 2018 2019
2G 3G 4G LPWA
Global Connections by Network Type2G, 3G, and 4G Technology Connection Share
44%
62%
32%
6%
26%
22%
45%
38%
15%
Billions of
Devices or
Connections
Source: Cisco VNI Global Mobile Data Traffic Forecast, 2014–2019
2%
8%
*Includes M2M

Connections by Network TypeRegional Share by 2019
Source: Cisco VNI Global Mobile Data Traffic Forecast, 2014–2019
2G 3G 4G LPWA
Global 21% 44% 26% 8%
BY REGION
Asia Pacific 23% 46% 26% 5%
Central and Eastern Europe 20% 51% 22% 7%
Latin America 23% 55% 21% 0.3%
Middle East and Africa 32% 54% 14% 0.2%
North America 5% 20% 42% 32%
Western Europe 15% 31% 38% 15%
*Includes M2M,
Includes LPWA

0.0
0.5
1.0
1.5
2.0
2.5
3.0
3.5
4.0
4.5
5.0
2014 2015 2016 2017 2018 2019
2G 3G 4G
Global Connections by Network Type2G, 3G, and 4G Technology Connection Share
48%
62%
31%
7%
31%
21%
45%
38%
17%
Billions of
Devices or
Connections
Source: Cisco VNI Global Mobile Data Traffic Forecast, 2014–2019
*Excludes M2M

0.0
0.2
0.4
0.6
0.8
1.0
1.2
2014 2015 2016 2017 2018 2019
2G 3G 4G LPWA
Global Connections by Network Type2G, 3G, and 4G Technology Connection Share – M2M
35%
67%
32%
1%
29%
23%42%
38%
7%
Billions of
Devices or
Connections
Source: Cisco VNI Global Mobile Data Traffic Forecast, 2014–2019
13%
13%

VNI Mobile Forecast Update, 2014–2019 Top Mobile Networking Trends
1 Continuing Shift to Smarter Mobile Devices
2 Defining Cellular Network Advances (2G, 3G, 4G)
3 Measuring Mobile IoE Adoption—M2M and Emerging Wearables
4 Analyzing Mobile Applications ─ Video Usage Increases
5 Assessing Mobile Traffic/Offload by Access Type
6 Identifying A Potential Mobile App “Wildcard”—VoWiFi
7 Profiling Mobile Bandwidth Consumption Patterns
8 Comparing Mobile Network Speed Improvements
9 Reviewing Tiered Pricing—Unlimited Data Makes Comeback
Source: Cisco VNI Global Mobile Data Traffic Forecast, 2014–2019
10 Tracking IPv6—Significant Global Mobile Adoption

0.0
0.5
1.0
1.5
2.0
2.5
3.0
3.5
2014 2015 2016 2017 2018 2019
2G 3G 4G LPWA
67%
1%
Global M2M Connection GrowthGlobal M2M Connections will Grow 7-Fold from 2014-2019;By 2019, Nearly Half of Global M2M Connections Will Be 3G or Better
32%
35%
29%
23%
3.2 B
2.3 B
1.6 B
1.1 B0.7 B
0.5 B
* In 2014, 4G accounts for 1% and LPWA accounts for 0.2% of global mobile M2M connections.
45% CAGR 2014–2019
Source: Cisco VNI Global Mobile Data Traffic Forecast, 2014–2019
Billions
of M2M
Connections
13%

By 2019, M2M modules will be 28% of total global mobile devices and connections and will account for 5% (1.2 EBs/month) of mobile data traffic.
Source: Cisco VNI Global Mobile Data Traffic Forecast, 2014–2019

0.0%
1.0%
2.0%
3.0%
4.0%
5.0%
6.0%
7.0%
8.0%
0
100
200
300
400
500
600
700
2014 2015 2016 2017 2018 2019
109 M
441 M
1.9%
Global Connected Wearable DevicesGlobal Connected Wearables will Grow 5-Fold from 2014-2019;By 2019, 7 Percent will Have Embedded Cellular Connectivity
578 M
236 M170 M
325 M
40% CAGR 2014–2019
Source: Cisco VNI Global Mobile Data Traffic Forecast, 2014–2019
Millions of
Connected
Wearables
% with
Embedded
Cellular
Connectivity
7.3%

0
100
200
300
400
500
600
700
2014 2015 2016 2017 2018 2019
Western Europe (18%,18%)
North America (30%,33%)
Middle East & Africa (4%,4%)
Latin America (6%,5%)
Central & Eastern Europe (8%,9%)
Asia Pacific (34%,32%)
441 M
109 M
Regional Connected Wearable DevicesNorth America Will Have the Largest Share by 2019
578 M
326 M
236 M
171 M
40% CAGR 2014–2019
Source: Cisco VNI Global Mobile Data Traffic Forecast, 2014–2019
Millions of
Connected
Wearables
* Figures (n) refer to 2014, 2019 regional wearable devices share

Wearable Device UsageWearable Camera Use Case Scenario (300 MB/Hour)
Only 2 hours of wearable
camera usage* can
generate more than the
average monthly traffic per
typical user in 2014.
*Assumes live streaming over a cellular network

15 33
61
106
175
277
2.0%
9.1%
0.0%
1.0%
2.0%
3.0%
4.0%
5.0%
6.0%
7.0%
8.0%
9.0%
10.0%
0
50
100
150
200
250
300
2014 2015 2016 2017 2018 2019
Global Connected Wearable Devices TrafficGlobal Connected Wearables Traffic will Grow 18-Fold from 2014-2019
78% CAGR 2014–2019
Source: Cisco VNI Global Mobile Data Traffic Forecast, 2014–2019
Monthly
Traffic (PB)
% Embedded
Cellular
Traffic

0
50
100
150
200
250
300
2014 2015 2016 2017 2018 2019
Western Europe (10%,12%)
North America (37%,39%)
Middle East & Africa (2%,3%)
Latin America (2%,3%)
Central & Eastern Europe (5%,9%)
Asia Pacific (44%,34%)
Regional Connected Wearable Devices TrafficNorth America will Maintain the Largest Share
78% CAGR 2014–2019
Source: Cisco VNI Global Mobile Data Traffic Forecast, 2014–2019
Monthly
Traffic (PB)
* Figures (n) refer to 2014, 2019 regional wearable devices traffic share
VNI Mobile Forecast Update, 2014–2019 Top Mobile Networking Trends
1 Continuing Shift to Smarter Mobile Devices
2 Defining Cellular Network Advances (2G, 3G, 4G)
3 Measuring Mobile IoE Adoption—M2M and Emerging Wearables
4 Analyzing Mobile Applications ─ Video Usage Increases
5 Assessing Mobile Traffic/Offload by Access Type
6 Identifying A Potential Mobile App “Wildcard”—VoWiFi
7 Profiling Mobile Bandwidth Consumption Patterns
8 Comparing Mobile Network Speed Improvements
9 Reviewing Tiered Pricing—Unlimited Data Makes Comeback
Source: Cisco VNI Global Mobile Data Traffic Forecast, 2014–2019
10 Tracking IPv6—Significant Global Mobile Adoption

0
5
10
15
20
25
30
2014 2015 2016 2017 2018 2019
Mobile File Sharing (1%,2%)
Mobile Audio (8%,7%)
Mobile Web/Data/VoIP (36%,19%)
Mobile Video (55%,72%)
Global Mobile Data Traffic Growth / AppsVideo to Exceed 72 Percent of Mobile Data Traffic by 2019
57% CAGR 2014–2019
Source: Cisco VNI Global Mobile Data Traffic Forecast, 2014–2019
Exabytes
per Month
* Figures (n) refer to 2014 and 2019 mobile data traffic shares

81% 83% 85% 86% 88% 90%
19% 17% 15% 14% 12% 10%
0%
10%
20%
30%
40%
50%
60%
70%
80%
90%
100%
2014 2015 2016 2017 2018 2019
Mobile Non-Cloud Traffic
Mobile Cloud Traffic
Global Mobile Cloud TrafficCloud Accounted for 81% of Mobile Data Traffic in 2014Cloud will Account for 90% of Mobile Data Traffic by 2019
• IP Voice
• File Sharing
• File/App Downloading
• Video Streaming
• Audio Streaming
• Online Gaming
• Social Networking
• Web Browsing
• Online Storage
Source: Cisco VNI Global Mobile Data Traffic Forecast, 2014–2019

Top Traffic Generating Smartphone AppsTop Traffic-Generating Mobile Apps
(Smartphone)
Facebook Social Media
YouTube Video Streaming
Browser Web Browsing
Netflix Video Streaming
Maps Utilities
Spotify Audio Streaming
Instagram Image Sharing
WhatsApp Communications
tinyCam Monitor Video Monitoring
SoundCloud Audio Streaming
Hulu Plus Video Streaming
Email Communications
Pandora Audio Streaming
Twitter Communications
Top Traffic-Generating WiFi Apps
(Smartphone)
Facebook Social Media
YouTube Video Streaming
Browser Web Browsing
Netflix Video Streaming
Instagram Image Sharing
WhatsApp Communications
Spotify Audio Streaming
Tumblr Social Media
Skype Communications
Dropbox Cloud File Storage
Email Communications
Skydrive Cloud File Storage
Viber Communications
Hulu Plus Video Streaming
Source: Cisco VNI Global Mobile Data Traffic Forecast, 2014–2019

Top Traffic Generating Tablet AppsTop Traffic-Generating Mobile Apps
(Tablet)
YouTube Video Streaming
Browser Web Browsing
Facebook Social Media
4shared Social Media
TubeMate Video Downloading
Crunchyroll Video Streaming
TV 2 Sporten Video Streaming
Instagram Image Sharing
O2 TV Video Streaming
EA Games Online Gaming
Viber Communications
Maps Utilities
Ztory Publication
VPN Business Application
Top Traffic-Generating WiFi Apps
(Tablet)
YouTube Video Streaming
Netflix Video Streaming
Browser Web Browsing
Facebook Social Media
tinyCam Monitor Video Monitoring
Xfinity TV Player Video Streaming
Showtime Anytime Video Streaming
Twitch TV Video Streaming
VLC Video Player Video Streaming
Spotify Audio Streaming
TWCable TV Video Streaming
CANAL+ Video Streaming
TuneIN Radio Audio Streaming
NY Times Publication
Source: Cisco VNI Global Mobile Data Traffic Forecast, 2014–2019

VNI Mobile Forecast Update, 2014–2019 Top Mobile Networking Trends
1 Continuing Shift to Smarter Mobile Devices
2 Defining Cellular Network Advances (2G, 3G, 4G)
3 Measuring Mobile IoE Adoption—M2M and Emerging Wearables
4 Analyzing Mobile Applications ─ Video Usage Increases
5 Assessing Mobile Traffic/Offload by Access Type
6 Identifying A Potential Mobile App “Wildcard”—VoWiFi
7 Profiling Mobile Bandwidth Consumption Patterns
8 Comparing Mobile Network Speed Improvements
9 Reviewing Tiered Pricing—Unlimited Data Makes Comeback
Source: Cisco VNI Global Mobile Data Traffic Forecast, 2014–2019
10 Tracking IPv6—Significant Global Mobile Adoption

0
5
10
15
20
25
30
35
40
45
50
55
60
2014 2015 2016 2017 2018 2019
Cellular Traffic from Mobile Devices
Offload Traffic from Mobile Devices
Global Mobile Data Traffic Offload*54% of Mobile Traffic to be Offloaded by 201946% of Mobile Traffic Offloaded in 2014
46%
54%
Source: Cisco VNI Global Mobile Data Traffic Forecast, 2014–2019
Exabytes
per Month
*Offload includes traffic from dual-mode devices (i.e., supports cell & Wi-Fi, excl. laptops) over Wi-Fi/small cell networks

0%
10%
20%
30%
40%
50%
60%
70%
80%
90%
100%
2G 3G 4G
Mobile Traffic
Offload Traffic
Global Mobile Data Traffic and Offload Traffic, 20194G Devices Offload More Traffic Than 3G and 2G
57%46%
44%
56%54% 43%
Mobile and
Offload
Traffic from
Mobile-
Connected
Devices
*Offload includes traffic from dual-mode devices (i.e., supports cell & Wi-Fi, excl. laptops) over Wi-Fi/small cell networks

Globally, the amount of traffic offloaded from tablets will be 70% by 2019.
Globally, the amount of traffic offloaded from smartphones will be 54% by 2019.
Source: Cisco VNI Global Mobile Data Traffic Forecast, 2014–2019
*Offload includes traffic from dual-mode devices (i.e., supports cell & Wi-Fi, excl. laptops) over Wi-Fi/small cell networks

0
20,000
40,000
60,000
80,000
100,000
120,000
140,000
2013 2014 2015 2016 2017 2018
Mobile Data (61% CAGR)
Fixed/Wired (11% CAGR)
Fixed/Wi-Fi (26% CAGR)
Global IP Traffic by Local Access TechnologyStarting in 2017, Fixed/Wi-Fi Traffic Surpasses Fixed/Wired Traffic
37%
51%
12%
Source: Cisco VNI Global Mobile Data Traffic Forecast, 2014–2019
21% CAGR 2013–2018
Exabytes
per Month
VNI Mobile Forecast Update, 2014–2019 Top Mobile Networking Trends
1 Continuing Shift to Smarter Mobile Devices
2 Defining Cellular Network Advances (2G, 3G, 4G)
3 Measuring Mobile IoE Adoption—M2M and Emerging Wearables
4 Analyzing Mobile Applications ─ Video Usage Increases
5 Assessing Mobile Traffic/Offload by Access Type
6 Identifying A Potential Mobile App “Wildcard”—VoWiFi
7 Profiling Mobile Bandwidth Consumption Patterns
8 Comparing Mobile Network Speed Improvements
9 Reviewing Tiered Pricing—Unlimited Data Makes Comeback
Source: Cisco VNI Global Mobile Data Traffic Forecast, 2014–2019
10 Tracking IPv6—Significant Global Mobile Adoption

0
2
4
6
8
10
12
14
16
18
20
22
24
26
2014 2015 2016 2017 2018 2019
2-2.5G
3-3.5G
4G
Global Mobile Data Traffic Growth: 4GGlobally, 4G Will Support 68% of Mobile Traffic by 2019
40%
68%
30%
10%50%
2%
Source: Cisco VNI Global Mobile Data Traffic Forecast, 2014–2019
Exabytes
per Month
Globally, in 2014, a 4G connection generated 2.2 GB/mo, 10X higherthan the 217 MB/mo for non-4G connections.
Source: Cisco VNI Global Mobile Data Traffic Forecast, 2014–2019

0
20
40
60
80
100
120
140
160
2014 2015 2016 2017 2018 2019
Average Hour Traffic
Busy Hour Traffic
Busy Hour Mobile Data TrafficBusy Hour Is 64% Higher than Average Hour in 2014, 84% in 2019
Source: Cisco VNI Global Mobile Data Traffic Forecast, 2014–2019
Tbps

VNI Mobile Forecast Update, 2014–2019 Top Mobile Networking Trends
1 Continuing Shift to Smarter Mobile Devices
2 Defining Cellular Network Advances (2G, 3G, 4G)
3 Measuring Mobile IoE Adoption—M2M and Emerging Wearables
4 Analyzing Mobile Applications ─ Video Usage Increases
5 Assessing Mobile Traffic/Offload by Access Type
6 Identifying A Potential Mobile App “Wildcard”—VoWiFi
7 Profiling Mobile Bandwidth Consumption Patterns
8 Comparing Mobile Network Speed Improvements
9 Reviewing Tiered Pricing—Unlimited Data Makes Comeback
Source: Cisco VNI Global Mobile Data Traffic Forecast, 2014–2019
10 Tracking IPv6—Significant Global Mobile Adoption

Mobile Network Speeds Increase 2.4X by 2019Average Cell Connection Speed (1.7 Mbps in 2014) Will Grow at a 19% CAGR—Reaching Nearly 4.0 Mbps by 2019
Source: Cisco VNI Global Mobile Data Traffic Forecast, 2014–2019
2014 2019
Global Mbps
BY REGION
North America
Western Europe
Asia-Pacific
Central & Eastern Europe
Middle East & Africa
1.7
2.8
2.0
1.4
2.0
1.6
0.6
3.9
6.4
4.7
2.9
3.5
3.7
2.1
Latin America
GLOBAL

Global Average Wi-Fi SpeedsWi-Fi Exceeds Average Mobile (Cell) Speeds During 2014-2019
Source: Cisco VNI Global Mobile Data Traffic Forecast, 2014–2019
2014 2019
Global Mbps
BY REGION
North America
Western Europe
Asia-Pacific
Central & Eastern Europe
Middle East & Africa
8.1
12.3
11.0
5.7
11.3
10.7
4.6
10.2
15.1
15.4
9.3
16.1
15.7
8.8
Latin America
GLOBAL

0
2
4
6
8
10
12
14
2014 2015 2016 2017 2018 2019
Tablets
Smartphones
All Mobile Devices
Global Mobile Speeds by Device TypeTablet Speeds are 3.3x Higher than Average by 2019Smartphone Speeds are 2.6x Higher than Average by 2019
13 Mbps
10 Mbps
4 Mbps
Mbps
Source: Cisco VNI Global Mobile Data Traffic Forecast, 2014–2019

0
2
4
6
8
10
12
14
16
2014 2015 2016 2017 2018 2019
4G
3G
All Network Types
2G
Global Mobile Speeds by Network Type4G Speeds will be 4X Higher than Average by 20183-3.5G Speeds will be 1.2X Higher than Average by 2019
14.2 Mbps
5 Mbps
110 Kbps
4 Mbps
Mbps
Source: Cisco VNI Global Mobile Data Traffic Forecast, 2014–2019

VNI Mobile Forecast Update, 2014–2019 Top Mobile Networking Trends
1 Continuing Shift to Smarter Mobile Devices
2 Defining Cellular Network Advances (2G, 3G, 4G)
3 Measuring Mobile IoE Adoption—M2M and Emerging Wearables
4 Analyzing Mobile Applications ─ Video Usage Increases
5 Assessing Mobile Traffic/Offload by Access Type
6 Identifying A Potential Mobile App “Wildcard”—VoWiFi
7 Profiling Mobile Bandwidth Consumption Patterns
8 Comparing Mobile Network Speed Improvements
9 Reviewing Tiered Pricing—Unlimited Data Makes Comeback
Source: Cisco VNI Global Mobile Data Traffic Forecast, 2014–2019
10 Tracking IPv6—Significant Global Mobile Adoption

894MB/mo
1.3 GB/mo
1.3 GB/mo
1.6 GB/mo
0
200
400
600
800
1,000
1,200
1,400
1,600
1,800
Android iOS
Jun-14
Oct-13
iOS Usage Surpasses Android
46% of plans54% of plans 42% of plans58% of plans
Source: Cisco VNI Global Mobile Data Traffic Forecast, 2014–2019
Megabytes
per Month

Argentina

Argentina Mobile Data Traffic Drivers
More Mobile
Connections
More Mobile
Users
Faster Mobile
Speeds
More Mobile
Video
Source: Cisco VNI Global Mobile Data Traffic Forecast, 2014–2019
By 2019:
Mobile Momentum Metrics
2014 2019
67 M 86 M
2014 2019
0.3 Mbps 1.2 Mbps
2014 2019
31.8 M 36.5 M
2014 2019
54% of Traffic
70% of Traffic

Argentina Connections by Network Type2G, 3G, and 4G Technology Connection Share
Source: Cisco VNI Global Mobile Data Traffic Forecast, 2014–2019
61%
19%
39%
71%
0.04%
10%
0%
10%
20%
30%
40%
50%
60%
70%
80%
-
10
20
30
40
50
60
70
2014 2015 2016 2017 2018 2019
Millions of devices or connections
2G 3G 4G

2019 Forecast Mobile Data Traffic - Argentina
6.2B
Source: Cisco VNI Global Mobile Data Traffic Forecast, 2014–2019
• Mobile data traffic will grow 7-fold from 2014 to 2019, a compound annual growth
rate of 49%.
• Mobile data traffic will reach an annual run rate of 1.8 Exabytes by 2019, up from 0.2
Exabytes in 2014.
• Argentinian mobile data traffic will grow 3 times faster than Argentinian fixed IP traffic
from 2014 to 2019.
• 70% of mobile connections will be 'smart' connections by 2019, up from 25% in 2014.

2019 Forecast Mobile Users - Argentina
6.2B
Source: Cisco VNI Global Mobile Data Traffic Forecast, 2014–2019
• There were 31.8 Million (76% of Argentina's population) mobile users in 2014, up 6%
from 29.9 Million (72% of Argentina's population) in 2013.
• There will be 36.5 Million (84% of Argentina's population) mobile users by 2019, up
from 31.8 Million in 2014, a CAGR of 2.8%.

2014 Mobile Data Traffic - Argentina
6.2B
Source: Cisco VNI Global Mobile Data Traffic Forecast, 2014–2019
• In 2014, Argentina's mobile data traffic grew 1.8-fold, or 78%.
• Argentinian mobile data traffic grew 3.0 times faster than Argentinian fixed IP traffic in 2014.
• The average mobile-connected end-user device generated 308 megabytes of mobile data
traffic per month in 2014, up 72% from 179 megabytes per month in 2013.
• The average smartphone generated 402 megabytes of mobile data traffic per month in
2014, up from 246 megabytes per month in 2013.
• The average tablet generated 2,812 megabytes of mobile data traffic per month in 2014, up
from 1,395 megabytes per month in 2013.

Argentina - Consumer Mobile Traffic
6.2B
Source: Cisco VNI Global Mobile Data Traffic Forecast, 2014–2019
• In 2014, Argentina's consumer mobile data traffic grew 1.8-fold, or 82%.
• Consumer mobile traffic will grow 7.8-fold from 2014 to 2019, a compound annual growth
rate of 51%.
• Consumer mobile traffic will reach 127.9 Petabytes per month by 2019, up from 16.5
Petabytes per month in 2014.
• Consumer will account for 86% of Argentina's mobile data traffic by 2019, compared to
83% at the end of 2014.

Argentina - Business Mobile Traffic
6.2B
Source: Cisco VNI Global Mobile Data Traffic Forecast, 2014–2019
• In 2014, Argentina's business mobile data traffic grew 1.6-fold, or 61%.
• Business mobile traffic will grow 5.9-fold from 2014 to 2019, a compound annual growth
rate of 43%.
• Business will account for 14% of Argentina's mobile data traffic by 2019, compared to
17% at the end of 2014.

Argentina - Mobile Applications
6.2B
Source: Cisco VNI Global Mobile Data Traffic Forecast, 2014–2019
• Mobile video traffic will grow 9.6-fold from 2014 to 2019, a compound annual growth rate
of 57%.
• Mobile video traffic will reach 103.2 Petabytes per month by 2019, up from 10.7
Petabytes per month in 2014.
• Video will be 70% of Argentina's mobile data traffic by 2019, compared to 54% at
the end of 2014.
• Streaming Audio will be 7% of Argentina's mobile data traffic by 2019, compared to 8% at
the end of 2014.
• Web and other data will be 21% of Argentina's mobile data traffic by 2019, compared to
37% at the end of 2014.

Mobile Devices and Connections - Argentina
6.2B
Source: Cisco VNI Global Mobile Data Traffic Forecast, 2014–2019
• 3.5 million net new devices and connections were added to the mobile network in
2014.
• 5.2 million smartphones were added to the mobile network in 2014.
• 70% of mobile connections will be 'smart' connections by 2019, up from 25% in 2014.
• There were 69 million mobile-connected devices in 2014, approximately 1.6 per capita for
this region/country.
• There will be 86 million mobile-connected devices by 2019, approximately 2 per capita
for this region/country.

4G, 3G and 2G Connections - Argentina
6.2B
Source: Cisco VNI Global Mobile Data Traffic Forecast, 2014–2019
• 4G connections will be 9.9% of total mobile connections by 2019, compared to 0.0%
in 2014.
• 3G connections will be 70.8% of total mobile connections by 2019, compared to
37.3% in 2014.
• 3G connections surpass 2G connections by 2016.
• 2G connections will be 19.3% of total mobile connections by 2019, compared to
62.7% in 2014.

Device Growth Traffic Profiles - Argentina
6.2B
Source: Cisco VNI Global Mobile Data Traffic Forecast, 2014–2019
• Smartphone mobile data traffic will grow 10.5-fold from 2014 to 2019, a compound annual
growth rate of 60%.
• Smartphones will be 59% of total mobile data traffic by 2019, compared to 42% at the end
of 2014.
• On average, a smartphone generates 64x more mobile data traffic per month than a basic
handset.
• Smartphones were 30.3% of device connections in 2014, and 41.9% of total traffic.
• Smartphones will be 54.9% of device connections by 2019, and 58.8% of total traffic.

Argentina - Accelerating Network Speeds – 4G Traffic
6.2B
Source: Cisco VNI Global Mobile Data Traffic Forecast, 2014–2019
• 4G will account for 35.9% of total mobile data traffic by 2019, compared to 0.1% at
the end of 2014.
• 4G traffic will grow 5041-fold from 2014 to 2019, a compound annual growth rate of
450%.
• 4G smartphone traffic will be 17% of total smartphone traffic by 2019, compared to 0.0%
at the end of 2014.
• The average 4G smartphone will generate 3,885 MB of traffic per month by 2019,
compared to 1,676 MB for non-4G smartphones.

Conclusion

Cisco VNI Global Mobile Forecast, 2014–2019Key Takeaways / Summary
Source: Cisco VNI Global Mobile Data Traffic Forecast, 2014–2019
Global Mobile Data Traffic
Global Mobile Traffic Offload
Global Mobile Network Speeds
Global Mobile Smart Devices Traffic
Global Mobile Devices/Connections
Global Mobile Video
By 2019, mobile data traffic will reach 24.3 EBs/per month (292 EBs annually).
By 2019, 54% of mobile data traffic will be offloaded to Wi-Fi/small cell networks.
By 2019, smart devices will generate 97% of global mobile data traffic.
By 2019, over 72% of the world’s mobile data traffic will be video.
By 2019, avg mobile connection speed will more than double (1.7 Mbps to 4.0 Mbps).
By 2019, there will be 1.5 mobile connections per capita globally.
Global Mobile UsersBy 2019, there will be 5.2 Billion global mobile users, representing 69% of the global population.

Cisco VNI ARG Mobile Forecast, 2014–2019Key Takeaways / Summary
Source: Cisco VNI Global Mobile Data Traffic Forecast, 2014–2019
Argentina Mobile Data Traffic
Argentina Mobile Traffic Offload
Argentina Mobile Network Speeds
Argentina Mobile Devices
Argentina Mobile Connections
Argentina Mobile Video
Mobile data traffic will grow 7-fold from 2014 to 2019 (CAGR 49%)
By 2019, 41% of mobile data traffic will be offloaded to Wi-Fi/small cell networks.
5.2 M Smartphones were added to the mobile network in 2014
By 2019, over 70% of the ARG’s mobile data traffic will be video.
By 2019, avg mobile connection speed will grow 3.8-fold (0.3 Mbps to 1.22 Mbps).
By 2019, there will be 86 M mobile connections, representing 2 connections per capita.
Argentina Mobile UsersBy 2019, there will be 36.5 M ARG mobile users, representing 84% of the ARG population.

Cisco VNI Mobile Forecast; 2014–2019Get more info—see Tools and Resources
www.cisco.com/go/vni