Embed Size (px)
Citation preview
Associating The Value of
Automation With Project Funding
Dave Woll
Vice President
ARC Advisory Group
2© ARC Advisory Group
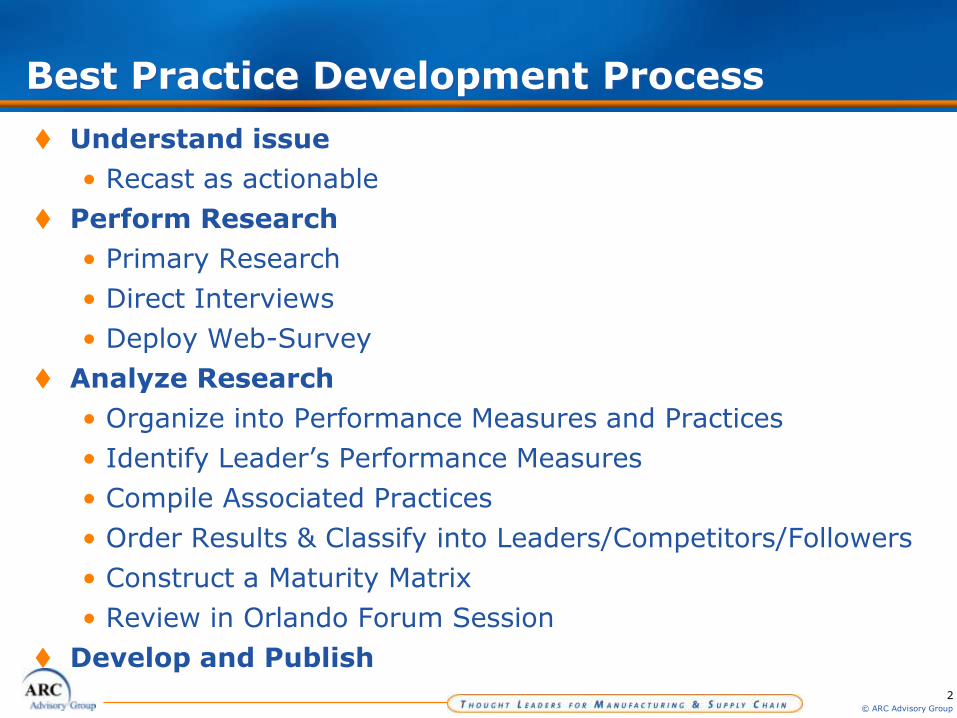
Best Practice Development Process
Understand issue
• Recast as actionable
Perform Research
• Primary Research
• Direct Interviews
• Deploy Web-Survey
Analyze Research
• Organize into Performance Measures and Practices
• Identify Leader’s Performance Measures
• Compile Associated Practices
• Order Results & Classify into Leaders/Competitors/Followers
• Construct a Maturity Matrix
• Review in Orlando Forum Session
Develop and Publish
3© ARC Advisory Group
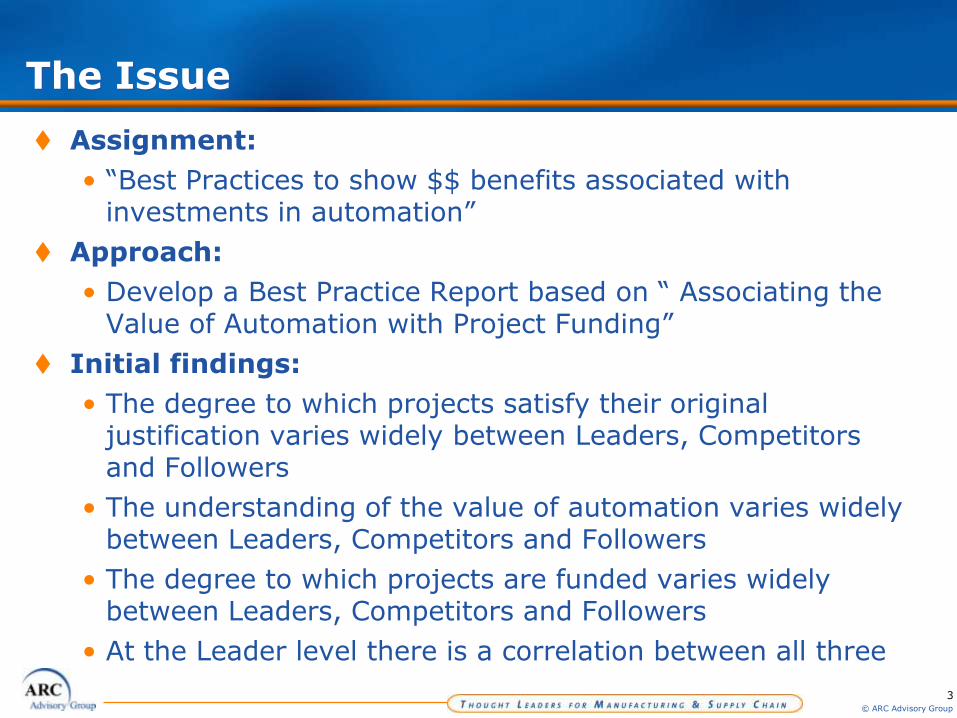
The Issue
Assignment:
• “Best Practices to show $$ benefits associated with investments in automation”
Approach:
• Develop a Best Practice Report based on “ Associating the Value of Automation with Project Funding”
Initial findings:
• The degree to which projects satisfy their original justification varies widely between Leaders, Competitors and Followers
• The understanding of the value of automation varies widely between Leaders, Competitors and Followers
• The degree to which projects are funded varies widely between Leaders, Competitors and Followers
• At the Leader level there is a correlation between all three
4© ARC Advisory Group
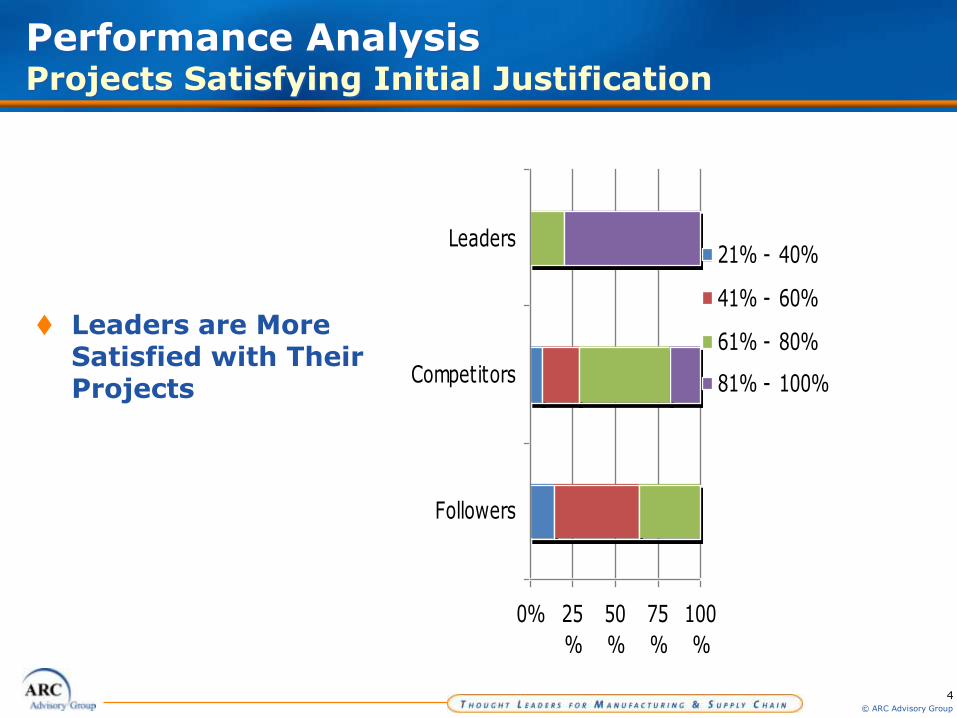
Performance Analysis Projects Satisfying Initial Justification
Leaders are More Satisfied with Their Projects
0% 25
%
50
%
75
%
100
%
Followers
Competitors
Leaders21% - 40%
41% - 60%
61% - 80%
81% - 100%
5© ARC Advisory Group
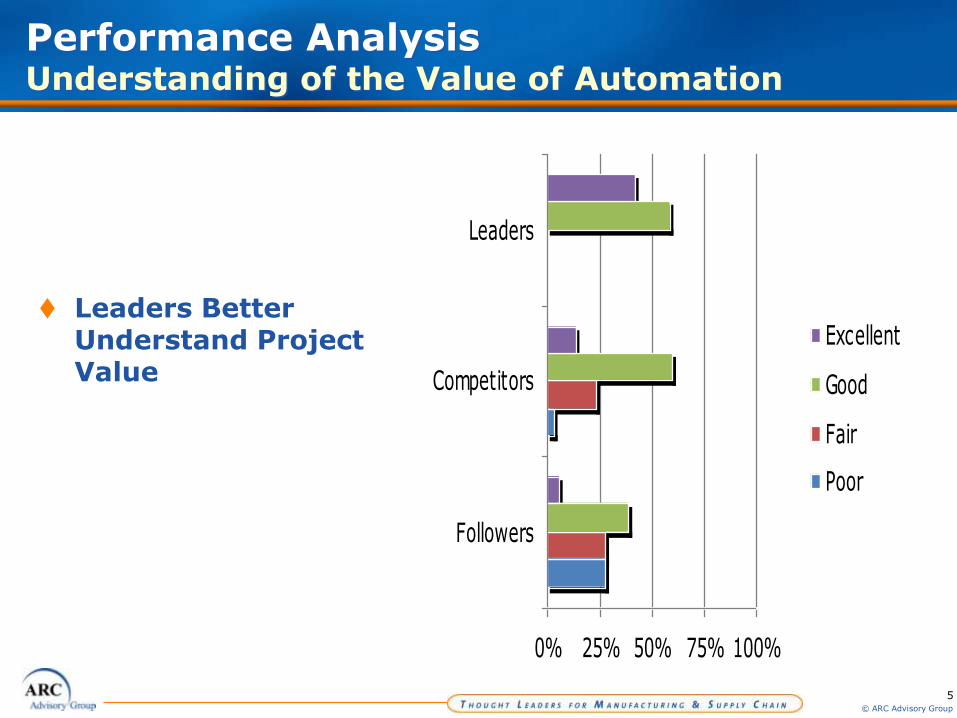
Performance Analysis Understanding of the Value of Automation
Leaders Better Understand Project Value
0% 25% 50% 75% 100%
Followers
Competitors
Leaders
Excellent
Good
Fair
Poor
6© ARC Advisory Group
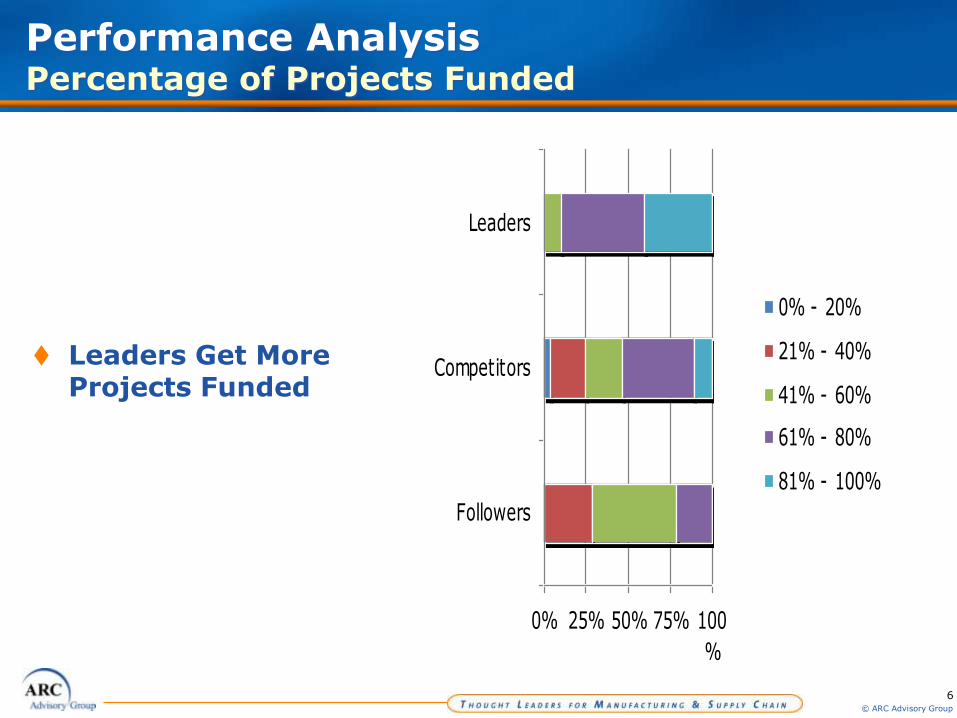
Performance Analysis Percentage of Projects Funded
Leaders Get More Projects Funded
0% 25% 50% 75% 100
%
Followers
Competitors
Leaders
0% - 20%
21% - 40%
41% - 60%
61% - 80%
81% - 100%
7© ARC Advisory Group
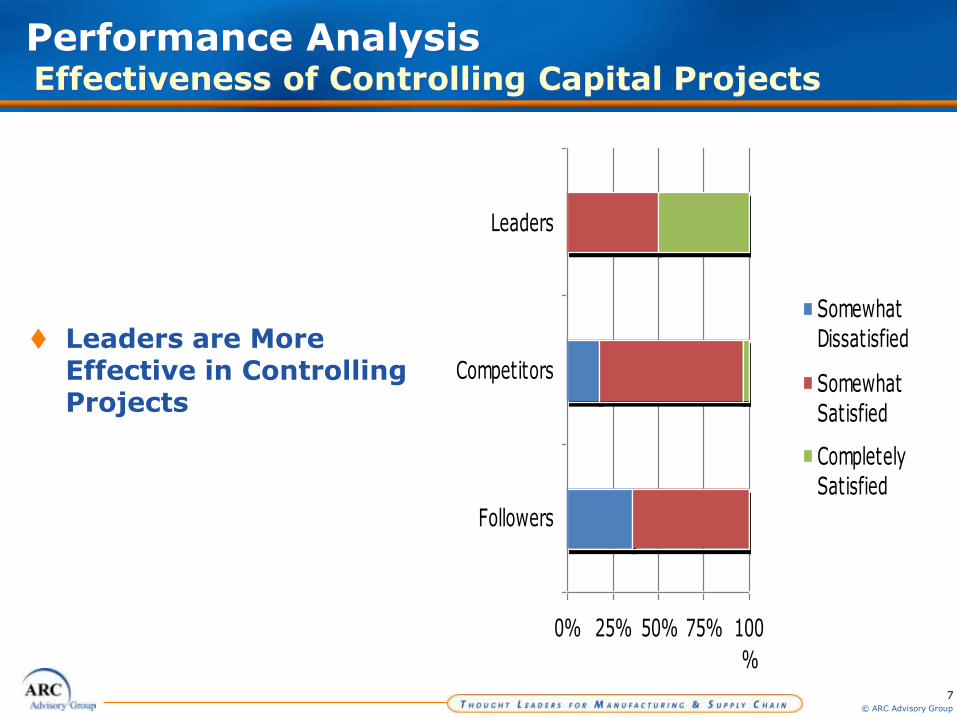
Performance Analysis Effectiveness of Controlling Capital Projects
Leaders are More Effective in Controlling Projects
0% 25% 50% 75% 100
%
Followers
Competitors
Leaders
Somewhat
Dissatisfied
Somewhat
Satisfied
Completely
Satisfied
8© ARC Advisory Group
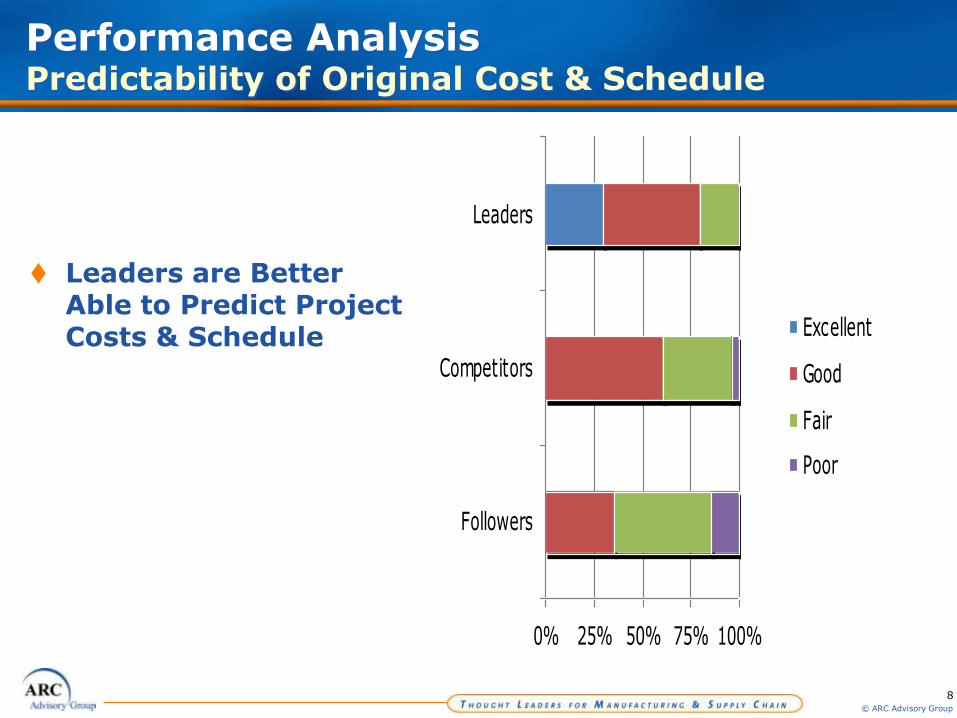
Performance Analysis Predictability of Original Cost & Schedule
Leaders are Better Able to Predict Project Costs & Schedule
0% 25% 50% 75% 100%
Followers
Competitors
Leaders
Excellent
Good
Fair
Poor
9© ARC Advisory Group
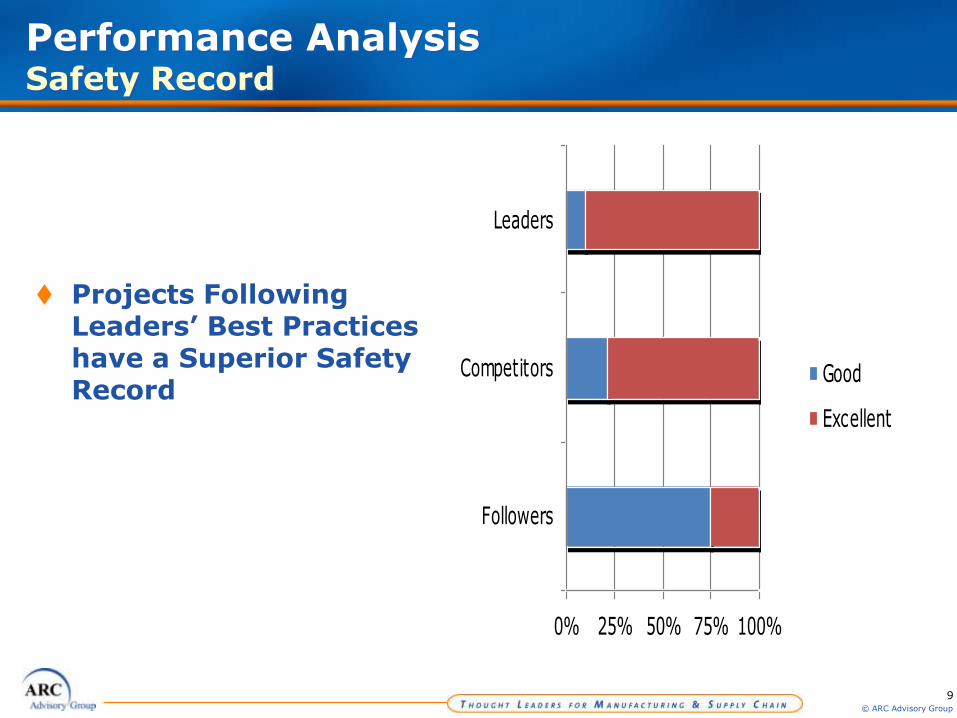
Performance Analysis Safety Record
0% 25% 50% 75% 100%
Followers
Competitors
Leaders
Good
Excellent
Projects Following Leaders’ Best Practices have a Superior Safety Record
10© ARC Advisory Group
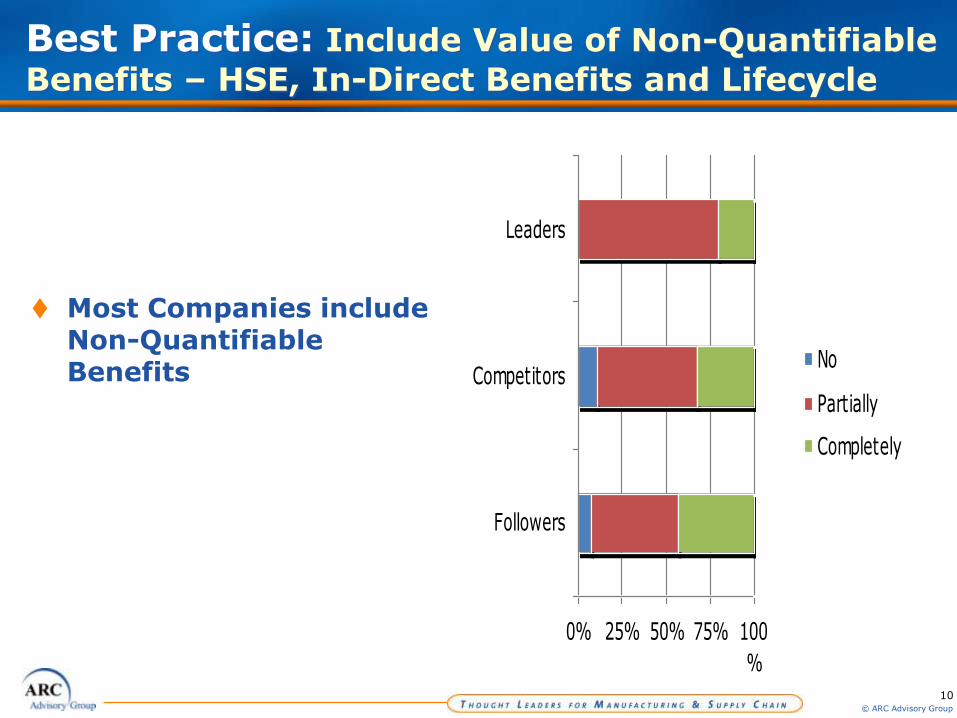
Best Practice: Include Value of Non-Quantifiable
Benefits – HSE, In-Direct Benefits and Lifecycle
Most Companies include Non-Quantifiable Benefits
0% 25% 50% 75% 100
%
Followers
Competitors
Leaders
No
Partially
Completely
11© ARC Advisory Group
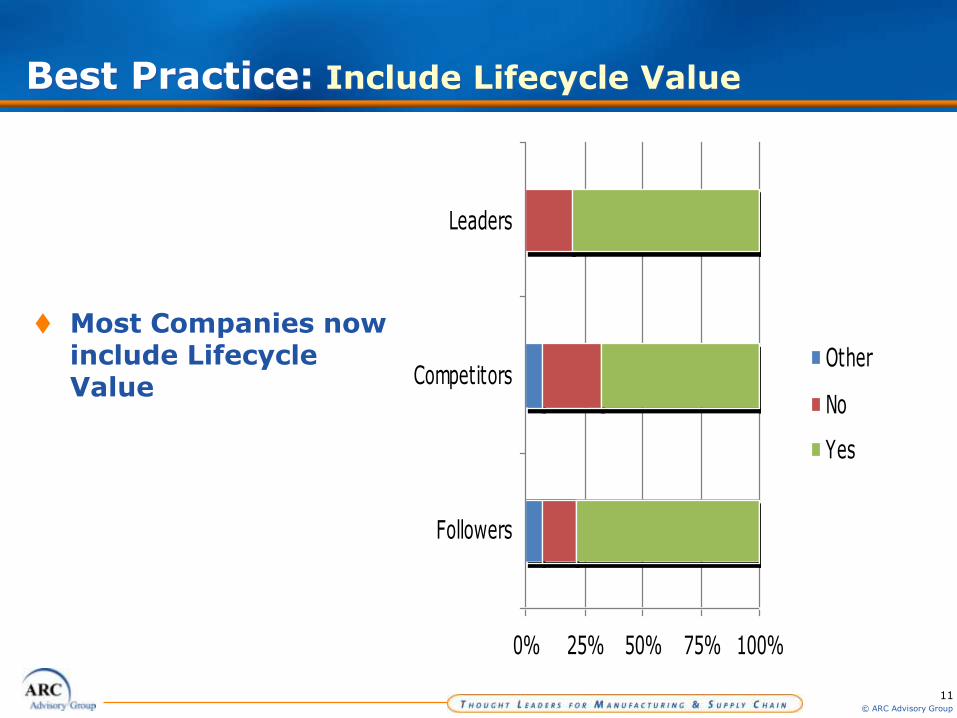
Best Practice: Include Lifecycle Value
Most Companies now include Lifecycle Value
0% 25% 50% 75% 100%
Followers
Competitors
Leaders
Other
No
Yes
12© ARC Advisory Group
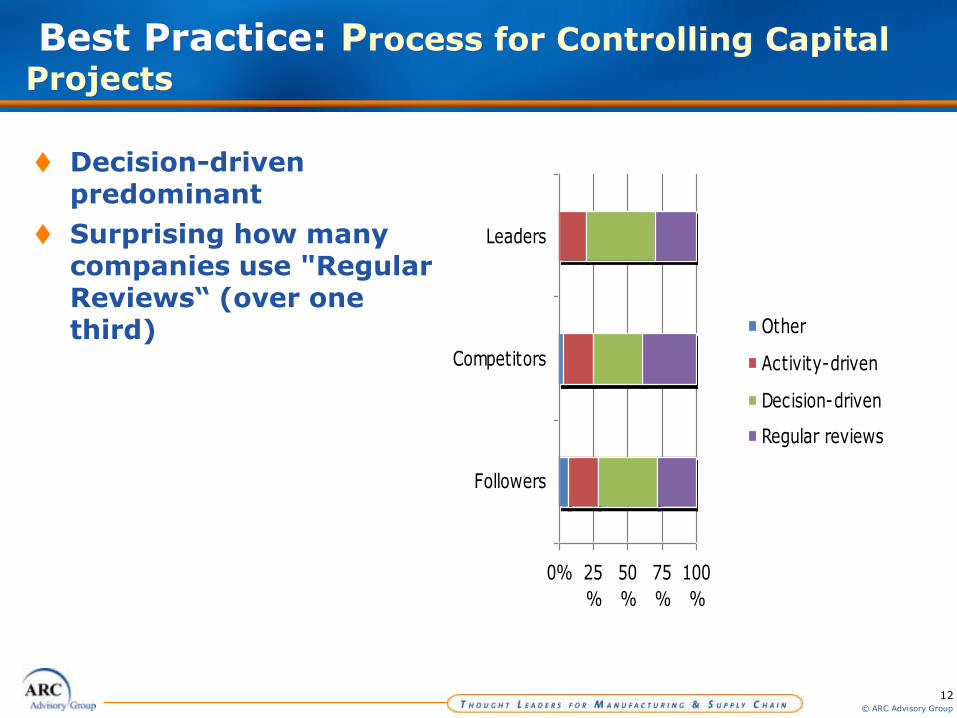
Best Practice: Process for Controlling Capital
Projects
Decision-driven predominant
Surprising how many companies use "Regular Reviews“ (over one third)
0% 25
%
50
%
75
%
100
%
Followers
Competitors
Leaders
Other
Activity-driven
Decision-driven
Regular reviews
13© ARC Advisory Group
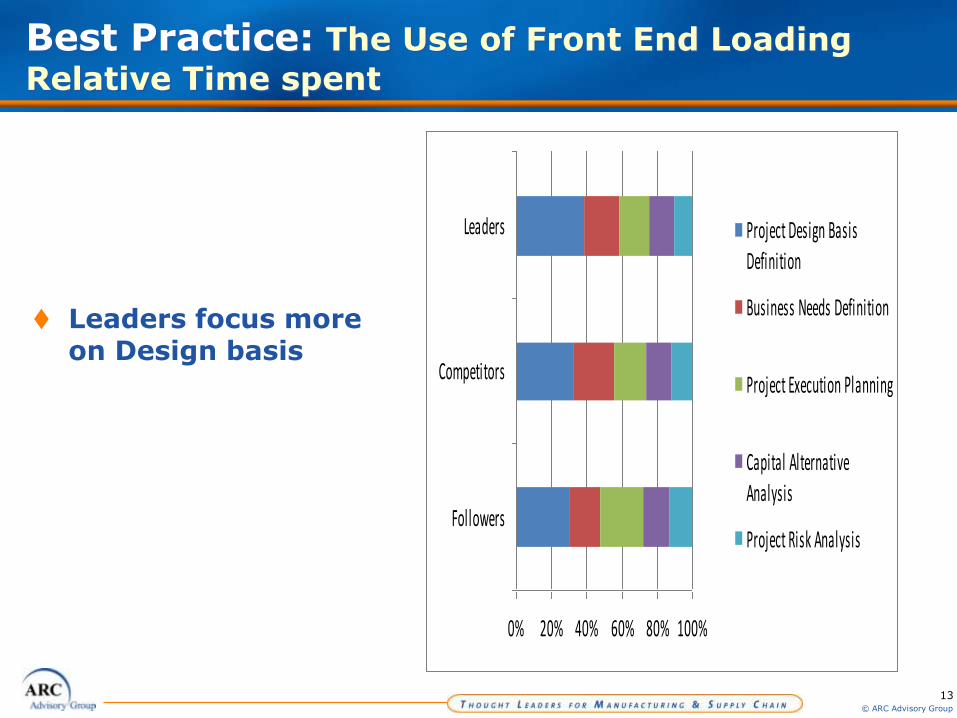
Best Practice: The Use of Front End Loading
Relative Time spent
Leaders focus more on Design basis
0% 20% 40% 60% 80% 100%
Followers
Competitors
Leaders Project Design BasisDefinition
Business Needs Definition
Project Execution Planning
Capital AlternativeAnalysis
Project Risk Analysis
14© ARC Advisory Group
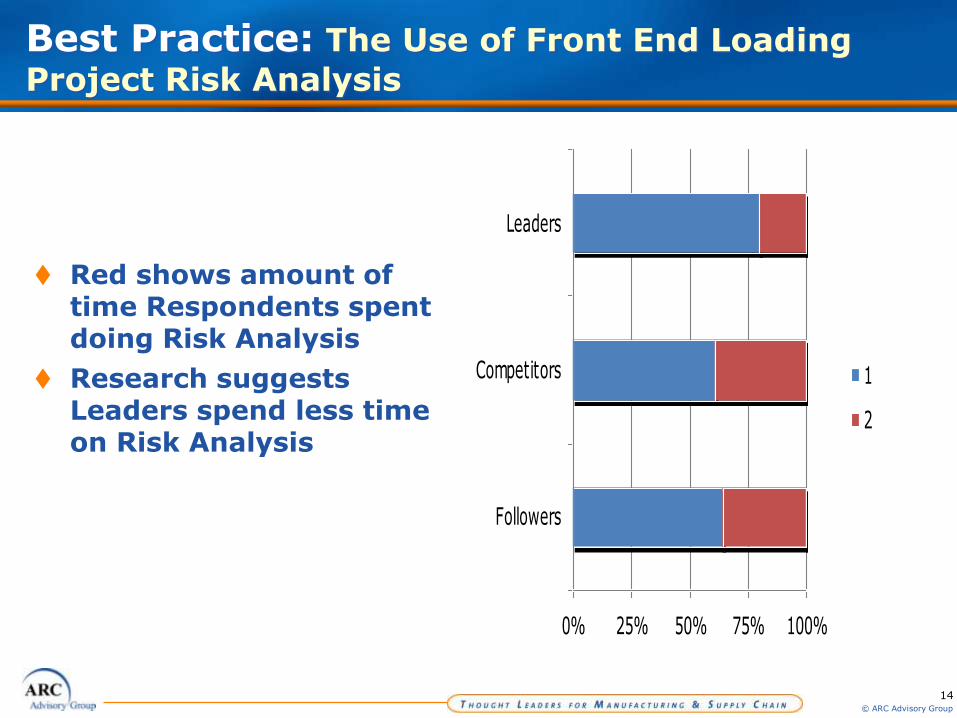
Best Practice: The Use of Front End Loading
Project Risk Analysis
Red shows amount of time Respondents spent doing Risk Analysis
Research suggests Leaders spend less time on Risk Analysis
0% 25% 50% 75% 100%
Followers
Competitors
Leaders
1
2
15© ARC Advisory Group
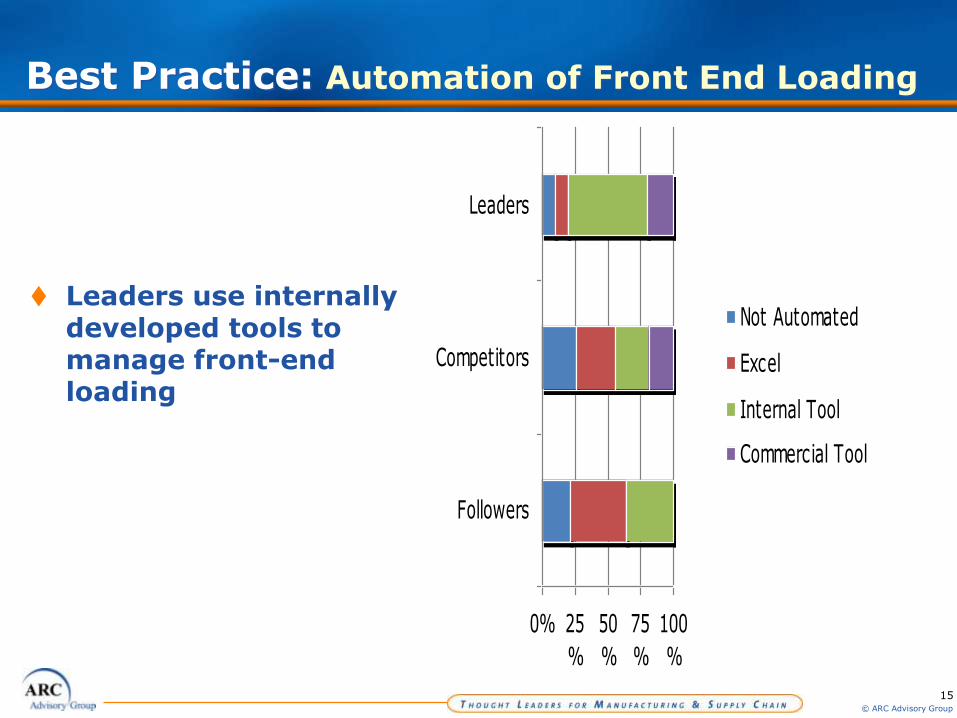
Best Practice: Automation of Front End Loading
Leaders use internally developed tools to manage front-end loading
0% 25
%
50
%
75
%
100
%
Followers
Competitors
Leaders
Not Automated
Excel
Internal Tool
Commercial Tool
16© ARC Advisory Group
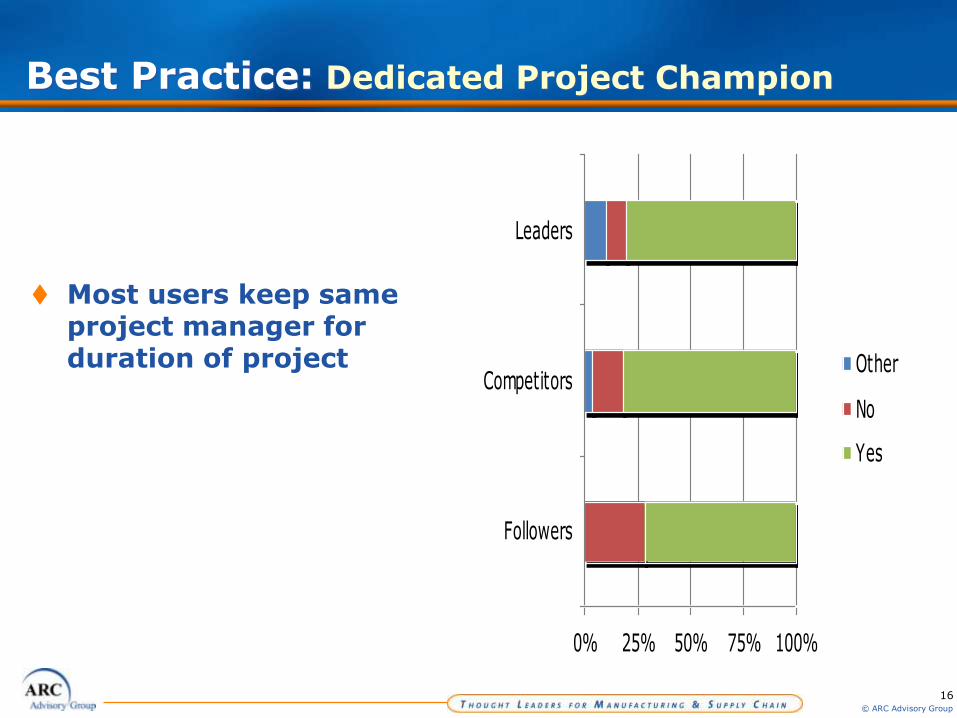
Best Practice: Dedicated Project Champion
Most users keep same project manager for duration of project
0% 25% 50% 75% 100%
Followers
Competitors
Leaders
Other
No
Yes
17© ARC Advisory Group
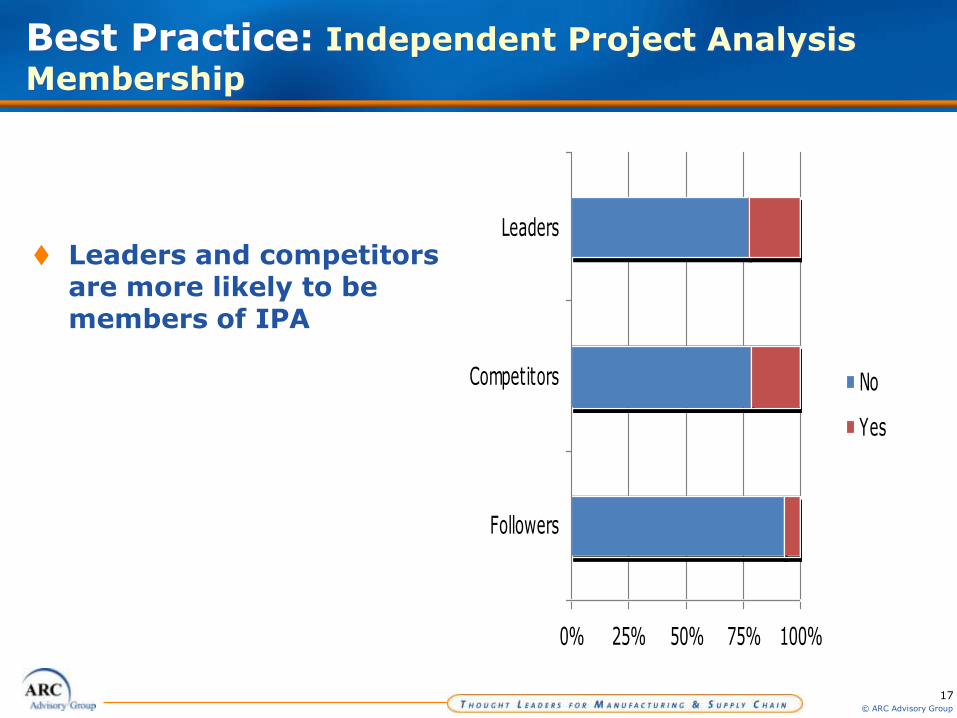
Best Practice: Independent Project Analysis
Membership
Leaders and competitors are more likely to be members of IPA
0% 25% 50% 75% 100%
Followers
Competitors
Leaders
No
Yes
18© ARC Advisory Group
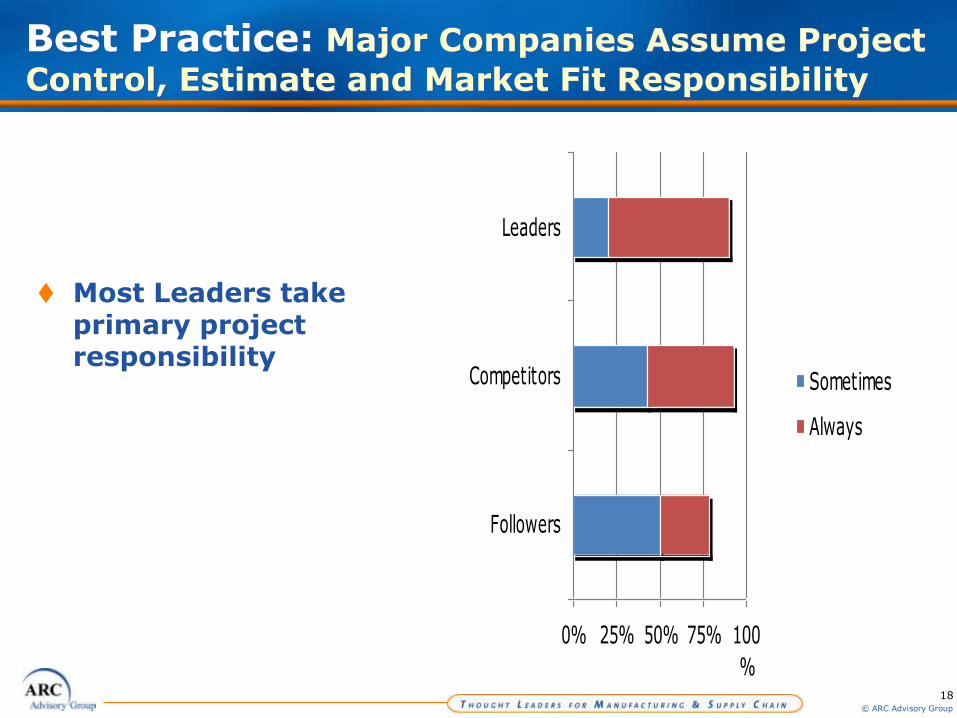
Best Practice: Major Companies Assume Project
Control, Estimate and Market Fit Responsibility
Most Leaders take primary project responsibility
0% 25% 50% 75% 100
%
Followers
Competitors
Leaders
Sometimes
Always
19© ARC Advisory Group
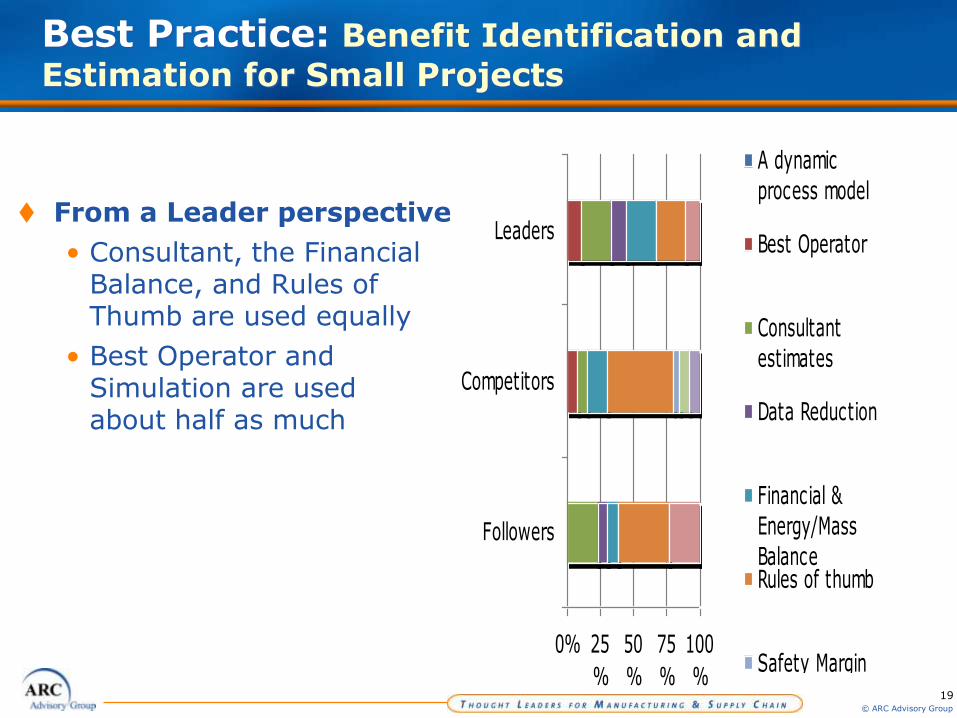
Best Practice: Benefit Identification and
Estimation for Small Projects
From a Leader perspective
• Consultant, the Financial Balance, and Rules of Thumb are used equally
• Best Operator and Simulation are used about half as much
0% 25
%
50
%
75
%
100
%
Followers
Competitors
Leaders
A dynamic
process model
Best Operator
Consultant
estimates
Data Reduction
Financial &
Energy/Mass
BalanceRules of thumb
Safety Margin
Reduction
Simulation
Supplier estimates
Test Bed Results
Other
20© ARC Advisory Group
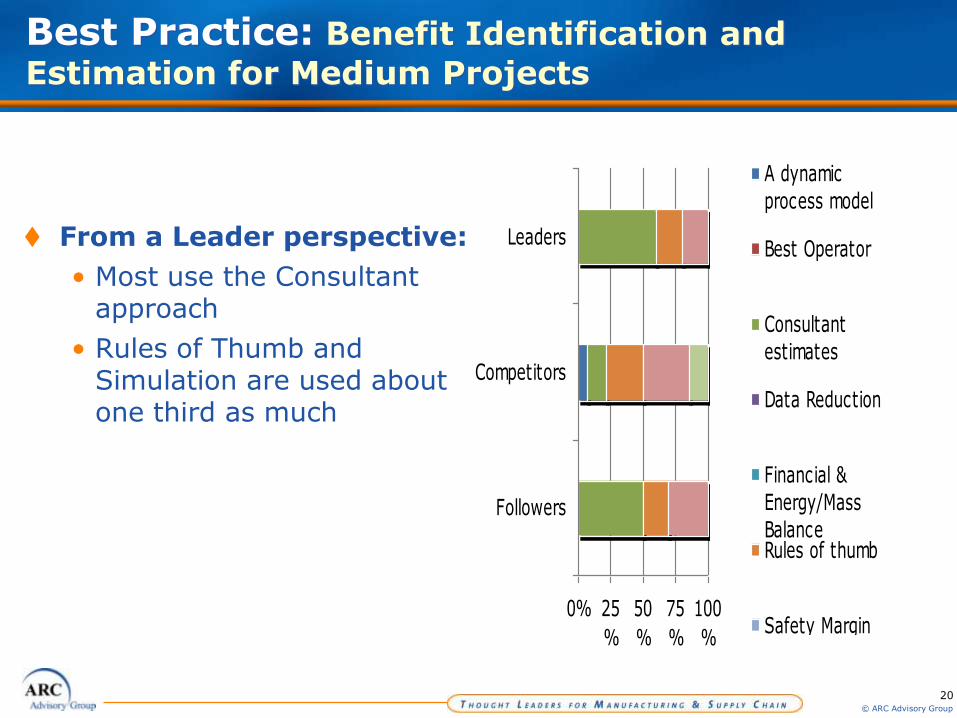
Best Practice: Benefit Identification and
Estimation for Medium Projects
From a Leader perspective:
• Most use the Consultant approach
• Rules of Thumb and Simulation are used about one third as much
0% 25
%
50
%
75
%
100
%
Followers
Competitors
Leaders
A dynamic
process model
Best Operator
Consultant
estimates
Data Reduction
Financial &
Energy/Mass
BalanceRules of thumb
Safety Margin
Reduction
Simulation
Supplier estimates
Test Bed Results
Other
21© ARC Advisory Group
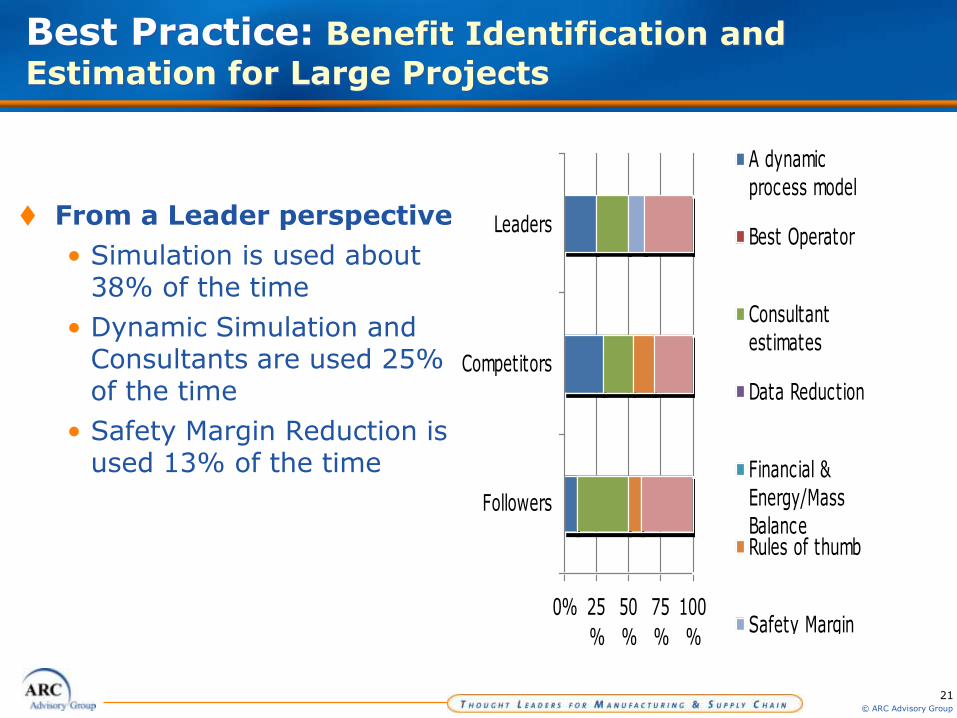
Best Practice: Benefit Identification and
Estimation for Large Projects
From a Leader perspective
• Simulation is used about 38% of the time
• Dynamic Simulation and Consultants are used 25% of the time
• Safety Margin Reduction is used 13% of the time
0% 25
%
50
%
75
%
100
%
Followers
Competitors
Leaders
A dynamic
process model
Best Operator
Consultant
estimates
Data Reduction
Financial &
Energy/Mass
BalanceRules of thumb
Safety Margin
Reduction
Simulation
Supplier estimates
Test Bed Results
Other
22© ARC Advisory Group
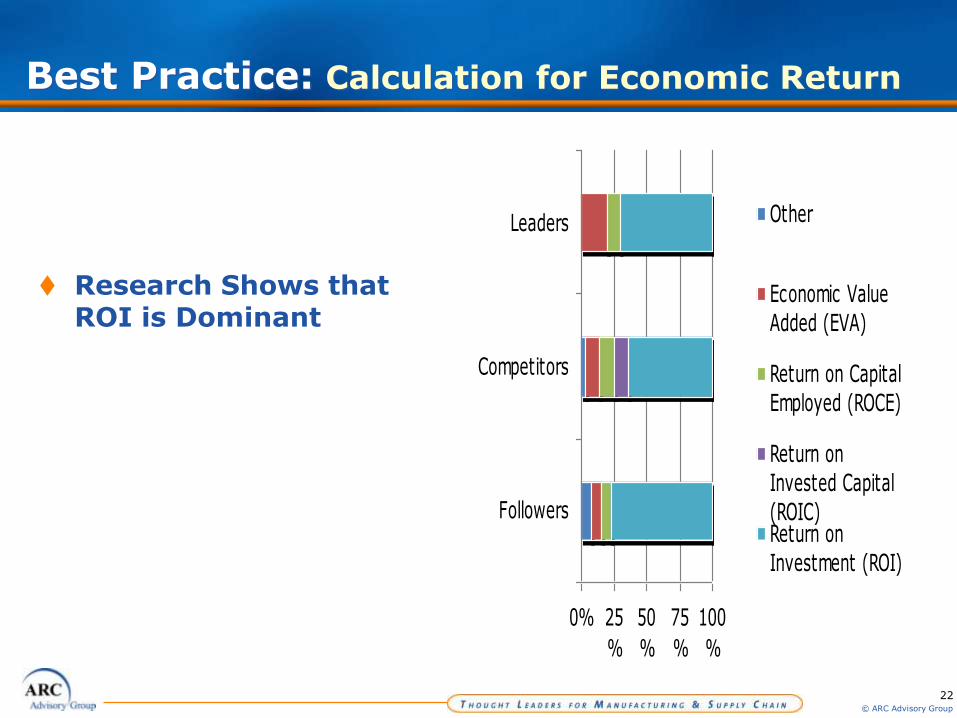
Best Practice: Calculation for Economic Return
Research Shows that ROI is Dominant
0% 25
%
50
%
75
%
100
%
Followers
Competitors
Leaders Other
Economic Value
Added (EVA)
Return on Capital
Employed (ROCE)
Return on
Invested Capital
(ROIC)Return on
Investment (ROI)
23© ARC Advisory Group
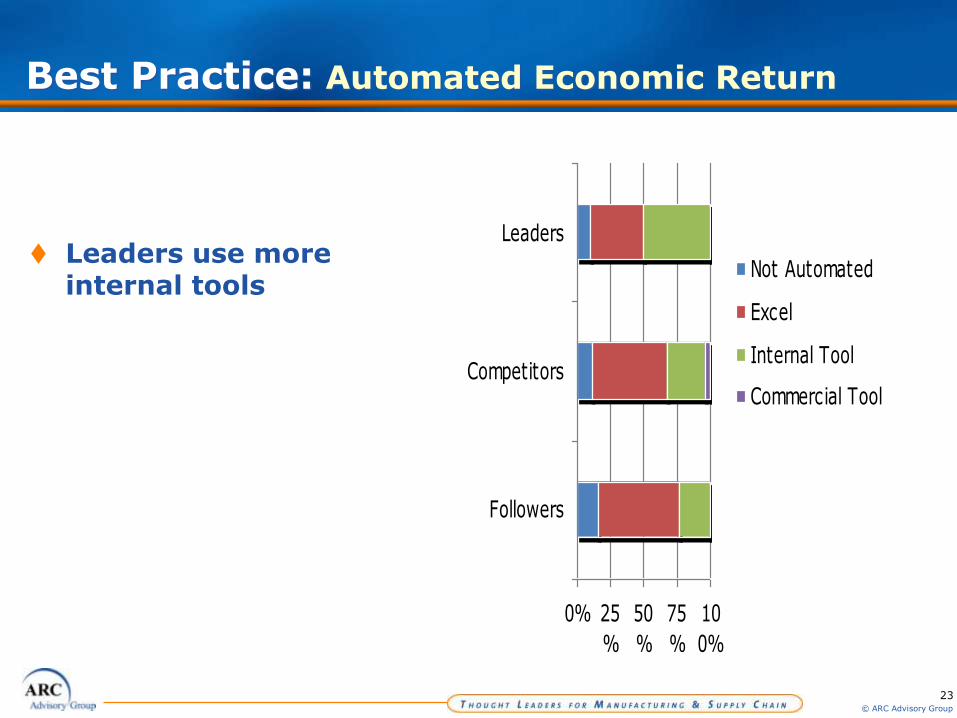
Best Practice: Automated Economic Return
Leaders use more internal tools
0% 25
%
50
%
75
%
10
0%
Followers
Competitors
Leaders
Not Automated
Excel
Internal Tool
Commercial Tool
24© ARC Advisory Group
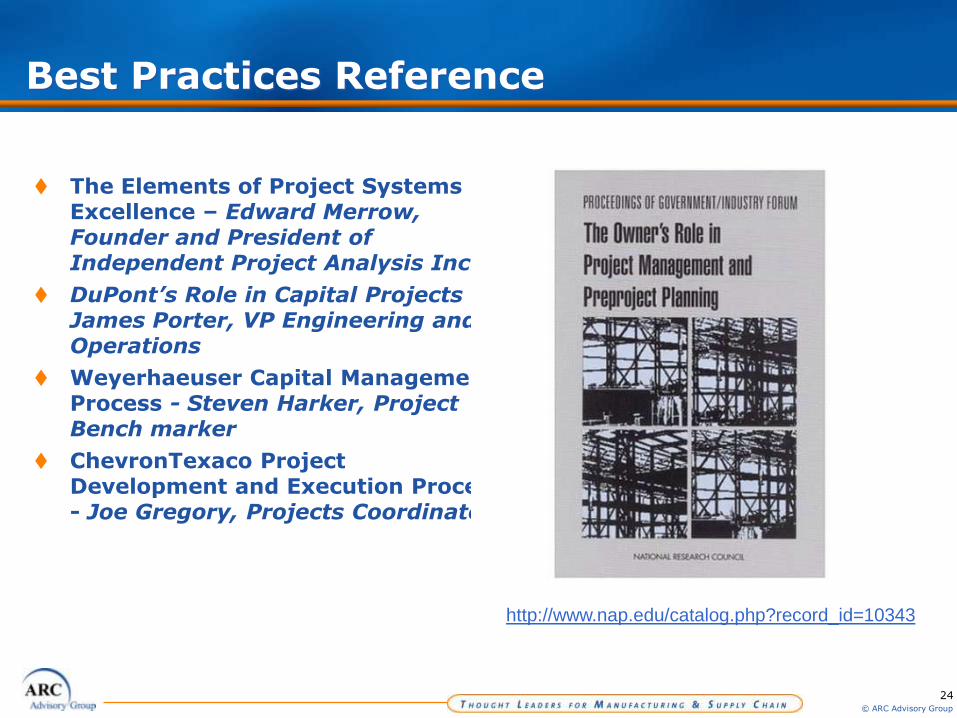
Best Practices Reference
The Elements of Project Systems Excellence – Edward Merrow, Founder and President of Independent Project Analysis Inc.
DuPont’s Role in Capital Projects –James Porter, VP Engineering and Operations
Weyerhaeuser Capital Management Process - Steven Harker, Project Bench marker
ChevronTexaco Project Development and Execution Process - Joe Gregory, Projects Coordinator
http://www.nap.edu/catalog.php?record_id=10343

25© ARC Advisory Group
Thank You.For more information, contact the author at [email protected] or visit our web pages at
www.arcweb.com