Embed Size (px)
Citation preview

APM Center of Excellence Drives Improved Business Results at Itau Unibanco
Jorge Carlos Socolowski
DOX09S #CAWorld
Banco Itaú Unibanco Superintendência de Suporte ao Desenvolvedor Centro de Excelência APM
DevOps

2
Abstract
Improving applications quality and the overall
customer experience is a key focus for Itau.
This presentation will discuss the APM Center
of Excellence process and how this approach
lead to better response times using fewer
resources and improved business results while
delighting both clients and applications support
teams.
Jorge Socolowski
Itau Unibanco
IT Support Manager

3
Itaú Unibanco At a Glance Leading position in Brazil through key competitive strengths
US$84.2 Billion of market cap(1)
A Brazilian multinational bank with 94,383 employees, besides of 5,024 branches
and CSBs in with 27,994 ATMs in Brazil and abroad
Major provider of finance for the expansion of Brazilian companies
Among the best talent pool in the Brazilian financial system
GLOBAL FOOTPRINT OF BRAZIL’S TOP PRIVATE SECTOR| AS JUNE 30,2014

The story of the APM Center of Excellence

5
Back in 2012, we were focused on incidents
Approximately 300 licenses of introscope, installed in Websphere® server
Focus in infrastructure management
Used in critical situations mostly
Meanwhile, some applications teams faced quality challenges, such as …

6
Application Quality Challenges
Availability and performance problems that affect end user experience
Lack of application visibility during crisis prevent/difficult root-cause analysis identification
Difficulty to indicate improving points to the problems faced due to lack of visibility
Even when improving points are identified and fixed, its effectiveness is not easily measured
Difficulty to follow the application quality evolution
Lack of consistent KPIs to show how application is performing

7
What We Really Needed …
• Enhance the way we used the tool instead of expanding it (“think process”).
• Focus on application performance not infrastructure errors.
• Empower and leverage application teams, not operations/infrastructure teams.
• Cover proactive improvements AND reactive actions.

8
Our Approach
Define methodologies and processes to implement a PDCA cycle for applications in order to:
• Determine incidents root-cause analysis faster through a better application visibility.
• Act proactively through identifying improving points and tracking application quality evolution, defining monitoring and performance KPI’s.
Create a Center of Excellence in APM to maintain those methodologies and processes, and to accelerate their adoption by the application support teams.
Create a Center of Excellence in APM.

9
Methodologies and Processes
Pre-requisite for application entry in the APM platform
Enables the understanding of the application, its main components and relevant metrics
Based on survey forms filled by the application support teams
Application onboarding
Application evolutive tracking Follow up to onboarding, implements a set of good practices to enable a PDCA cycle during application development and maintenance
Based on evolutive tracking reports
Crit-Sit Methodology to apply when immediate action is required
Enables precise diagnosis with minimal setup time, usually adopted in incidents or application crisis
Based on light instrumentation

10
Roles and Responsibility: A Key Factor
Title Application
support APM CoE
Monitoring
tools support
Infrastructure
support
• Responsible for
application availability
and performance
• Accountable for
fixing problems and
acting on incidents
• Proactive acting and
applications
continuous
improvements
• APM methodology
• KPIs definition
• Applications entry
into the APM
platform
• Manage and
maintain APM
Platform
• Expand
• Upgrades
• Configuration
• APM agents
installation on
servers
• APM usage to
analyze applications
in the environment

11
Action Plan
Challenges Solutions
Availability and performance problems
Lack of visibility
Root-cause analysis
Indicate improving points
Post-implementation evaluation
Track application quality evolution
Lack of performance indicators

12
Action Plan
Challenges Solutions
Availability and performance problems Troubleshooting tool
Lack of visibility Dashboards
Root-cause analysis Dashboards with drill down
Indicate improving points Troubleshooting tool
Post-implementation evaluation Evolutive tracking report
Track application quality evolution Evolutive tracking report
Lack of performance indicators Thresholds, monitoring, reports
13
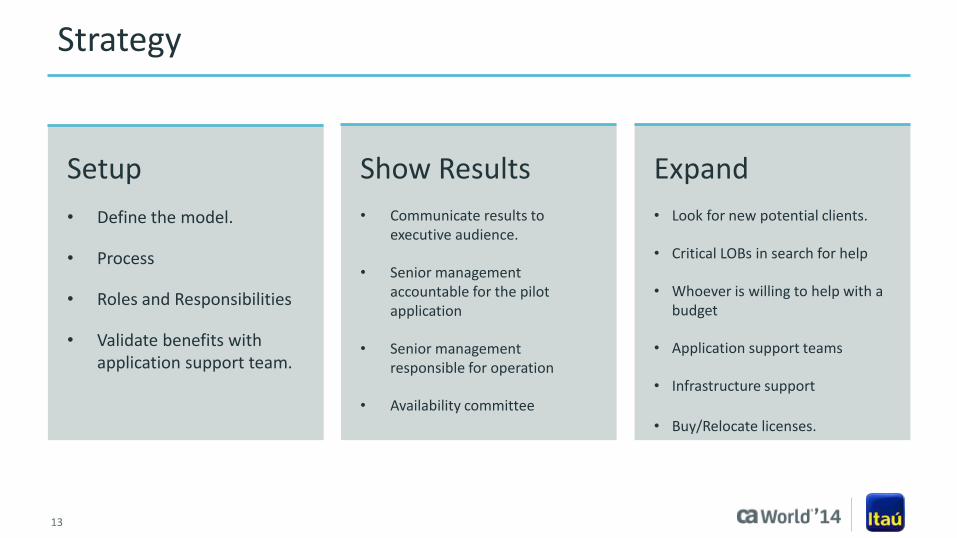
Strategy
Setup
• Define the model.
• Process
• Roles and Responsibilities
• Validate benefits with application support team.
Show Results
• Communicate results to executive audience.
• Senior management accountable for the pilot application
• Senior management responsible for operation
• Availability committee
Expand
• Look for new potential clients.
• Critical LOBs in search for help
• Whoever is willing to help with a budget
• Application support teams
• Infrastructure support
• Buy/Relocate licenses.

14
APM Model End-to-End
Evolutive tracking Governance
Onboarding
QA
implementation
Application
survey and
mapping
Application
dashboards
Evolutive
tracking
reports
Implement
recommendations
Measure results
Metrics
enablement

15
• Dashboard with main components and application
services status.
How did we solve the lack of visibility?

16
• Dashboard with main components and drill-down
capabilities
How did we solve the lack of visibility?

17
How did we enable the tracking of application quality?

18
How did we enable the tracking of application quality?

The outcomes

20
Outcomes Details
Action
Recommendation for adjustments in a call center’s application code used for call ending functionality.
Outcomes
30% reduction in the application overall response time
3 seconds reduction in the idle time for every call, increasing the productivity and capacity of attendance in the Call Center with the same Infrastructure.

21
Outcomes Details
Action
Improvement recommendation for an insurance application:
Outcomes
Increased application performance
Reduction of 95% of average time in transaction response
Optimizing 73% of average time in analysis, buying and sending parts
Reduction in performance incidents amount in 2013:
Jan Fev Mar Abr Mai Jun Jul Ago Set Out Nov Dez
2 7 6 4 2 1 0 0 0 0 0 0
22
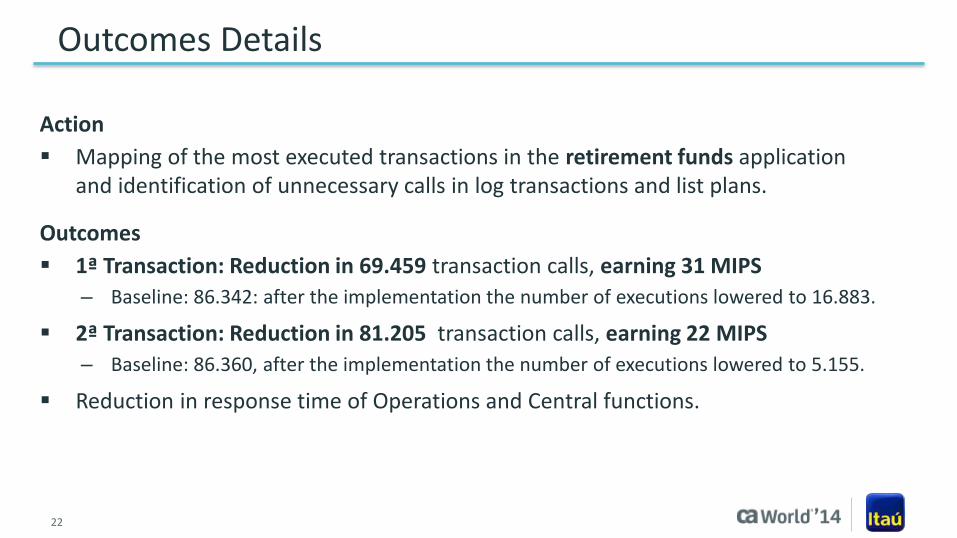
Outcomes Details
Action
Mapping of the most executed transactions in the retirement funds application and identification of unnecessary calls in log transactions and list plans.
Outcomes
1ª Transaction: Reduction in 69.459 transaction calls, earning 31 MIPS
– Baseline: 86.342: after the implementation the number of executions lowered to 16.883.
2ª Transaction: Reduction in 81.205 transaction calls, earning 22 MIPS
– Baseline: 86.360, after the implementation the number of executions lowered to 5.155.
Reduction in response time of Operations and Central functions.
23
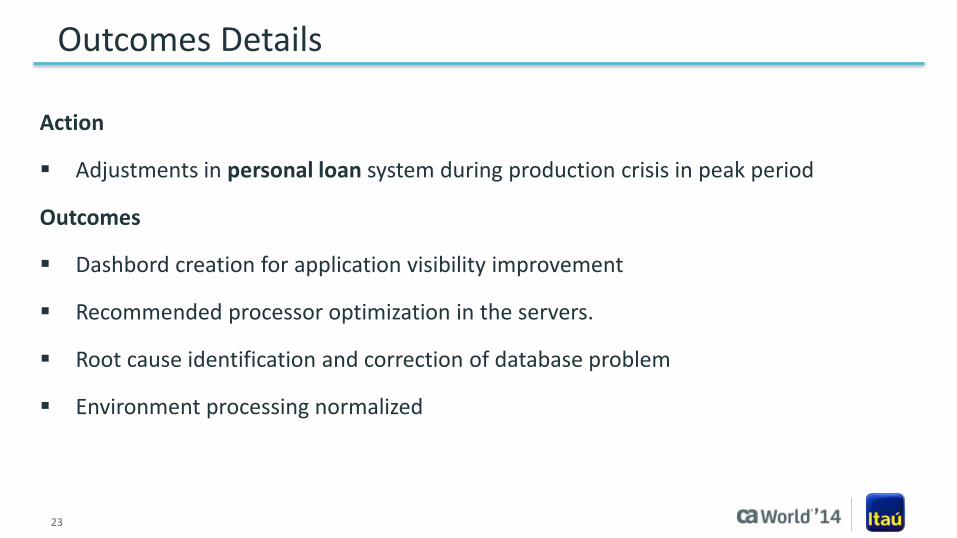
Outcomes Details
Action
Adjustments in personal loan system during production crisis in peak period
Outcomes
Dashbord creation for application visibility improvement
Recommended processor optimization in the servers.
Root cause identification and correction of database problem
Environment processing normalized

24
Outcomes Summary
Increased applications performance and availability
Proactive acting from support teams in order to reduce MTTR
MIPS reduction (Mainframe) due to application improvements in the distributed platform
Incidents resolution through the CritSit process
Executive sponsorship to expand the model
By the end of 2013 we had implemented the model for 62 applications in 8 critical LOBs:
OUTCOMES:

APM CoE evolution and Conclusions

26
APM maturity and Application Life Cycle
Proactive in Production Proactive in QA/Homologation
AP
M M
atu
rity
Application Life Cycle
Later Sooner Evolutive monitoring Performance Tests
Crit-Sit Smoke Test
Screening / Dashboards / Alerts
Later Sooner

27
How the Excellence Center is evolving?
• Process structuring • Application with pilots • Production environment
• 62 applications in 300 servers • Production
• Expansion for whole IT area • Proactive in production and QA • 100 applications in 565 servers
• User experience • Development environment
2012 2013 2014 2015
28
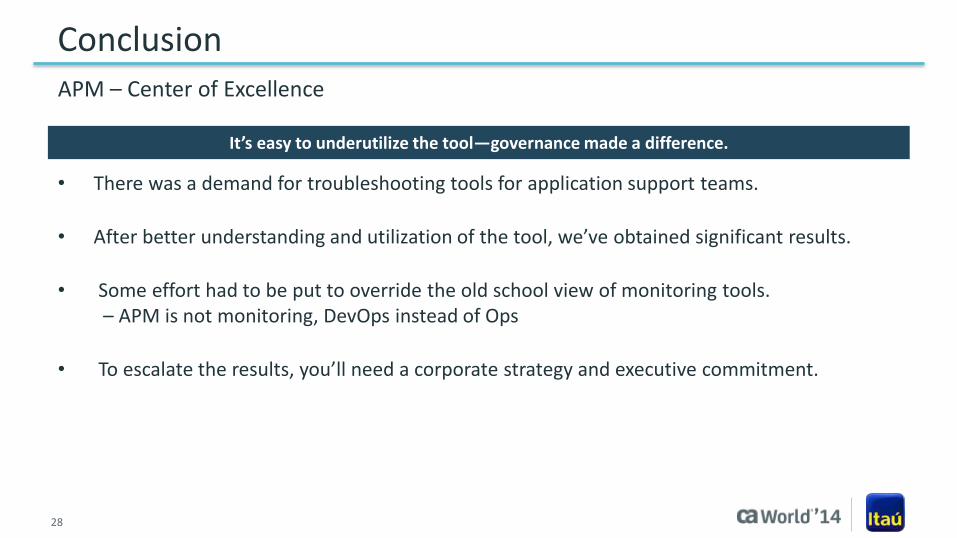
Conclusion
• There was a demand for troubleshooting tools for application support teams.
• After better understanding and utilization of the tool, we’ve obtained significant results.
• Some effort had to be put to override the old school view of monitoring tools. – APM is not monitoring, DevOps instead of Ops
• To escalate the results, you’ll need a corporate strategy and executive commitment.
APM – Center of Excellence
It’s easy to underutilize the tool—governance made a difference.

29
Lesson Learned
• Find a champion …
… with a relevant problem …
… and help her/him fix it!
• Let the champion show the results …
… to executives and peers.
• Iterate until critical mass is reached … … then leverage the model for the scope defined.
APM – Center of Excellence
Think big, start small.

30
For More Information
To learn more about DevOps, please visit:
http://bit.ly/1wbjjqX
Insert appropriate screenshot and text overlay from following “More Info Graphics” slide here;
ensure it links to correct page DevOps

31
For Informational Purposes Only
This presentation provided at CA World 2014 is intended for information purposes only and does not form any type of warranty.
Content provided in this presentation has not been reviewed for accuracy and is based on information provided by CA Partners
and Customers.
Terms of this Presentation