Embed Size (px)
Citation preview
MEASURE AND MAXIMIZE
CLOUD ROI: A FRAMEWORK AND RECOMMENDATIONS
Kim Weins, VP Marketing,
RightScale
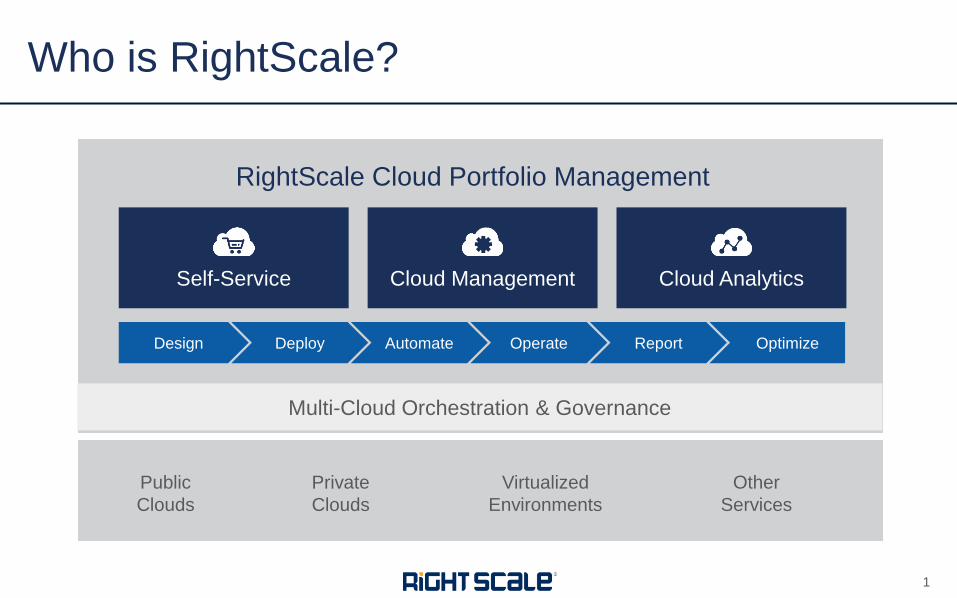
Who is RightScale?
Self-Service Cloud Analytics
RightScale Cloud Portfolio Management
Cloud Management
Design
Virtualized
Environments
Public
Clouds
Other
Services
Private
Clouds
Automate
Multi-Cloud Orchestration & Governance
Operate Deploy Report Optimize
1
• About Cloud ROI
• Maximize Cloud Value
• 5 Elements of Cloud Value
• Real-World Examples
• Framework to Measure
• Recommendations to Maximize
• Minimize Cloud Costs
• Real-World Examples
• Framework to Measure
• Recommendations to Minimize
Agenda
2 2

POLLING QUESTIONS
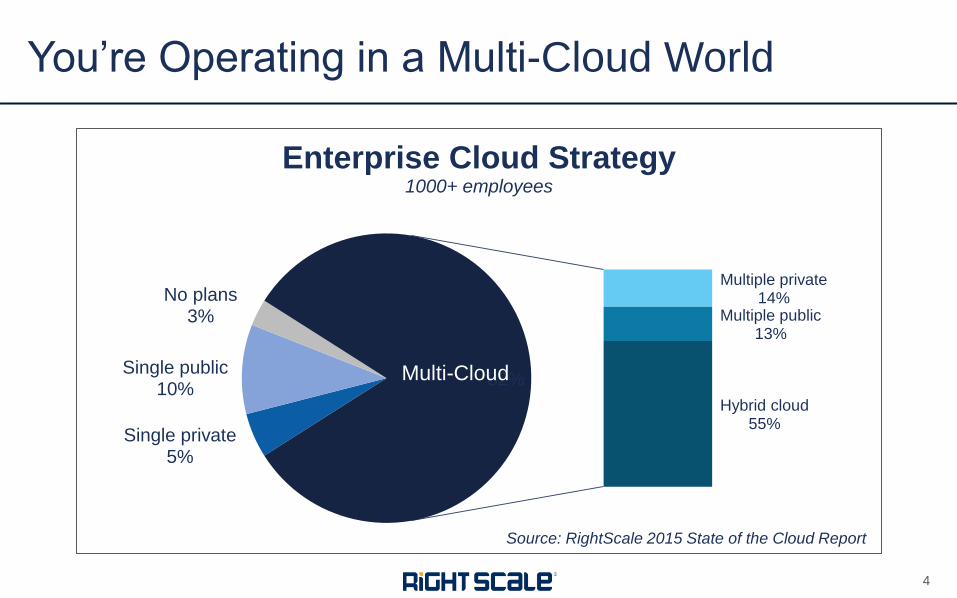
You’re Operating in a Multi-Cloud World
Single private 5%
Single public 10%
No plans 3%
Multiple private 14%
Multiple public 13%
Hybrid cloud 55%
82%
Enterprise Cloud Strategy 1000+ employees
Multi-Cloud
Source: RightScale 2015 State of the Cloud Report
4
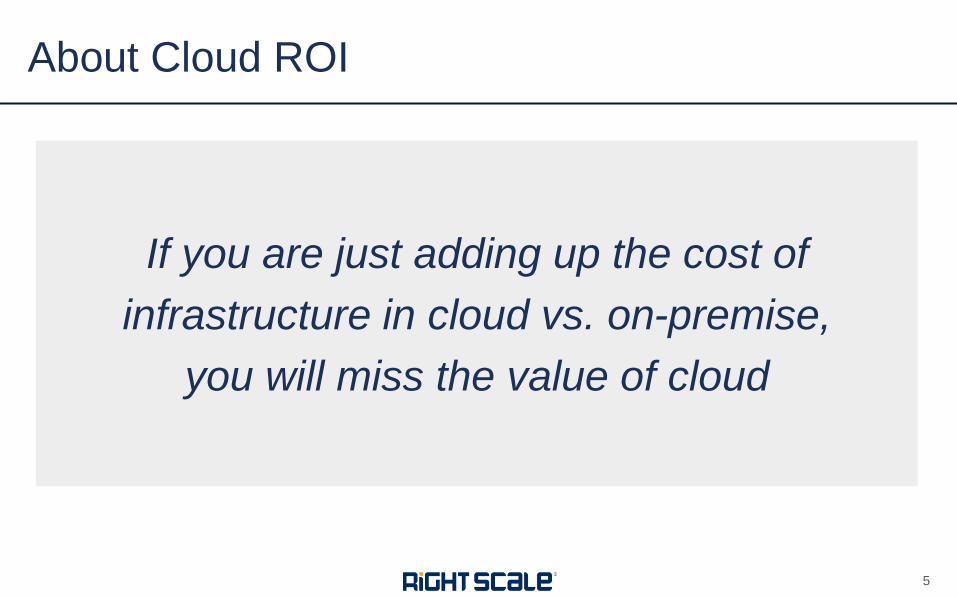
If you are just adding up the cost of
infrastructure in cloud vs. on-premise,
you will miss the value of cloud
About Cloud ROI
5
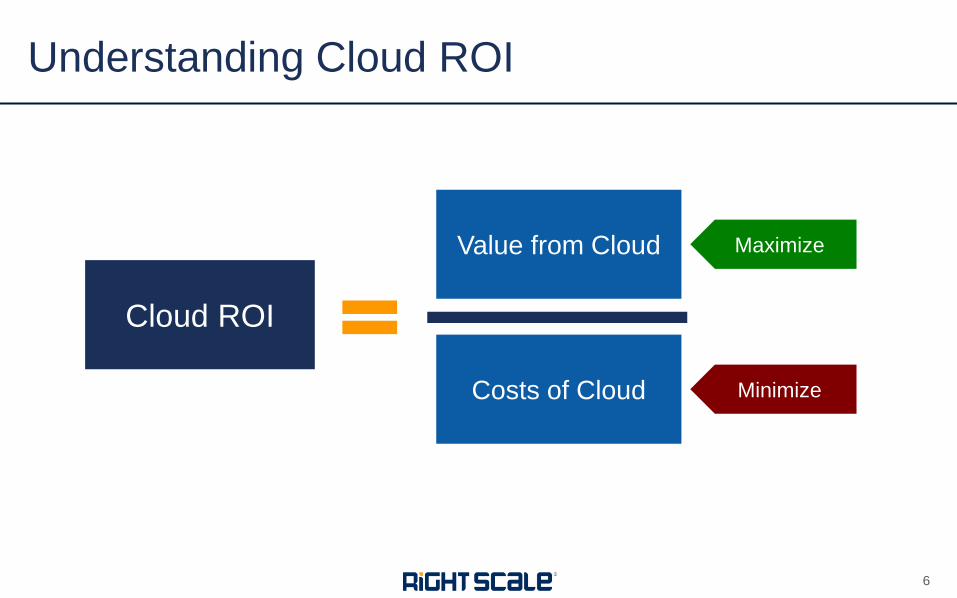
Understanding Cloud ROI
6
Cloud ROI
Value from Cloud
Costs of Cloud
Maximize
Minimize

Your Mileage Will Vary
7
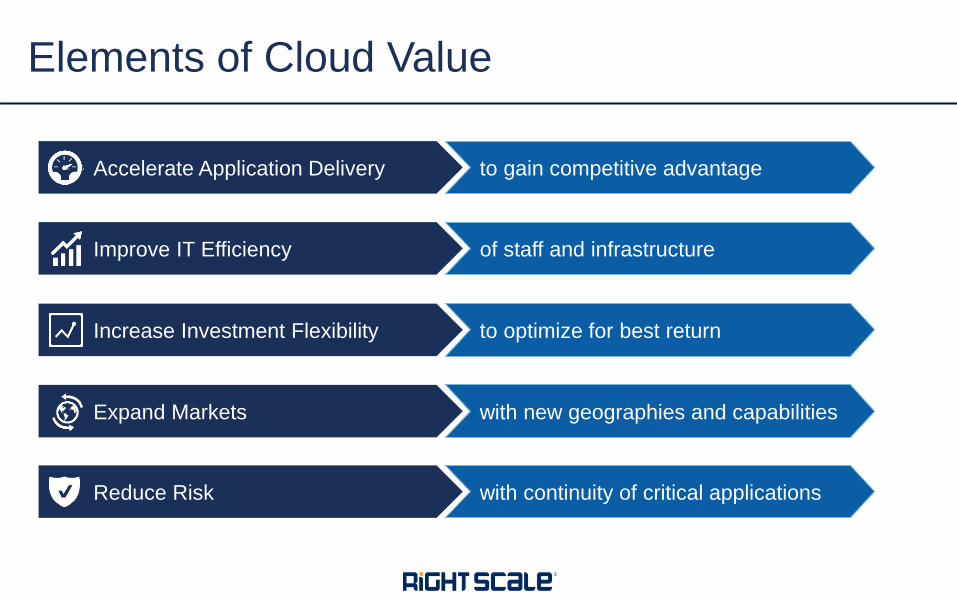
Elements of Cloud Value
to gain competitive advantage Accelerate Application Delivery
of staff and infrastructure Improve IT Efficiency
with new geographies and capabilities Expand Markets
to optimize for best return Increase Investment Flexibility
with continuity of critical applications Reduce Risk

ACCELERATE
APPLICATION DELIVERY
• Everyone is different…
• Three examples…
• Accelerate sales cycle
• Accelerate development cycles
• Accelerate batch processing
Critical Elements to Accelerate Delivery
10
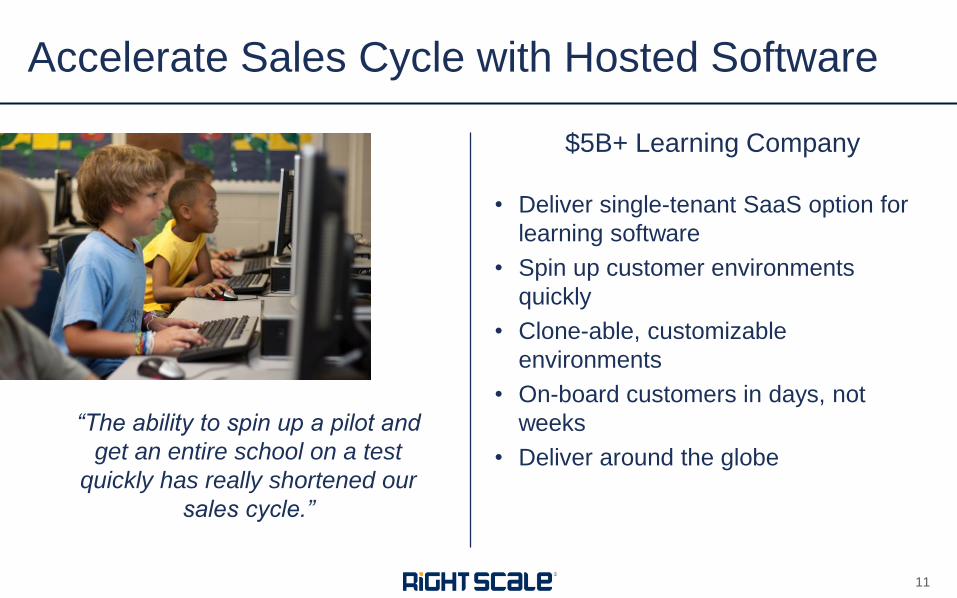
$5B+ Learning Company
• Deliver single-tenant SaaS option for
learning software
• Spin up customer environments
quickly
• Clone-able, customizable
environments
• On-board customers in days, not
weeks
• Deliver around the globe
Accelerate Sales Cycle with Hosted Software
“The ability to spin up a pilot and
get an entire school on a test
quickly has really shortened our
sales cycle.”
11
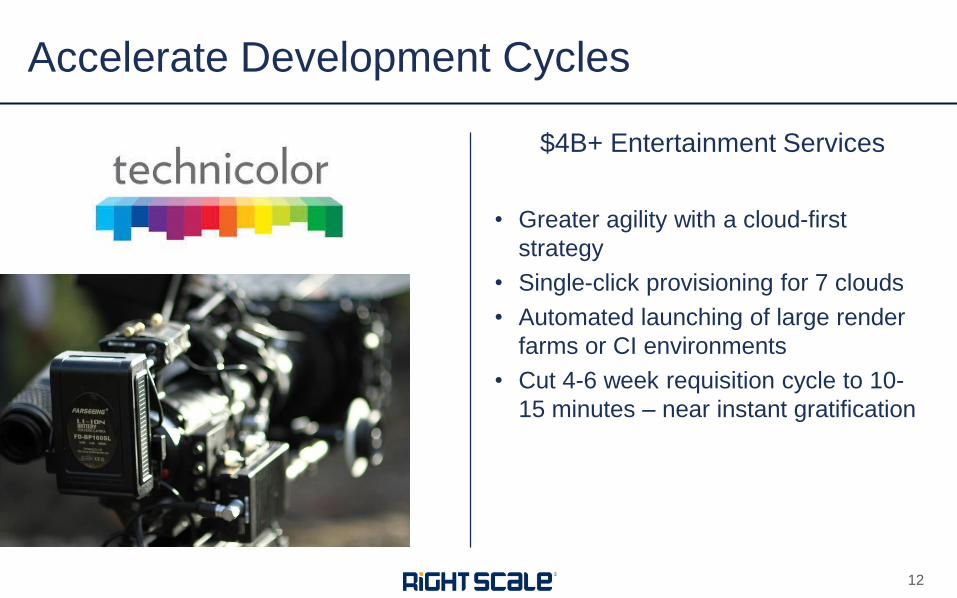
$4B+ Entertainment Services
• Greater agility with a cloud-first
strategy
• Single-click provisioning for 7 clouds
• Automated launching of large render
farms or CI environments
• Cut 4-6 week requisition cycle to 10-
15 minutes – near instant gratification
Accelerate Development Cycles
12
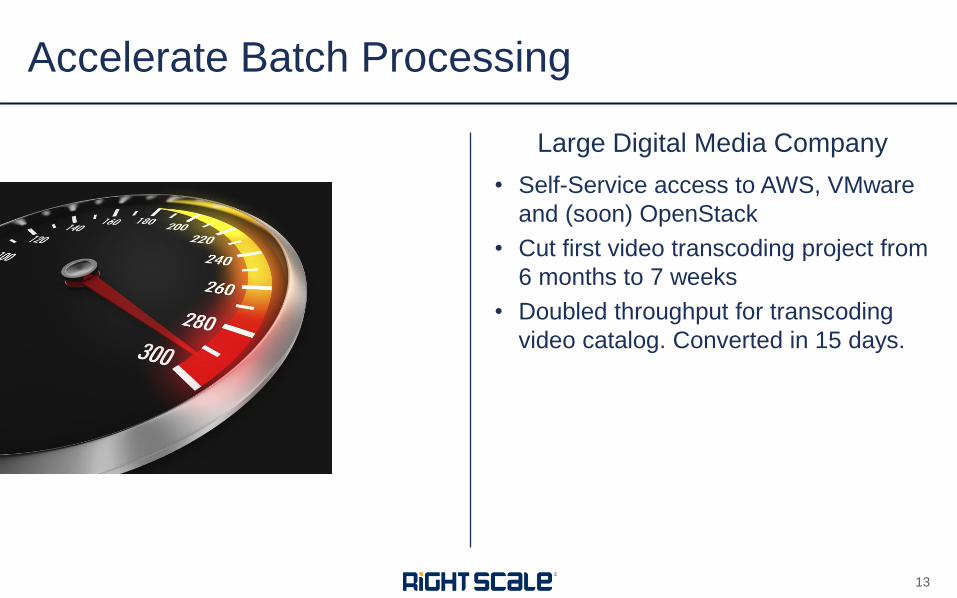
Large Digital Media Company
• Self-Service access to AWS, VMware
and (soon) OpenStack
• Cut first video transcoding project from
6 months to 7 weeks
• Doubled throughput for transcoding
video catalog. Converted in 15 days.
Accelerate Batch Processing
13
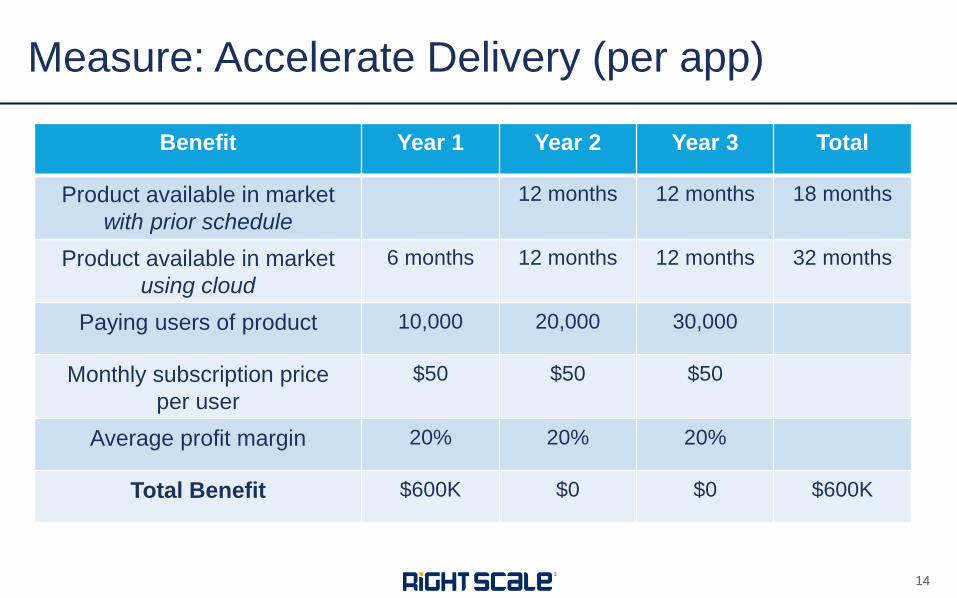
Measure: Accelerate Delivery (per app)
14
Benefit Year 1 Year 2 Year 3 Total
Product available in market
with prior schedule
12 months 12 months 18 months
Product available in market
using cloud
6 months 12 months 12 months 32 months
Paying users of product 10,000 20,000 30,000
Monthly subscription price
per user
$50 $50 $50
Average profit margin 20% 20% 20%
Total Benefit $600K $0 $0 $600K
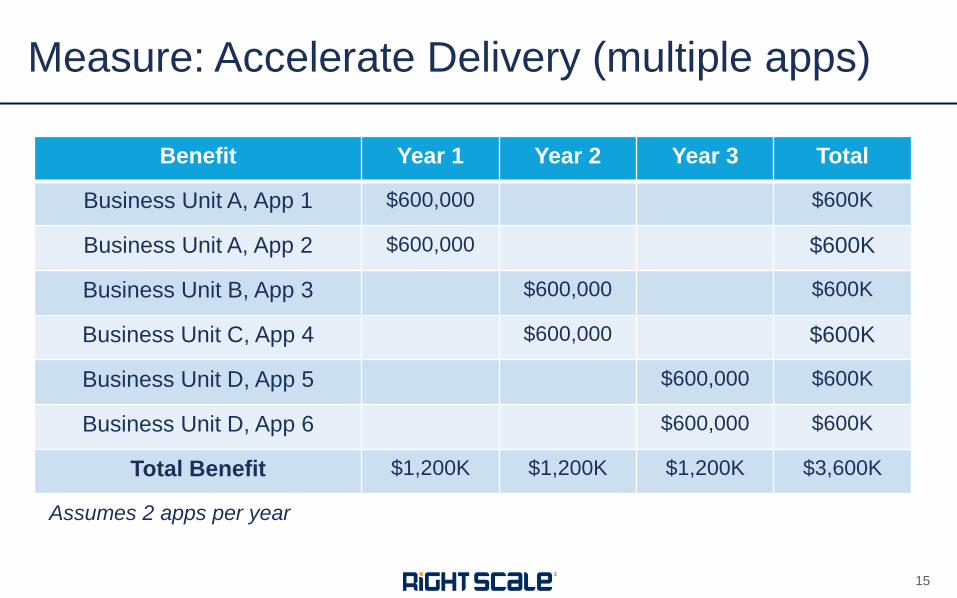
Measure: Accelerate Delivery (multiple apps)
15
Benefit Year 1 Year 2 Year 3 Total
Business Unit A, App 1 $600,000 $600K
Business Unit A, App 2 $600,000 $600K
Business Unit B, App 3 $600,000 $600K
Business Unit C, App 4 $600,000 $600K
Business Unit D, App 5 $600,000 $600K
Business Unit D, App 6 $600,000 $600K
Total Benefit $1,200K $1,200K $1,200K $3,600K
Assumes 2 apps per year
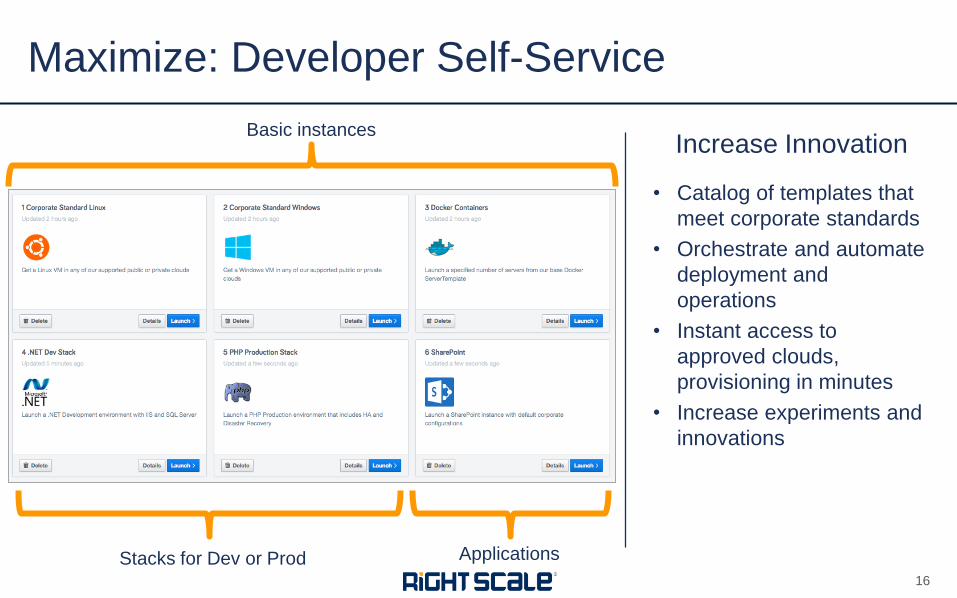
Increase Innovation
• Catalog of templates that
meet corporate standards
• Orchestrate and automate
deployment and
operations
• Instant access to
approved clouds,
provisioning in minutes
• Increase experiments and
innovations
Maximize: Developer Self-Service
16
Basic instances
Stacks for Dev or Prod Applications
RightScale
Right
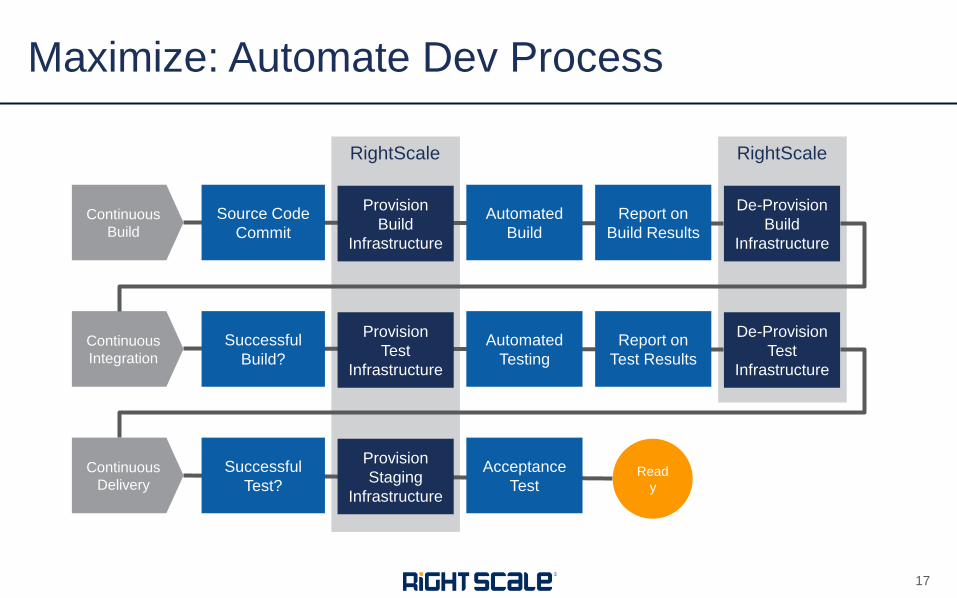
Maximize: Automate Dev Process
17
Continuous
Integration
Successful
Build?
Automated
Testing
Provision
Test
Infrastructure
Report on
Test Results
De-Provision
Test
Infrastructure
Continuous
Delivery
Successful
Test?
Acceptance
Test
Provision
Staging
Infrastructure
Read
y
Continuous
Build
Source Code
Commit
Automated
Build
Provision
Build
Infrastructure
Report on
Build Results
De-Provision
Build
Infrastructure
RightScale
INCREASE EFFICIENCY
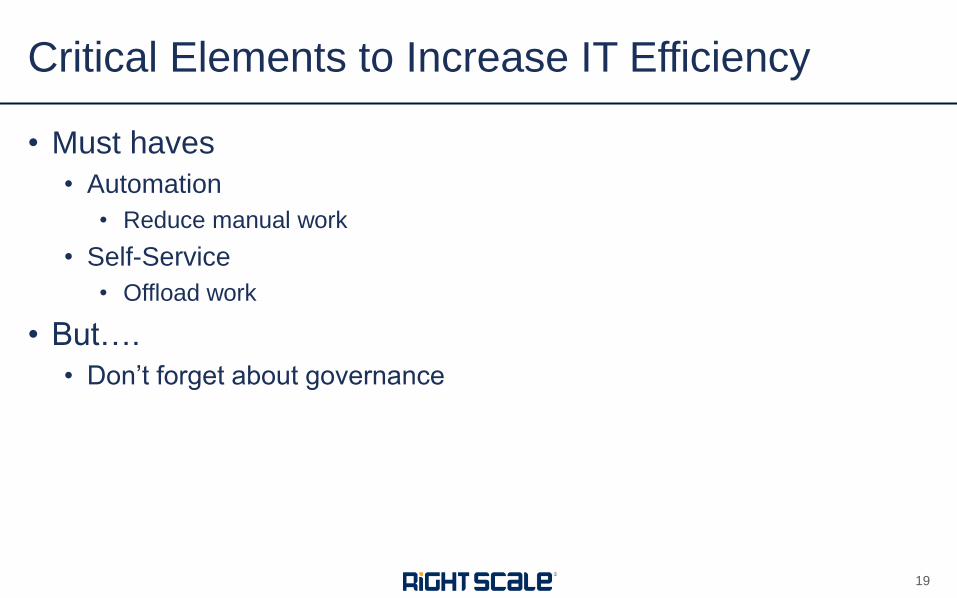
• Must haves
• Automation
• Reduce manual work
• Self-Service
• Offload work
• But….
• Don’t forget about governance
Critical Elements to Increase IT Efficiency
19
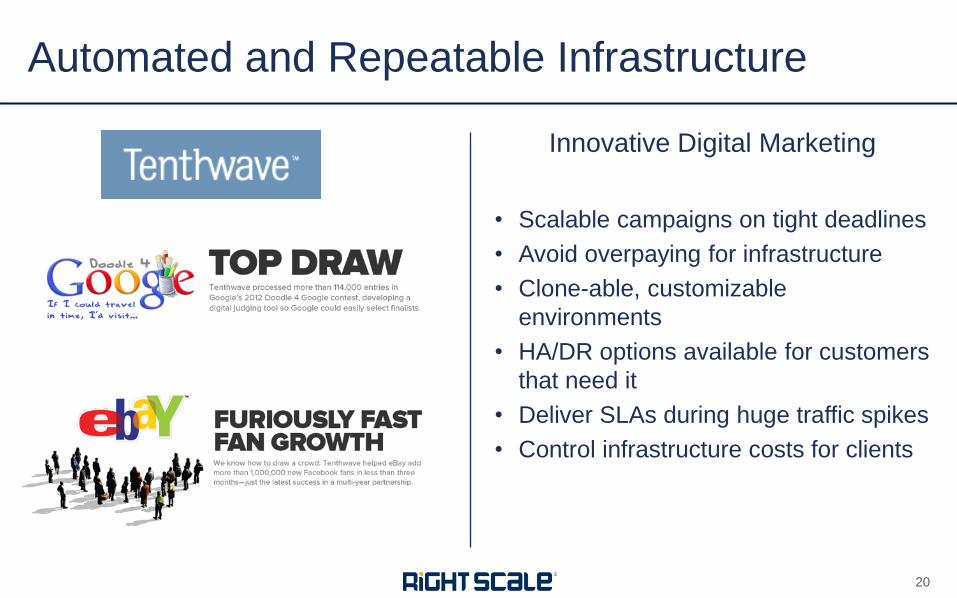
Innovative Digital Marketing
• Scalable campaigns on tight deadlines
• Avoid overpaying for infrastructure
• Clone-able, customizable
environments
• HA/DR options available for customers
that need it
• Deliver SLAs during huge traffic spikes
• Control infrastructure costs for clients
Automated and Repeatable Infrastructure
20
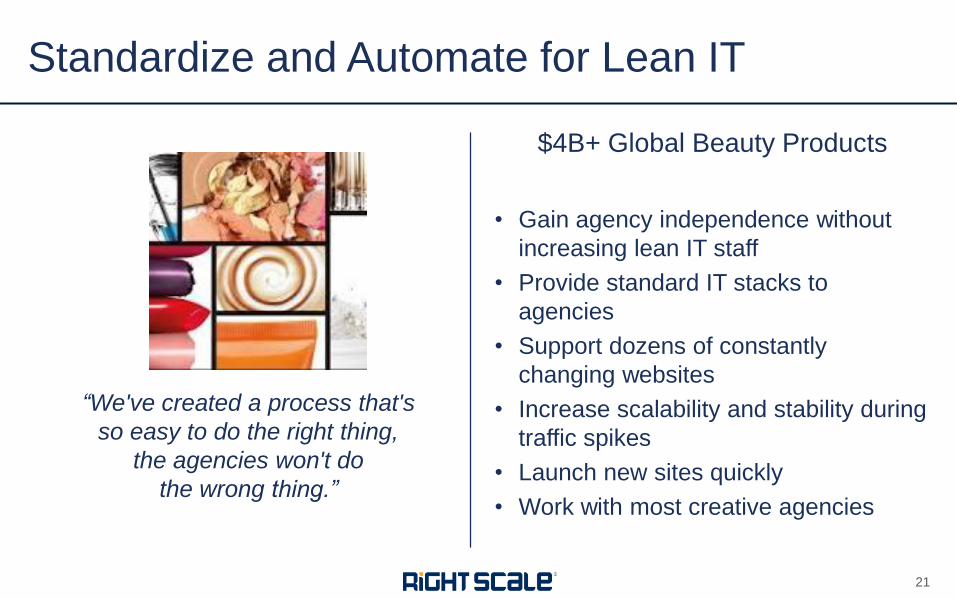
$4B+ Global Beauty Products
• Gain agency independence without
increasing lean IT staff
• Provide standard IT stacks to
agencies
• Support dozens of constantly
changing websites
• Increase scalability and stability during
traffic spikes
• Launch new sites quickly
• Work with most creative agencies
Standardize and Automate for Lean IT
“We've created a process that's
so easy to do the right thing,
the agencies won't do
the wrong thing.”
21
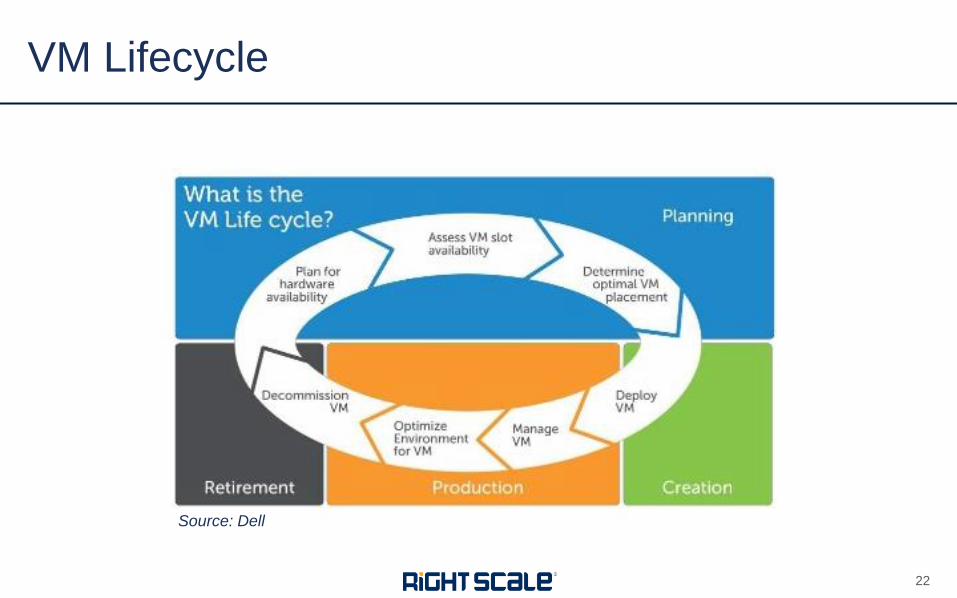
VM Lifecycle
22
Source: Dell
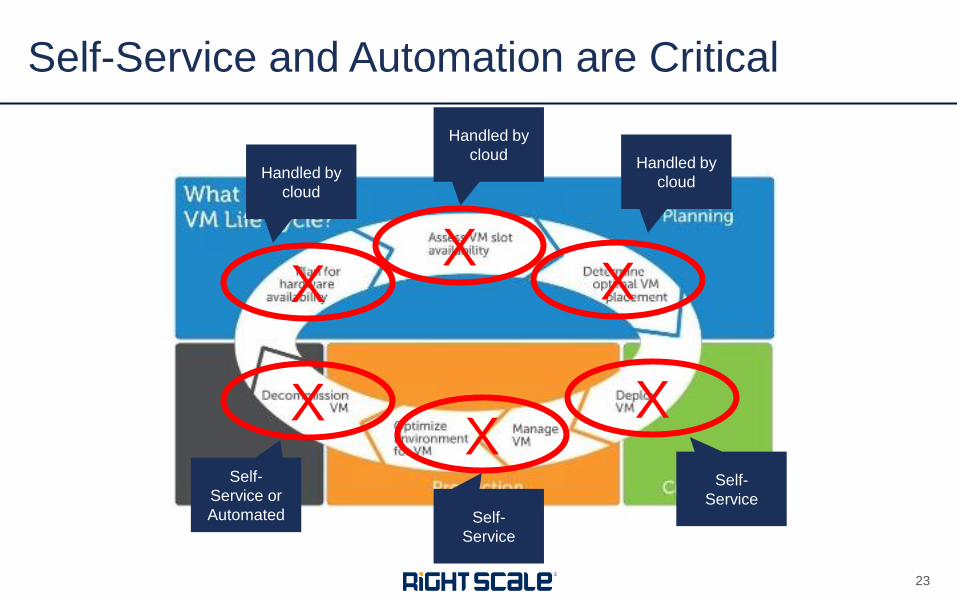
Self-Service and Automation are Critical
23
X X
X
X X
X
Handled by
cloud
Handled by
cloud Handled by
cloud
Self-
Service Self-
Service
Self-
Service or
Automated
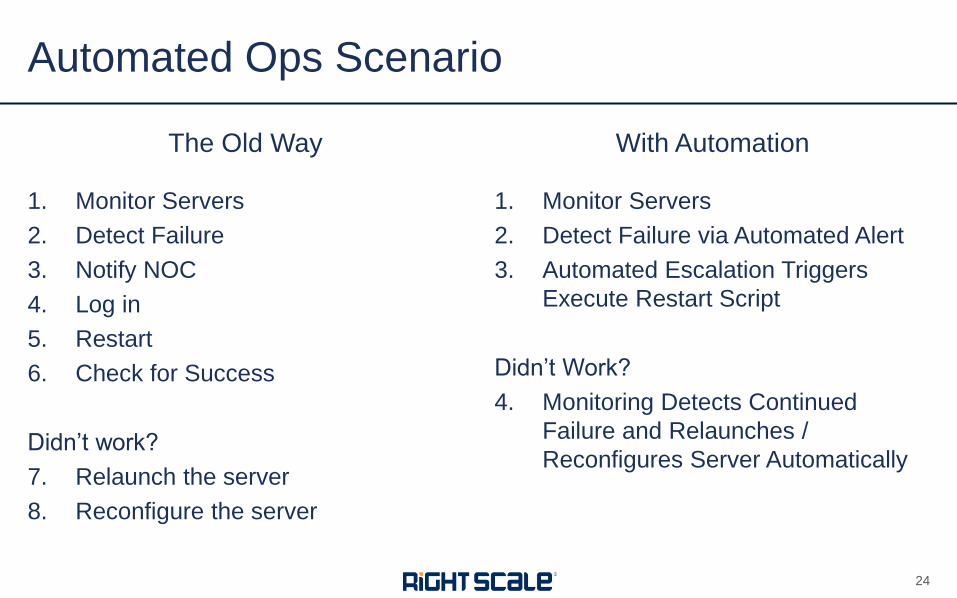
1. Monitor Servers
2. Detect Failure
3. Notify NOC
4. Log in
5. Restart
6. Check for Success
Didn’t work?
7. Relaunch the server
8. Reconfigure the server
The Old Way With Automation
1. Monitor Servers
2. Detect Failure via Automated Alert
3. Automated Escalation Triggers
Execute Restart Script
Didn’t Work?
4. Monitoring Detects Continued
Failure and Relaunches /
Reconfigures Server Automatically
Automated Ops Scenario
24
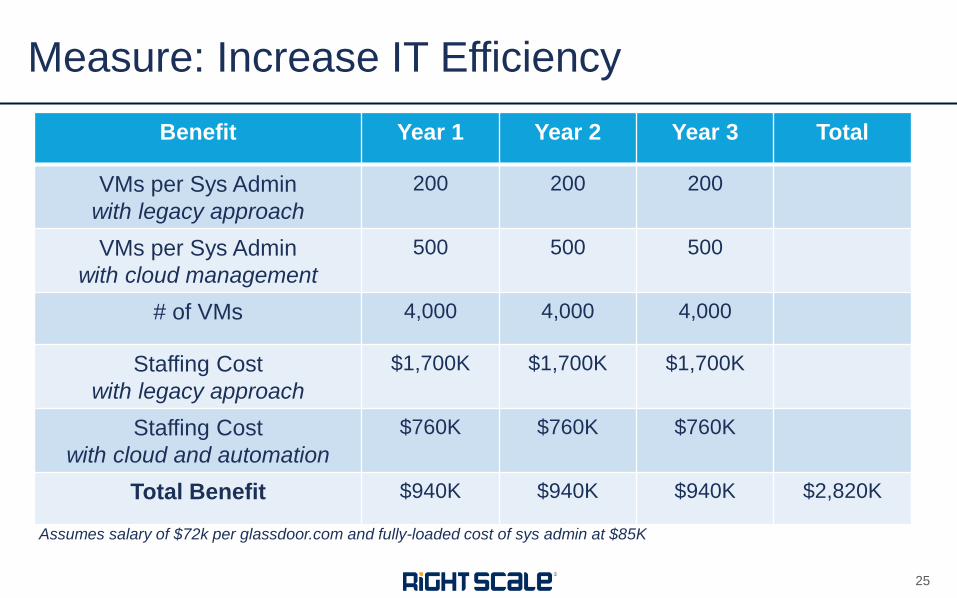
Measure: Increase IT Efficiency
25
Benefit Year 1 Year 2 Year 3 Total
VMs per Sys Admin
with legacy approach
200 200 200
VMs per Sys Admin
with cloud management
500 500 500
# of VMs 4,000 4,000 4,000
Staffing Cost
with legacy approach
$1,700K $1,700K $1,700K
Staffing Cost
with cloud and automation
$760K $760K
$760K
Total Benefit $940K $940K $940K $2,820K
Assumes salary of $72k per glassdoor.com and fully-loaded cost of sys admin at $85K
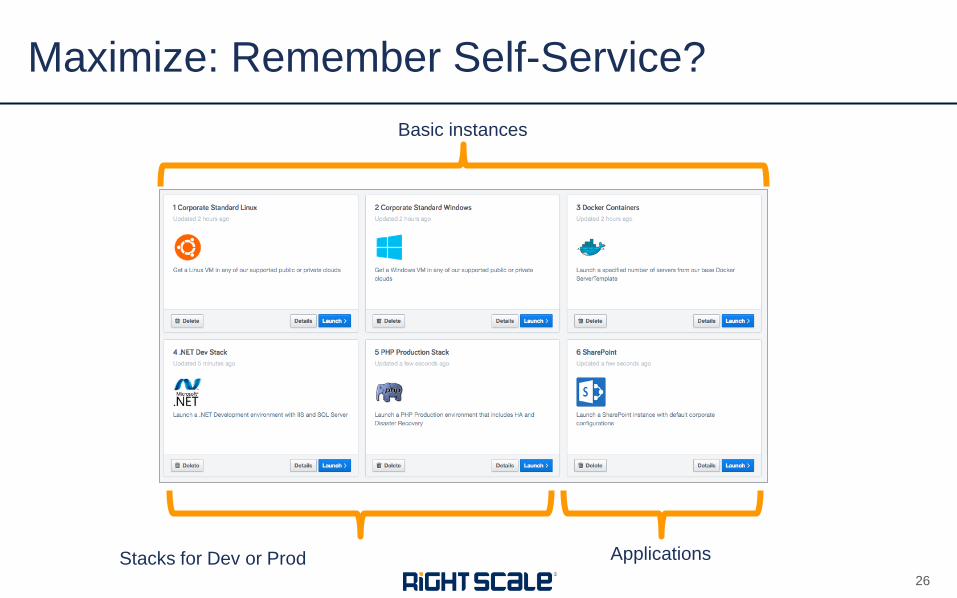
Maximize: Remember Self-Service?
26
Basic instances
Stacks for Dev or Prod Applications
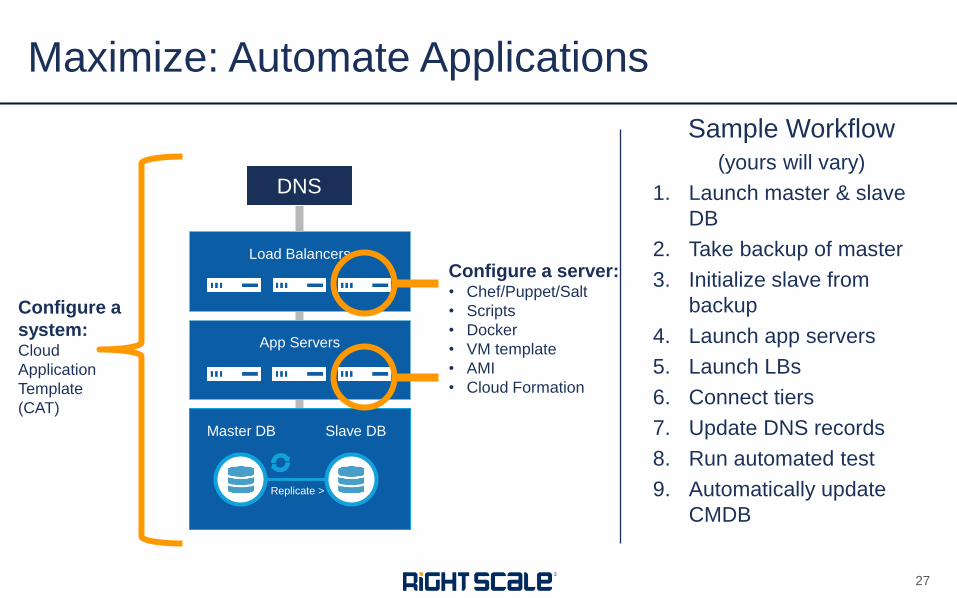
Sample Workflow
(yours will vary)
1. Launch master & slave
DB
2. Take backup of master
3. Initialize slave from
backup
4. Launch app servers
5. Launch LBs
6. Connect tiers
7. Update DNS records
8. Run automated test
9. Automatically update
CMDB
Maximize: Automate Applications
27
Load Balancers
App Servers
Master DB Slave DB
Replicate >
DNS
Configure a
system: Cloud
Application
Template
(CAT)
Configure a server: • Chef/Puppet/Salt
• Scripts
• Docker
• VM template
• AMI
• Cloud Formation

FLEXIBILITY
• Reduce Excess Capacity (pay for what you use)
• Preserve ability to change your cloud provider
• Adjust to longer-term business shifts – Zynga example
Elements of Investment Flexibility
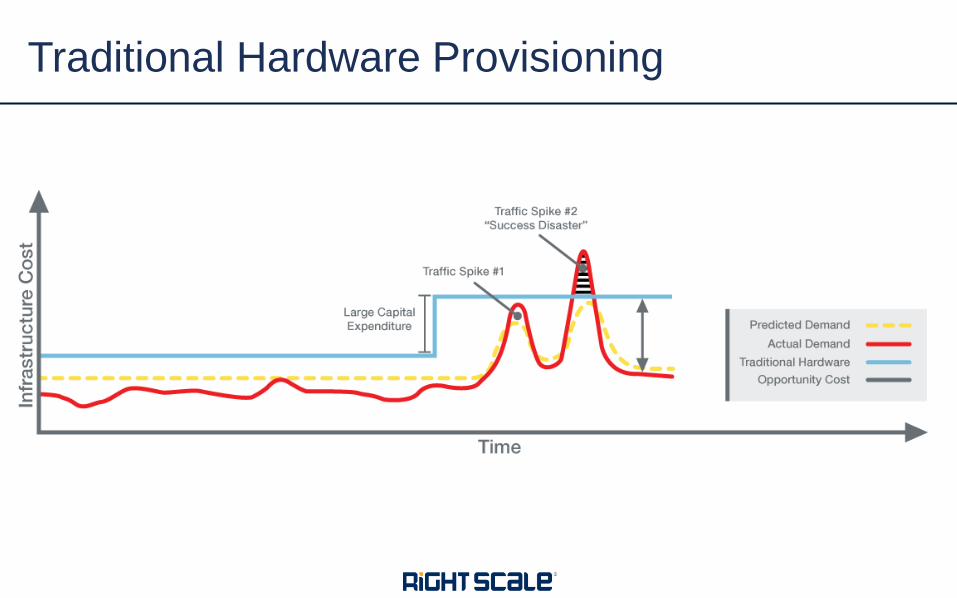
Traditional Hardware Provisioning
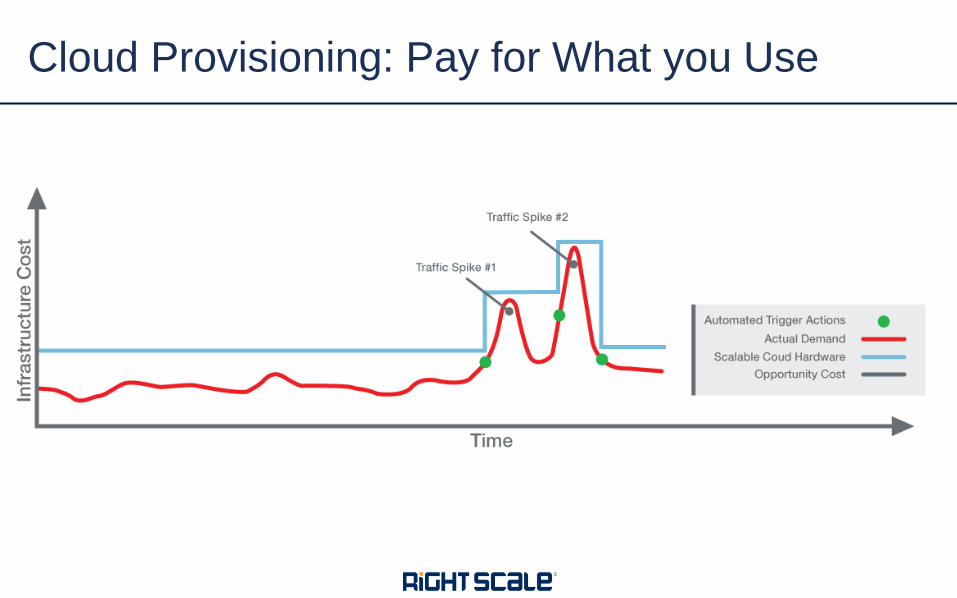
Cloud Provisioning: Pay for What you Use
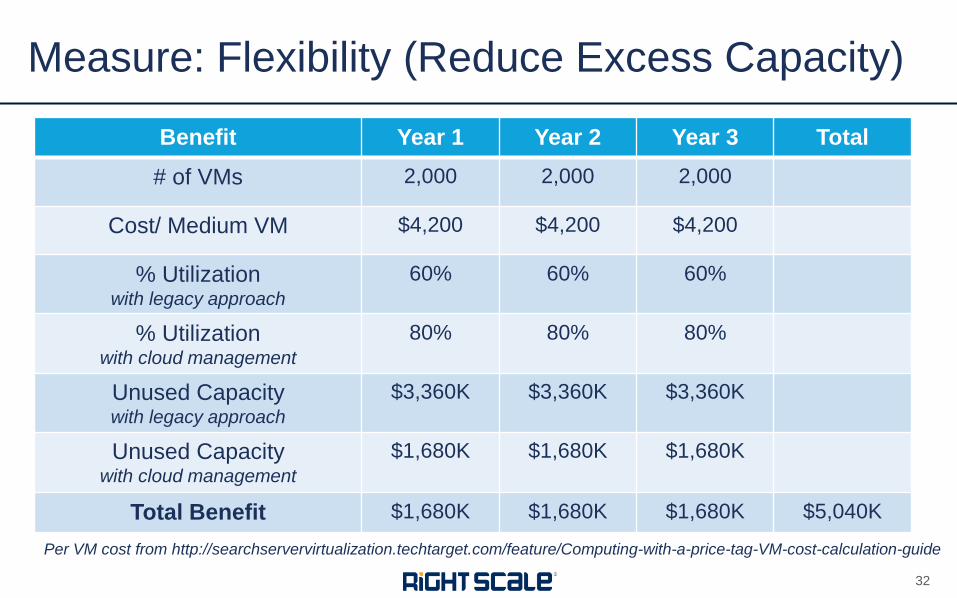
Measure: Flexibility (Reduce Excess Capacity)
32
Benefit Year 1 Year 2 Year 3 Total
# of VMs 2,000 2,000 2,000
Cost/ Medium VM $4,200 $4,200 $4,200
% Utilization with legacy approach
60% 60% 60%
% Utilization with cloud management
80% 80% 80%
Unused Capacity with legacy approach
$3,360K $3,360K $3,360K
Unused Capacity with cloud management
$1,680K $1,680K
$1,680K
Total Benefit $1,680K $1,680K $1,680K $5,040K
Per VM cost from http://searchservervirtualization.techtarget.com/feature/Computing-with-a-price-tag-VM-cost-calculation-guide
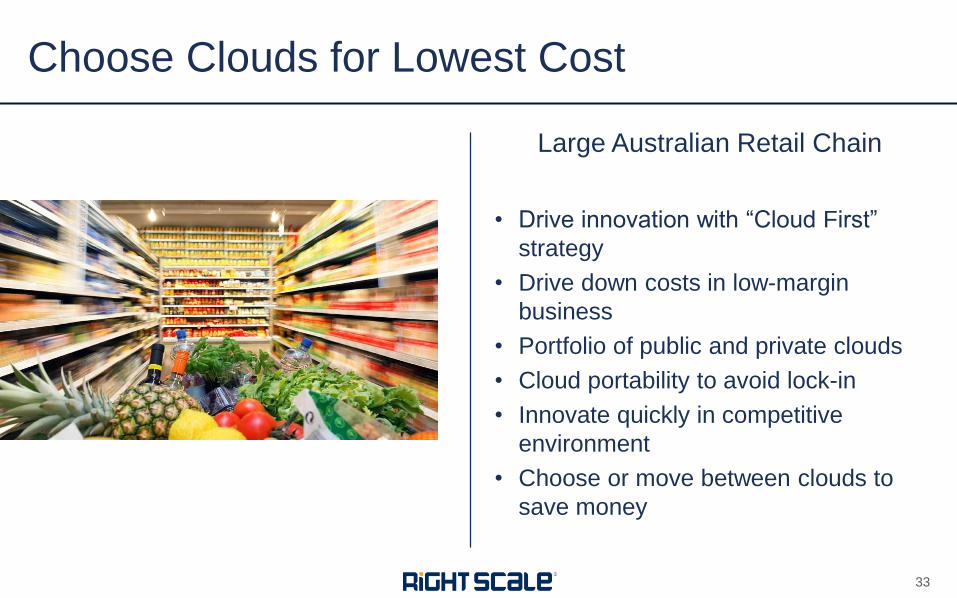
Large Australian Retail Chain
• Drive innovation with “Cloud First”
strategy
• Drive down costs in low-margin
business
• Portfolio of public and private clouds
• Cloud portability to avoid lock-in
• Innovate quickly in competitive
environment
• Choose or move between clouds to
save money
Choose Clouds for Lowest Cost
33
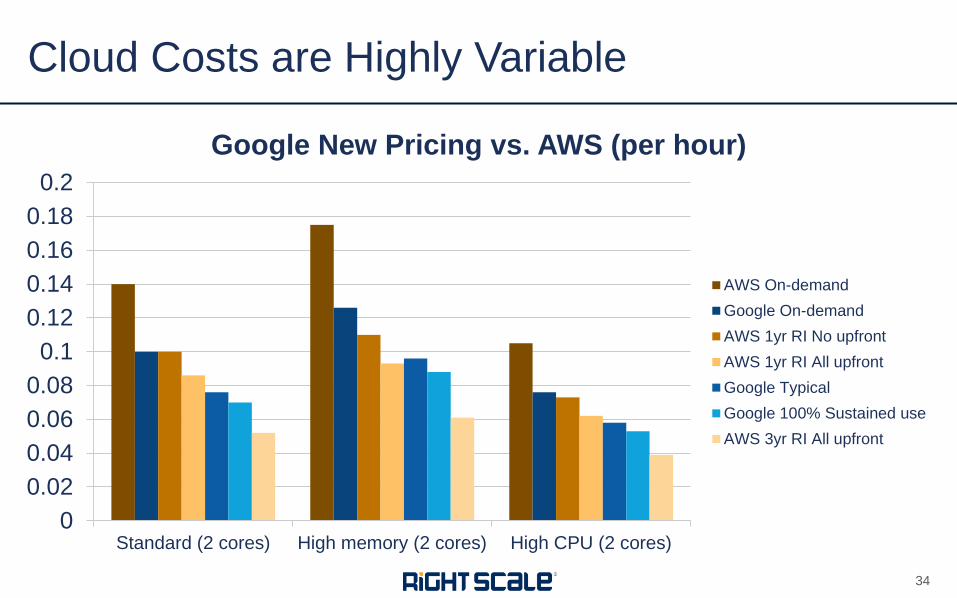
0
0.02
0.04
0.06
0.08
0.1
0.12
0.14
0.16
0.18
0.2
Standard (2 cores) High memory (2 cores) High CPU (2 cores)
Google New Pricing vs. AWS (per hour)
AWS On-demand
Google On-demand
AWS 1yr RI No upfront
AWS 1yr RI All upfront
Google Typical
Google 100% Sustained use
AWS 3yr RI All upfront
Cloud Costs are Highly Variable
34
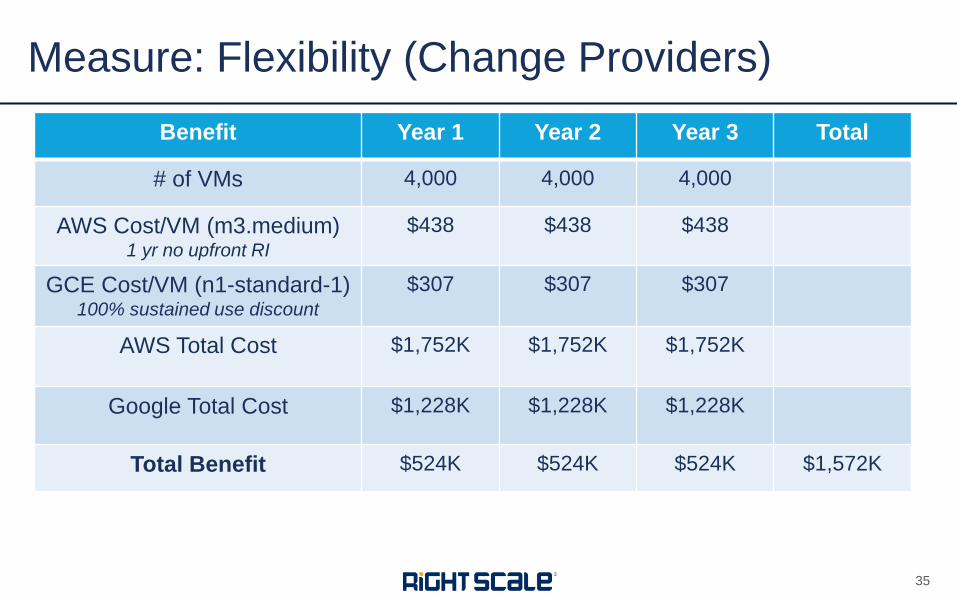
Measure: Flexibility (Change Providers)
35
Benefit Year 1 Year 2 Year 3 Total
# of VMs 4,000 4,000 4,000
AWS Cost/VM (m3.medium) 1 yr no upfront RI
$438 $438 $438
GCE Cost/VM (n1-standard-1) 100% sustained use discount
$307 $307
$307
AWS Total Cost $1,752K $1,752K
$1,752K
Google Total Cost $1,228K $1,228K $1,228K
Total Benefit $524K $524K $524K $1,572K
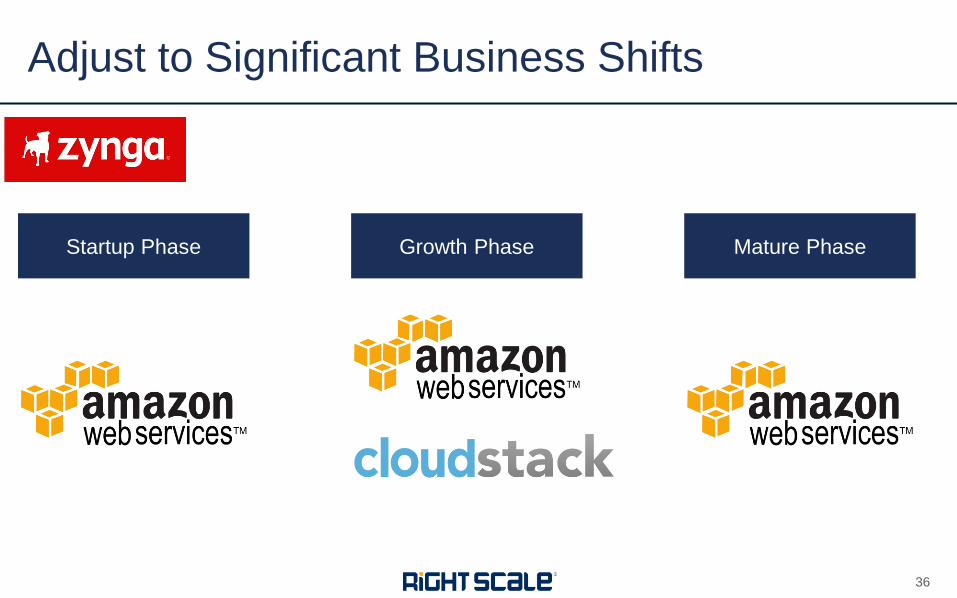
Adjust to Significant Business Shifts
36
Startup Phase Growth Phase Mature Phase
• New products and services
• Discontinue or ramp down services
• New geographies and markets
• Acquisition
• Divestment
• Strategy changes
• …and more
What Business Shifts Will Affect You?
37
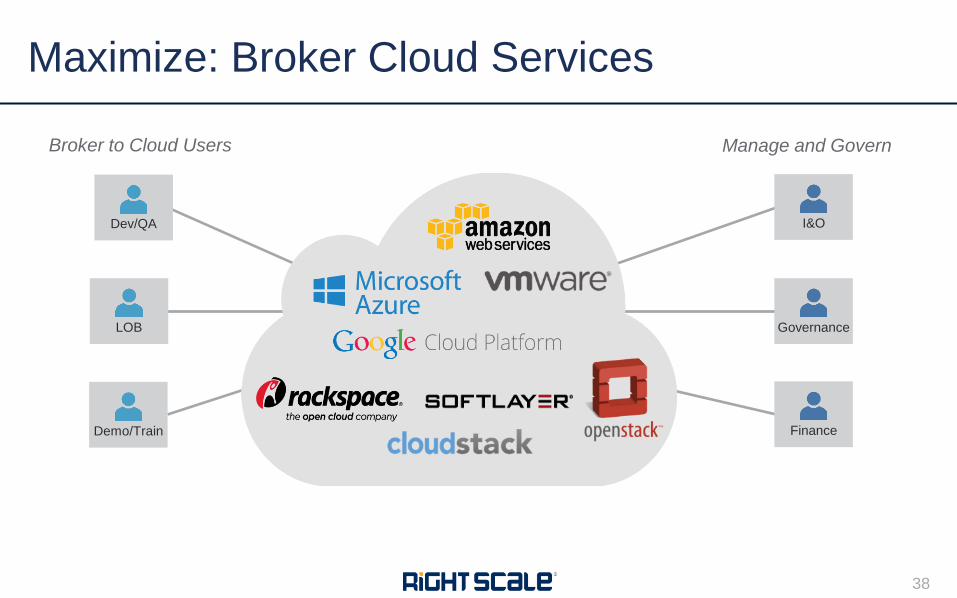
Maximize: Broker Cloud Services
Broker to Cloud Users Manage and Govern
Demo/Train
Dev/QA
LOB
Finance
I&O
Governance
38
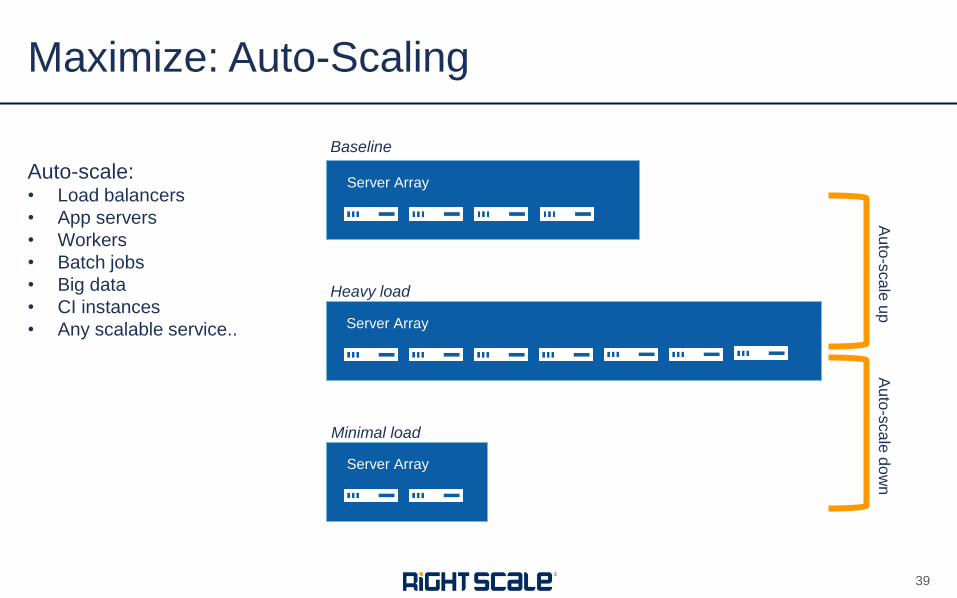
Maximize: Auto-Scaling
39
Server Array
Server Array
Server Array
Auto-scale: • Load balancers
• App servers
• Workers
• Batch jobs
• Big data
• CI instances
• Any scalable service..
Baseline
Heavy load
Minimal load
Au
to-s
ca
le u
p
Au
to-s
ca
le d
ow
n
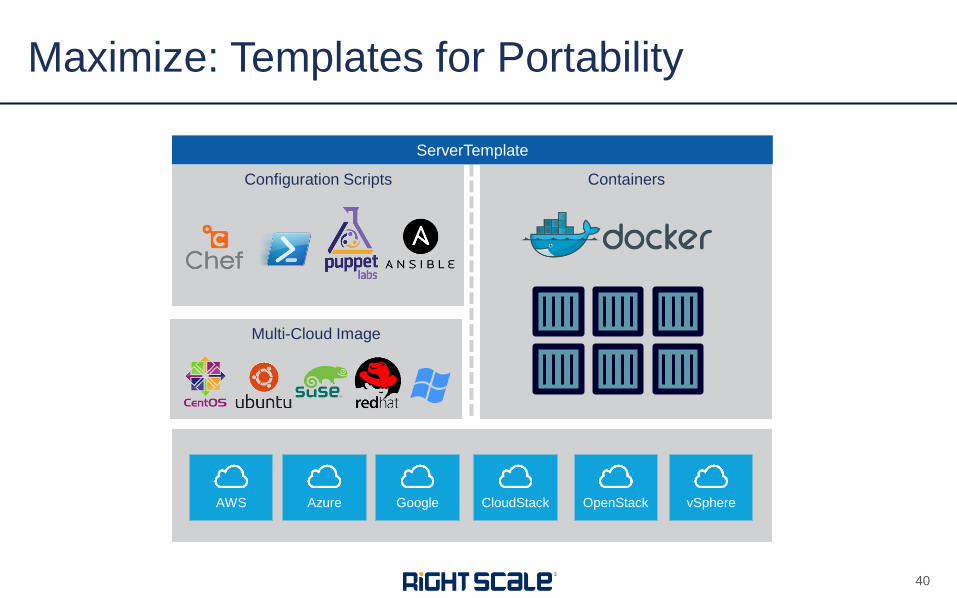
Maximize: Templates for Portability
40
AWS Azure Google CloudStack OpenStack vSphere
Multi-Cloud Image
Configuration Scripts Containers
ServerTemplate
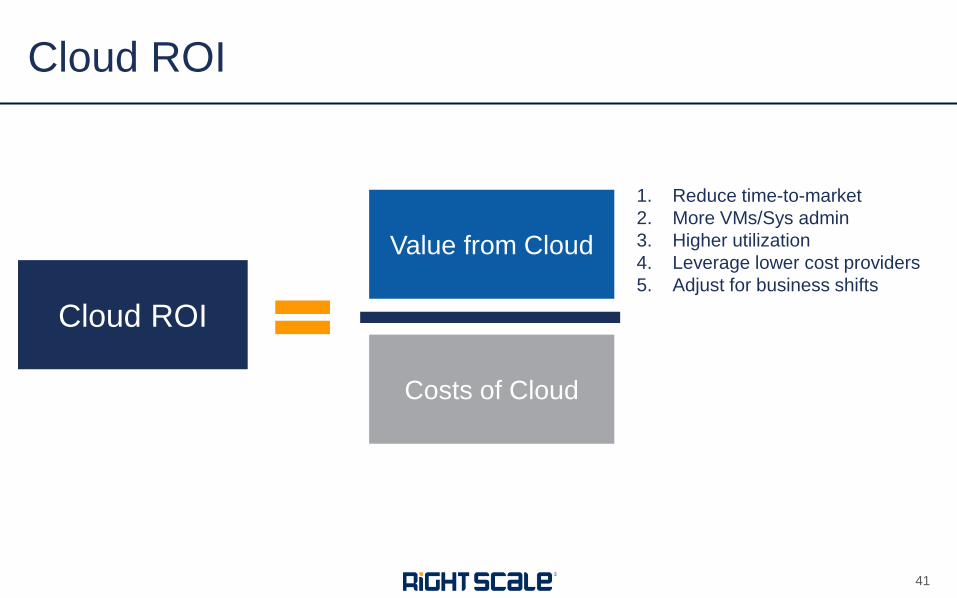
Cloud ROI
41
Cloud ROI
Value from Cloud
Costs of Cloud
1. Reduce time-to-market
2. More VMs/Sys admin
3. Higher utilization
4. Leverage lower cost providers
5. Adjust for business shifts

REDUCE WASTE
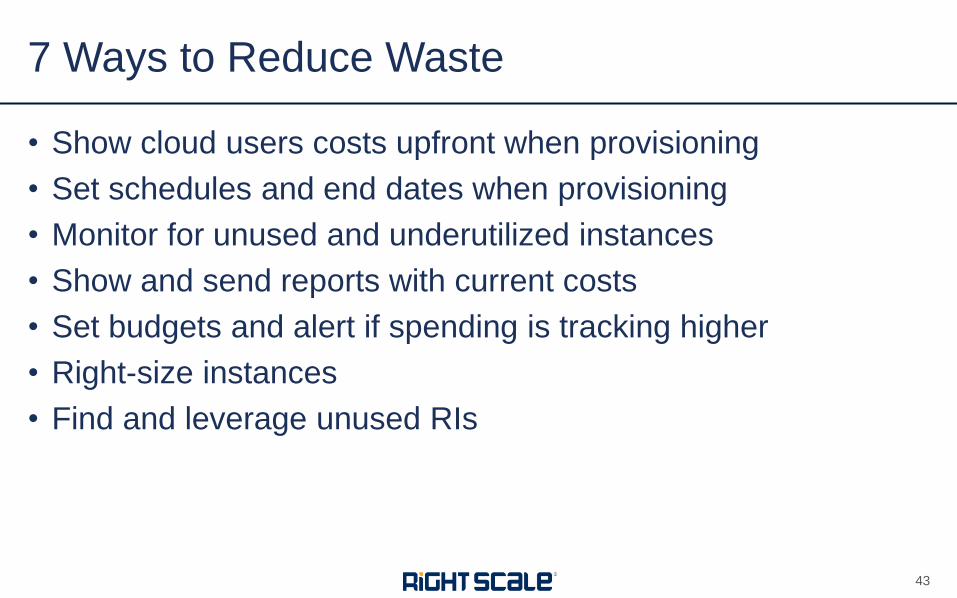
• Show cloud users costs upfront when provisioning
• Set schedules and end dates when provisioning
• Monitor for unused and underutilized instances
• Show and send reports with current costs
• Set budgets and alert if spending is tracking higher
• Right-size instances
• Find and leverage unused RIs
7 Ways to Reduce Waste
43
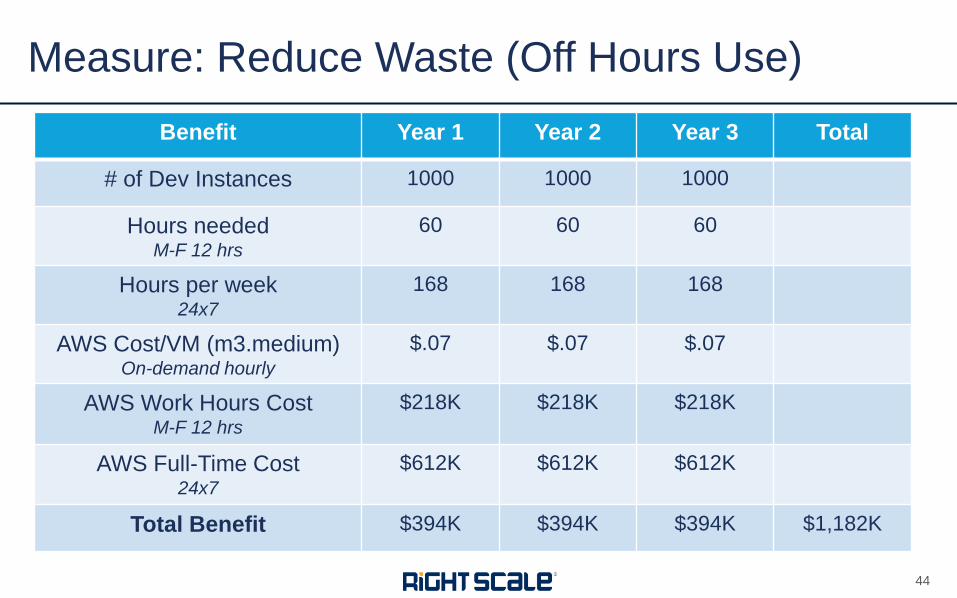
Measure: Reduce Waste (Off Hours Use)
44
Benefit Year 1 Year 2 Year 3 Total
# of Dev Instances 1000 1000 1000
Hours needed M-F 12 hrs
60 60 60
Hours per week 24x7
168 168 168
AWS Cost/VM (m3.medium) On-demand hourly
$.07 $.07 $.07
AWS Work Hours Cost M-F 12 hrs
$218K $218K
$218K
AWS Full-Time Cost 24x7
$612K $612K
$612K
Total Benefit $394K $394K $394K $1,182K
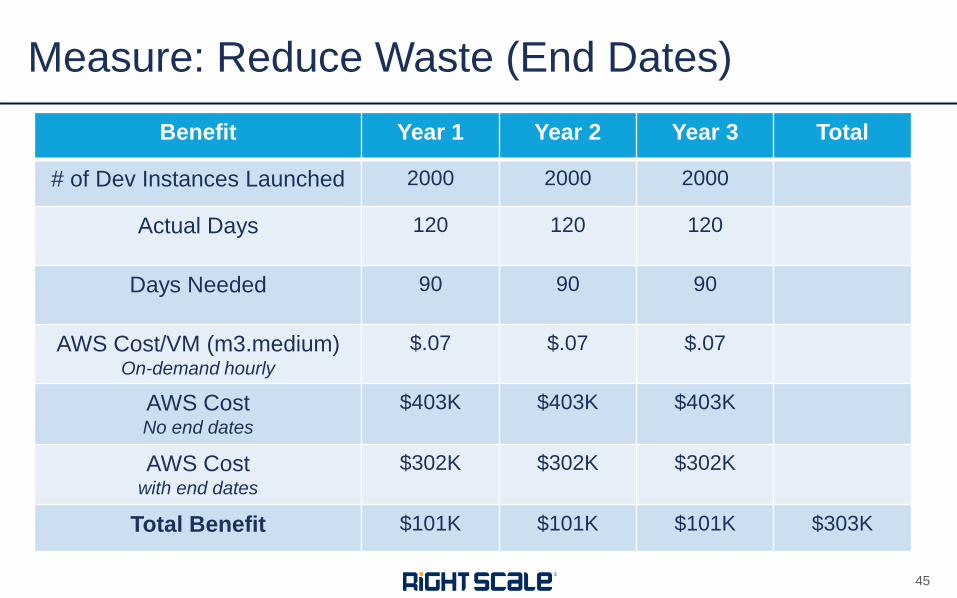
Measure: Reduce Waste (End Dates)
45
Benefit Year 1 Year 2 Year 3 Total
# of Dev Instances Launched 2000 2000 2000
Actual Days
120 120 120
Days Needed
90 90 90
AWS Cost/VM (m3.medium) On-demand hourly
$.07 $.07 $.07
AWS Cost No end dates
$403K $403K
$403K
AWS Cost with end dates
$302K $302K
$302K
Total Benefit $101K $101K $101K $303K
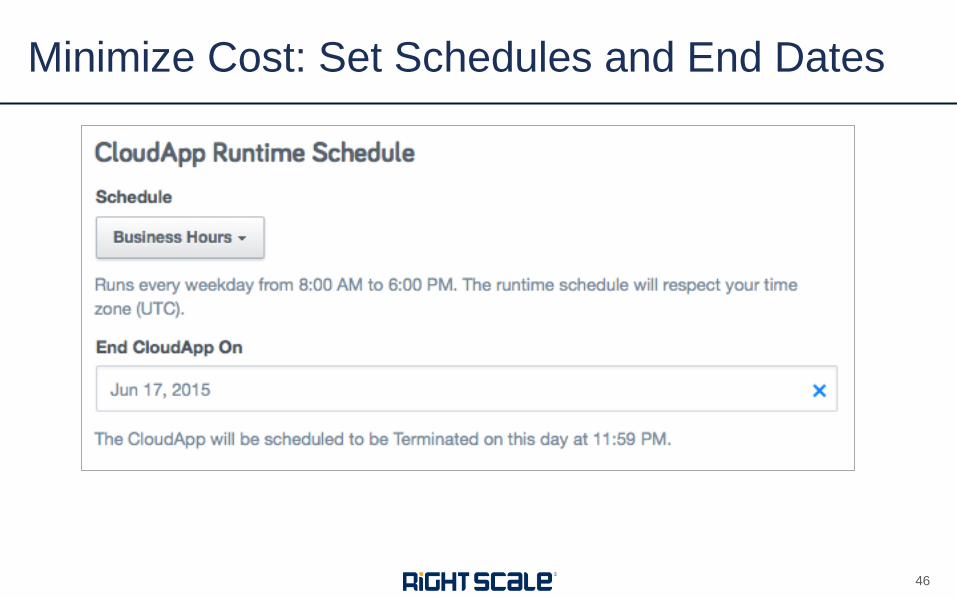
Minimize Cost: Set Schedules and End Dates
46
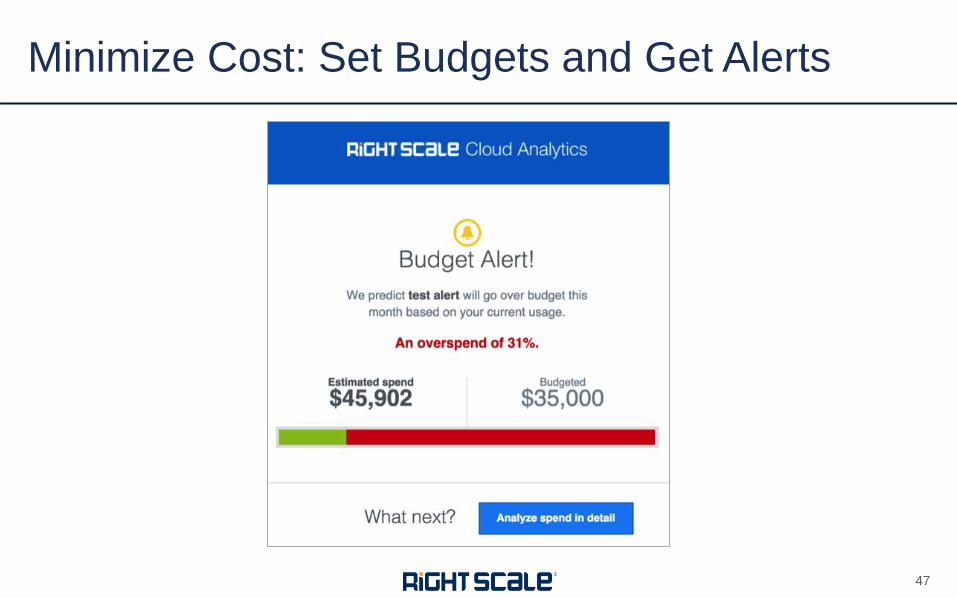
Minimize Cost: Set Budgets and Get Alerts
47
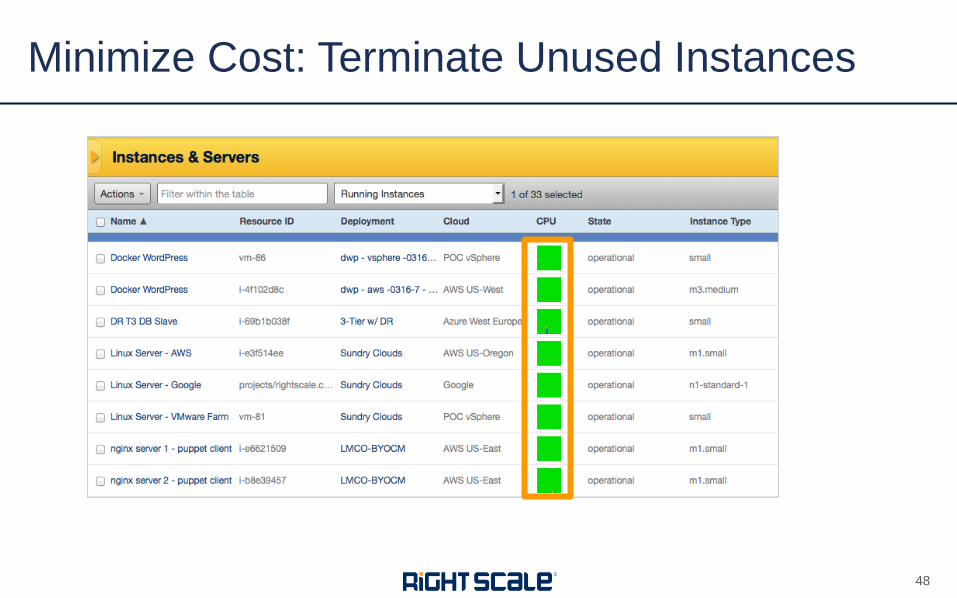
Minimize Cost: Terminate Unused Instances
48
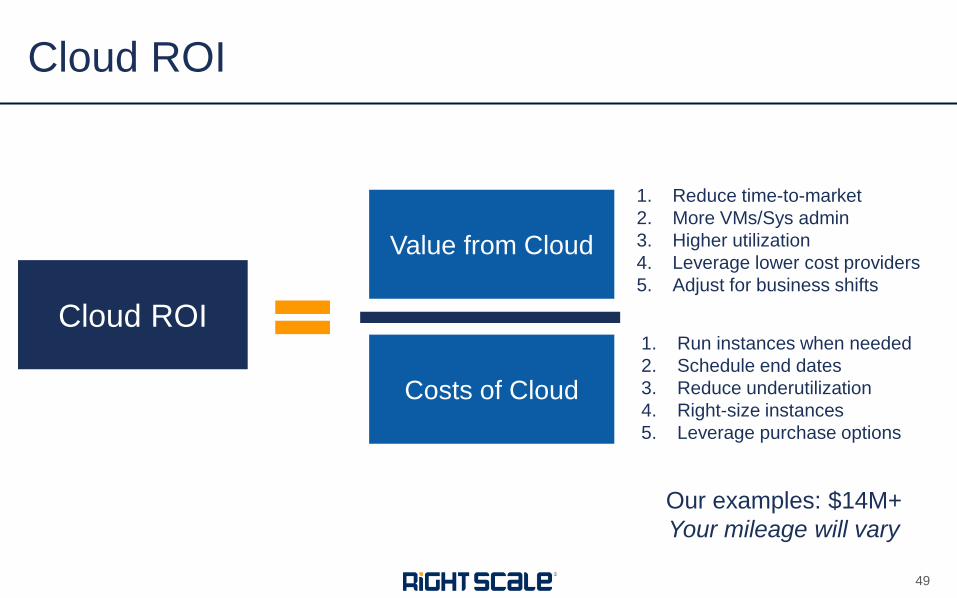
Cloud ROI
49
Cloud ROI
Value from Cloud
Costs of Cloud
1. Reduce time-to-market
2. More VMs/Sys admin
3. Higher utilization
4. Leverage lower cost providers
5. Adjust for business shifts
1. Run instances when needed
2. Schedule end dates
3. Reduce underutilization
4. Right-size instances
5. Leverage purchase options
Our examples: $14M+
Your mileage will vary
• Download link for ROI calculator spreadsheet
• www.rightscale.com/cloud-roi-calculator
Q&A
50